Embed Size (px)
DESCRIPTION
Chapter 2: Spatial Concepts and Data Models 2.1 Introduction 2.2 Models of Spatial Information 2.3 Three-Step Database Design 2.4 Extending ER with Spatial Concepts 2.5 Summary. Learning Objectives. Learning Objectives (LO) LO1: Understand concept of data models What is a data model? - PowerPoint PPT Presentation
Citation preview
Chapter 2: Spatial Concepts and Data Models
2.1 Introduction2.2 Models of Spatial Information2.3 Three-Step Database Design2.4 Extending ER with Spatial Concepts2.5 Summary
Learning Objectives
Learning Objectives (LO)LO1: Understand concept of data models
• What is a data model?• Why use data models?
LO2 : Understand the models of spatial informationLO3: Understand the 3-step design of databasesLO4: Learn about the trends in spatial data models
Mapping Sections to learning objectivesLO2 - 2.1LO3 - 2.2LO4 - 2.3, 2.4
What is a Data Model?•What is a model? (Dictionary meaning)
• A set of plans (blueprint drawing) for a building•A miniature representation of a system to analyze properties of interest
•What is Data Model?• Specify structure or schema of a data set•Document description of data
•Facilitates early analysis of some properties, e.g. querying ability, redundancy, consistency, storage space requirements, etc.
• Examples:•GIS organize spatial set as a set of layers•Databases organize dataset as a collection of tables
Why Data Models?• Data models facilitate
• Early analysis of properties, e.g. storage cost, querying ability, ...• Reuse of shared data among multiple applications• Exchange of data across organization• Conversion of data to new software / environment
• Example- Y2K crisis for year 2000Many computer software systems were developed without well-defined data models in 1960s and 1970s. These systems used a variety of data models for representing time and date. Some of the representations used two digits to represent years. In late 1990s, people worried that the 2 digit representation of year may lead to errorneous behaviour. For example age of a person born in 1960 (represented as 60) in year 2000 (represented as 00) may appear negative and may be flagged as illegal data item. A large amount of effort and resources (hundreds of Billions of dollars) was spent in revising the software.
Proper use of data model may have significantly reduced the costs. If time and date were modeled as abstract data types in a software, only a small portion of the software implementing the date ADT had to be reviewed and revised.
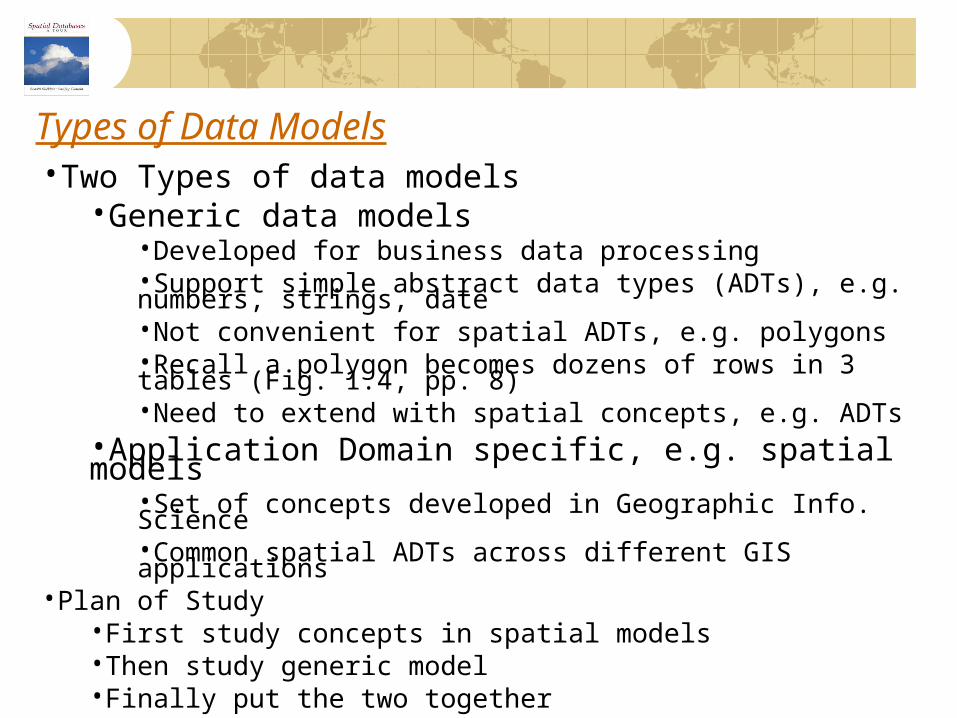
Types of Data Models•Two Types of data models
•Generic data models•Developed for business data processing•Support simple abstract data types (ADTs), e.g. numbers, strings, date•Not convenient for spatial ADTs, e.g. polygons•Recall a polygon becomes dozens of rows in 3 tables (Fig. 1.4, pp. 8)•Need to extend with spatial concepts, e.g. ADTs
•Application Domain specific, e.g. spatial models•Set of concepts developed in Geographic Info. Science•Common spatial ADTs across different GIS applications
•Plan of Study•First study concepts in spatial models•Then study generic model•Finally put the two together
Learning Objectives
Learning Objectives (LO)LO1: Understand concept of data modelsLO2 : Understand the models of spatial information
• Field based model• Object based model
LO3: Understand the 3-step design of databasesLO4: Learn about the trends in spatial data models
Mapping Sections to learning objectivesLO2 - 2.1LO3 - 2.2LO4 - 2.3, 2.4
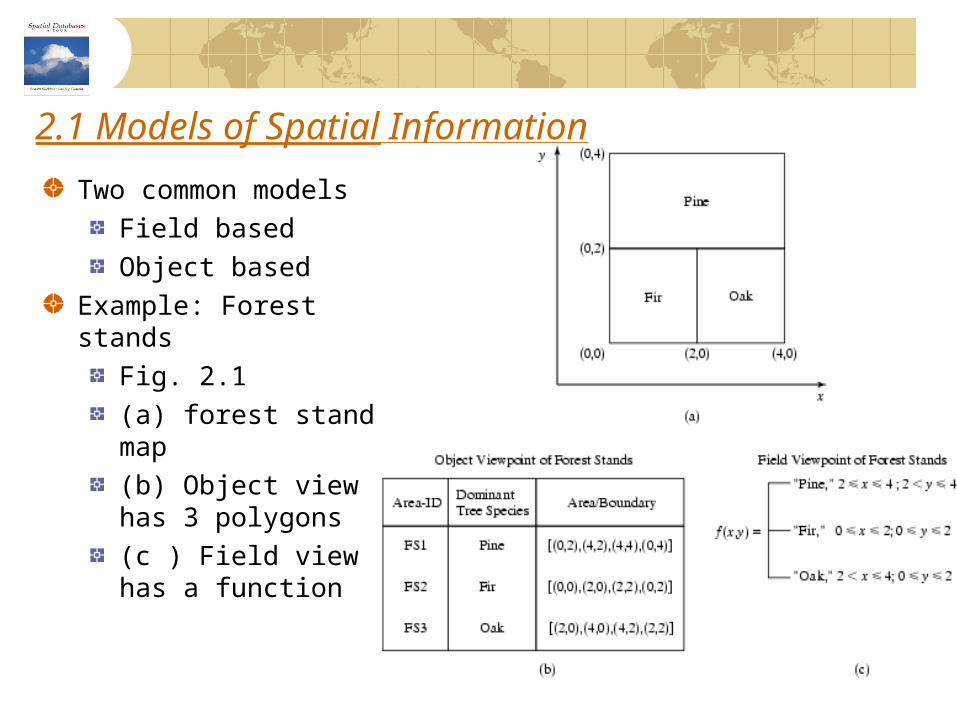
2.1 Models of Spatial Information
Two common modelsField basedObject based
Example: Forest stands
Fig. 2.1(a) forest stand map(b) Object view has 3 polygons(c ) Field view has a function
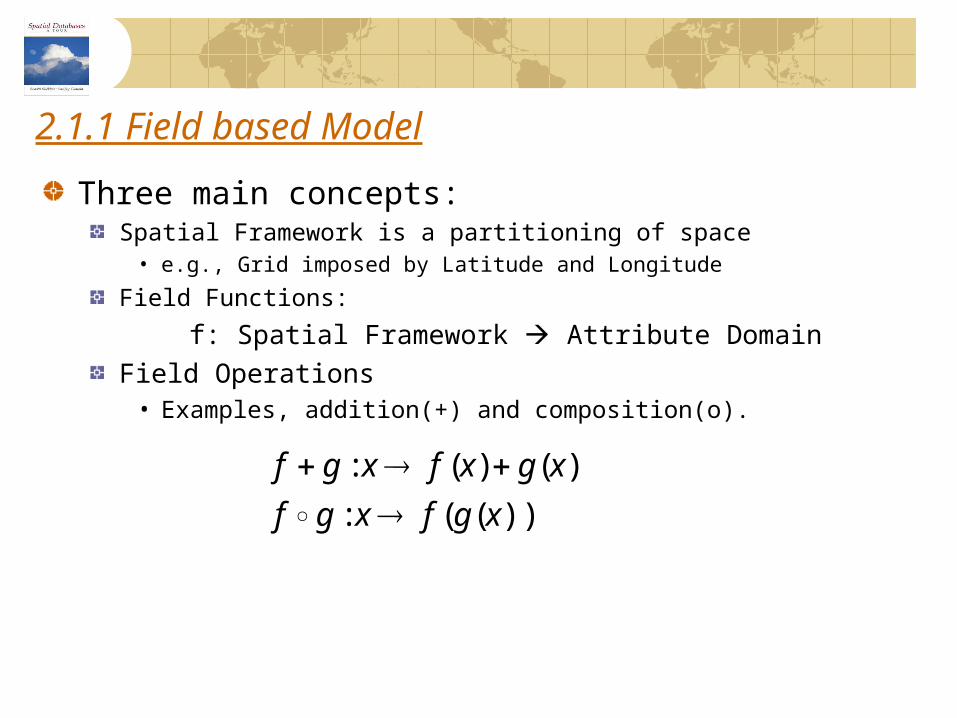
2.1.1 Field based Model
Three main concepts: Spatial Framework is a partitioning of space
• e.g., Grid imposed by Latitude and Longitude
Field Functions:
f: Spatial Framework Attribute DomainField Operations
• Examples, addition(+) and composition(o).
))((:
)()(:
xgfxgf
xgxfxgf
Types of Field Operations
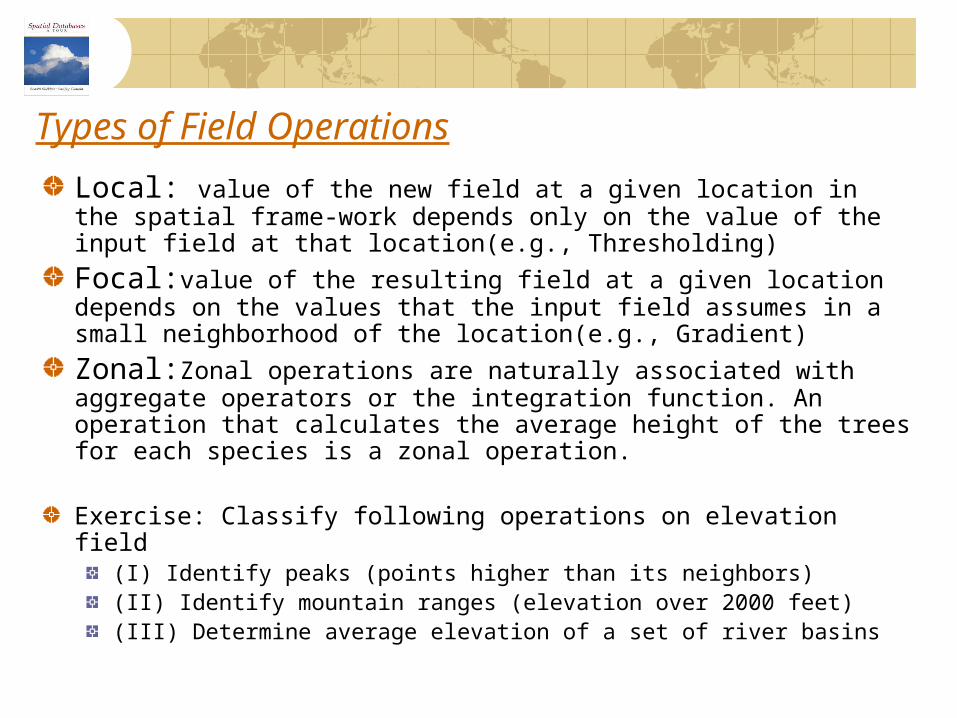
Local: value of the new field at a given location in the spatial frame-work depends only on the value of the input field at that location(e.g., Thresholding)
Focal:value of the resulting field at a given location depends on the values that the input field assumes in a small neighborhood of the location(e.g., Gradient)
Zonal:Zonal operations are naturally associated with aggregate operators or the integration function. An operation that calculates the average height of the trees for each species is a zonal operation.
Exercise: Classify following operations on elevation field(I) Identify peaks (points higher than its neighbors)(II) Identify mountain ranges (elevation over 2000 feet)(III) Determine average elevation of a set of river basins
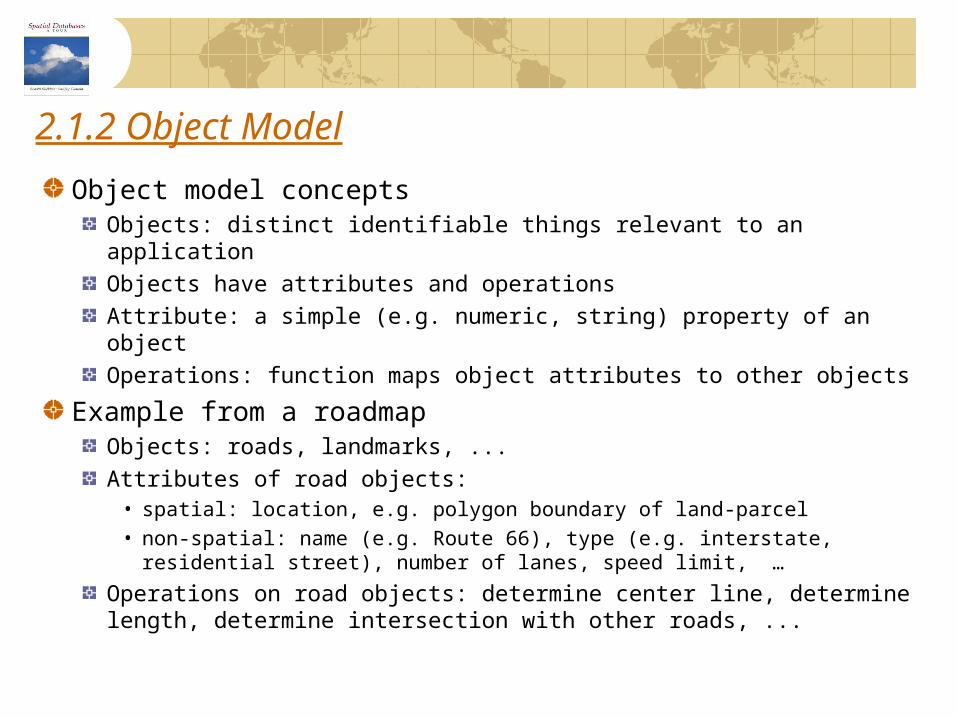
2.1.2 Object Model
Object model conceptsObjects: distinct identifiable things relevant to an applicationObjects have attributes and operationsAttribute: a simple (e.g. numeric, string) property of an object Operations: function maps object attributes to other objects
Example from a roadmapObjects: roads, landmarks, ...Attributes of road objects:
• spatial: location, e.g. polygon boundary of land-parcel• non-spatial: name (e.g. Route 66), type (e.g. interstate,
residential street), number of lanes, speed limit, …
Operations on road objects: determine center line, determine length, determine intersection with other roads, ...
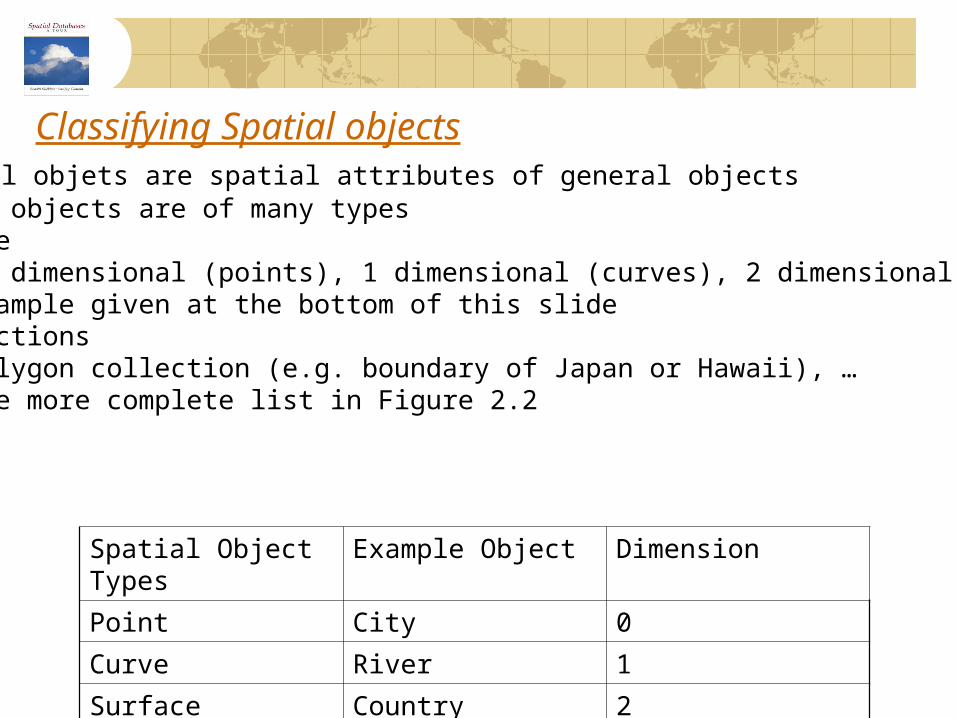
Classifying Spatial objects
Spatial Object Types
Example Object Dimension
Point City 0
Curve River 1
Surface Country 2
• Spatial objets are spatial attributes of general objects• Spatial objects are of many types
•Simple•0- dimensional (points), 1 dimensional (curves), 2 dimensional (surfaces)•Example given at the bottom of this slide
•Collections•Polygon collection (e.g. boundary of Japan or Hawaii), …•See more complete list in Figure 2.2
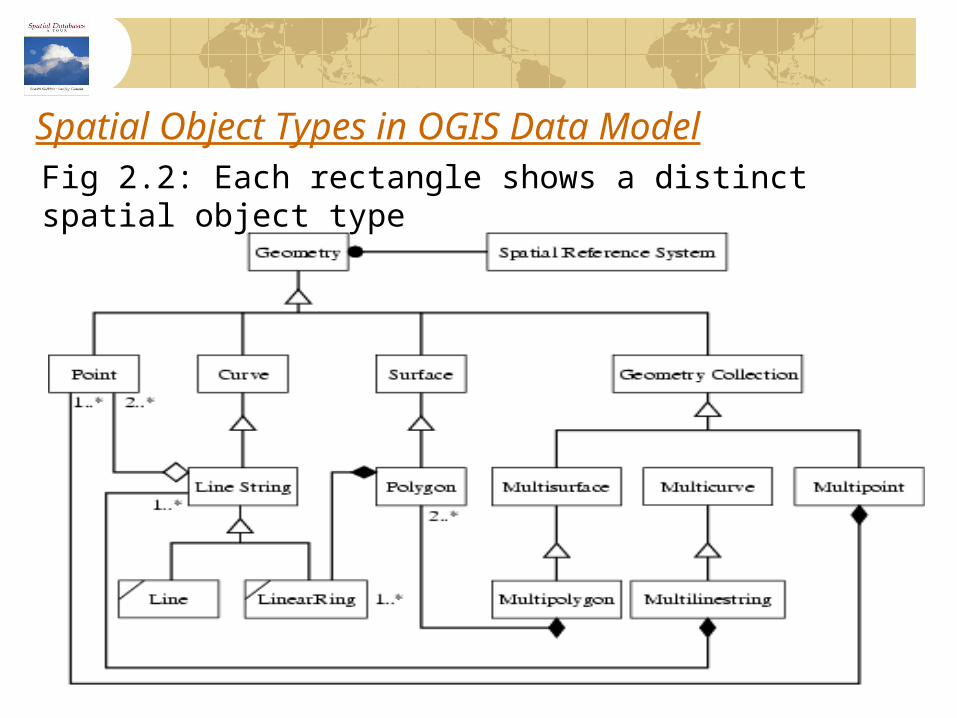
Spatial Object Types in OGIS Data ModelFig 2.2: Each rectangle shows a distinct spatial object type
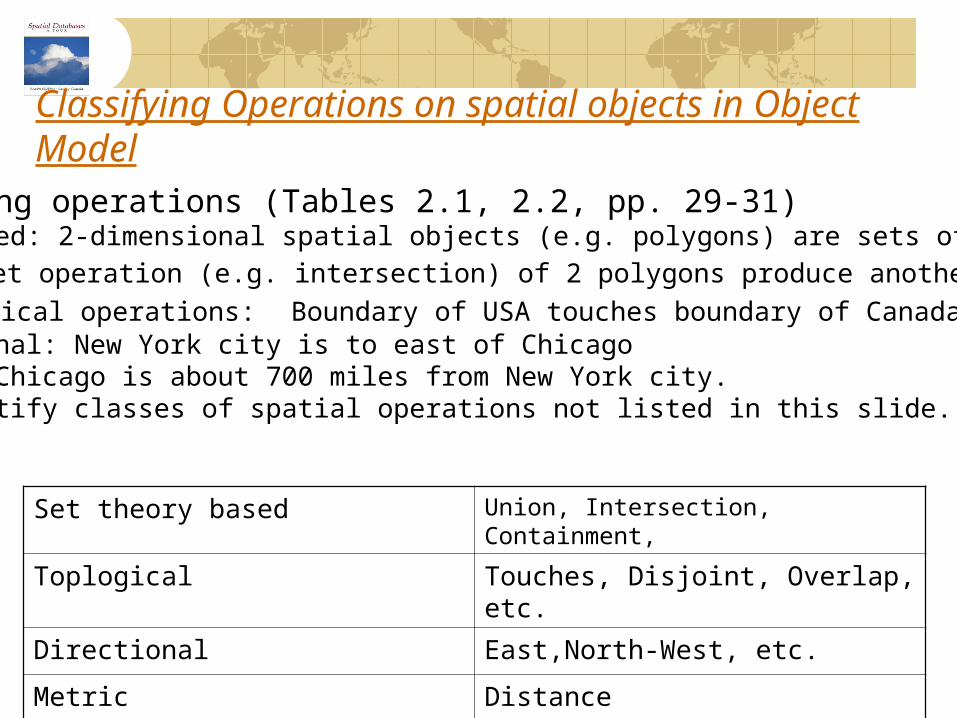
Classifying Operations on spatial objects in Object Model
Set theory based Union, Intersection, Containment,
Toplogical Touches, Disjoint, Overlap, etc.
Directional East,North-West, etc.
Metric Distance
•Classifying operations (Tables 2.1, 2.2, pp. 29-31)• Set based: 2-dimensional spatial objects (e.g. polygons) are sets of points
• a set operation (e.g. intersection) of 2 polygons produce another polygon• Topological operations: Boundary of USA touches boundary of Canada•Directional: New York city is to east of Chicago•Metric: Chicago is about 700 miles from New York city.• Q? Identify classes of spatial operations not listed in this slide.
Topological Relationships
Topological Relationships invariant under elastic deformation (without tear, merge).Two countries which touch each other in a planar paper map will continue to do so in spherical globe maps.
Topology is the study of topological relationshipsExample queries with topological operations
What is the topological relationship between two objects A and B ?Find all objects which have a given topological relationship to object A ?
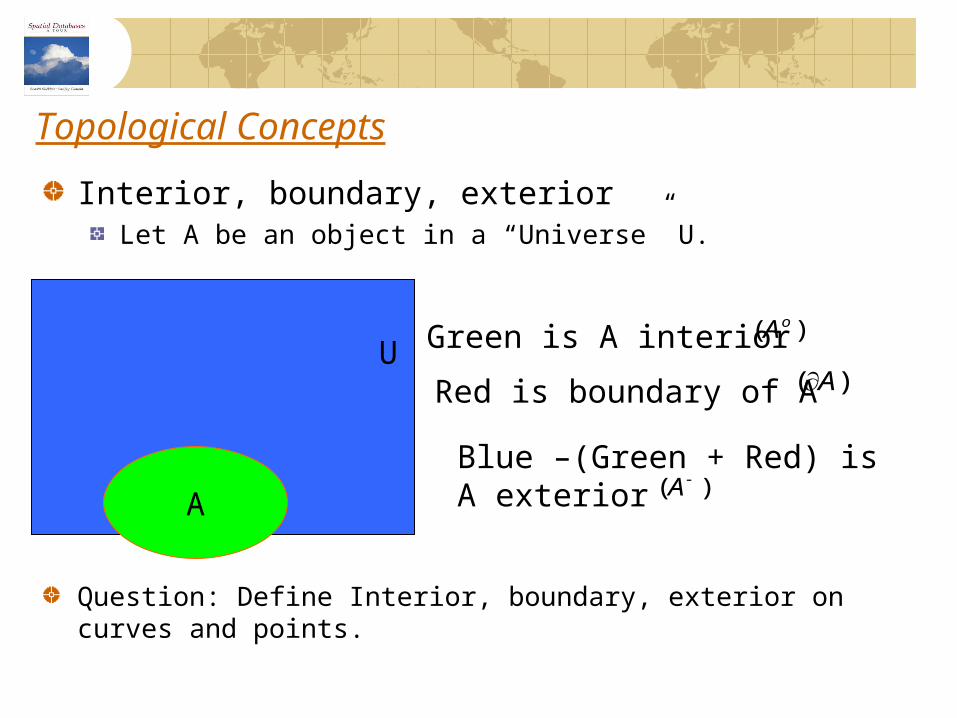
Topological Concepts
Interior, boundary, exteriorLet A be an object in a “Universe” U.
A
U Green is A interior
Red is boundary of A
Blue –(Green + Red) isA exterior
)( oA
)( A
)( A
Question: Define Interior, boundary, exterior on curves and points.
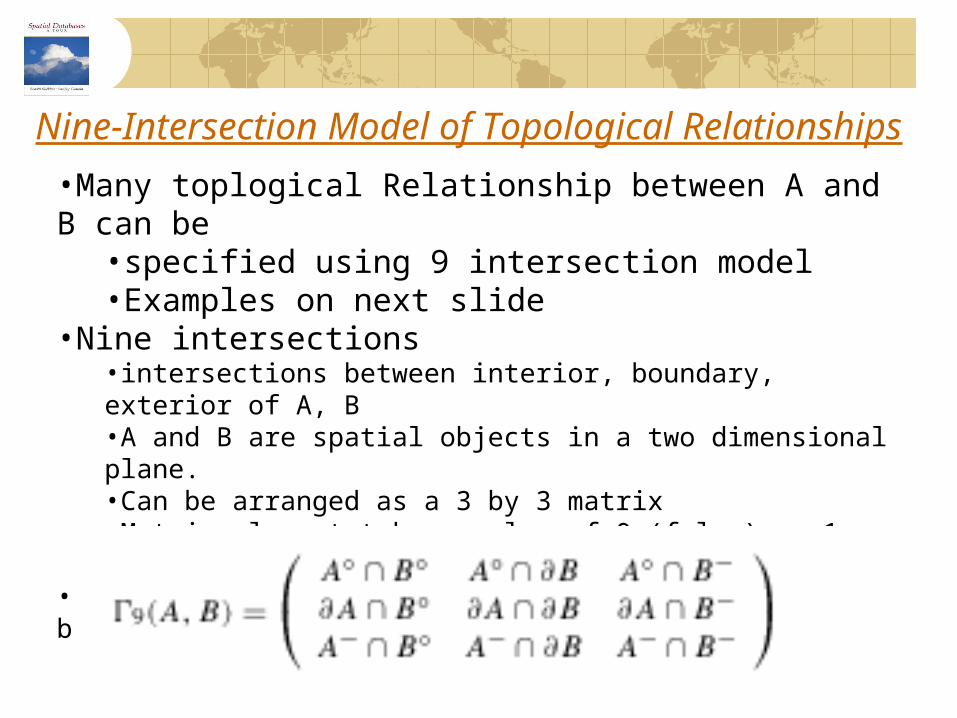
Nine-Intersection Model of Topological Relationships
•Many toplogical Relationship between A and B can be•specified using 9 intersection model•Examples on next slide
•Nine intersections •intersections between interior, boundary, exterior of A, B•A and B are spatial objects in a two dimensional plane.•Can be arranged as a 3 by 3 matrix•Matrix element take a value of 0 (false) or 1 (true).
•Q? Determine the number of many distinct 3 by 3 boolean matrices .
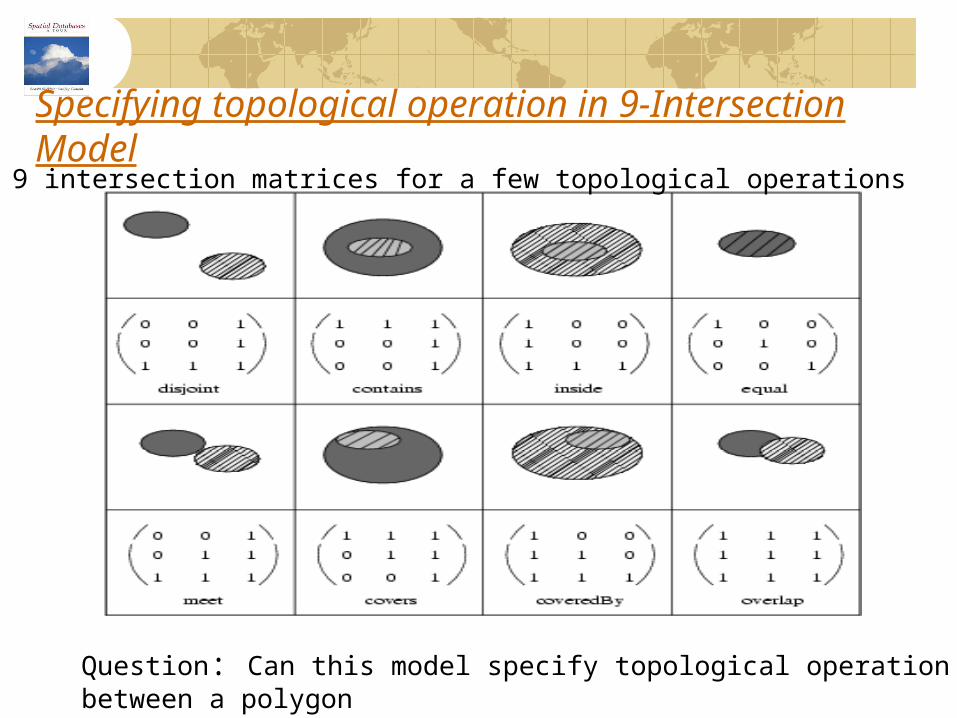
Specifying topological operation in 9-Intersection ModelFig 2.3: 9 intersection matrices for a few topological operations
Question: Can this model specify topological operation between a polygonand a curve?
Using Object Model of Spatial Data
Object model of spatial dataOGIS standard set of spatial data types and operationsSimilar to the object model in computer softwareEasily used with many computer software systemsProgramming languages like Java, C++, Visual basic
• Example use in a Java program is in section 2.1.6Post-relational databases, e.g. OODBMS, ORDBMS
• Example usage in chapter 3 through 6
Learning Objectives
Learning Objectives (LO)LO1: Understand concept of data models LO2 : Understand the models of spatial informationLO3: Understand the 3-step design of databases
• Conceptual - ER model• Logical - Relational model• Physical• Translation from Conceptual to Logical
LO4: Learn about the trends in spatial data models
Mapping chapter sections to learning objectivesLO2 - 2.1LO3 - 2.2LO4 - 2.3, 2.4
2.2 Three-Step Database Design
Database applications are modeled using a three-step design process
Conceptual-datatypes,relationships and constraints(ER model)Logical-mapping to a Relational model and associated query language(Relational Algebra)Physical-file structures, indexing,
ScopeWe discuss conceptual and logical data models in section 2.3Physical model is discussed in chapter 4
Example Application Domain
Database design is for a specific application domainOften a requirements document is available Designers discuss requirements with end-users as neededWe will use a simple spatial application domain
• to illustrate concepts in conceptual and logical data models• to illustrate translation of conceptual DM to logical DM
Spatial application domainA state-park consists of forests.A forest is a collection of forest-stands of different speciesState-Park is accessed by roads and has a managerState-Park has faciltitiesRiver runs through state-park and supplies water to the facilities
2.2.1 Conceptual DM: The ER Model
3 basic conceptsEntities have an independent conceptual or physical existence.
• Examples: Forest, Road, Manager, ...
Entities are characterized by Attributes• Example: Forest has attributes of name, elevation, etc.
An Entity interacts with another Entity through relationships.• Road allow access to Forest interiors.• This relationship may be name “Accesses”
Comparison with Object model of spatial informationEntities are collections of attributes are like objectsHowever ER model does not permit general user defined operationsRelationships are not directly supported in Object model
• but may be simulated via operations
Relationship TypesRelationships can be categorized by
cardinality constraintsother properties, e.g. number of participating entities
• Binary relationship: two entities participate
Types of Cardinality constraints for binary relationshipsOne-One: An instance of an entity relates to a unique instance of other entity. Many-One: Many instances of an entity relate to an instance of an other.Many-Many: Many instances of one entity relate to multiple instances of another.
Exercise: Identify type of cardinality constraint for following:Many facilities belong to a forest. Each facility belong to one forest. A manager manages 1 forest. Each forest has 1 manager.A river supplies water to many facilities. A facility gets water from many rivers.
ER Diagrams Graphical Notation
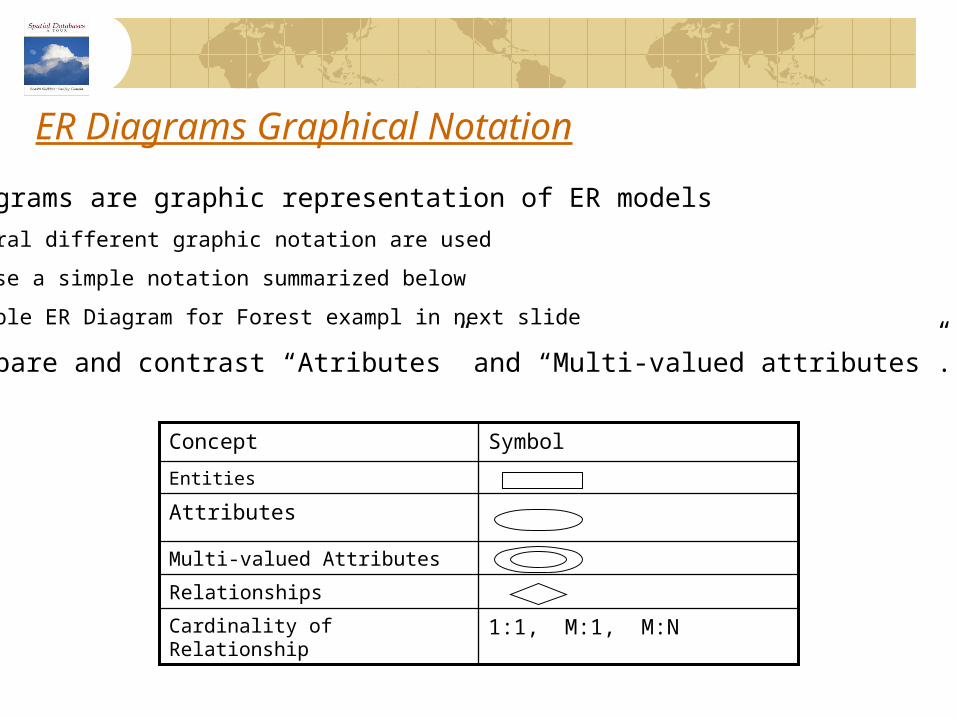
Multi-valued Attributes
1:1, M:1, M:NCardinality of Relationship
Relationships
Attributes
Entities
SymbolConcept
•ER Diagrams are graphic representation of ER models
•Several different graphic notation are used
•We use a simple notation summarized below
•Example ER Diagram for Forest exampl in next slide
•Q? Compare and contrast “Atributes” and “Multi-valued attributes”.
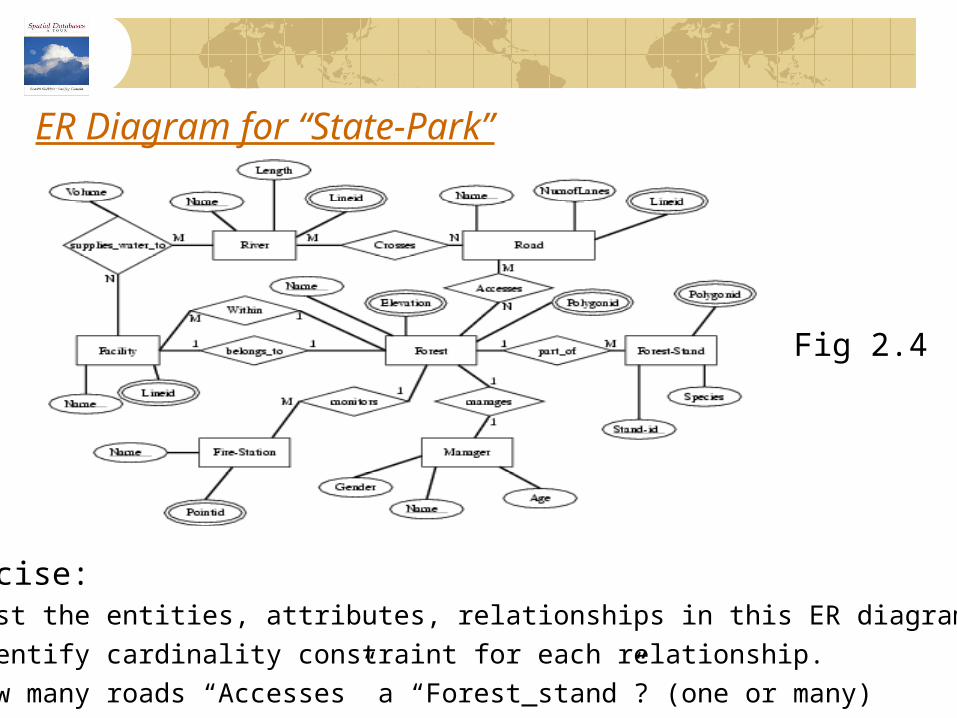
ER Diagram for “State-Park”
Fig 2.4
•Exercise:•List the entities, attributes, relationships in this ER diagram•Identify cardinality constraint for each relationship.•How many roads “Accesses” a “Forest_stand”? (one or many)
2.2.2 Logical Data Model: The Relational Model
Relational model is based on set theoryMain concepts
Domain: a set of values for a simple attributeRelation: cross-product of a set of domains
• Represents a table, i.e. homogeneous collection of rows (tuples)• The set of columns (i.e. attributes) are same for each row
Comparison to concepts in conceptual data modelRelations are similar to but not identical to entitiesDomains are similar to attributesTranslation rules establishing exact correspondence are discussed in 2.2.3
Relational Schema
Schema of a RelationEnumerates columns, identifies primary key and foreign keys.Primary Key :
• one or more attributes uniquely identify each row within a table
Foreign keys• R’s attributes which form primary key of another relation S• Value of a foreign key in any tuple of R match values in some row of S
Relational schema of a databasecollection of schemas of all relations in the databaseExample: Figure 2.5 (next slide) Ablue print summary drawing of the database table structuresAllows analysis of storage costs, data redundancy, querying capabilitiesSome databases were designed as relational schema in 1980sNowadays, databases are designed as E R models and relational schema is generated via CASE tools
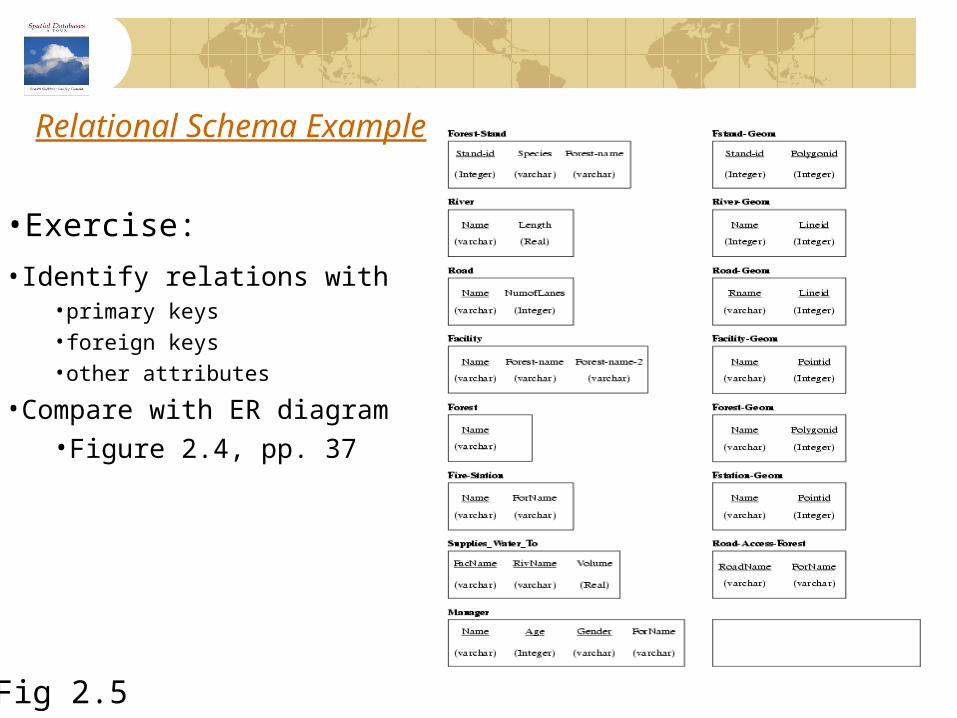
Relational Schema Example
Fig 2.5
•Exercise:
•Identify relations with •primary keys•foreign keys•other attributes
•Compare with ER diagram•Figure 2.4, pp. 37
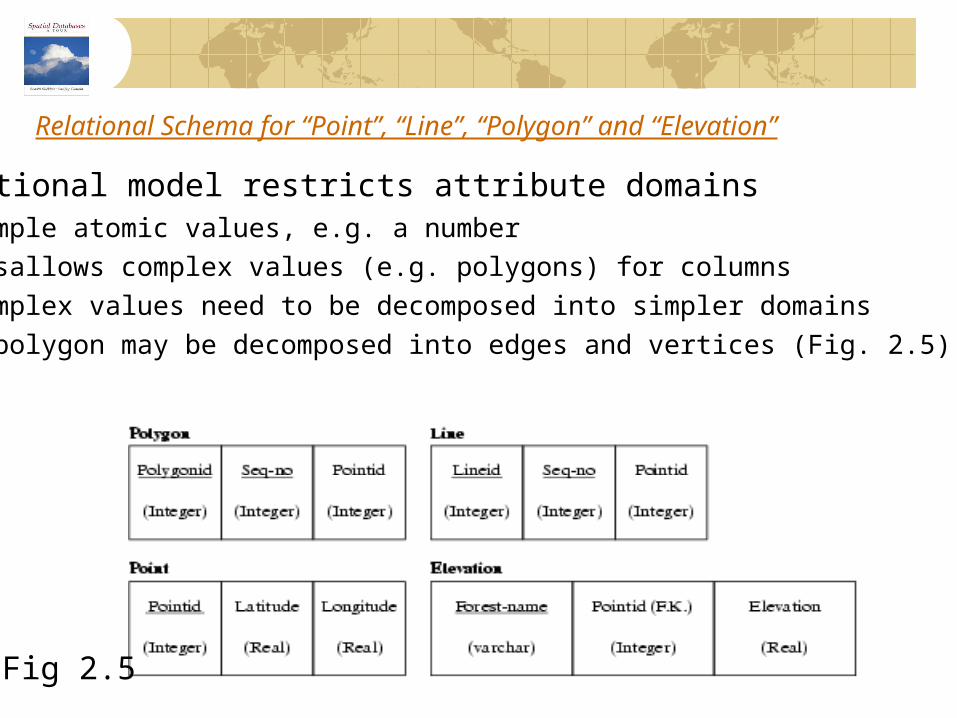
Relational Schema for “Point”, “Line”, “Polygon” and “Elevation”
Fig 2.5
•Relational model restricts attribute domains•simple atomic values, e.g. a number•Disallows complex values (e.g. polygons) for columns•Complex values need to be decomposed into simpler domains•A polygon may be decomposed into edges and vertices (Fig. 2.5)

More on Relational Model
Integrity ConstraintsKey: Every relation has a primary key. Entity Integrity: Value of primary key in a row is never undefinedReferential Integrity: Value of an attribute of a Foreign Key must appear as a value in the primary key of another relationship or must be null.
Normal Forms (NF) for Relational schemaReduce data redundancy and facilitate querying1st NF: Each column in a relation contains an atomic value.2nd and 3rd NF: Values of non-key attributes are fully determined by the values of the primary key, only the primary key, and nothing but the primary key.Other normal forms exists but are seldom usedTranslating a well-designed ER model yields a relational schema in 3rd NF
• satisfying definition of 1st, 2nd and 3rd normal forms
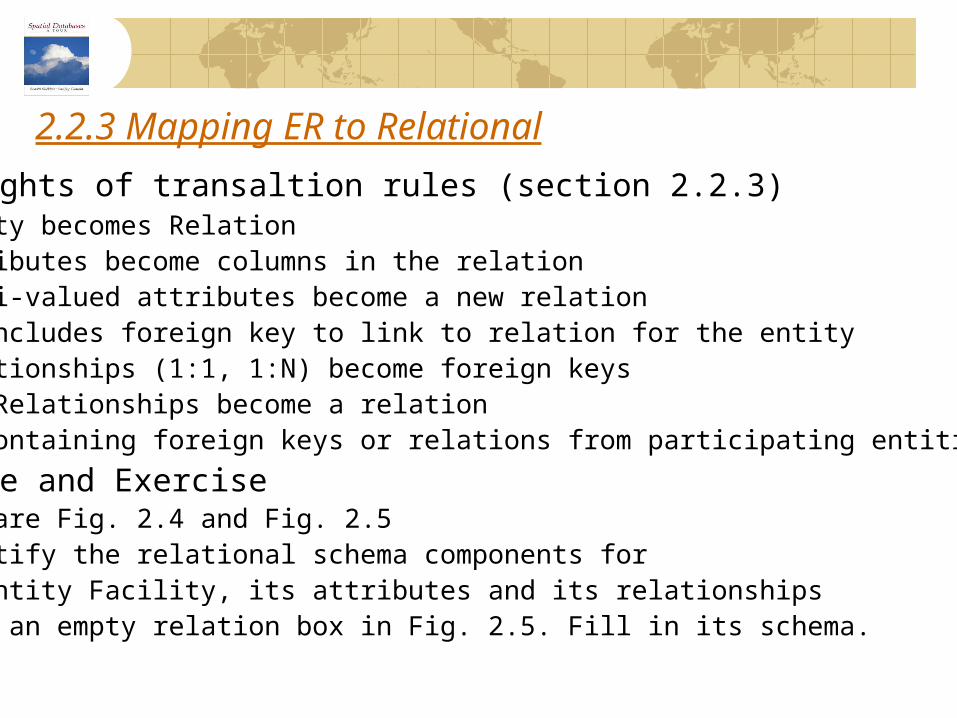
2.2.3 Mapping ER to Relational
•Highlights of transaltion rules (section 2.2.3)•Entity becomes Relation•Attributes become columns in the relation•Multi-valued attributes become a new relation
•includes foreign key to link to relation for the entity•Relationships (1:1, 1:N) become foreign keys•M:N Relationships become a relation
•containing foreign keys or relations from participating entities
•Example and Exercise•Compare Fig. 2.4 and Fig. 2.5•Identify the relational schema components for
•entity Facility, its attributes and its relationships•Note an empty relation box in Fig. 2.5. Fill in its schema.
Learning Objectives
Learning Objectives (LO)LO1: Understand concept of data models LO2 : Understand the models of spatial informationLO3: Understand the 3-step design of databasesLO4: Learn about the trends in spatial data models
• Pictograms in conceptual models• UML class diagrams
Mapping Sections to learning objectivesLO2 - 2.1LO3 - 2.2LO4 - 2.3, 2.4
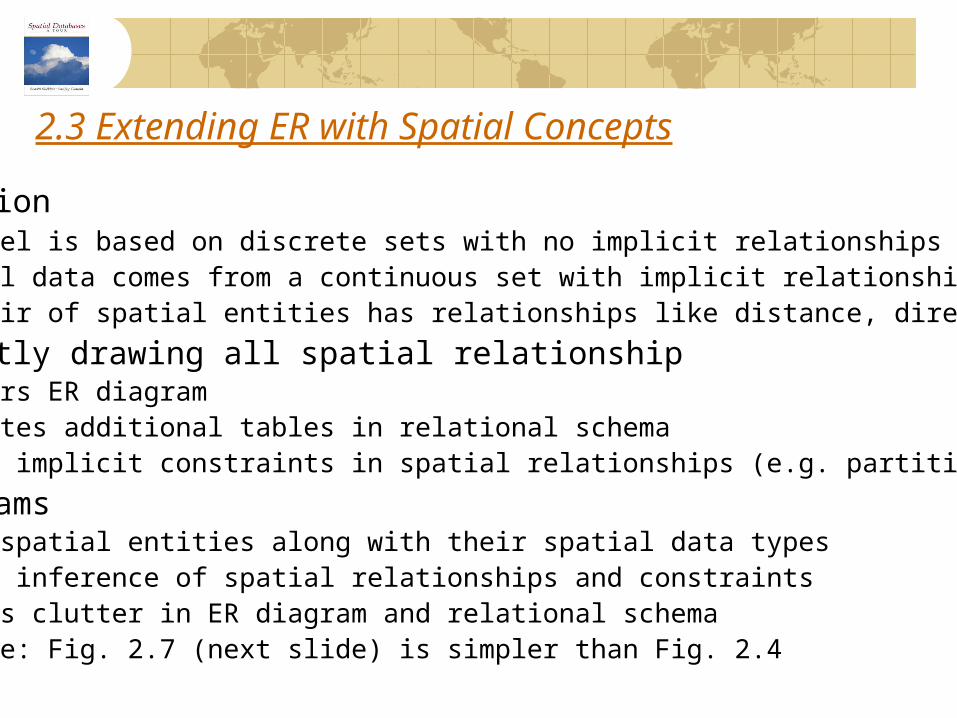
2.3 Extending ER with Spatial Concepts
•Motivation•ER Model is based on discrete sets with no implicit relationships•Spatial data comes from a continuous set with implicit relationships•Any pair of spatial entities has relationships like distance, direction, …
•Explicitly drawing all spatial relationship •clutters ER diagram•generates additional tables in relational schema•Misses implicit constraints in spatial relationships (e.g. partition)
•Pictograms•Label spatial entities along with their spatial data types•Allows inference of spatial relationships and constraints•Reduces clutter in ER diagram and relational schema•Example: Fig. 2.7 (next slide) is simpler than Fig. 2.4
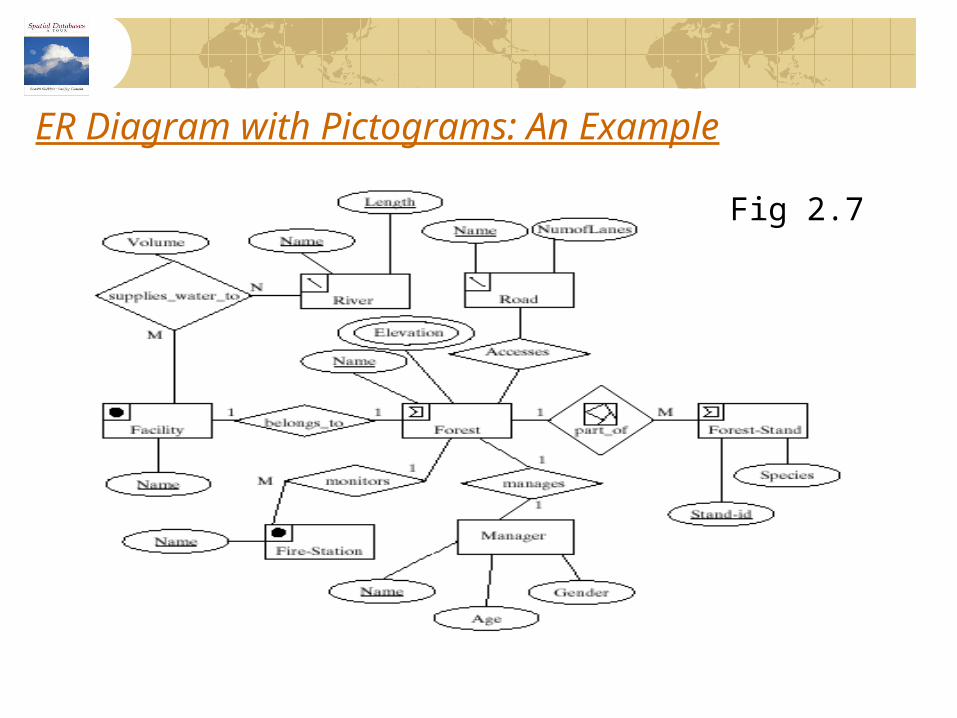
ER Diagram with Pictograms: An Example
Fig 2.7
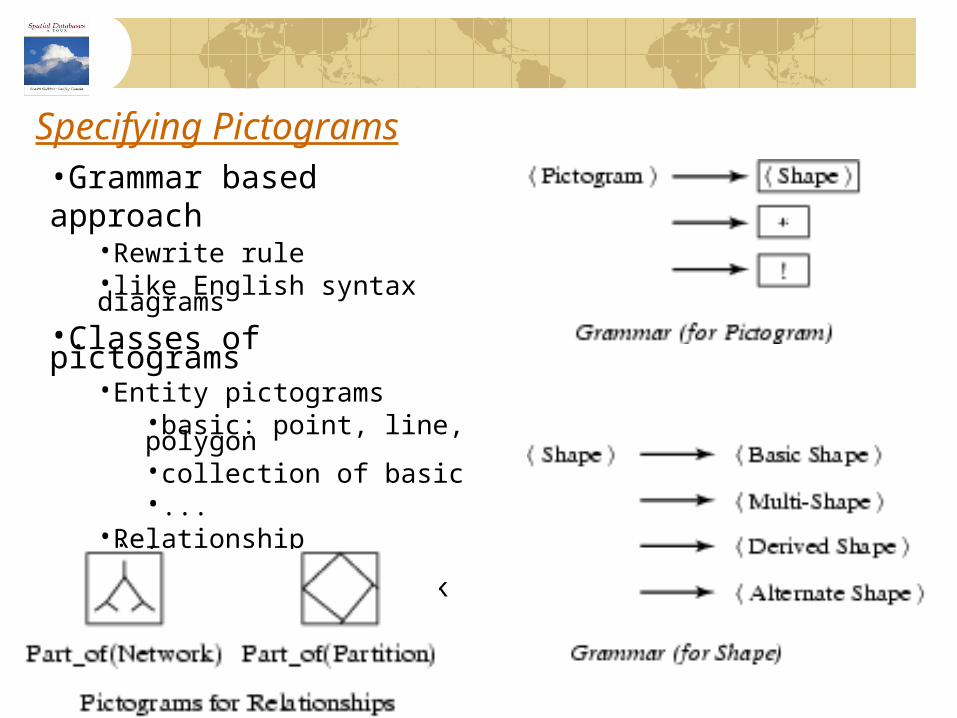
Specifying Pictograms•Grammar based approach
•Rewrite rule •like English syntax diagrams
•Classes of pictograms•Entity pictograms
•basic: point, line, polygon•collection of basic•...
•Relationship pictograms•partition, network
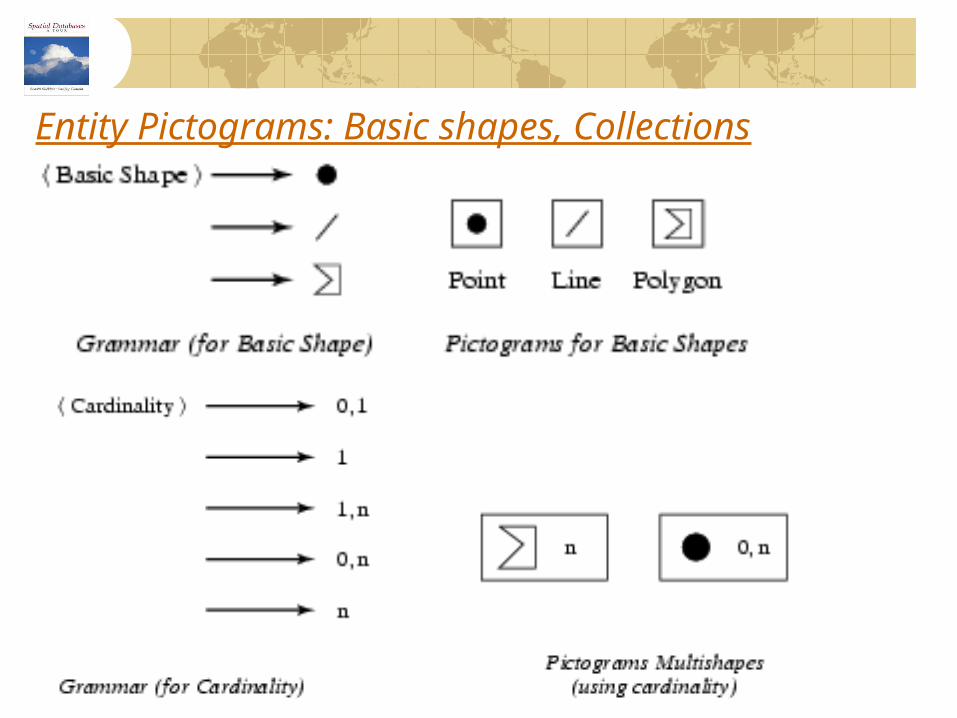
Entity Pictograms: Basic shapes, Collections
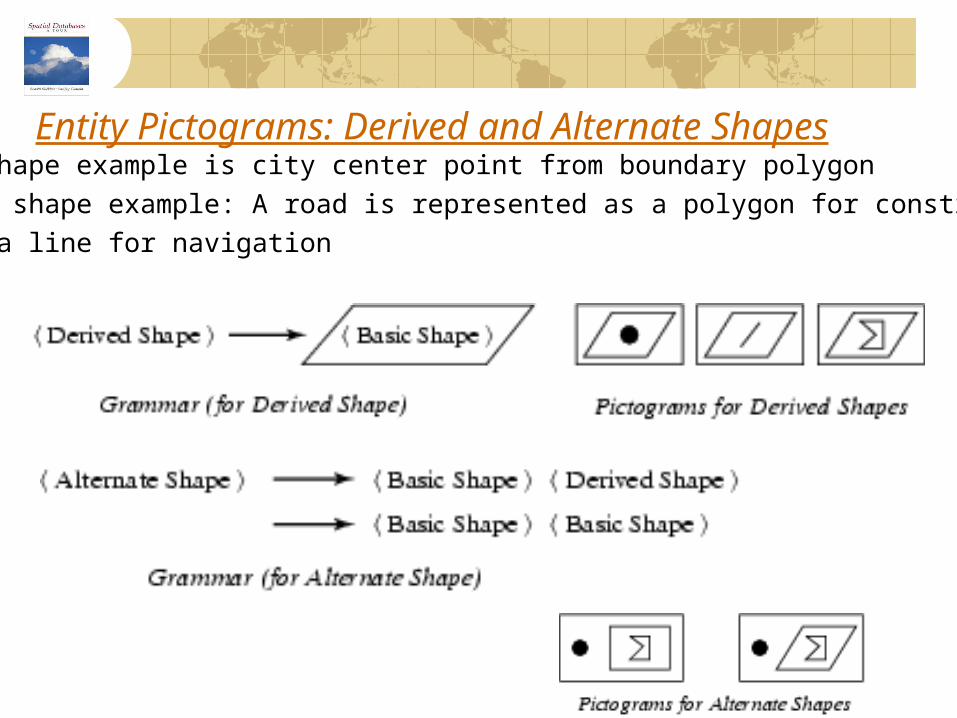
Entity Pictograms: Derived and Alternate Shapes•Derived shape example is city center point from boundary polygon•Alternate shape example: A road is represented as a polygon for construction
•or as a line for navigation
2.4 Conceptual Data Modeling with UML
•Motivation•ER Model does not allow user defined operations•Object oriented software development uses UML •UML stands for Unified Modeling Language•It is a standard consisting of several diagrams
•class diagrams are most relevant for data modeling
•UML class diagrams concepts•Attributes are simple or composite properties•Methods represent operations, functions and procedures•Class is a collection of attributes and methods•Relationship relate classes
•Example UML class diagram: Figure 2.8
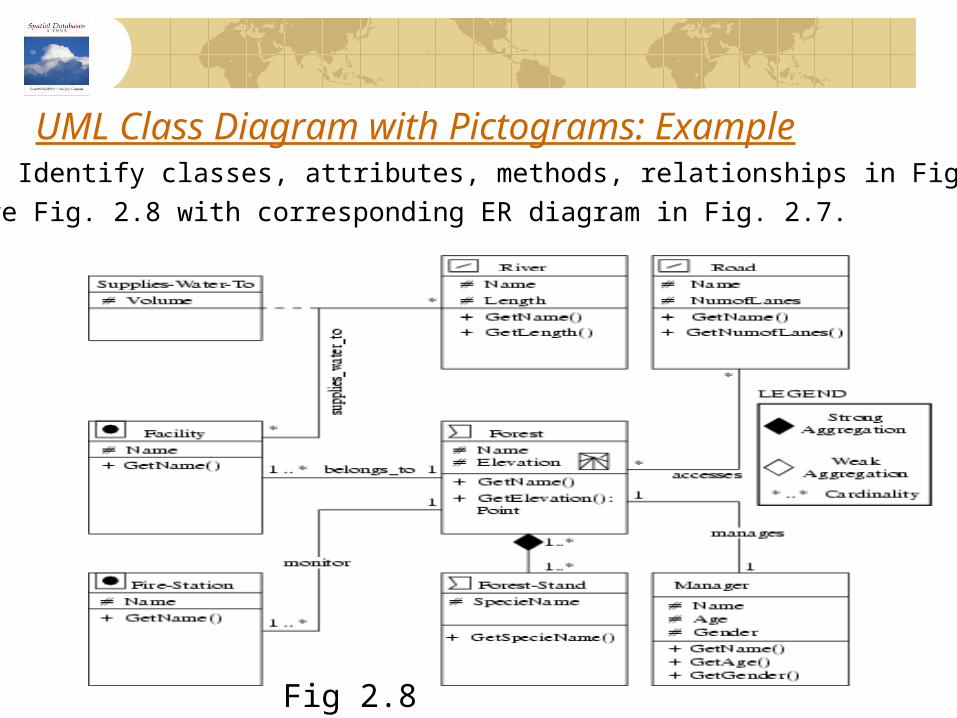
UML Class Diagram with Pictograms: Example
Fig 2.8
•Exercise: Identify classes, attributes, methods, relationships in Fig. 2.8.•Compare Fig. 2.8 with corresponding ER diagram in Fig. 2.7.
Comparing UML Class Diagrams to ER Diagrams
•Concepts in UML class diagram vs. those in ER diagrams •Class without methods is an Entity•Attributes are common in both models•UML does not have key attributes and integrity constraints• ERD does not have methods•Relationships properties are richer in ERDs•Entities in ER diagram relate to datasets, but UML class diagram
•can contain classes which have little to do with data
2.5 Summary
Spatial Information modeling can be classed into Field based and Object basedField based for modeling smoothly varying entities, like rainfallObject based for modeling discrete entities, like country
Summary
A data model is a high level description of the datait can help in early analysis of storage cost, data quality
There are two popular models of spatial informationField based and Object based
Database are designed in 3-stepsConceptual, Logical and Physical
Pictograms can simplify Conceptual data models