Embed Size (px)
Citation preview

Sustainability in the Supply Chain and the Design of Goods and Services
PART TWO Designing Operations ( Chapters 5 –10)
Learning Objectives LO 1 Define product life cycle 148
LO 2 Describe a product development system 151
LO 3 Build a house of quality 151
LO 4 Describe how time-based competition is implemented by OM 161
LO 5 Describe how products and services are defined by OM 163
LO 6 Describe the documents needed for production 165
LO 7 Explain how the customer participates in the design and delivery of services 167
LO 8 Apply decision trees to product issues 170
Product Strategy Provides Competitive Advantage at Regal Marine Thirty years after its founding by potato farmer Paul Kuck, Regal Marine
has become a powerful force on the waters of the world. The world’s
third-largest boat manufacturer (by global sales), Regal exports to
30 countries, including Russia and China. Almost one-third of its sales
are overseas.
Product design is critical in the highly competitive pleasure boat busi-
ness: “We keep in touch with our customers and we respond to the market-
place,” says Kuck. “We’re introducing six new models this year alone. I’d say
we’re definitely on the aggressive end of the spectrum.”
With changing consumer tastes, compounded by material changes and
ever-improving marine engineering, the design function is under constant
pressure. Added to these pressures is the constant issue of cost competi-
tiveness combined with the need to provide good value for customers.
Consequently, Regal Marine is a frequent user of computer-aided design
(CAD). New designs come to life via Regal’s three-dimensional CAD system
borrowed from automotive technology. Regal’s naval architects’ goal is to
5
145
Global Company Profile Regal Marine
M05B_HEIZ4345_02_SE_C05.indd 145M05B_HEIZ4345_02_SE_C05.indd 145 09/10/15 2:58 PM09/10/15 2:58 PM

146 PART 2 Designing Operations
continue to reduce the time from concept to proto-
type to production. The sophisticated CAD system not
only has reduced product development time but also
has reduced problems with tooling and production,
resulting in a superior product.
All of Regal’s products, from its $14 000 5.7-metre
boat to the $500 000 13-metre Commodore yacht,
follow a similar production process. Hulls and decks
are separately hand-produced by spraying preformed
moulds with three to five layers of a fibreglass lami-
nate. The hulls and decks harden and are removed to
become the lower and upper structure of the boat. As
they move to the assembly line, they are joined and
components added at each workstation.
Wooden components, precut in-house by computer-
driven routers, are delivered on a just-in-time basis for
installation at one station. Engines—one of the few
purchased components—are installed at another.
Racks of electrical wiring harnesses, engineered and
rigged in-house, are then installed. An in-house
upholstery department delivers customized seats,
beds, dashboards, or other cushioned components.
Finally, chrome fixtures are put in place, and the boat
is sent to Regal’s test tank for watertight, gauge, and
system inspection.
Goods and Services Selection Global firms like Regal Marine know that the basis for an organization’s existence is the good or
service it provides society. Great products are the keys to success. Anything less than an excellent
product strategy can be devastating to a firm. To maximize the potential for success, top companies
focus on only a few products and then concentrate on those products. For instance, Honda’s focus is
engines. Virtually all of Honda’s sales (autos, motorcycles, generators, lawn mowers) are based on
its outstanding engine technology. Likewise, Intel’s focus is on microprocessors, and Michelin’s is
on tires. However, because most products have a limited and even predictable life cycle, companies
must constantly be looking for new products to design, develop, and take to market. Good opera-
tions managers insist on strong communication among customer, product, processes, and suppliers
that results in a high success rate for their new products. 3M’s goal is to produce 30% of its profit
from products introduced in the last four years. Benchmarks vary by industry, of course; Regal
introduces six new boats a year, and Rubbermaid introduces a new product each day!
One product strategy is to build particular competence in customizing an established family
of goods or services. This approach allows the customer to choose product variations while
reinforcing the organization’s strength. Dell Computer, for example, has built a huge market by
delivering computers with the exact hardware and software desired by end users. And Dell does
it fast—it understands that speed to market is imperative to gain a competitive edge.
Note that many service firms also refer to their offerings as products. For instance, when
Allstate Insurance offers a new homeowner’s policy, it is referred to as a new “product.”
Similarly, when CIBC opens a mortgage department, it offers a number of new mortgage “prod-
ucts.” Although the term products may often refer to tangible goods, it also refers to offerings by
service organizations.
An effective product strategy links product decisions with investment, market share, and prod-
uct life cycle, and defines the breadth of the product line. The objective of the product decision
is to develop and implement a product strategy that meets the demands of the marketplace with a competitive advantage . As one of the 10 decisions of OM, product strategy may focus on develop-
ing a competitive advantage via differentiation, low cost, rapid response, or a combination of these.
VIDEO 5.1 Product Strategy at Regal Marine
Product decision
The selection, definition, and design of products.
Once a hull has been pulled from the mould, it travels down a monorail assembly path. JIT inventory delivers engines, wiring, seats, flooring, and interiors when needed.
Product strategy is critical to achieving competitive advantage.
AUTHOR COMMENT
M05B_HEIZ4345_02_SE_C05.indd 146M05B_HEIZ4345_02_SE_C05.indd 146 09/10/15 2:58 PM09/10/15 2:58 PM

Chapter 5 Sustainability in the Supply Chain and the Design of Goods and Services 147
PRODUCT STRATEGY OPTIONS SUPPORT
COMPETITIVE ADVANTAGE
A world of options exists in the selection, definition, and design of products. Product selection is
choosing the good or service to provide customers or clients. For instance, hospitals specialize in
various types of patients and medical procedures. In consultation with a province’s Ministry of
Health, it could be determined that the public is best served if a particular hospital will operate as a
general-purpose hospital, a maternity hospital, or, as in the case of the Canadian hospital Shouldice,
to specialize in hernias. Hospitals select their products when they decide what kind of hospital to
be. Numerous other options exist for hospitals, just as they exist for Taco Bell and Toyota.
Service organizations like Shouldice Hospital differentiate themselves through their prod-
uct. Shouldice differentiates itself by offering a distinctly unique and high-quality product. Its
world-renowned specialization in hernia-repair service is so effective it allows patients to return
to normal living in eight days as opposed to the average two weeks—and with very few com-
plications. The entire production system is designed for this one product. Local anaesthetics are
used; patients enter and leave the operating room on their own; rooms are spartan, and meals
are served in a common dining room, encouraging patients to get out of bed for meals and join
their fellows in the lounge. As Shouldice has demonstrated, product selection affects the entire
production system.
Taco Bell has developed and executed a low-cost strategy through product design. By designing
a product (its menu) that can be produced with a minimum of labour in small kitchens, Taco Bell
has developed a product line that is both low cost and high value. Successful product design has
allowed Taco Bell to increase the food content of its products from 27¢ to 45¢ of each sales dollar.
Toyota’s strategy is rapid response to changing consumer demand. By executing the fastest
automobile design in the industry, Toyota has driven the speed of product development down
to well under two years in an industry whose standard is still over two years. The shorter design
time allows Toyota to get a car to market before consumer tastes change and to do so with the
latest technology and innovations.
Product decisions are fundamental to an organization’s strategy and have major implications
throughout the operations function. For instance, GM’s steering columns are a good example
of the strong role product design plays in both quality and efficiency. The redesigned steering col-
umn has a simpler design, with about 30% fewer parts than its predecessor. The result: Assembly
Product Design Can Manifest Itself in Concepts, Technology, and Packaging. Whether it is a design focused on style at Nike (a), the application of technology at Michelin (b), or a new container at Sherwin-Williams (c), operations managers need to remind themselves that the creative process is ongoing with major implications for production.
(b) Technology: Michelin’s airless technology new wheel concept, dubbed the Tweel, a solid tire on a wheel whose spokes flex to absorb shocks.
(c) Packaging: Dutch Boy’s Ready to Roll contains 2.5 gallons of paint and has a built-in roller tray.
(a) Concepts: Nike, in its creative way, has moved athletic shoes from utilitarian necessities into glam-orous accessories and in the process is constantly reinventing all parts of the shoe, including the heel.
M05B_HEIZ4345_02_SE_C05.indd 147M05B_HEIZ4345_02_SE_C05.indd 147 09/10/15 2:58 PM09/10/15 2:58 PM

148 PART 2 Designing Operations
time is one-third that of the older column, and the new column’s quality is about seven times higher.
As an added bonus, machinery on the new line costs a third less than that on the old line.
PRODUCT LIFE CYCLES
Products are born. They live and they die. They are cast aside by a changing society. It may be
helpful to think of a product’s life as divided into four phases. Those phases are introduction ,
growth , maturity , and decline .
Product life cycles may be a matter of a few hours (a newspaper), months (seasonal fashions and
personal computers), years (video cassette tapes), or decades (cars). Regardless of the length of the
cycle, the task for the operations manager is the same: to design a system that helps introduce new
products successfully. If the operations function cannot perform effectively at this stage, the firm
may be saddled with losers—products that cannot be produced efficiently or perhaps at all.
Figure 5.1 shows the four life-cycle stages and the relationship of product sales, cash flow,
and profit over the life cycle of a product. Note that typically a firm has a negative cash flow
while it develops a product. When the product is successful, those losses may be recovered.
Eventually, the successful product may yield a profit prior to its decline. However, the profit is
fleeting—hence, the constant demand for new products.
LIFE CYCLE AND STRATEGY
Just as operations managers must be prepared to develop new products, they must also be pre-
pared to develop strategies for new and existing products. Periodic examination of products
is appropriate because strategies change as products move through their life cycle . Successful
product strategies require determining the best strategy for each product based on its position in
its life cycle. A firm, therefore, identifies products or families of products and their position in
the life cycle. Let us review some strategy options as products move through their life cycles.
INTRODUCTORY PHASE Because products in the introductory phase are still being “fine-tuned”
for the market, as are their production techniques, they may warrant unusual expenditures for (1)
research, (2) product development, (3) process modification and enhancement, and (4) supplier
development. For example, when cellular phones were first introduced, the features desired by
the public were still being determined. At the same time, operations managers were still groping
for the best manufacturing techniques.
GROWTH PHASE In the growth phase, product design has begun to stabilize, and effective fore-
casting of capacity requirements is necessary. Adding capacity or enhancing existing capacity to
accommodate the increase in product demand may be necessary.
MATURITY PHASE By the time a product is mature, competitors are established. So high-volume,
innovative production may be appropriate. Improved cost control, reduction in options, and a
paring down of the product line may be effective or necessary for profitability and market share.
DECLINE PHASE Management may need to be ruthless with those products whose life cycle is at
an end. Dying products are typically poor products in which to invest resources and managerial
talent. Unless dying products make some unique contribution to the firm’s reputation or its prod-
uct line or can be sold with an unusually high contribution, their production should be terminated. 1
LO1 Define product life cycle
Introduction Growth Maturity Decline
Cost of development and production
Sale
s, cost, a
nd c
ash flo
w Sales revenue
Loss
Net revenue (profit)
Cashflow
Negativecash flow
FIGURE 5.1
Product Life Cycle, Sales,
Cost, and Profit
1 Contribution is defined as the difference between direct cost and selling price. Direct costs are labour and material
that go into the product.
M05B_HEIZ4345_02_SE_C05.indd 148M05B_HEIZ4345_02_SE_C05.indd 148 09/10/15 2:58 PM09/10/15 2:58 PM

Chapter 5 Sustainability in the Supply Chain and the Design of Goods and Services 149
PRODUCT-BY-VALUE ANALYSIS
The effective operations manager selects items that show the greatest promise. This is the
Pareto principle (i.e., focus on the critical few, not the trivial many) applied to product mix:
Resources are to be invested in the critical few and not the trivial many. Product-by-value analysis lists products in descending order of their individual dollar contribution to the firm.
It also lists the total annual dollar contribution of the product. Low contribution on a per-unit
basis by a particular product may look substantially different if it represents a large portion of
the company’s sales.
A product-by-value report allows management to evaluate possible strategies for each prod-
uct. These may include increasing cash flow (e.g., increasing contribution by raising selling
price or lowering cost), increasing market penetration (improving quality and/or reducing cost or
price), or reducing costs (improving the production process). The report may also tell manage-
ment which product offerings should be eliminated and which fail to justify further investment
in research and development or capital equipment. Product-by-value analysis focuses manage-
ment’s attention on the strategic direction for each product.
Generating New Products Because products die; because products must be weeded out and replaced; because firms generate
most of their revenue and profit from new products—product selection, definition, and design
take place on a continuing basis. Consider recent product changes: TV to HDTV, radio to satellite
radio, coffee shop to Starbucks lifestyle coffee, travelling circus to Cirque du Soleil, land line to
cell phone, cell phone to BlackBerry, Walkman to iPod, mop to Swiffer—and the list goes on.
Knowing how to find and develop new products successfully is a requirement.
NEW PRODUCT OPPORTUNITIES
Aggressive new product development requires that organizations build structures internally that
have open communication with customers, innovative organizational cultures, aggressive R&D,
strong leadership, formal incentives, and training. Only then can a firm profitably and energeti-
cally focus on specific opportunities such as the following:
1. Understanding the customer is the premier issue in new-product development. Many com-
mercially important products are initially thought of and even prototyped by users rather than
producers. Such products tend to be developed by “lead users”—companies, organizations,
or individuals that are well ahead of market trends and have needs that go far beyond those
of average users. The operations manager must be “tuned in” to the market and particularly
these innovative lead users.
2. Economic change brings increasing levels of affluence in the long run but economic
cycles and price changes in the short run. In the long run, for instance, more and more
people can afford automobiles, but in the short run, a recession may weaken the demand
for automobiles.
3. Sociological and demographic change may appear in such factors as decreasing family size.
This trend alters the size preference for homes, apartments, and automobiles.
4. Technological change makes possible everything from cell phones to iPods to artificial
hearts.
5. Political/legal change brings about new trade agreements, tariffs, and government
requirements.
6. Other changes may be brought about through market practice , professional standards , sup-pliers , and distributors .
Operations managers must be aware of these dynamics and be able to anticipate changes in
product opportunities, the products themselves, product volume, and product mix.
IMPORTANCE OF NEW PRODUCTS
The importance of new products cannot be overestimated. As Figure 5.2(a) shows, leading com-
panies generate a substantial portion of their sales from products less than five years old. Even
Disney ( Figure 5.2(b) ) needs new theme parks to boost attendance. And giant Cisco Systems is
expanding from its core business of making routers and switches into building its own computer
Product-by-value analysis
A list of products, in descending order of their individual dollar contribution to the firm, as well as the total annual dollar contribution of the product.
Societies reward those who supply new products that reflect their needs.
AUTHOR COMMENT
M05B_HEIZ4345_02_SE_C05.indd 149M05B_HEIZ4345_02_SE_C05.indd 149 09/10/15 2:58 PM09/10/15 2:58 PM

150 PART 2 Designing Operations
servers ( Figure 5.2(c) ). The need for new products is why Gillette developed its multi-blade
razors, in spite of continuing high sales of its phenomenally successful Sensor razor, and why
Disney innovates in spite of being the leading family entertainment company in the world.
Despite constant efforts to introduce viable new products, many new products do not succeed.
Indeed, for General Mills to come up with a winner in the breakfast cereal market—defined as a
cereal that gets a scant half of 1% of the market—isn’t easy. Among the top 10 brands of cereal,
the youngest, Honey Nut Cheerios, was created in 1979. DuPont estimates that it takes 250 ideas
to yield one marketable product. 2
As one can see, product selection, definition, and design occur frequently—perhaps hundreds
of times for each financially successful product. Operations managers and their organizations
must be able to accept risk and tolerate failure. They must accommodate a high volume of new
product ideas while maintaining the activities to which they are already committed.
Product Development PRODUCT DEVELOPMENT SYSTEM
An effective product strategy links product decisions with cash flow, market dynamics, product
life cycle, and the organization’s capabilities. A firm must have the cash for product develop-
ment, understand the changes constantly taking place in the marketplace, and have the necessary
In m
illio
ns o
f vis
ito
rs
0
10
20
30
40
50
’93 ’95 ’97 ’99 ’01 ’03 ’05 ’07Animal Kingdom
Disney’s HollywoodStudios
Epcot
Magic Kingdom
Perc
en
tag
e o
f sale
s f
rom
new
pro
du
cts
Position of firm in its industry
Disney attendance by year
(a)
(b)
Billio
ns o
f d
ollars
0
10
5
15
25
20
30
35
’02 ’03 ’04 ’05 ’06 ’07 ’08
Routers
Switches
Other
Cisco product revenue by year
(c)
50%
Industryleader
The higher the percentage ofsales from the last 5 years, themore likely the firm is to be aleader.
Disney World innovates
with new parks, rides,
and attractions to boost
attendance.
Much of Cisco’s
growth has come
from new
non-networking
products.
Topthird
Middlethird
Bottomthird
40%
30%
20%
10%
0%
FIGURE 5.2 Innovation and New Products Yield Results for Both Manufacturing and Services
2 Rosabeth Kanter, John Kao, and Fred Wiersema, Innovation Breakthrough Thinking at 3M, DuPont, GE, Pfizer, and Rubbermaid (New York: HarperBusiness, 1997).
Motorola went through 3000 working models before it developed its first pocket cell phone.
AUTHOR COMMENT
M05B_HEIZ4345_02_SE_C05.indd 150M05B_HEIZ4345_02_SE_C05.indd 150 09/10/15 2:58 PM09/10/15 2:58 PM

Chapter 5 Sustainability in the Supply Chain and the Design of Goods and Services 151
talents and resources available. The product development system may well determine not only
product success but also the firm’s future. Figure 5.3 shows the stages of product development.
In this system, product options go through a series of steps, each having its own screening and
evaluation criteria, but providing a continuing flow of information to prior steps.
The screening process extends to the operations function. Optimum product development
depends not only on support from other parts of the firm but also on the successful integration of
all 10 of the OM decisions, from product design to maintenance. Identifying products that appear
likely to capture market share, be cost effective, and be profitable, but are in fact very difficult to
produce, may lead to failure rather than success.
QUALITY FUNCTION DEPLOYMENT (QFD)
Quality function deployment (QFD) refers to both (1) determining what will satisfy the cus-
tomer and (2) translating those customer desires into the target design. The idea is to capture a
rich understanding of customer wants and to identify alternative process solutions. This informa-
tion is then integrated into the evolving product design. QFD is used early in the design process
to help determine what will satisfy the customer and where to deploy quality efforts .
One of the tools of QFD is the house of quality. The house of quality is a graphic technique
for defining the relationship between customer desires and product (or service). Only by defining
this relationship in a rigorous way can operations managers design products and processes with
features desired by customers. Defining this relationship is the first step in building a world-class
production system. To build the house of quality, we perform seven basic steps:
1. Identify customer wants . (What do prospective customers want in this product?)
2. Identify how the good/service will satisfy customer wants. (Identify specific product charac-
teristics, features, or attributes and show how they will satisfy customer wants .)
LO2 Describe a product development system
Quality function
deployment (QFD)
A process for determining customer requirements (customer “wants”) and translating them into the attributes (the “hows”) that each functional area can understand and act on.
LO3 Build a house of quality
House of quality
A part of the quality function deployment process that utilizes a planning matrix to relate customer “wants” to “how” the firm is going to meet those “wants.”
Scopefor
designand
engineeringteams
Scopeof
productdevelopment
team
Design review: Are these productspecifications the best way to meet
customer requirements?
Functional specifications: How theproduct will work
Customer requirementsto win orders
Does firm have abilityto carry out idea?
Ideas from many sources
Product specifications: Howthe product will be made
Test market: Does productmeet customer expectations?
Introduction to market
Evaluation (success?)
FIGURE 5.3
Product Development Stages
Product concepts are developed from a variety of sources, both external and internal to the firm. Concepts that survive the product idea stage progress through various stages, with nearly constant review, feed-back, and evaluation in a highly participative environment to minimize failure.
M05B_HEIZ4345_02_SE_C05.indd 151M05B_HEIZ4345_02_SE_C05.indd 151 09/10/15 2:58 PM09/10/15 2:58 PM

152 PART 2 Designing Operations
3. Relate customer wants to product hows . (Build a matrix, as in Example 1 , that shows this
relationship.)
4. Identify relationships between the firm’s hows . (How do our hows tie together? For instance,
in the following example, there is a high relationship between low electricity requirements
and auto focus, auto exposure, and a paint pallet because they all require electricity. This
relationship is shown in the “roof” of the house in Example 1 .)
5. Develop importance ratings. (Using the customer’s importance ratings and weights for the
relationships shown in the matrix, compute our importance ratings, as in Example 1 .)
6. Evaluate competing products. (How well do competing products meet customer wants?
Such an evaluation, as shown in the two columns on the right of the figure in Example 1 ,
would be based on market research.)
7. Determine the desirable technical attributes, your performance, and the competitor’s perfor-
mance against these attributes. (This is done at the bottom of the figure in Example 1 ).
The following step-by-step illustration for Example 1 shows how to construct a house of quality.
Great Cameras, Inc., wants a methodology that strengthens its ability to meet customer desires with its
new digital camera.
APPROACH c Use QFD’s house of quality.
SOLUTION c Build the house of quality for Great Cameras, Inc. We do so here going step by step.
EXAMPLE 1
Constructing a house
of quality
Quality Function Deployment’s (QFD) House of Quality
Relationship betweenthe things we can do
What we can do(how the organization is going to translate customer wants intoproduct and processattributes anddesign targets)
G = good
F = fair P = poor
How wellwhat we domeets the customer’swants(relationshipmatrix)
Customerimportance
ratings(5 = highest)
What the customer wants
Weighted rating
Competitive
assessment
Target values(technical attributes)
Technicalevaluation
M05B_HEIZ4345_02_SE_C05.indd 152M05B_HEIZ4345_02_SE_C05.indd 152 09/10/15 2:58 PM09/10/15 2:58 PM

Chapter 5 Sustainability in the Supply Chain and the Design of Goods and Services 153
Lightweight
Easy to use
Reliable
Easy to hold steady
Colour correction
Low
ele
ctr
icity r
equirem
ents
Alu
min
um
com
ponents
Auto
focus
Auto
exposure
Pain
t palle
t
Erg
onom
ic d
esig
n
First, through market research, Great Cameras, Inc., determined what the customer wants . Those wants are shown on the left of the house of quality. Second, the prod-uct development team determined how the organization is going to translate those customer wants into product design and process attribute targets. These hows are entered across the top portion of the house of quality.
Our importance ratings 22 9 27 27 32 25
3
4
5
2
1
of 25 = (1 3 3) +
(3 3 4) + (2 3 5)
High relationship (5)
Medium relationship (3)
Low relationship (1)
Third, the team evaluated each of the customer wants against the hows . In the relationship matrix of the house, the team evaluated how well its design meets customer needs. Fourth, the “roof” of the house indicates the relationship between the attributes. Fifth, the team developed importance ratings for its design attributes on the bot-tom row of the table. This was done by assigning values (5 for high, 3 for medium, and 1 for low) to each entry in the relationship matrix, and then multiplying each of these values by the customer’s impor-tance rating. The values in the “Our importance ratings” row provide a ranking of how to proceed with product and process design, with the highest values being the most critical to a successful product.
G
G
F
G
P
P
P
G
P
P
Com
pany A
Com
pany B
Sixth, the house of quality is also used for the evaluation of com-petitors . The two columns on the right indicate how market research thinks competitors, A and B, satisfy customer wants (Good, Fair, or Poor). Products from other firms and even the proposed product can be added next to company B.
0.5
A
75%
2' to ∞
2 c
ircuits
Failu
re 1
per
10,0
00
Panel ra
nkin
g
0.7
0.6
0.5
60%
50%
75%
yes
yes
yes
1
2
2
ok
ok
ok
G
F
G
Seventh, the team identifies the technical attributes and evaluates how well Great Cameras, Inc. and its competitors address these attrib-utes. Here, the team decided on the noted technical attributes.
M05B_HEIZ4345_02_SE_C05.indd 153M05B_HEIZ4345_02_SE_C05.indd 153 09/10/15 2:58 PM09/10/15 2:58 PM

154 PART 2 Designing Operations
Another use of quality function deployment (QFD) is to show how the quality effort will be
deployed . As Figure 5.4 shows, design characteristics of House 1 become the inputs to House
2, which are satisfied by specific components of the product. Similarly, the concept is carried to
House 3, where the specific components are to be satisfied through particular production pro-cesses . Once those production processes are defined, they become requirements of House 4 to be
satisfied by a quality plan that will ensure conformance of those processes. The quality plan is a
set of specific tolerances, procedures, methods, and sampling techniques that will ensure that the
production process meets the customer requirements.
Much of the QFD effort is devoted to meeting customer requirements with design char-
acteristics (House 1 in Figure 5.4 ), and its importance is not to be underestimated. However,
the sequence of houses is a very effective way of identifying, communicating, and allocating
resources throughout the system. The series of houses helps operations managers determine
where to deploy quality resources. In this way we meet customer requirements, produce quality
products, and win orders.
ORGANIZING FOR PRODUCT DEVELOPMENT
Let’s look at four approaches to organizing for product development. First , the traditional North
American approach to product development is an organization with distinct departments: a
research and development department to do the necessary research; an engineering department
to design the product; a manufacturing engineering department to design a product that can be
produced; and a production department that produces the product. The distinct advantage of this
approach is that fixed duties and responsibilities exist. The distinct disadvantage is lack of for-
ward thinking: How will downstream departments in the process deal with the concepts, ideas,
and designs presented to them, and ultimately what will the customer think of the product?
A second and popular approach is to assign a product manager to “champion” the product
through the product development system and related organizations.
However, a third , and perhaps the best, product development approach used in North America
seems to be the use of teams. Such teams are known variously as product development teams, design for manufacturability teams , and value engineering teams .
The Japanese use a fourth approach. They bypass the team issue by not subdividing organ-
izations into research and development, engineering, production, and so forth. Consistent with
INSIGHT c QFD provides an analytical tool that structures design features and technical issues, as
well as providing importance rankings and competitor comparison.
LEARNING EXERCISE c If the market research for another country indicates that “lightweight”
has the most important customer ranking (5), and reliability is 3, what is the new total importance
ranking for low electricity requirements, aluminum components, and ergonomic design? [Answer: 18,
15, 27, respectively.]
RELATED PROBLEMS c 5.1, 5.2, 5.3, 5.4
Designcharacteristics
Cu
sto
mer
requirem
ents
Specificcomponents
Desig
nchara
cte
ristics
Productionprocess
Specific
com
ponents
House4
Qualityplan
Pro
du
cti
on
pro
cess
House1
House2
House3
FIGURE 5.4 House of Quality Sequence Indicates How to Deploy Resources to Achieve Customer Requirements
M05B_HEIZ4345_02_SE_C05.indd 154M05B_HEIZ4345_02_SE_C05.indd 154 09/10/15 2:58 PM09/10/15 2:58 PM

Chapter 5 Sustainability in the Supply Chain and the Design of Goods and Services 155
the Japanese style of group effort and teamwork, these activities are all in one organization.
Japanese culture and management style are more collegial and the organization less structured
than in most Western countries. Therefore, the Japanese find it unnecessary to have “teams”
provide the necessary communication and coordination. However, the typical Western style, and
the conventional wisdom, is to use teams.
Product development teams are charged with the responsibility of moving from market
requirements for a product to achieving a product success (refer to Figure 5.3 ). Such teams often
include representatives from marketing, manufacturing, purchasing, quality assurance, and field
service personnel. Many teams also include representatives from vendors. Regardless of the
formal nature of the product development effort, research suggests that success is more likely in
an open, highly participative environment where those with potential contributions are allowed
to make them. The objective of a product development team is to make the good or service a
success. This includes marketability, manufacturability, and serviceability.
Use of such teams is also called concurrent engineering and implies a team representing all
affected areas (known as a cross-functional team). Concurrent engineering also implies speedier
product development through simultaneous performance of various aspects of product develop-
ment. 3 The team approach is the dominant structure for product development by leading organi-
zations in North America.
MANUFACTURABILITY AND VALUE ENGINEERING
Manufacturability and value engineering activities are concerned with improvement of design
and specifications at the research, development, design, and production stages of product devel-
opment. In addition to immediate, obvious cost reduction, design for manufacturability and
value engineering may produce other benefits. These include:
1. Reduced complexity of the product.
2. Reduction of environmental impact.
3. Additional standardization of components.
4. Improvement of functional aspects of the product.
5. Improved job design and job safety.
6. Improved maintainability (serviceability) of the product.
7. Robust design.
Manufacturability and value engineering activities may be the best cost-avoidance technique
available to operations management. They yield value improvement by focusing on achieving
the functional specifications necessary to meet customer requirements in an optimal way. Value
engineering programs, when effectively managed, typically reduce costs between 15% and 70%
without reducing quality. Some studies have indicated that for every dollar spent on value engi-
neering, $10 to $25 in savings can be realized.
Product design affects virtually all aspects of operating expense and sustainability.
Consequently, the development process needs to ensure a thorough evaluation of design prior to
a commitment to produce. The cost reduction achieved for a specific bracket via value engineer-
ing is shown in Figure 5.5 .
Product development teams
Teams charged with moving from market requirements for a product to achieving product success.
Concurrent engineering
Use of participating teams in design and engineering activities.
Manufacturability and value
engineering
Activities that help improve a product’s design, production, maintainability, and use.
3 Firms that have high technological or product change in their competitive environment tend to use more con-
current engineering practices. See X. Koufteros, M. Vonderembse, and W. Doll, “Concurrent Engineering and Its
Consequences,” Journal of Operations Management 19, no. 1 (January 2001): 97–115.
1 3
$3.50 $2.00
2
$.80
FIGURE 5.5
Cost Reduction of a Bracket
via Value Engineering
M05B_HEIZ4345_02_SE_C05.indd 155M05B_HEIZ4345_02_SE_C05.indd 155 09/10/15 2:58 PM09/10/15 2:58 PM

156 PART 2 Designing Operations
Issues for Product Design In addition to developing an effective system and organization structure for product develop-
ment, several techniques are important to the design of a product. We will now review six of
these: (1) robust design, (2) modular design, (3) computer-aided design (CAD), (4) computer-
aided manufacturing (CAM), (5) virtual reality technology, and (6) value analysis.
ROBUST DESIGN
Robust design means that the product is designed so that small variations in production or
assembly do not adversely affect the product. For instance, Lucent developed an integrated cir-
cuit that could be used in many products to amplify voice signals. As originally designed, the
circuit had to be manufactured very expensively to avoid variations in the strength of the signal.
But after testing and analyzing the design, Lucent engineers realized that if the resistance of the
circuit was reduced—a minor change with no associated costs—the circuit would be far less
sensitive to manufacturing variations. The result was a 40% improvement in quality.
MODULAR DESIGN
Products designed in easily segmented components are known as modular designs . Modular
designs offer flexibility to both production and marketing. Operations managers find modular-
ity helpful because it makes product development, production, and subsequent changes easier.
Moreover, marketing may like modularity because it adds flexibility to the ways customers can
be satisfied. For instance, virtually all premium high-fidelity sound systems are produced and
sold this way. The customization provided by modularity allows customers to mix and match to
their own taste. This is also the approach taken by Harley-Davidson, where relatively few dif-
ferent engines, chassis, gas tanks, and suspension systems are mixed to produce a huge variety
of motorcycles. It has been estimated that many automobile manufacturers can, by mixing the
available modules, never make two cars alike. This same concept of modularity is carried over
to many industries, from airframe manufacturers to fast-food restaurants. Airbus uses the same
wing modules on several planes, just as McDonald’s and Harvey’s use relatively few modules
(cheese, lettuce, buns, sauces, pickles, meat patties, french fries, etc.) to make a variety of meals.
COMPUTER-AIDED DESIGN (CAD)
Computer-aided design (CAD) is the use of computers to interactively design products and prepare
engineering documentation. Use and variety of CAD software is extensive and is rapidly expanding.
CAD software allows designers to use three-dimensional drawings to save time and money by short-
ening development cycles for virtually all products. The speed and ease with which sophisticated
designs can be manipulated, analyzed, and modified with CAD makes review of numerous options
possible before final commitments are made. Faster development, better products, accurate flow of
information to other departments—all contribute to a tremendous payoff for CAD. The payoff is
particularly significant because most product costs are determined at the design stage.
One extension of CAD is design for manufacture and assembly (DFMA) software, which
focuses on the effect of design on assembly. It allows designers to examine the integration of
product designs before the product is manufactured. For instance, DFMA allows automobile
designers to examine how a transmission will be placed in a car on the production line, even
while both the transmission and the car are still in the design stage.
A second CAD extension is 3-D object modelling . The technology is particularly useful
for small prototype development. 3-D object modelling rapidly builds up a model in very
thin layers of synthetic materials for evaluation. This technology speeds development by avoid-
ing a more lengthy and formal manufacturing process. 3-D printers, costing as little as $5000,
are also now available. Shoemaker Timberland, Inc., uses its technology to allow footwear
designers to see their constructions overnight rather than waiting a week for model-makers to
carve them.
Some CAD systems have moved to the internet through ecommerce, where they link com-
puterized design with purchasing, outsourcing, manufacturing, and long-term maintenance. This
move supports rapid product change and the growing trend toward “mass customization.” With
CAD on the internet, customers can enter a supplier’s design libraries and make design changes.
The supplier’s software can then automatically generate the drawings, update the bill of material,
Robust design
A design that can be produced to requirements even with unfavour-able conditions in the production process.
Modular designs
Designs in which parts or compo-nents of a product are subdivided into modules that are easily interchanged or replaced.
Computer-aided design (CAD)
Interactive use of a computer to develop and document a product.
Design for manufacture and
assembly (DFMA)
Software that allows designers to look at the effect of design on manufacturing of the product.
3-D object modelling
An extension of CAD that builds small prototypes.
Each time the bracket is redesigned and simplified, we are able to produce it for less.
AUTHOR COMMENT
M05B_HEIZ4345_02_SE_C05.indd 156M05B_HEIZ4345_02_SE_C05.indd 156 09/10/15 2:58 PM09/10/15 2:58 PM

Chapter 5 Sustainability in the Supply Chain and the Design of Goods and Services 157
and prepare instructions for the supplier’s production process. The result is customized products
produced faster and at less expense.
As product life cycles shorten and design becomes more complex, collaboration among depart-
ments, facilities, and suppliers throughout the world becomes critical. The potential of such col-
laboration has proven so important that a standard for its exchange has been developed, known as
the standard for the exchange of product data (STEP) . STEP permits manufacturers to express
3-D product information in a standard format so it can be exchanged internationally, allowing
geographically dispersed manufacturers to integrate design, manufacture, and support processes. 4
COMPUTER-AIDED MANUFACTURING (CAM)
Computer-aided manufacturing (CAM) refers to the use of specialized computer programs to
direct and control manufacturing equipment. When computer-aided design (CAD) information
is translated into instructions for computer-aided manufacturing (CAM), the result of these two
technologies is CAD/CAM.
The benefits of CAD and CAM include:
1. Product quality: CAD permits the designer to investigate more alternatives, potential prob-
lems, and dangers.
2. Shorter design time: A shorter design phase lowers cost and allows a more rapid response to
the market.
3. Production cost reductions: Reduced inventory, more efficient use of personnel through
improved scheduling, and faster implementation of design changes lower costs.
4. Database availability: Provides information for other manufacturing software and accurate
product data so everyone is operating from the same information, resulting in dramatic cost
reductions.
5. New range of capabilities: For instance, the abilities to rotate and depict objects in three-
dimensional form, to check clearances, to relate parts and attachments, and to improve the
use of numerically controlled machine tools all provide new capability for manufacturing.
CAD/CAM removes substantial detail work, allowing designers to concentrate on the con-
ceptual and imaginative aspects of their task.
VIRTUAL REALITY TECHNOLOGY
Virtual reality is a visual form of communication in which images substitute for the real thing
but still allow the user to respond interactively. The roots of virtual reality technology in oper-
ations are in computer-aided design. Once design information is in a CAD system, it is also in
Standard for the exchange of
product data (STEP)
A standard that provides a format allowing the electronic transmittal of three-dimensional data.
Computer-aided manufacturing
(CAM)
The use of information technology to control machinery.
Virtual reality
A visual form of communication in which images substitute for reality and typically allow the user to respond interactively.
At the Next GEN Science Fair in 2011, visitors are intrigued by advances in 3D printers and the ability to capture intricate details of objects onto paper.
4 The STEP format is documented in the European Community’s standard ISO 10303.
M05B_HEIZ4345_02_SE_C05.indd 157M05B_HEIZ4345_02_SE_C05.indd 157 09/10/15 2:58 PM09/10/15 2:58 PM

158 PART 2 Designing Operations
electronic digital form for other uses, such as developing 3-D layouts of everything from restau-
rants to amusement parks. Changes to mechanical design, restaurant layouts, or amusement park
rides are much less expensive at the design stage than later.
VALUE ANALYSIS
Although value engineering focuses on preproduction design improvement, value analysis, a
related technique, takes place during the production process, when it is clear that a new product is a
success. Value analysis seeks improvements that lead to either a better product, or a product made
more economically, or a product with less environmental impact. The techniques and advantages
for value analysis are the same as for value engineering, although minor changes in implementa-
tion may be necessary because value analysis is taking place while the product is being produced.
Ethics, Environmentally Friendly Designs, and Sustainability An operations manager’s task is to enhance productivity while delivering desired goods and ser-
vices in an ethical, environmentally sound, and sustainable way. In an OM context, sustainability
means ecological stability. This means operating a production system in a way that supports con-
servation and renewal of resources. The entire product life cycle—from design, to production,
to final destruction or recycling—provides an opportunity to preserve resources. Planet Earth
is finite; managers who squeeze more out of its resources are its heroes. The good news is that
operations managers have tools that can drive down costs or improve margins while preserving
resources. Here are examples of how firms do so:
• At the design stage: DuPont developed a polyester film stronger and thinner so it uses less
material and costs less to make. Also, because the film performs better, customers are willing
to pay more for it. Similarly, Nike’s new Air Jordan shoe contains very little chemical-based
glue and an outsole made of recycled material, yielding lower manufacturing cost and less
impact on the environment.
• At the production stage: Bristol-Myers Squibb established an environmental and pollution
prevention program designed to address environmental, health, and safety issues at all stages
of the product life cycle. Ban Roll-On was one of the first products studied and an early
success. Repackaging Ban in smaller cartons resulted in a reduction of 600 tons of recycled
paperboard. The product then required 55% less shelf space for display. As a result, not only
is pollution prevented but store operating costs are also reduced. This has also worked for the
Royal Bank of Canada, as it has launched a “Responsible Procurement Policy” that ensures
the items it purchases have taken the environment into consideration.
• At the destruction stage: The automobile industry has been very successful: The industry
now recycles more than 84% of the material by weight of 13 million cars scrapped each
year. Much of this success results from care at the design stage. For instance, BMW, with
environmentally friendly designs, recycles most of a car, including many plastic components.
Similarly, Loblaw Companies Limited was selected as one of Canada’s Greenest Employers
(2012) due in part to its waste diversion program.
These efforts are consistent with the environmental issues raised by the ISO 14000 standard , a
topic we address in Chapter 6 .
SYSTEMS AND LIFE CYCLE PERSPECTIVES
One way to accomplish programs like those at DuPont, Bristol-Myers Squibb, and BMW is
to add an ethical and environmental charge to the job of operations managers and their value
engineering/analysis teams. Team members from different functional areas working together can
present a wide range of environmental perspectives and approaches. Managers and teams should
consider two issues.
First , they need to view products from a “systems” perspective—that is, view a product in
terms of its impact on sustainability—ecological stability. This means taking a comprehen-
sive look at the inputs to the firm, the processes, and the outputs, recognizing that some of the
resources, long considered free, are in fact not free. Particulates and sulphur in the air are pollu-
tion for someone else; similarly, bacteria and phosphates in the water going downstream become
Value analysis
A review of successful products that takes place during the production process.
Sustainability
A production system that supports conservation and renewal of resources.
OM can do a lot to save our planet. Saving the planet is good business and good ethics.
AUTHOR COMMENT
M05B_HEIZ4345_02_SE_C05.indd 158M05B_HEIZ4345_02_SE_C05.indd 158 09/10/15 2:58 PM09/10/15 2:58 PM

Chapter 5 Sustainability in the Supply Chain and the Design of Goods and Services 159
someone else’s problem. In the case of the battle between styrofoam and paper containers, which
one is really “better,” and by what criteria? We may know which is more economical for the
firm, but is that one also most economical for society?
Second , operations managers must consider the life cycle of the product, that is, from design,
through production, to final disposition. This can be done via value engineering, as noted earlier,
or as a part of a life cycle assessment (LCA) initiative. LCA is part of the ISO 14000 envi-
ronmental management standard. The goal is to reduce the environmental impact of a product
throughout its life—a challenging task.
The likelihood that ethical decisions will be made is enhanced when managers maintain these
two perspectives and maintain an open dialogue among all stakeholders.
GOALS Consistent with the two issues above, goals for ethical, environment-friendly designs
are:
1. Develop safe and more environmentally sound products.
2. Minimize waste of raw materials and energy.
3. Reduce environmental liabilities.
4. Increase cost-effectiveness of complying with environmental regulations.
5. Be recognized as a good corporate citizen.
GUIDELINES The following six guidelines may help operations managers achieve ethical and
environmentally friendly designs:
1. Make products recyclable: Many firms are doing this on their own, but Canada, the United
States, and the European Union now have take-back laws that affect a variety of products,
from automobiles and tires to computers. Not only is most of a car recycled but so are over
half of the aluminum cans and a large portion of paper, plastic, and glass. In some cases, as
with tires, the manufacturer is responsible for 100% disposal.
2. Use recycled materials: Scotch-Brite soap pads at 3M are designed to use recycled plas-
tics, as are the park benches and other products made by Plastic Recycling Corporation.
Recycled plastics and old clothing are making their way into seat upholstery for the Ford
Escape hybrid sport-utility. This application has added benefits: it’s waterproof and it will
save 2.4 million litres of water, 820 000 kilograms of carbon dioxide, and more than 7 mil-
lion kilowatt hours of electricity per year. 5
3. Use less harmful ingredients: Standard Register, like most of the printing industry, has replaced
environmentally dangerous inks with soy-based inks that reduce air and water pollution.
Life cycle assessment (LCA)
Part of ISO 14000; assesses the environmental impact of a product, from material and energy inputs to disposal and environ-mental releases.
BMW uses parts made of recycled plastics and parts that can be recycled. “Green manufacturing” means companies can reuse, refur-bish, or dispose of a product’s components safely and reduce total life cycle product costs.
5 “Vehicles That Use Recycled Material,” The Wall Street Journal (January 25, 2007): D6.
M05B_HEIZ4345_02_SE_C05.indd 159M05B_HEIZ4345_02_SE_C05.indd 159 09/10/15 2:58 PM09/10/15 2:58 PM

160 PART 2 Designing Operations
4. Use lighter components: The auto and truck industries continue to expand the use of alumi-
num and plastic components to reduce weight. Mercedes is even building car exteriors from
a banana plant fibre that is both biodegradable and lightweight. Similarly, Boeing is using
carbon fibre, epoxy composites, and titanium graphite laminate to reduce weight in its new
787 Dreamliner. These changes can be expensive, but they make autos, trucks, and aircraft
more environmentally friendly by improving payload and fuel efficiency.
5. Use less energy: While the auto, truck, and airframe industries are redesigning to improve
mileage, General Electric is designing a new generation of refrigerators that require sub-
stantially less electricity during their lifetime. DuPont is so good at energy efficiency
that it has turned its expertise into a consulting business. In a similar fashion, Mountain
Equipment Co-op models good behaviour by operating under an extremely thorough
“Sustainability Agenda.”
6. Use less material: Organizations fight to drive down material use—in the plant and in the
packaging. An employee team at a Sony semiconductor plant achieved a 50% reduction
in the amount of chemicals used in the silicon wafer etching process. And Frito-Lay’s
U.S. plants have driven down water consumption over 31% in the past 10 years, with a
goal of 75% reduction by 2017. These and similar successes reduce both production costs
and environmental concerns. Likewise, Fairmont Hotels and Resorts saves water by using
low-flow shower heads, low-flush toilets, and towel exchange programs that also reduce
unnecessary laundry.
LAWS AND INDUSTRY STANDARDS Laws and industry standards can help operations managers
make ethical and socially responsible decisions. In the last 100 years, we have seen development
of legal and industry standards to guide managers in product design, manufacture/assembly, and
disassembly/disposal.
Design: On the legal side, Canadian laws and regulations such as those promulgated by the
Canadian Food Inspection Agency, the Consumer Product Safety Act, and the Highway Traffic
Act provide guidance, if not explicit law, to aid decision making. Guidance is also provided by
phrases in case law like “design for foreseeable misuse” and in regard to children’s toys, “The
concept of a prudent child is . . . a grotesque combination.”
Manufacture /assembly: The manufacture and assembly of products has standards and guide-
lines from the Canadian Centre for Occupational Health and Safety, Canadian Environmental
Assessment Agency, professional ergonomic standards, and a wide range of federal and provin-
cial laws that deal with employment standards, disabilities, discrimination, and the like.
Disassembly /disposal: Product disassembly and disposal in the United States, Canada, and
the European Union are governed by increasingly rigid laws. In the United States, the Vehicle
Recycling Partnership, supported by the auto industry, provides Design for Disassembly Standards for auto disassembly and disposal. However, in the fragmented electronics industry,
safe disposal of TVs, computers, and cell phones is much more difficult and dangerous.
Ethical, socially responsible decisions can be difficult and complex—often with no
easy answers—but such decisions are appreciated by the public, and they can save money,
material, and the environment. These are the types of win–win situations that operations
managers seek.
With increasing restrictions on disposal of TVs, cell phones, com-puters, and other electronic waste, much of such waste (left) ends its life in Guangdong province on China’s southern coast (right). Here, under less-than-ideal conditions, Chinese women strip old circuit boards to salvage the chips.
M05B_HEIZ4345_02_SE_C05.indd 160M05B_HEIZ4345_02_SE_C05.indd 160 09/10/15 2:58 PM09/10/15 2:58 PM

Chapter 5 Sustainability in the Supply Chain and the Design of Goods and Services 161
Time-Based Competition As product life cycles shorten, the need for faster product development increases. Additionally,
as technological sophistication of new products increases, so do the expense and risk. For
instance, drug firms invest an average of 12 to 15 years and $600 million before receiving reg-
ulatory approval of each new drug. And even then, only one of five will actually be a success.
Those operations managers who master this art of product development continually gain on
slower product developers. To the swift goes the competitive advantage. This concept is called
time-based competition .
Often, the first company into production may have its product adopted for use in a variety
of applications that will generate sales for years. It may become the “standard.” Consequently,
there is often more concern with getting the product to market than with optimum product
design or process efficiency. Even so, rapid introduction to the market may be good manage-
ment because, until competition begins to introduce copies or improved versions, the product
can sometimes be priced high enough to justify somewhat inefficient production design and
methods. For example, when Kodak first introduced its Ektar film, it sold for 10% to 15% more
than conventional film. Apple’s innovative iPod and new versions have a 75% market share
even after five years.
Because time-based competition is so important, instead of developing new products from
scratch (which has been the focus thus far in this chapter) a number of other strategies can be
used. Figure 5.6 shows a continuum that goes from new, internally developed products (on
the lower left) to “alliances.” Enhancements and migrations use the organization’s existing
product strengths for innovation and therefore are typically faster while at the same time being
less risky than developing entirely new products. Enhancements may be changes in colour,
size, weight, or features, such as are taking place in cellular phones (see OM in Action box,
“Chasing Fads in the Cell Phone Industry”), or even changes in commercial aircraft. Boeing’s
enhancements of the 737 since its introduction in 1967 have made the 737 the largest-
selling commercial aircraft in history. Boeing also uses its engineering prowess in air frames
to migrate from one model to the next. This allows Boeing to speed development while reduc-
ing both cost and risk for new designs. This approach is also referred to as building on prod-uct platforms . Black & Decker has used its “platform” expertise in hand-powered tools to
build a leading position in that market. Similarly, Hewlett-Packard has done the same in the
printer business. Enhancements and migrations are a way of building on existing expertise and
extending a product’s life cycle.
The product development strategies on the lower left of Figure 5.6 are internal development
strategies, while the three approaches we now introduce can be thought of as external devel-
opment strategies. Firms use both. The external strategies are (1) purchase the technology, (2)
establish joint ventures, and (3) develop alliances.
Time-based competition
Competition based on time; rapidly developing products and moving them to market.
LO4 Describe how
time-based competition is
implemented by OM
Fast communication, rapid technological change, and short product life cycles push product development.
AUTHOR COMMENT
Internal
Lengthy
High
Shared
Rapid and/or Existing
Shared
External development strategies
Product Development Continuum
Internal development strategiesMigrations of existing products
Enhancements to existing products
New internally developed products
AlliancesJoint ventures
Purchase technology or expertise
by acquiring the developer
Cost of product developmentSpeed of product developmentRisk of product development
FIGURE 5.6
Product Development
Continuum
Managers seek a variety of approaches to obtain speed to market. The president of one U.S. firm says: “If I miss one product cycle, I’m dead.”
AUTHOR COMMENT
M05B_HEIZ4345_02_SE_C05.indd 161M05B_HEIZ4345_02_SE_C05.indd 161 09/10/15 2:58 PM09/10/15 2:58 PM

162 PART 2 Designing Operations
PURCHASING TECHNOLOGY BY ACQUIRING A FIRM
Microsoft and Cisco Systems are examples of companies on the cutting edge of technology that
often speed development by acquiring entrepreneurial firms that have already developed the
technology that fits their mission. The issue then becomes fitting the purchased organization, its
technology, its product lines, and its culture into the buying firm, rather than an issue of product
development.
JOINT VENTURES
Joint ventures are combined ownership, usually between just two firms, to form a new entity.
Ownership can be 50–50, or one owner can assume a larger portion to ensure tighter control. Joint
ventures are often appropriate for exploiting specific product opportunities that may not be central
to the firm’s mission. Such ventures are more likely to work when the risks are known and can be
equitably shared. For instance, GM and Toyota formed a joint venture to produce the GM Prism
and the Toyota Corolla. Both companies saw a learning opportunity as well as a product they both
needed in the North American market. Toyota wanted to learn about building and managing a
plant in North America, and GM wanted to learn about manufacturing a small car with Toyota’s
manufacturing techniques. The risks were well understood, as were the respective commitments.
Similarly, Fuji-Xerox, a manufacturer and marketer of photocopiers, is a joint venture of Xerox,
the U.S. maker of photocopiers, and Fuji, Japan’s largest manufacturer of film.
ALLIANCES
Alliances are co-operative agreements that allow firms to remain independent but use com-
plementing strengths to pursue strategies consistent with their individual missions. When new
products are central to the mission, but substantial resources are required and sizable risk is pres-
ent, then alliances may be a good strategy for product development. Alliances are particularly
beneficial when the products to be developed also have technologies that are in ferment. For
example, Microsoft is pursuing a number of alliances with a variety of companies to deal with
the convergence of computing, the internet, and television broadcasting. Alliances in this case
are appropriate because the technological unknowns, capital demands, and risks are significant.
Similarly, three firms—Mercedes Benz, Ford Motor, and Ballard Power Systems—have formed
an alliance to develop “green” cars powered by fuel cells. However, alliances are much more
Joint ventures
Firms establishing joint ownership to pursue new products or markets.
Alliances
Co-operative agreements that allow firms to remain independ-ent, but co-operatively pursue strategies consistent with their individual missions.
In the shrinking world marketplace, innovations that appeal to customers in one region rapidly become glob-al trends. The process shakes up the structure of one industry after another, from computers to automobiles to consumer electronics.
Nowhere has this impact been greater in recent years
than in the cell phone industry. The industry sells about
1.3 billion phones each year, but product life cycle is short.
Competition is intense. Higher margins go to the innova-
tor—and manufacturers that jump on an emerging trend
early can reap substantial rewards. The swiftest Chinese
manufacturers, such as Ningbo Bird and TCL, now replace
some phone models after just six months. In the past,
Motorola, Nokia, and other industry veterans enjoyed what
are now considered long life cycles—two years. New styles
and technological advances in cell phones constantly
appear somewhere in the world. Wired, well-travelled
consumers seek the latest innovation; local retailers rush
to offer it; and telecommunication providers order it.
Contemporary cell phones may be a curvy, boxy, or
clamshell fashion item; have a tiny keyboard for quick and
easy typing or a more limited number pad for a phone;
have a built-in radio or a digital music player; have a
camera, internet access, or TV clips; function on cellular
or wireless (Wi-Fi) networks; or have games or personal
organizers. Mattel and Nokia even have Barbie phones for
preteen girls, complete with prepaid minutes, customized
ringtones, and faceplates. The rapid changes in features
and demand are forcing manufacturers into a frenzied race
to keep up or simply to pull out.
“We got out of the handset business because we
couldn’t keep up with the cycle times,” says Jeffrey Belk,
Marketing VP for Qualcomm Inc., the San Diego company
that now focuses on making handset chips.
Developing new products is always a challenge, but in
the dynamic global marketplace of cell phones, product
development takes on new technology and new markets
at breakneck speed.
Sources: Supply Chain Management Review (October 2007): 28; The Wall Street Journal (October 30, 2003): A1 and (September 8, 2004): D5; and International Business Times (March 3, 2009).
Chasing Fads in the Cell Phone Industry OM in Action
M05B_HEIZ4345_02_SE_C05.indd 162M05B_HEIZ4345_02_SE_C05.indd 162 09/10/15 2:58 PM09/10/15 2:58 PM

Chapter 5 Sustainability in the Supply Chain and the Design of Goods and Services 163
difficult to achieve and maintain than joint ventures because of the ambiguities associated with
them. It may be helpful to think of an alliance as an incomplete contract between the firms. The
firms remain separate.
Enhancements, migration, acquisitions, joint ventures, and alliances are all strategies for
speeding product development. Moreover, they typically reduce the risk associated with product
development while enhancing the human and capital resources available.
Defining a Product Once new goods or services are selected for introduction, they must be defined. First, a good or
service is defined in terms of its functions —that is, what it is to do . The product is then designed,
and the firm determines how the functions are to be achieved. Management typically has a vari-
ety of options as to how a product should achieve its functional purpose. For instance, when an
alarm clock is produced, aspects of design such as the colour, size, or location of buttons may
make substantial differences in ease of manufacture, quality, and market acceptance.
Rigorous specifications of a product are necessary to assure efficient production. Equipment,
layout, and human resources cannot be determined until the product is defined, designed, and
documented. Therefore, every organization needs documents to define its products. This is
true of everything from meat patties, to cheese, to computers, to medical procedures. In the
case of cheese, a written specification is typical. Indeed, written specifications or standard
grades exist and provide the definition for many products. For instance, cheddar cheese has a
written description that specifies the characteristics necessary for each Department of Justice
grade. A portion of the Department of Justice grade requirements for cheddar cheese is shown
in Figure 5.7 . Similarly, McDonald’s has 60 specifications for potatoes that are to be made
into french fries.
Most manufactured items as well as their components are defined by a drawing, usually
referred to as an engineering drawing. An engineering drawing shows the dimensions, toler-
ances, materials, and finishes of a component. The engineering drawing will be an item on a bill
of material. An engineering drawing is shown in Figure 5.8 . The bill of material (BOM) lists
the components, their description, and the quantity of each required to make one unit of a prod-
uct. A bill of material for a manufactured item is shown in Figure 5.9(a) . Note that subassemblies
and components (lower-level items) are indented at each level to indicate their subordinate posi-
tion. An engineering drawing shows how to make one item on the bill of material.
In the food-service industry, bills of material manifest themselves in portion-control stand-ards . The portion-control standard for Hard Rock Cafe’s hickory BBQ bacon cheeseburger is
shown in Figure 5.9(b) . In a more complex product, a bill of material is referenced on other bills
of material of which they are a part. In this manner, subunits (subassemblies) are part of the next
higher unit (their parent bill of material) that ultimately makes a final product. In addition to
being defined by written specifications, portion-control documents, or bills of material, products
can be defined in other ways. For example, products such as chemicals, paints, and petroleums
may be defined by formulas or proportions that describe how they are to be made. Movies are
defined by scripts, and insurance coverage by legal documents known as policies.
Engineering drawing
A drawing that shows the dimen-sions, tolerances, materials, and finishes of a component.
Bill of material (BOM)
A list of the components, their description, and the quantity of each required to make one unit of a product.
Before anything can be produced, a product’s functions and attributes must be defined.
AUTHOR COMMENT
Grade Requirements for Cheddar Cheese
13. (1) Cheddar cheese may be graded Canada 1 if the cheese meets the requirements
of section 4 and subsection 6(3), and
(a) its flavour and aroma are typical and desirable;
(b) its body is reasonably compact and firm;
(c) its texture is smooth;
(d) its surface is clean, smooth and unbroken;
(e) except in the case of marbled cheddar cheese, its colour is uniform and characteristic
of cheddar cheese; and
(f) the cheese is uniform in size and regular in shape.
FIGURE 5.7
Grade Requirements for
Cheddar Cheese
Source: www.justice.gc.ca (2) and 3)
[Repealed, SOR/98-216, s. 7] SOR/88-
195, s. 1; SOR/98-216, s. 7.
LO5 Describe how products and services are defined by
OM
M05B_HEIZ4345_02_SE_C05.indd 163M05B_HEIZ4345_02_SE_C05.indd 163 09/10/15 2:58 PM09/10/15 2:58 PM

164 PART 2 Designing Operations
MAKE-OR-BUY DECISIONS
For many components of products, firms have the option of producing the components them-
selves or purchasing them from outside sources. Choosing between these options is known as the
make-or-buy decision. The make-or-buy decision distinguishes between what the firm wants to
produce and what it wants to purchase . Because of variations in quality, cost, and delivery sched-
ules, the make-or-buy decision is critical to product definition. Many items can be purchased as
a “standard item” produced by someone else. Examples are the standard bolts listed on the bill of
material shown in Figure 5.9(a) , for which there will be SAE (Society of Automotive Engineers)
specifications. Therefore, there typically is no need for the firm to duplicate this specification in
another document. We discuss the make-or-buy decision in more detail in Chapter 11 .
GROUP TECHNOLOGY
Engineering drawings may also include codes to facilitate group technology. Group technology
requires that components be identified by a coding scheme that specifies the type of processing
(such as drilling) and the parameters of the processing (such as size). This facilitates standardi-
zation of materials, components, and processes as well as the identification of families of parts.
As families of parts are identified, activities and machines can be grouped to minimize setups,
routings, and material handling. An example of how families of parts may be grouped is shown
in Figure 5.10 . Group technology provides a systematic way to review a family of components to
see if an existing component might suffice on a new project. Using existing or standard compo-
nents eliminates all the costs connected with the design and development of the new part, which
is a major cost reduction. For these reasons, successful implementation of group technology
leads to the following advantages:
Make-or-buy decision
The choice between producing a component or a service and purchasing it from an outside source.
Group technology
A product and component coding system that specifies the type of processing and the parameters of the processing; it allows similar products to be grouped.
.250
.251DIA. THRU
FINEKNURL
.250
.093
5-40 TAP THRU
1/64 R X .010 DP.AFTER KNURL
.050
.055.375
.624
.625
AUX. VIEW
MARK PART NO.
REVISIONS
Tolerance Unless Specified:
DRIVE ROLLER
FULL
D. PHILLIPS
Material
Heat Treat
Finish
Scale:
Checked:
Drawn:
Date:
A-
Bryce D. JewettMachine Mfg. Co., Inc.
A 258-60 RC
Fractional:
Decimal:
1—64
+–+– .005
No. By Date
FIGURE 5.8
Engineering Drawings Such
as This One Show Dimen-
sions, Tolerances, Materials,
and Finishes
Bill of Materialfor a Panel Weldment
A 60-7R 60-17R 60-428P 60-2
A 60-72R 60-57-1A 60-402-50-1150
A 60-73A 60-74R 60-9902-50-1150
LOWER ROLLER ASSM.ROLLERPINLOCKNUT
GUIDE ASSM. REARSUPPORT ANGLEROLLER ASSEM.BOLT
GUIDE ASSM. FRONTSUPPORT WELDM’TWEAR PLATEBOLT
1111
1111
1111
(a) Hard Rock Cafe’s HickoryBBQ Bacon Cheeseburger
BunHamburger pattyCheddar cheeseBaconBBQ onionsHickory BBQ sauceBurger set Lettuce Tomato Red onion PickleFrench friesSeasoned salt11- inch plateHRC flag
18 oz.2 slices2 strips1/2 cup1 oz.
1 leaf1 slice4 rings1 slice5 oz.1 tsp.11
(b)
PANEL WELDM’T 1A 60-71
NUMBER DESCRIPTION QTY DESCRIPTION QTY
FIGURE 5.9
Bills of Material Take Differ-
ent Forms in (a) Manufactur-
ing Plant and (b) Restaurant,
but in Both Cases, the Product
Must Be Defined
Hard Rock’s recipe here serves the same purpose as a bill of material in a factory: it defines the product for production.
AUTHOR COMMENT
M05B_HEIZ4345_02_SE_C05.indd 164M05B_HEIZ4345_02_SE_C05.indd 164 09/10/15 2:58 PM09/10/15 2:58 PM
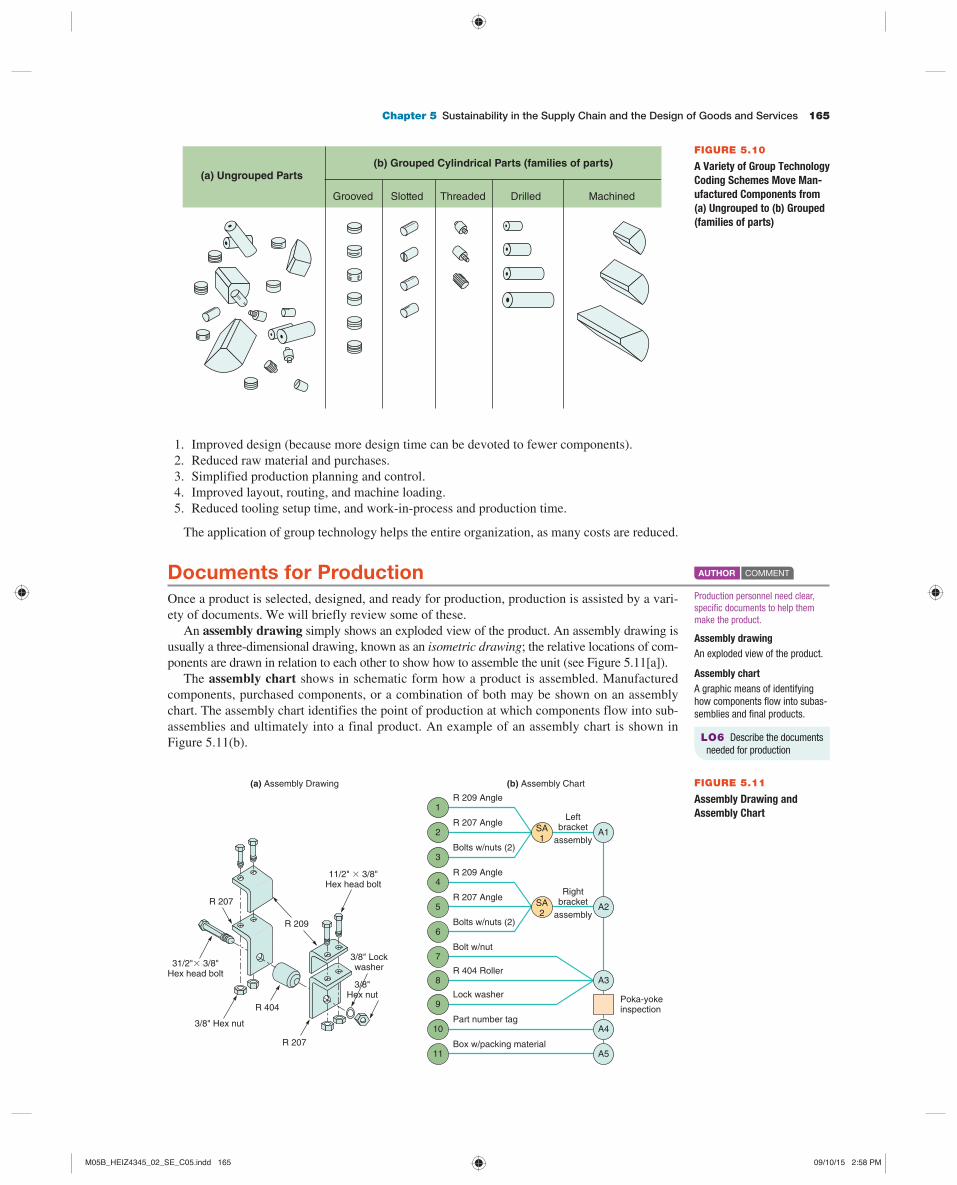
Chapter 5 Sustainability in the Supply Chain and the Design of Goods and Services 165
1. Improved design (because more design time can be devoted to fewer components).
2. Reduced raw material and purchases.
3. Simplified production planning and control.
4. Improved layout, routing, and machine loading.
5. Reduced tooling setup time, and work-in-process and production time.
The application of group technology helps the entire organization, as many costs are reduced.
Documents for Production Once a product is selected, designed, and ready for production, production is assisted by a vari-
ety of documents. We will briefly review some of these.
An assembly drawing simply shows an exploded view of the product. An assembly drawing is
usually a three-dimensional drawing, known as an isometric drawing ; the relative locations of com-
ponents are drawn in relation to each other to show how to assemble the unit (see Figure 5.11[a] ).
The assembly chart shows in schematic form how a product is assembled. Manufactured
components, purchased components, or a combination of both may be shown on an assembly
chart. The assembly chart identifies the point of production at which components flow into sub-
assemblies and ultimately into a final product. An example of an assembly chart is shown in
Figure 5.11(b) . LO6 Describe the documents needed for production
Assembly drawing
An exploded view of the product.
Assembly chart
A graphic means of identifying how components flow into subas-semblies and final products.
(a) Ungrouped Parts(b) Grouped Cylindrical Parts (families of parts)
Grooved Slotted Threaded Drilled Machined
FIGURE 5.10
A Variety of Group Technology
Coding Schemes Move Man-
ufactured Components from
(a) Ungrouped to (b) Grouped
(families of parts)
R 209 Angle
R 207 Angle
Bolts w/nuts (2)
Leftbracket
assembly
R 209 Angle
R 207 Angle
Bolts w/nuts (2)
Rightbracket
assembly
Bolt w/nut
Part number tag
R 404 Roller
Lock washer
Box w/packing material
Poka-yokeinspection
A1
A2
A3
A5
A4
(b) Assembly Chart
R 207
31/2"3 3/8"Hex head bolt
3/8" Hex nut
R 404
R 209
11/2" 3 3/8"Hex head bolt
R 207
3/8" Lockwasher
3/8"Hex nut
(a) Assembly Drawing
1
2
3
4
5
6
7
8
9
10
11
SA2
SA1
FIGURE 5.11
Assembly Drawing and
Assembly Chart
Production personnel need clear, specific documents to help them make the product.
AUTHOR COMMENT
M05B_HEIZ4345_02_SE_C05.indd 165M05B_HEIZ4345_02_SE_C05.indd 165 09/10/15 2:58 PM09/10/15 2:58 PM

166 PART 2 Designing Operations
The route sheet lists the operations necessary to produce the component with the material
specified in the bill of material. The route sheet for an item will have one entry for each operation
to be performed on the item. When route sheets include specific methods of operation and labour
standards, they are often known as process sheets .
The work order is an instruction to make a given quantity of a particular item, usually to a
given schedule. The order ticket that a waiter in your favourite restaurant writes down is a work
order. In a hospital or factory, the work order is a more formal document that provides authoriza-
tion to draw various pharmaceuticals or items from inventory, to perform various functions, and
to assign personnel to perform those functions.
An engineering change notice (ECN) changes some aspect of the product’s definition or
documentation, such as an engineering drawing or a bill of material. For a complex product that
has a long manufacturing cycle, such as a Boeing 777, the changes may be so numerous that no
two 777s are built exactly alike—which is indeed the case. Such dynamic design change has fos-
tered the development of a discipline known as configuration management, which is concerned
with product identification, control, and documentation. Configuration management is the sys-
tem by which a product’s planned and changing configurations are accurately identified and for
which control and accountability of change are maintained.
PRODUCT LIFE-CYCLE MANAGEMENT (PLM)
Product life-cycle management (PLM) is an umbrella of software programs that attempts
to bring together phases of product design and manufacture—including tying together many
of the techniques discussed in the prior two sections, Defining a Product and Documents for Production . The idea behind PLM software is that product design and manufacture decisions can
be performed more creatively, faster, and more economically when the data are integrated and
consistent.
Although there is not one standard, PLM products often start with product design (CAD/
CAM); move on to design for manufacture and assembly (DFMA); and then into product rout-
ing, materials, layout, assembly, maintenance, and even environmental issues. 6 Integration of
these tasks makes sense because many of these decisions areas require overlapping pieces of
data. PLM software is now a tool of many large organizations, including Bombardier, Lockheed
Martin, GE, Procter & Gamble, Toyota, and Boeing. Boeing estimates that PLM will cut final
assembly of its 787 jet from two weeks to three days. PLM is now finding its way into medium
and small manufacture as well.
Route sheet
A listing of the operations neces-sary to produce a component with the material specified in the bill of material.
Work order
An instruction to make a given quantity of a particular item.
Configuration management
A system by which a product’s planned and changing compo-nents are accurately identified.
Engineering change
notice (ECN)
A correction or modification of an engineering drawing or bill of material.
Product life-cycle
management (PLM)
Software programs that tie together many phases of product design and manufacture.
6 Some PLM vendors include supply chain elements such as sourcing, material management, and vendor evaluation
in their packages, but in most instances, these are considered part of the ERP systems discussed along with MRP in
Chapter 14 . See, for instance, SAP PLM ( www.mySAP.com ), Parametric Technology Corp. ( www.ptc.com ), UGS
Corp. ( www.ugs.com ), and Proplanner ( www.proplanner.com ).
Each year, the J.R. Simplot Company potato processing facilities in North America, Australia, China, and New Zealand produce billions of pounds of french fries and formed potato products for quick-service restaurants and other foodservice customers around the world (left photo). Sixty specifications (including a special blend of frying oil, a unique steaming process, and exact time and temperature for prefrying and drying) define how these potatoes become french fries. Further, 40% of all french fries must be two to three inches long, 40% must be over three inches long, and a few shorter ones constitute the final 20%. Quality control personnel use a micrometer to measure the fries (right photo).
M05B_HEIZ4345_02_SE_C05.indd 166M05B_HEIZ4345_02_SE_C05.indd 166 09/10/15 2:58 PM09/10/15 2:58 PM
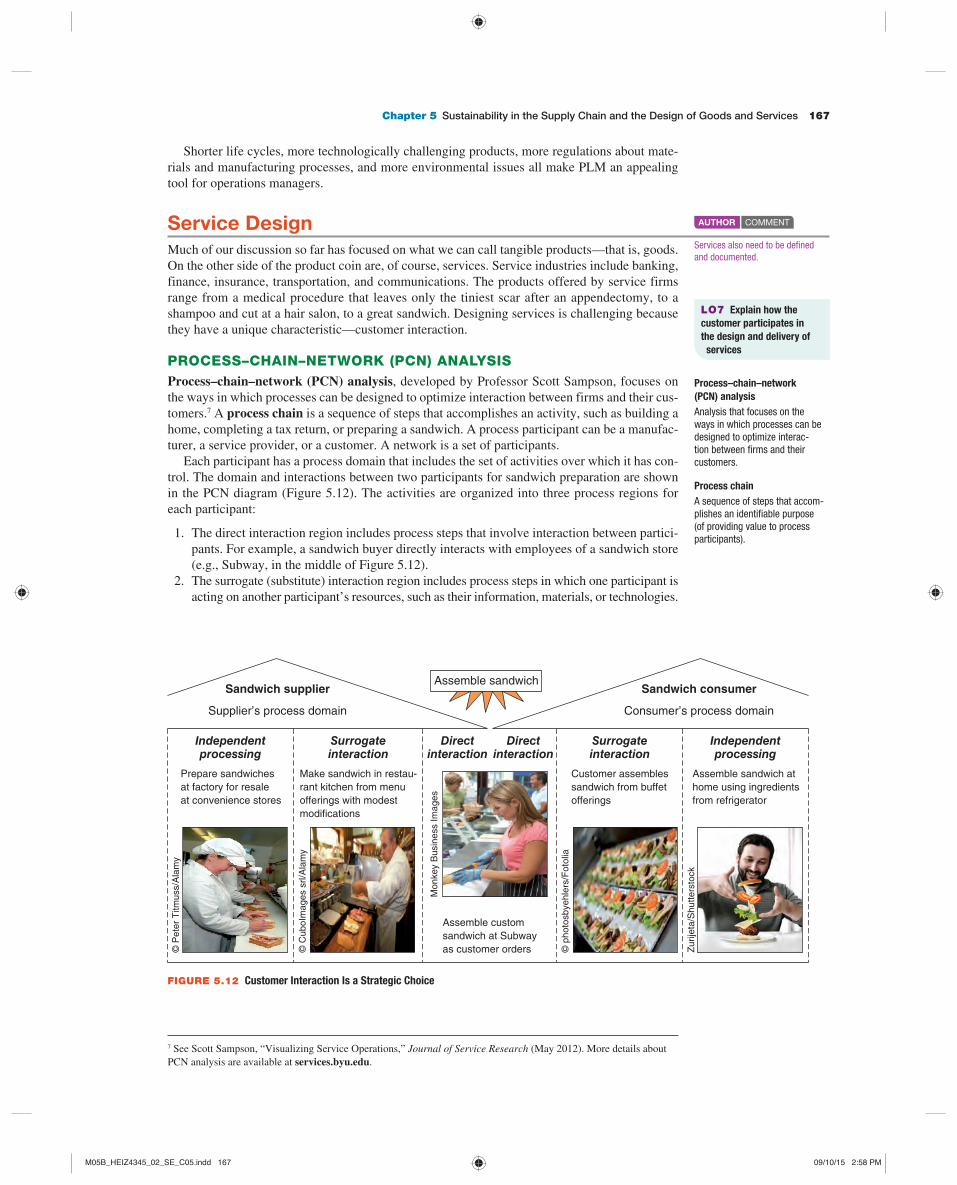
Chapter 5 Sustainability in the Supply Chain and the Design of Goods and Services 167
Shorter life cycles, more technologically challenging products, more regulations about mate-
rials and manufacturing processes, and more environmental issues all make PLM an appealing
tool for operations managers.
Service Design Much of our discussion so far has focused on what we can call tangible products—that is, goods.
On the other side of the product coin are, of course, services. Service industries include banking,
finance, insurance, transportation, and communications. The products offered by service firms
range from a medical procedure that leaves only the tiniest scar after an appendectomy, to a
shampoo and cut at a hair salon, to a great sandwich. Designing services is challenging because
they have a unique characteristic—customer interaction.
PROCESS–CHAIN–NETWORK (PCN) ANALYSIS
Process–chain–network (PCN) analysis , developed by Professor Scott Sampson, focuses on
the ways in which processes can be designed to optimize interaction between firms and their cus-
tomers. 7 A process chain is a sequence of steps that accomplishes an activity, such as building a
home, completing a tax return, or preparing a sandwich. A process participant can be a manufac-
turer, a service provider, or a customer. A network is a set of participants.
Each participant has a process domain that includes the set of activities over which it has con-
trol. The domain and interactions between two participants for sandwich preparation are shown
in the PCN diagram ( Figure 5.12 ). The activities are organized into three process regions for
each participant:
1. The direct interaction region includes process steps that involve interaction between partici-
pants. For example, a sandwich buyer directly interacts with employees of a sandwich store
(e.g., Subway, in the middle of Figure 5.12 ).
2. The surrogate (substitute) interaction region includes process steps in which one participant is
acting on another participant’s resources, such as their information, materials, or technologies.
LO7 Explain how the
customer participates in
the design and delivery of
services
Process–chain–network
(PCN) analysis
Analysis that focuses on the ways in which processes can be designed to optimize interac-tion between firms and their customers.
Process chain
A sequence of steps that accom-plishes an identifiable purpose (of providing value to process participants).
Services also need to be defined and documented.
AUTHOR COMMENT
7 See Scott Sampson, “Visualizing Service Operations,” Journal of Service Research (May 2012). More details about
PCN analysis are available at services.byu.edu .
Sandwich supplierAssemble sandwich
Supplier’s process domain
Prepare sandwiches
at factory for resale
at convenience stores
Make sandwich in restau-
rant kitchen from menu
offerings with modest
modifications
Assemble custom
sandwich at Subway
as customer orders
Customer assembles
sandwich from buffet
offerings
Assemble sandwich at
home using ingredients
from refrigerator
Independentprocessing
Independentprocessing
Surrogateinteraction
Surrogateinteraction
Directinteraction
Directinteraction
Sandwich consumer
Consumer’s process domain
© P
ete
r T
itm
uss/A
lam
y
© C
uboIm
ages s
rl/A
lam
y
Monkey B
usin
ess I
mages
© p
hoto
sbyehle
rs/F
oto
lia
Zurije
ta/S
hutters
tock
FIGURE 5.12 Customer Interaction Is a Strategic Choice
M05B_HEIZ4345_02_SE_C05.indd 167M05B_HEIZ4345_02_SE_C05.indd 167 09/10/15 2:58 PM09/10/15 2:58 PM

168 PART 2 Designing Operations
This occurs when the sandwich supplier is making sandwiches in the restaurant kitchen (left
side of Figure 5.12 ) or, alternatively, when the customer has access to buffet ingredients and
assembles the sandwich himself (right side of the figure). Under surrogate interaction, direct
interaction is limited.
3. The independent processing region includes steps in which the sandwich supplier and/or the
sandwich customer is acting on resources where each has maximum control. Most make-to-
stock production fits in this region (left side of Figure 5.12 ; think of the firm that assembles
all those prepackaged sandwiches available in vending machines and convenience stores).
Similarly, those sandwiches built at home occur to the right, in the customer’s independent
processing domain.
All three process regions have similar operating issues—quality control, facility location
and layout, job design, inventory, and so on—but the appropriate way of handling the issues
differs across regions. Service operations exist only within the area of direct and surrogate
interaction.
From the operations manager’s perspective, the valuable aspect of PCN analysis is insight
to aid in positioning and designing processes that can achieve strategic objectives. A firm’s
operations are strategic in that they can define what type of business the firm is in and what
value proposition it desires to provide to customers. For example, a firm may assume a low-cost
strategy, operating on the left of Figure 5.12 as a manufacturer of premade sandwiches. Other
firms (e.g., Subway) adopt a differentiation strategy with high customer interaction. Each of the
process regions depicts a unique operational strategy.
Firms wanting to achieve high economies of scale or more control in their operations should
probably position toward the independent processing region of their process domain. Firms
intending to provide a value offering that focuses on customization should be positioned more
toward the consumer’s process domain. PCN analysis can be applied in a wide variety of busi-
ness settings.
ADDING SERVICE EFFICIENCY
Service productivity is notoriously low, in part because of customer involvement in the design
or delivery of the service, or both. This complicates the product design challenge. We will now
discuss a number of ways to increase service efficiency and, among these, several ways to limit
this interaction.
LIMIT THE OPTIONS Because customers may participate in the design of the service (e.g., for a
funeral or a hairstyle), design specifications may take the form of everything from a menu (in a
restaurant), to a list of options (for a funeral), to a verbal description (a hairstyle). However, by
providing a list of options (in the case of the funeral) or a series of photographs (in the case of
the hairstyle), ambiguity may be reduced. An early resolution of the product’s definition can aid
efficiency as well as aid in meeting customer expectations.
DELAY CUSTOMIZATION Design the product so that customization is delayed as late in the pro-
cess as possible. This is the way a hair salon operates. Although shampoo and condition are done
in a standard way with lower-cost labour, the colour and styling (customizing) are done last. It is
also the way most restaurants operate: How would you like your meal cooked? Which dressing
would you prefer with your salad?
MODULARIZATION Modularize the service so that customization takes the form of changing
modules. This strategy allows for “custom” services to be designed as standard modular
entities. Just as modular design allows you to buy a high-fidelity sound system with just the
features you want, modular flexibility also lets you buy meals, clothes, and insurance on a
mix-and-match (modular) basis. Investments (portfolios of stocks and bonds) and education
(university and college curricula) are examples of how the modular approach can be used to
customize a service.
AUTOMATION Divide the service into small parts and identify those parts that lend themselves
to automation. For instance, by isolating cheque-cashing activity via ATM, banks have been very
effective at designing a product that both increases customer service and reduces costs. Similarly,
M05B_HEIZ4345_02_SE_C05.indd 168M05B_HEIZ4345_02_SE_C05.indd 168 09/10/15 2:58 PM09/10/15 2:58 PM

Chapter 5 Sustainability in the Supply Chain and the Design of Goods and Services 169
airlines have moved to ticketless service via kiosks. A technique such as kiosks reduces both
costs and lines at airports—thereby increasing customer satisfaction—and providing a win–win
“product” design.
MOMENT OF TRUTH High customer interaction means that in the service industry there is a
moment of truth when the relationship between the provider and the customer is crucial. At
that moment, the customer’s satisfaction with the service is defined. The moment of truth is the
moment that exemplifies, enhances, or detracts from the customer’s expectations. That moment
may be as simple as a smile from a Starbucks barista or having the checkout clerk focus on you
rather than talking over his shoulder to the clerk at the next counter. Moments of truth can occur
when you order at McDonald’s, get a haircut, or register for college courses. The operations
manager’s task is to identify moments of truth and design operations that meet or exceed the
customer’s expectations.
DOCUMENTS FOR SERVICES
Because of the high customer interaction of most services, the documents for moving the product
to production are different from those used in goods-producing operations. The documentation
for a service will often take the form of explicit job instructions that specify what is to happen
at the moment of truth. For instance, regardless of how good a pharmacy’s products may be in
terms of variety, access to brand names and generic equivalents, and so forth, if the moment of
truth is not done well, the product may be poorly received. Example 2 shows the kind of doc-
umentation a pharmacy may use to move a product (drive-up pharmacy) to “production.” In a
telemarketing service, the product design is communicated to production personnel in the form
of a telephone script , while a storyboard is used for movie and TV production.
2 Nova Scotia Pharmaceuticals wants to ensure effective delivery of service to its drive-up customers.
APPROACH c Develop a “production” document for the pharmacists at the drive-up window that
provides the information necessary to do an effective job.
SOLUTION c
EXAMPLE
Service documentation
for production
Documentation for Pharmacists at Drive-Up Windows
Customers who use the drive-up windows rather than walk up to the counter require a different
customer relations technique. The distance and machinery between the pharmacist and the customer
raises communication barriers. Guidelines to ensure good customer relations at the drive-up win-
dow are:
• Be especially discreet when talking to the customer through the microphone.
• Provide written instructions for customers who must fill out forms you provide.
• Mark lines to be completed or attach a note with instructions.
• Always say “please” and “thank you” when speaking through the microphone.
• Establish eye contact with the customer if the distance allows it.
• If a transaction requires that the customer park the car and walk up to the counter, apologize
for the inconvenience.
INSIGHT c By providing documentation in the form of a script/guideline for pharmacists, the like-
lihood of effective communication and a good product/service is improved.
LEARNING EXERCISE: c Modify the guidelines above to show how they would be different for
a drive-through restaurant. [Answer: Written instructions, marking lines to be completed, or coming
into the store are seldom necessary, but techniques for making change and proper transfer of the order
should be included.]
RELATED PROBLEM: c 5.7
M05B_HEIZ4345_02_SE_C05.indd 169M05B_HEIZ4345_02_SE_C05.indd 169 09/10/15 2:58 PM09/10/15 2:58 PM

170 PART 2 Designing Operations
Application of Decision Trees to Product Design Decision trees can be used for new-product decisions as well as for a wide variety of other man-
agement problems. They are particularly helpful when there are a series of decisions and various
outcomes that lead to subsequent decisions followed by other outcomes. To form a decision tree,
we use the following procedure:
1. Be sure that all possible alternatives and states of nature are included in the tree. This
includes an alternative of “doing nothing.”
2. Payoffs are entered at the end of the appropriate branch. This is the place to develop the
payoff of achieving this branch.
3. The objective is to determine the expected value of each course of action. We accomplish
this by starting at the end of the tree (the right-hand side) and working toward the beginning
of the tree (the left), calculating values at each step and “pruning” alternatives that are not as
good as others from the same node.
Example 3 shows the use of a decision tree applied to product design.
LO8 Apply decision trees to product issues
A decision tree is a great tool for thinking through a problem.
AUTHOR COMMENT
Silicon, Inc., a semiconductor manufacturer, is investigating the possibility of producing and mar-
keting a microprocessor. Undertaking this project will require either purchasing a sophisticated
CAD system or hiring and training several additional engineers. The market for the product could
be either favourable or unfavourable. Silicon, Inc., of course, has the option of not developing the
new product at all.
With favourable acceptance by the market, sales would be 25 000 processors selling for $100 each.
With unfavourable acceptance, sales would be only 8000 processors selling for $100 each. The cost
of CAD equipment is $500 000, but that of hiring and training three new engineers is only $375 000.
However, manufacturing costs should drop from $50 each when manufacturing without CAD, to $40
each when manufacturing with CAD.
EXAMPLE 3
Decision tree applied
to product design
$2,500,000–1,000,000– 500,000–––––––––$1,000,000
RevenueMfg. cost ($40 3 25,000)CAD cost
Net
(.4)
High sales
$800,000–320,000–500,000––––––––$20,000
RevenueMfg. cost ($40 3 8,000)CAD cost
Net loss
(.6)
Low sales
$2,500,000–1,250,000– 375,000–––––––––
$875,000
RevenueMfg. cost ($50 3 25,000)Hire and train cost
Net
(.4)
High sales
$800,000–400,000–375,000–––––––$25,000
RevenueMfg. cost ($50 3 8,000)Hire and train cost
Net
(.6)
Low sales
$0 Net
Do nothing $0
Hire and train engineers$365,000
Purchase CAD$388,000
FIGURE 5.13
Decision Tree for Develop-
ment of a New Product
The manager’s options are to purchase CAD, hire/train engineers, or do nothing. Purchasing CAD has the highest expected monetary value (EMV).
AUTHOR COMMENT
M05B_HEIZ4345_02_SE_C05.indd 170M05B_HEIZ4345_02_SE_C05.indd 170 09/10/15 2:58 PM09/10/15 2:58 PM

Chapter 5 Sustainability in the Supply Chain and the Design of Goods and Services 171
Transition to Production Eventually, a product, whether a good or service, has been selected, designed, and defined.
It has progressed from an idea to a functional definition, and then perhaps to a design.
Now, management must make a decision as to further development and production or termi-
nation of the product idea. One of the arts of modern management is knowing when to move
a product from development to production; this move is known as transition to production .
The product development staff is always interested in making improvements in a product.
Because this staff tends to see product development as evolutionary, they may never have
a completed product, but as we noted earlier, the cost of late product introduction is high.
Although these conflicting pressures exist, management must make a decision—more devel-
opment or production.
Once this decision is made, there is usually a period of trial production to ensure that the
design is indeed producible. This is the manufacturability test. This trial also gives the opera-
tions staff the opportunity to develop proper tooling, quality control procedures, and training
of personnel to ensure that production can be initiated successfully. Finally, when the product
is deemed both marketable and producible, line management will assume responsibility.
Some companies appoint a project manager ; others use product development teams to ensure
that the transition from development to production is successful. Both approaches allow a wide
range of resources and talents to be brought to bear to ensure satisfactory production of a product
that is still in flux. A third approach is integration of the product development and manufactur-ing organizations . This approach allows for easy shifting of resources between the two organ-
izations as needs change. The operations manager’s job is to make the transition from R&D to
production seamless.
The probability of favourable acceptance of the new microprocessor is 0.40; the probability of
unfavourable acceptance is 0.60.
APPROACH c Use of a decision tree seems appropriate as Silicon, Inc., has the basic ingredients:
a choice of decisions, probabilities, and payoffs.
SOLUTION c In Figure 5.13 , we draw a decision tree with a branch for each of the three decisions,
assign the respective probabilities payoff for each branch, and then compute the respective expected
monetary values (EMVs). The EMVs have been circled at each step of the decision tree. For the top
branch:
EMV (purchase CAD system) 5 (0.4)($1 000 000) 1 (0.6)(2$20 000)
5 $388 000
This figure represents the results that will occur if Silicon, Inc., purchases CAD.
The expected value of hiring and training engineers is the second series of branches:
EMV(Hire/train engineers) 5 (0.4)($875 000) 1 (0.6)($25 000)
5 $365 000
The EMV of doing nothing is $0.
Because the top branch has the highest expected monetary value (an EMV of $388 000 versus
$365 000 versus $0), it represents the best decision. Management should purchase the CAD system.
INSIGHT c Use of the decision tree provides both objectivity and structure to our analysis of the
Silicon, Inc., decision.
LEARNING EXERCISE c If Silicon, Inc., thinks the probabilities of high sales and low sales may
be equal, at 0.5 each, what is the best decision? [Answer: Purchase CAD remains the best decision, but
with an EMV of $490 000.]
RELATED PROBLEMS c 5.10, 5.11, 5.12, 5.13, 5.14, 5.15, 5.16, 5.18
ACTIVE MODEL 5.1 This example is further illustrated in Active Model 5.1 at MyOMLab.
One of the arts of management is knowing when a product should move from development to production.
AUTHOR COMMENT
M05B_HEIZ4345_02_SE_C05.indd 171M05B_HEIZ4345_02_SE_C05.indd 171 09/10/15 2:58 PM09/10/15 2:58 PM

172 PART 2 Designing Operations
Effective product strategy requires selecting, designing, and
defining a product and then transitioning that product to pro-
duction. Only when this strategy is carried out effectively can
the production function contribute its maximum to the organ-
ization. The operations manager must build a product devel-
opment system that has the ability to conceive, design, and
produce products that will yield a competitive advantage for
the firm. As products move through their life cycle (introduc-
tion, growth, maturity, and decline), the options that the oper-
ations manager should pursue change. Both manufactured
and service products have a variety of techniques available to
aid in performing this activity efficiently.
Written specifications, bills of material, and engineer-
ing drawings aid in defining products. Similarly, assembly
drawings, assembly charts, route sheets, and work orders are
often used to assist in the actual production of the product.
Once a product is in production, value analysis is appropri-
ate to ensure maximum product value. Engineering change
notices and configuration management provide product
documentation.
CHAPTER SUMMARY
Madhu Ranadive, president of Davisville Toy Company, Inc., in
Stratford, Ontario, has just reviewed the design of a new pull-toy
locomotive for one- to three-year-olds. Madhu’s design and mar-
keting staff are very enthusiastic about the market for the product
and the potential of follow-on circus train cars. The sales manager is
looking forward to a very good reception at the annual toy show in
Toronto next month. Madhu is delighted as well, since she is faced
with a layoff if orders do not improve.
Madhu’s production people have worked out the manufacturing
issues and produced a successful pilot run. However, the quality
testing staff suggests that under certain conditions, a hook to attach
cars to the locomotive and the crank for the bell can be broken off.
This is an issue because children can choke on small parts such as
these. In the quality test, one- to three-year-olds were unable to
break off these parts; there were no failures. But when the test sim-
ulated the force of an adult tossing the locomotive into a toy box
or a five-year-old throwing it on the floor, there were failures. The
estimate is that one of the two parts can be broken off four times
out of 100 000 throws. Neither the design nor the material people
know how to make the toy safer and still perform as designed. The
failure rate is low and certainly normal for this type of toy, but not
at the Six Sigma level that Madhu’s firm strives for. And, of course,
someone, someday may sue. A child choking on the broken part is
a serious matter.
The design of successful, ethically produced, new products, as
suggested in this chapter, is a complex task. What should Madhu do?
ETHICAL DILEMMA
Discussion Questions
1. Why is it necessary to document a product explicitly?
2. What techniques do we use to define a product?
3. In what ways are product strategies linked to product decisions?
4. Once a product is defined, what documents are used to assist
production personnel in its manufacture?
5. What is time-based competition?
6. Describe the differences between joint ventures and alliances.
7. Describe four organizational approaches to product develop-
ment. Which of these is generally thought to be best?
8. Explain what is meant by robust design.
9. What are three specific ways in which computer-aided design
(CAD) benefits the design engineer?
10. What information is contained in a bill of material?
11. What information is contained in an engineering drawing?
12. What information is contained in an assembly chart? In a pro-
cess sheet?
13. Explain what is meant in service design by the “moment of
truth.”
14. Explain how the house of quality translates customer desires
into product/service attributes.
15. What is meant by sustainability in the context of operations
management?
16. What strategic advantages does computer-aided design
provide?
M05B_HEIZ4345_02_SE_C05.indd 172M05B_HEIZ4345_02_SE_C05.indd 172 09/10/15 2:58 PM09/10/15 2:58 PM
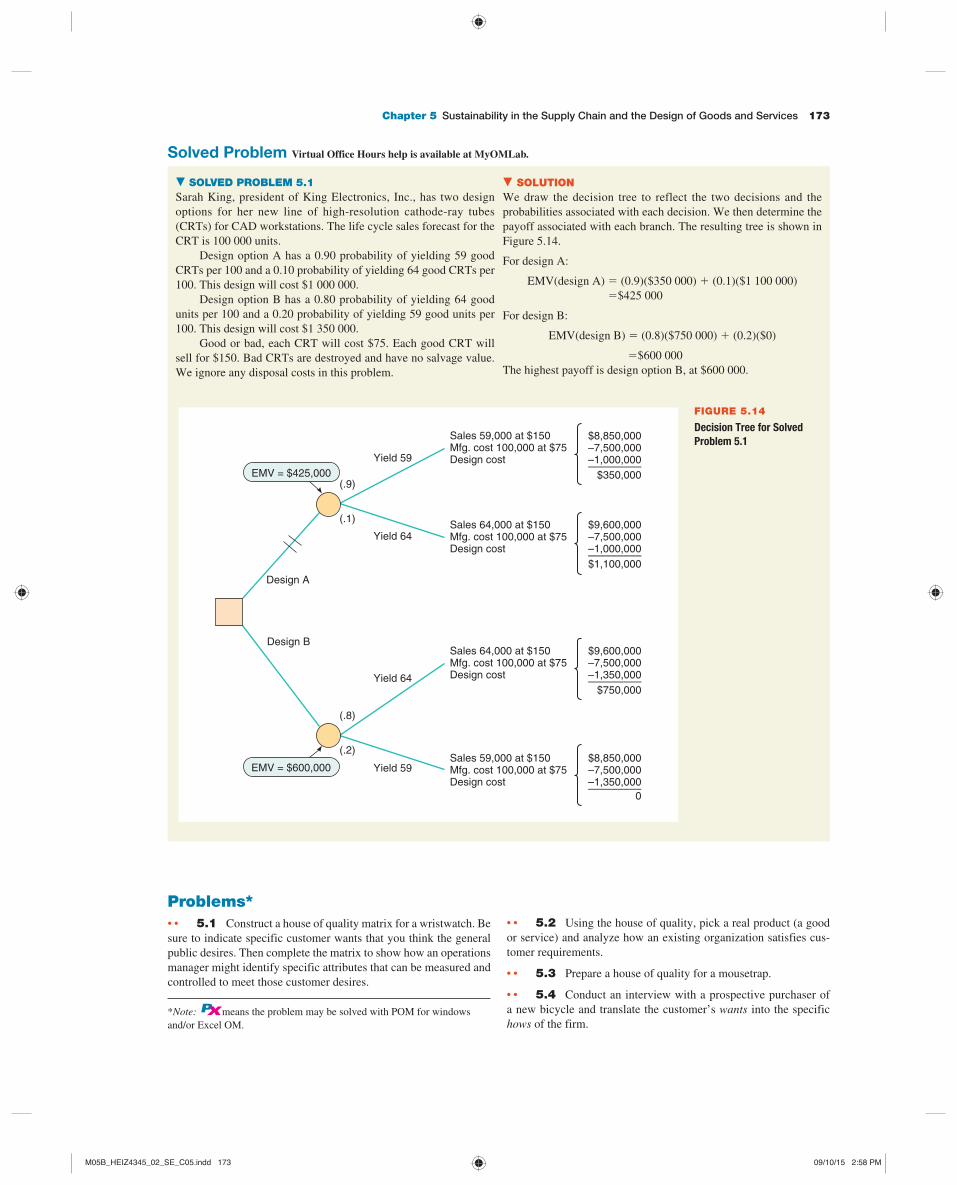
Chapter 5 Sustainability in the Supply Chain and the Design of Goods and Services 173
Solved Problem Virtual Office Hours help is available at MyOMLab.
. SOLVED PROBLEM 5.1 Sarah King, president of King Electronics, Inc., has two design
options for her new line of high-resolution cathode-ray tubes
(CRTs) for CAD workstations. The life cycle sales forecast for the
CRT is 100 000 units.
Design option A has a 0.90 probability of yielding 59 good
CRTs per 100 and a 0.10 probability of yielding 64 good CRTs per
100. This design will cost $1 000 000.
Design option B has a 0.80 probability of yielding 64 good
units per 100 and a 0.20 probability of yielding 59 good units per
100. This design will cost $1 350 000.
Good or bad, each CRT will cost $75. Each good CRT will
sell for $150. Bad CRTs are destroyed and have no salvage value.
We ignore any disposal costs in this problem.
. SOLUTION We draw the decision tree to reflect the two decisions and the
probabilities associated with each decision. We then determine the
payoff associated with each branch. The resulting tree is shown in
Figure 5.14 .
For design A:
EMV(design A) 5 (0.9)($350 000) 1 (0.1)($1 100 000)
5$425 000
For design B:
EMV(design B) 5 (0.8)($750 000) 1 (0.2)($0)
5$600 000
The highest payoff is design option B, at $600 000.
EMV = $425,000(.9)
(.1)
$8,850,000–7,500,000–1,000,000–––––––––
Sales 59,000 at $150Mfg. cost 100,000 at $75Design cost
$350,000
Yield 59
Yield 64
EMV = $600,000
(.8)
(.2)
Yield 64
Yield 59
$9,600,000–7,500,000–1,000,000–––––––––
Sales 64,000 at $150Mfg. cost 100,000 at $75Design cost
$1,100,000
$9,600,000–7,500,000–1,350,000–––––––––
Sales 64,000 at $150Mfg. cost 100,000 at $75Design cost
$750,000
$8,850,000–7,500,000–1,350,000–––––––––
Sales 59,000 at $150Mfg. cost 100,000 at $75Design cost
0
Design A
Design B
FIGURE 5.14
Decision Tree for Solved
Problem 5.1
Problems * • • 5.1 Construct a house of quality matrix for a wristwatch. Be
sure to indicate specific customer wants that you think the general
public desires. Then complete the matrix to show how an operations
manager might identify specific attributes that can be measured and
controlled to meet those customer desires.
• • 5.2 Using the house of quality, pick a real product (a good
or service) and analyze how an existing organization satisfies cus-
tomer requirements.
• • 5.3 Prepare a house of quality for a mousetrap.
• • 5.4 Conduct an interview with a prospective purchaser of
a new bicycle and translate the customer’s wants into the specific
hows of the firm. * Note: PX means the problem may be solved with POM for windows
and/or Excel OM.
M05B_HEIZ4345_02_SE_C05.indd 173M05B_HEIZ4345_02_SE_C05.indd 173 09/10/15 2:58 PM09/10/15 2:58 PM

174 PART 2 Designing Operations
• • 5.5 Prepare a bill of material for (a) a pair of eyeglasses and
its case or (b) a fast-food sandwich (visit a local sandwich shop like
Subway, McDonald’s, Mr. Submarine, Quizno’s; perhaps a clerk or
the manager will provide you with details on the quantity or weight
of various ingredients—otherwise, estimate the quantities).
• • 5.6 Draw an assembly chart for a pair of eyeglasses and its
case.
• • 5.7 Prepare a script for telephone callers at the university’s
annual “phone-a-thon” fund raiser.
• • 5.8 Prepare an assembly chart for a table lamp.
• • 5.9 Prepare a product-by-value analysis for the following
products, and given the position in its life cycle, identify the issues
likely to confront the operations manager, and his or her possible
actions. Product Alpha has annual sales of 1000 units and a contri-
bution of $2500; it is in the introductory stage. Product Bravo has
annual sales of 1500 units and a contribution of $3000; it is in the
growth stage. Product Charlie has annual sales of 3500 units and a
contribution of $1750; it is in the decline stage.
• • 5.10 Given the contribution made on each of the three prod-
ucts in the following table and their position in the life cycle, iden-
tify a reasonable operations strategy for each:
Product
Product Contribution
(% of selling price)
Company Contribution
(%: total annual contribution
divided by total annual sales)
Position in Life Cycle
Kindle 2 30 40 Growth
Netbook
computer
30 50 Introduction
Hand
calculator
50 10 Decline
• • 5.11 The product design group of Flores Electric Supplies,
Inc., has determined that it needs to design a new series of switches.
It must decide on one of three design strategies. The market
forecast is for 200 000 units. The better and more sophisticated
the design strategy and the more time spent on value engineering,
the less will be the variable cost. The chief of engineering design,
Dr. W. L. Berry, has decided that the following costs are a good
estimate of the initial and variable costs connected with each of the
three strategies:
a) Low-tech: A low-technology, low-cost process consisting of hir-
ing several new junior engineers. This option has a fixed cost of
$45 000 and variable-cost probabilities of 0.3 for $0.55 each, 0.4
for $0.50, and 0.3 for $0.45.
b) Subcontract: A medium-cost approach using a good outside
design staff. This approach would have a fixed cost of $65 000
and variable-cost probabilities of 0.7 of $0.45, 0.2 of $0.40, and
0.1 of $0.35.
c) High-tech: A high-technology approach using the very best of
the inside staff and the latest computer-aided design technol-
ogy. This approach has a fixed cost of $75 000 and variable-cost
probabilities of 0.9 of $0.40 and 0.1 of $0.35.
What is the best decision based on an expected monetary value
(EMV) criterion? ( Note: We want the lowest EMV, as we are deal-
ing with costs in this problem.)
• • 5.12 Tremblay Products, Inc., of Quebec City, has the
option of (a) proceeding immediately with production of a new top-
of-the-line stereo TV that has just completed prototype testing or
(b) having the value analysis team complete a study. If Ed Lusk, VP
for operations, proceeds with the existing prototype (option (a)), the
firm can expect sales to be 100 000 units at $550 each, with a prob-
ability of 0.6 and a 0.4 probability of 75 000 at $550. If, however,
he uses the value analysis team (option (b)), the firm expects sales
of 75 000 units at $750, with a probability of 0.7 and a 0.3 proba-
bility of 70 000 units at $750. Value analysis, at a cost of $100 000,
is used only in option (b). Which option has the highest expected
monetary value (EMV)? PX
• • 5.13 Residents of Mill River have fond memories of ice
skating at a local park. An artist has captured the experience in a
drawing and is hoping to reproduce it and sell framed copies to cur-
rent and former residents. He thinks that if the market is good, he
can sell 400 copies of the elegant version at $125 each. If the market
is not good, he will sell only 300 at $90 each. He can make a deluxe
version of the same drawing instead. He feels that if the market is
good, he can sell 500 copies of the deluxe version at $100 each. If
the market is not good, he will sell only 400 copies at $70 each. In
either case, production costs will be approximately $35 000. He can
also choose to do nothing. If he believes there is a 50% probability
of a good market, what should he do? Why? PX
• • 5.14 Ritz Products’s materials manager, Bruce Elwell, must
determine whether to make or buy a new semiconductor for the wrist
TV that the firm is about to produce. One million units are expected
to be produced over the life cycle. If the product is made, start-up
and production costs of the make decision total $1 million, with a
probability of 0.4 that the product will be satisfactory and a 0.6 prob-
ability that it will not. If the product is not satisfactory, the firm will
have to reevaluate the decision. If the decision is reevaluated, the
choice will be whether to spend another $1 million to redesign the
semiconductor or to purchase. Likelihood of success the second time
that the make decision is made is 0.9. If the second make decision
also fails, the firm must purchase. Regardless of when the purchase
takes place, Elwell’s best judgment of cost is that Ritz will pay $0.50
for each purchased semiconductor plus $1 million in vendor devel-
opment cost.
a) Assuming that Ritz must have the semiconductor (stopping or
doing without is not a viable option), what is the best decision?
b) What criteria did you use to make this decision?
c) What is the worst that can happen to Ritz as a result of this
particular decision? What is the best that can happen? PX
• • 5.15 Page Engineering designs and constructs air condi-
tioning and heating systems for hospitals and clinics. Currently, the
company’s staff is overloaded with design work. There is a major
design project due in eight weeks. The penalty for completing the
design late is $14 000 per week, since any delay will cause the facil-
ity to open later than anticipated, and cost the client significant reve-
nue. If the company uses its inside engineers to complete the design,
it will have to pay them overtime for all work. Page has estimated
that it will cost $12 000 per week (wages and overhead), including
late weeks, to have company engineers complete the design. Page is
also considering having an outside engineering firm do the design.
A bid of $92 000 has been received for the completed design. Yet
another option for completing the design is to conduct a joint design
by having a third engineering company complete all electromechan-
ical components of the design at a cost of $56 000. Page would then
complete the rest of the design and control systems at an estimated
cost of $30 000.
M05B_HEIZ4345_02_SE_C05.indd 174M05B_HEIZ4345_02_SE_C05.indd 174 09/10/15 2:58 PM09/10/15 2:58 PM
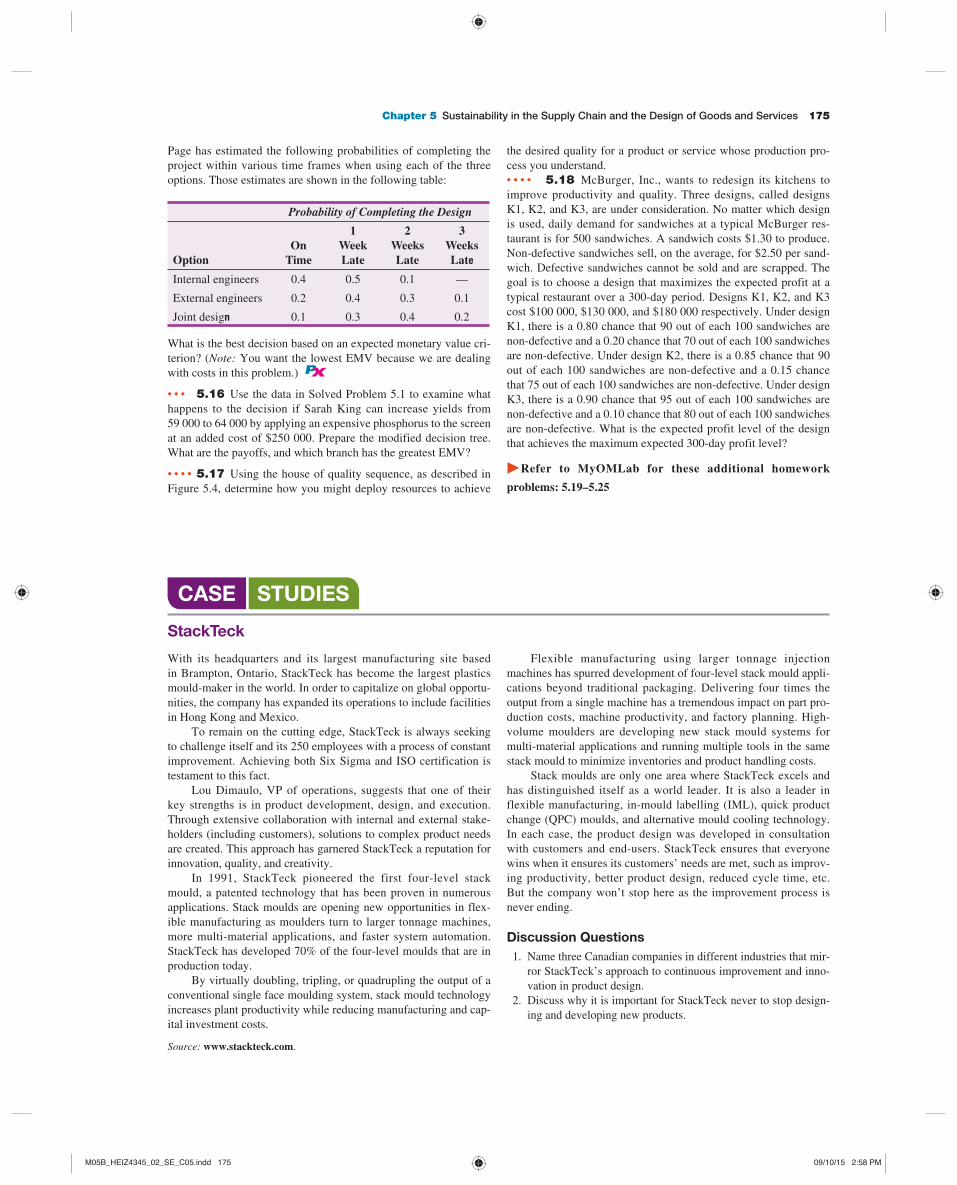
Chapter 5 Sustainability in the Supply Chain and the Design of Goods and Services 175
Page has estimated the following probabilities of completing the
project within various time frames when using each of the three
options. Those estimates are shown in the following table:
Probability of Completing the Design
OptionOn
Time
1WeekLate
2WeeksLate
3WeeksLate
Internal engineers 0.4 0.5 0.1 —
External engineers 0.2 0.4 0.3 0.1
Joint design 0.1 0.3 0.4 0.2
What is the best decision based on an expected monetary value cri-
terion? ( Note: You want the lowest EMV because we are dealing
with costs in this problem.) PX
• • • 5.16 Use the data in Solved Problem 5.1 to examine what
happens to the decision if Sarah King can increase yields from
59 000 to 64 000 by applying an expensive phosphorus to the screen
at an added cost of $250 000. Prepare the modified decision tree.
What are the payoffs, and which branch has the greatest EMV?
• • • • 5.17 Using the house of quality sequence, as described in
Figure 5.4 , determine how you might deploy resources to achieve
the desired quality for a product or service whose production pro-
cess you understand.
• • • • 5.18 McBurger, Inc., wants to redesign its kitchens to
improve productivity and quality. Three designs, called designs
K1, K2, and K3, are under consideration. No matter which design
is used, daily demand for sandwiches at a typical McBurger res-
taurant is for 500 sandwiches. A sandwich costs $1.30 to produce.
Non-defective sandwiches sell, on the average, for $2.50 per sand-
wich. Defective sandwiches cannot be sold and are scrapped. The
goal is to choose a design that maximizes the expected profit at a
typical restaurant over a 300-day period. Designs K1, K2, and K3
cost $100 000, $130 000, and $180 000 respectively. Under design
K1, there is a 0.80 chance that 90 out of each 100 sandwiches are
non-defective and a 0.20 chance that 70 out of each 100 sandwiches
are non-defective. Under design K2, there is a 0.85 chance that 90
out of each 100 sandwiches are non-defective and a 0.15 chance
that 75 out of each 100 sandwiches are non-defective. Under design
K3, there is a 0.90 chance that 95 out of each 100 sandwiches are
non-defective and a 0.10 chance that 80 out of each 100 sandwiches
are non-defective. What is the expected profit level of the design
that achieves the maximum expected 300-day profit level?
cRefer to MyOMLab for these additional homework
problems: 5.19–5.25
Source: www.stackteck.com .
StackTeck
With its headquarters and its largest manufacturing site based
in Brampton, Ontario, StackTeck has become the largest plastics
mould-maker in the world. In order to capitalize on global opportu-
nities, the company has expanded its operations to include facilities
in Hong Kong and Mexico.
To remain on the cutting edge, StackTeck is always seeking
to challenge itself and its 250 employees with a process of constant
improvement. Achieving both Six Sigma and ISO certification is
testament to this fact.
Lou Dimaulo, VP of operations, suggests that one of their
key strengths is in product development, design, and execution.
Through extensive collaboration with internal and external stake-
holders (including customers), solutions to complex product needs
are created. This approach has garnered StackTeck a reputation for
innovation, quality, and creativity.
In 1991, StackTeck pioneered the first four-level stack
mould, a patented technology that has been proven in numerous
applications. Stack moulds are opening new opportunities in flex-
ible manufacturing as moulders turn to larger tonnage machines,
more multi-material applications, and faster system automation.
StackTeck has developed 70% of the four-level moulds that are in
production today.
By virtually doubling, tripling, or quadrupling the output of a
conventional single face moulding system, stack mould technology
increases plant productivity while reducing manufacturing and cap-
ital investment costs.
Flexible manufacturing using larger tonnage injection
machines has spurred development of four-level stack mould appli-
cations beyond traditional packaging. Delivering four times the
output from a single machine has a tremendous impact on part pro-
duction costs, machine productivity, and factory planning. High-
volume moulders are developing new stack mould systems for
multi-material applications and running multiple tools in the same
stack mould to minimize inventories and product handling costs.
Stack moulds are only one area where StackTeck excels and
has distinguished itself as a world leader. It is also a leader in
flexible manufacturing, in-mould labelling (IML), quick product
change (QPC) moulds, and alternative mould cooling technology.
In each case, the product design was developed in consultation
with customers and end-users. StackTeck ensures that everyone
wins when it ensures its customers’ needs are met, such as improv-
ing productivity, better product design, reduced cycle time, etc.
But the company won’t stop here as the improvement process is
never ending.
Discussion Questions 1. Name three Canadian companies in different industries that mir-
ror StackTeck’s approach to continuous improvement and inno-
vation in product design.
2. Discuss why it is important for StackTeck never to stop design-
ing and developing new products.
CASE STUDIES
M05B_HEIZ4345_02_SE_C05.indd 175M05B_HEIZ4345_02_SE_C05.indd 175 09/10/15 2:58 PM09/10/15 2:58 PM

176 PART 2 Designing Operations
With hundreds of competitors in the boat business, Regal Marine
must work to differentiate itself. As we saw in the Global Company Profile that opened this chapter, Regal continuously introduces
innovative, high-quality new boats. Its differentiation strategy is
reflected in a product line consisting of 22 models.
To maintain this stream of innovation, and with so many boats
at varying stages of their life cycles, Regal constantly seeks design
input from customers, dealers, and consultants. Design ideas rapidly
find themselves in the styling studio, where they are placed onto
CAD machines in order to speed the development process. Existing
boat designs are always evolving as the company tries to stay stylish
and competitive. Moreover, with life cycles as short as three years, a
steady stream of new products is required. A few years ago, the new
product was the three-passenger $11 000 Rush, a small but power-
ful boat capable of pulling a water-skier. This was followed with a
6-metre inboard–outboard performance boat with so many innova-
tions that it won prize after prize in the industry. Another new boat
is a redesigned 13-metre Commodore that sleeps six in luxury state-
rooms. With all these models and innovations, Regal designers and
production personnel are under pressure to respond quickly.
By getting key suppliers on board early and urging them to
participate at the design stage, Regal improves both innovations
and quality while speeding product development. Regal finds that
the sooner it brings suppliers on board, the faster it can bring new
boats to the market. After a development stage that constitutes
concept and styling, CAD designs yield product specifications.
The first stage in actual production is the creation of the “plug,”
a foam-based carving used to make the moulds for fibreglass hulls
and decks. Specifications from the CAD system drive the carving
process. Once the plug is carved, the permanent moulds for each
new hull and deck design are formed. Moulds take about four to
eight weeks to produce and are all handmade. Similar moulds are
made for many of the other features in Regal boats—from galley
and stateroom components to lavatories and steps. Finished moulds
can be joined and used to make thousands of boats.
Discussion Questions * 1. How does the concept of product life cycle apply to Regal
Marine products?
2. What strategy does Regal use to stay competitive?
3. What kind of engineering savings is Regal achieving by using
CAD technology rather than traditional drafting techniques?
4. What are the likely benefits of the CAD design technology?
Product Strategy at Regal Marine Video Case
Main Heading Review Material MyOMLab GOODS AND SERVICES
SELECTION
(pp. 146 – 149 )
Although the term products may often refer to tangible goods, it also refers to offer-
ings by service organizations.
The objective of the product decision is to develop and implement a product strategy that meets the demands of the marketplace with a competitive advantage.
• Product decision— The selection, definition, and design of products.
The four phases of the product life cycle are introduction, growth, maturity, and
decline.
• Product-by-value analysis— A list of products, in descending order of their indi-
vidual dollar contribution to the firm, as well as the total annual dollar contribution
of the product.
Problem: 5.9
VIDEO 5.1 Product Strategy at Regal
Marine
GENERATING NEW
PRODUCTS
(pp. 149 – 150 )
Product selection, definition, and design take place on a continuing basis.
Changes in product opportunities, the products themselves, product volume, and
product mix may arise due to understanding the customer, economic change, socio-
logical and demographic change, technological change, political/legal change, market
practice, professional standards, suppliers, or distributors.
PRODUCT
DEVELOPMENT
(pp. 150 – 155 )
• Quality function deployment (QFD)— A process for determining customer
requirements (customer “wants”) and translating them into attributes (the “hows”)
that each functional area can understand and act on.
• House of quality— A part of the quality function deployment process that utilizes
a planning matrix to relate customer wants to how the firm is going to meet those
wants.
• Product development teams— Teams charged with moving from market require-
ments for a product to achieving product success.
• Concurrent engineering— Use of participating teams in design and engineering
activities.
• Manufacturability and value engineering— Activities that help improve a prod-
uct’s design, production, maintainability, and use.
CHAPTER 5 RAPID REVIEW
* You may wish to view the video that accompanies this case before
addressing these questions.
M05B_HEIZ4345_02_SE_C05.indd 176M05B_HEIZ4345_02_SE_C05.indd 176 09/10/15 2:58 PM09/10/15 2:58 PM

Chapter 5 Sustainability in the Supply Chain and the Design of Goods and Services 177
Main Heading Review Material MyOMLab ISSUES FOR PRODUCT
DESIGN
(pp. 156 – 158 )
• Robust design— A design that can be produced to requirements even with unfa-
vourable conditions in the production process.
• Modular designs— Designs in which parts or components of a product are subdi-
vided into modules that are easily interchanged or replaced.
• Computer-aided design (CAD)— Interactive use of a computer to develop and
document a product.
• Design for manufacture and assembly (DFMA)— Software that allows designers
to look at the effect of design on manufacturing of a product.
• 3-D object modelling— An extension of CAD that builds small prototypes.
• Standard for the exchange of product data (STEP)— A standard that provides a
format allowing the electronic transmission of three-dimensional data.
• Computer-aided manufacturing (CAM)— The use of information technology to
control machinery.
• Virtual reality— A visual form of communication in which images substitute for
reality and typically allow the user to respond interactively.
• Value analysis— A review of successful products that takes place during the pro-
duction process.
ETHICS,
ENVIRONMENTALLY
FRIENDLY DESIGNS,
AND SUSTAINABILITY
(pp. 158 – 161 )
• Sustainability— A production system that supports conservation and renewal of
resources.
• Life cycle assessment (LCA)— Part of ISO 14000; assesses the environmental
impact of a product from material and energy inputs to disposal and environmental
releases.
Goals for ethical, environmentally friendly designs are (1) developing safe and envi-
ronmentally sound products, (2) minimizing waste of resources, (3) reducing environ-
mental liabilities, (4) increasing cost-effectiveness of complying with environmental
regulations, and (5) being recognized as a good corporate citizen.
TIME-BASED
COMPETITION
(pp. 161 – 163 )
• Time-based competition— Competition based on time; rapidly developing prod-
ucts and moving them to market.
Internal development strategies include (1) new internally developed products, (2)
enhancements to existing products, and (3) migrations of existing products.
External development strategies include (1) purchase of the technology or expertise
by acquiring the developer, (2) establishment of joint ventures, and (3) development
of alliances.
• Joint ventures— Firms establishing joint ownership to pursue new products or
markets.
• Alliances— Co-operative agreements that allow firms to remain independent but
pursue strategies consistent with their individual missions.
DEFINING A PRODUCT
(pp. 163 – 165 )
• Engineering drawing— A drawing that shows the dimensions, tolerances, materi-
als, and finishes of a component.
• Bill of material (BOM)— A list of the components, their description, and the quan-
tity of each required to make one unit of a product.
• Make-or-buy decision— The choice between producing a component or a service
and purchasing it from an outside source.
• Group technology— A product and component coding system that specifies the
type of processing and the parameters of the processing; it allows similar products
to be grouped.
DOCUMENTS FOR
PRODUCTION
(pp. 165 – 167 )
• Assembly drawing— An exploded view of a product.
• Assembly chart —A graphic means of identifying how components flow into sub-
assemblies and final products
• Route sheet— A listing of the operations necessary to produce a component with
the material specified in the bill of material.
• Work order— An instruction to make a given quantity of a particular item.
• Engineering change notice (ECN)— A correction or modification of an engineer-
ing drawing or bill of material.
• Configuration management— A system by which a product’s planned and chang-
ing components are accurately identified.
• Product life cycle management (PLM)— Software programs that tie together
many phases of product design and manufacture.
M05B_HEIZ4345_02_SE_C05.indd 177M05B_HEIZ4345_02_SE_C05.indd 177 09/10/15 2:58 PM09/10/15 2:58 PM

178 PART 2 Designing Operations
Main Heading Review Material MyOMLab SERVICE DESIGN
(pp. 167 – 170 )
• Process–chain–network (PCN) analysis— Analysis that focuses on the ways in
which processes can be designed to optimize interaction between firms and their
customers.
• Process chain— A sequence of steps that accomplishes an identifiable purpose (of
providing value to process participants).
Techniques to reduce costs and enhance the service offering include (1) delaying
customization, (2) modularizing, (3) automating, and (4) designing for the “moment
of truth.”
APPLICATION OF
DECISION TREES TO
PRODUCT DESIGN
(pp. 170 – 171 )
To form a decision tree, (1) include all possible alternatives (including “do nothing”)
and states of nature; (2) enter payoffs at the end of the appropriate branch; and (3)
determine the expected value of each course of action by starting at the end of the
tree and working toward the beginning, calculating values at each step and “pruning”
inferior alternatives.
Problems: 5.10–5.15, 5.18
ACTIVE MODEL 5.1 Virtual Office Hours for
Solved Problem: 5.1
TRANSITION TO
PRODUCTION
(p. 171 )
One of the arts of modern management is knowing when to move a product from
development to production; this move is known as transition to production .
LO 1 A product’s life cycle is divided into four stages, including:
a) introduction. b) growth.
c) maturity. d) all of the above.
LO 2 Product development systems include:
a) bills of material. b) routing charts.
c) functional specifications. d) product-by-value analysis.
e) configuration management.
LO 3 A house of quality is:
a) a matrix relating customer “wants” to the firm’s “hows.”
b) a schematic showing how a product is put together.
c) list of the operations necessary to produce a component.
d) an instruction to make a given quantity of a particular item.
e) a set of detailed instructions about how to perform a task.
LO 4 Time-based competition focuses on:
a) moving new products to market more quickly.
b) reducing the life cycle of a product.
c) linking QFD to PLM.
d) design database availability.
e) value engineering.
LO 5 Products are defined by:
a) value analysis.
b) value engineering.
c) routing sheets.
d) assembly charts.
e) engineering drawings.
LO 6 A route sheet:
a) lists the operations necessary to produce a component.
b) is an instruction to make a given quantity of a particular item.
c) is a schematic showing how a product is assembled.
d) is a document showing the flow of product components.
e) all of the above.
LO 7 Four techniques available when a service is designed:
a) recognize political or legal change, technological change, socio-
logical demographic change, and economic change.
b) understand product introduction, growth, maturity, and decline.
c) recognize functional specifications, product specifications, design
review, and test markets.
d) ensure that customization is done as late in the process as pos-
sible, modularize the product, reduce customer interaction, and
focus on the moment of truth.
LO 8 Decision trees use:
a) probabilities. b) payoffs.
c) logic. d) options.
e) all of the above.
Self-Test
j Before taking the self-test, refer to the learning objectives listed at the beginning of the chapter and the key terms listed at the end of the chapter.
Answers: LO 1. d; LO 2. c; LO 3. a; LO 4. a; LO 5. e; LO 6. a; LO 7. d; LO 8. e.
The problems marked in red can be found on MyOMLab. Visit MyOMLab to access cases, videos, down-
loadable software, and much more. MyOMLab also features a personalized Study Plan that helps you
identify which chapter concepts you’ve mastered and guides you toward study tools for additional practice.
MyOMLab
M05B_HEIZ4345_02_SE_C05.indd 178M05B_HEIZ4345_02_SE_C05.indd 178 09/10/15 2:58 PM09/10/15 2:58 PM


![Lecture 5: Values and Objectives - ml.zmml.uni-bremen.de · Episode 2: Case Study American Apparel [Sustainability Marketing – A Global Perspective] ... Values and Objectives •](https://img.pdfslide.net/doc/110x75/5e1c3693e9a37a73920f9fee/lecture-5-values-and-objectives-mlzmmluni-episode-2-case-study-american-apparel.jpg)