Embed Size (px)
Citation preview
University of the Incarnate Word University of the Incarnate Word
The Athenaeum The Athenaeum
Theses & Dissertations
5-2015
Learning Preferences and Perceptions of Undergraduate Learning Preferences and Perceptions of Undergraduate
Mathematics Tutees Mathematics Tutees
Matthew Edward Shirley University of the Incarnate Word, [email protected]
Follow this and additional works at: https://athenaeum.uiw.edu/uiw_etds
Part of the Science and Mathematics Education Commons
Recommended Citation Recommended Citation Shirley, Matthew Edward, "Learning Preferences and Perceptions of Undergraduate Mathematics Tutees" (2015). Theses & Dissertations. 27. https://athenaeum.uiw.edu/uiw_etds/27
This Dissertation is brought to you for free and open access by The Athenaeum. It has been accepted for inclusion in Theses & Dissertations by an authorized administrator of The Athenaeum. For more information, please contact [email protected].
LEARNING PREFERENCES AND PERCEPTIONS OF UNDERGRADUATE MATHEMATICS TUTEES
by
Matthew Edward Shirley
A DISSERTATION
Presented to the Faculty of the University of the Incarnate Word in partial fulfillment of the requirements
for the degree of
DOCTOR OF PHILOSOPHY
UNIVERSITY OF THE INCARNATE WORD
May 2015

ii
Copyright by Matthew Edward Shirley
2015
iii
ACKNOWLEDGMENTS
Thank you to my committee members: Dr. Beauford, Dr. Garcia-Wukovits, and Dr.
Özturgut. You have all helped me immensely to organize my dissertation. You have all made
this process much easier for me. Thank you Mom and Dad, all of my success is due to your
support. Every year I talk to students whose parents force them into a certain career path, and
every year I am thankful that you both let me find my own place in the world. Thank you to my
wife who has kept me calm through the late nights of writing.
Matthew Edward Shirley
iv
LEARNING PREFERENCES AND PERCEPTIONS OF UNDERGRADUATE MATHEMATICS TUTEES
Matthew Edward Shirley, PhD
University of the Incarnate Word, 2015
The large number of students at postsecondary education institutions who are not college ready
has increased the need for learning assistance programs. Tutoring programs are common at many
such schools; however, the effect of tutoring students in modern schools is inconclusive. There is
some evidence that tutoring helps students learn material they would be unable to learn
otherwise, and other evidence suggests tutoring has no influence on academic performance.
Considering the lack of consistent evidence to support tutoring programs, why is there still a high
demand for them? The answer may include the students’ learning style and/or perception of the
tutoring environment. Learning style is the way the student takes in new information or the way
a student behaves in a learning experience. The learning environment includes the aesthetics and
interactions within the tutoring setting.
Not much is known about students who regularly seek out tutoring. The purpose of this
quantitative study is to investigate correlations between the number of hours spent in tutoring,
the learning styles of undergraduate mathematics students, and the perceptions these students
have of their tutoring environments. This is a quantitative study investigating correlations among
learning style, perception of the tutoring environment, and hours spent in tutoring. The students’
learning styles was measured using the Index of Learning Styles based on the Felder Silverman
Learning Style Model. The number of hours spent in tutoring, and the perception of the tutoring

v
environment was measured with a self-report survey. The data was coded using the Statistical
Package for the Social Sciences. A principle components analysis was done on the environment
measures and correlation tests were run to investigate the interaction of learning style,
environment, and hours spent in tutoring.
vi
TABLE OF CONTENTS
CHAPTER 1 UNDERGRADUATE MATHEMATICS TUTORING ..............................1
Context of the Study ............................................................................................. .1
Statement of the Problem .......................................................................................4
Purpose of the Study ...............................................................................................5
Research Questions .................................................................................................6
Significance of Study ..............................................................................................6
Theoretical Framework ..........................................................................................7
Overview of Methodology ................................................................................... 10
Limitations ........................................................................................................... 11
Definition of Terms............................................................................................... 13
CHAPTER 2 REVIEW OF LITERATURE ..................................................................... 15
History of Tutoring ............................................................................................. 15
Effects of Tutoring ............................................................................................... 18
Learning Styles ................................................................................................... 22
Learning Environment ........................................................................................ 28
Summary .............................................................................................................. 30
CHAPTER 3 METHODOLOGY ..................................................................................... 31
Research Design ................................................................................................... 31
Setting ................................................................................................................... 31
Participants ............................................................................................................ 32
vii
Table of Contents – Continued
Instruments ........................................................................................................................ 32
Protection of Human Participants ......................................................................... 34
Data Analysis ........................................................................................................ 34
CHAPTER 4 RESULTS ................................................................................................... 37
Descriptives........................................................................................................... 37
Research Questions ............................................................................................... 49
Summary of Results .............................................................................................. 85
CHAPTER 5 CONCLUSIONS ........................................................................................ 86
Discussion ............................................................................................................. 86
Limitations ............................................................................................................ 88
Implications........................................................................................................... 88
Recommendations for Future Research ................................................................ 91
REFERENCES ................................................................................................................ 94
APPENDICES ............................................................................................................... 100
Appendix A ........................................................................................................ 101
Appendix B ........................................................................................................ 102
Appendix C ........................................................................................................ 108
Appendix D ........................................................................................................ 110
viii
LIST OF TABLES
1. Frequencies of Demographic Information .................................................................. 38
2. Frequencies of Students Use of Tutoring Services ..................................................... 39
3. Frequencies of Students Who Were Only Tutored During Test Week ...................... 39
4. Frequencies of Students Who Received Mathematics Tutoring By Demographics ... 42
5. Frequency of Learning Style Scores Without Missing Data ...................................... 42
6. Frequencies of Processing Categories (Active to Reflective)..................................... 42
7. Frequencies of Input Categories (Visual to Verbal) ................................................... 44
8. Frequencies of Perception Categories (Sensory to Intuitive) ..................................... 45
9. Frequencies of Understanding Categories (Sequential to Global) .............................. 47
10. Principle Component Analysis for the Perceptions of the Tutoring Environment ..... 48
11. Crosstab Frequencies of Processing Score and Demographic Variables.................... 51
12. Crosstab Frequencies of Input Score and Demographic Variables ............................ 52
13. Crosstab Frequencies of Input Score and Demographic Variables ............................ 53
14. Crosstab Frequencies of Understanding Score and Demographic Variables ............. 54
15. Crosstab Frequencies of Processing and Whether Tutoring Was Received ............... 56
16. Chi-Square Values Between Processing and Whether Students Seek Tutoring ......... 56
17. Crosstab Frequencies of Input and Whether Tutoring Was Received ........................ 57
18. Chi-Square Values Between Input and Whether Students Seek Tutoring .................. 57
19. Crosstab Frequencies of Perception and Whether Tutoring Was Received ............... 58
20. Chi-Square Values Between Perception and Whether Students Seek Tutoring ......... 58
ix
List of Tables—Continued
21. Crosstab Frequencies of Understanding and Whether Tutoring Was Received ......... 59
22. Chi-Square Values Between Understanding and Whether Students Seek Tutoring ... 59
23. Crosstabs Frequencies of Gender and Tutoring Use ................................................... 60
24. Chi-Square Values Between Gender and Whether Students Seek Tutoring .............. 61
25. Crosstabs Frequencies of Course and Tutoring Use ................................................... 64
26. Crosstabs Frequencies of Course and Tutoring Use ................................................... 64
27. Crosstabs Frequencies of College Classification and Tutoring Use ........................... 69
28. Chi-Square Values Between College Classification and Whether Students Seek Tutoring....................................................................................................................... 69
29. Crosstabs Frequencies of Native English Speakers and Tutoring Use ....................... 70
30. Chi-Square Values Between Whether Students are Native English Speakers and Whether Students Seek Tutoring ................................................................................ 72
31. Kendall’s Tau-C Values Between Processing and Tutoring Hours ............................ 73
32. Kendall’s Tau-C Values Between Input and Tutoring Hours ..................................... 74
33. Kendall’s Tau-C Values Between Input and Tutoring Hours ..................................... 75
34. Kendall’s Tau-C Values Between Understanding and Tutoring Hours...................... 75
35. Kendall Tau-C Values Between Tutor Perceptions and Tutoring Hours ................... 76
36. Kendall Tau-C Values Between Space Perceptions and Tutoring Hours ................... 77
37. Kendall Tau-C Values Between Tutee Distraction and Tutoring Hours .................... 78
38. Kendall Tau-C Values Between Tutor Distraction and Tutoring Hours .................... 78
39. Mann Whitney U Tests On Hours Tutored Between Genders ................................... 80
40. Kruskal-Wallis Tests On Hours Tutored Among Courses ......................................... 80
x
List of Tables—Continued
41. Median Hours Tutored Outside The Math Lab During Test Week For Each Course ..................................................................................................................................... 81
42. Mann-Whitney U Tests On Hours Tutored Outside The Math Lab During Test Week Between Courses ......................................................................................................... 82
43. Kruskal-Wallis Tests On Hours Tutored Among College Classifications ................. 82
44. Mann-Whitney U Tests On Hours Tutored In The Math Lab During Test Week Between College Classifications................................................................................. 83
45. Median Hours Tutored In The Math Lab During Test Week For Each College Classification............................................................................................................... 83
46. Kruskal-Wallis Tests On Hours Tutored Among Native and Non-native English Speakers ...................................................................................................................... 84
47. Summary Of Results ................................................................................................... 85
xi
LIST OF FIGURES
1. Index of Learning Styles dimensions ............................................................................8
2. Boxplot of average hours per week tutored during test week and other than test week ............................................................................................................................ 40
3. Histogram of processing scores .................................................................................. 43
4. Histogram of input scores ........................................................................................... 44
5. Histogram of perception scores .................................................................................. 45
6. Histogram of understanding scores ............................................................................. 46
7. Histogram of perception of tutor scores...................................................................... 48
8. Histogram of perception of space scores .................................................................... 49
9. Bar graph of gender compared to use of tutoring ....................................................... 61
10. Bar graph of gender compared to use of the math lab ................................................ 62
11. Bar graph of gender compared to use of tutoring outside the math lab ...................... 62
12. Bar graph of course compared to use of tutoring ........................................................ 65 13. Bar graph of course compared to use of the math lab ................................................. 65
14. Bar graph of course compared to use of tutoring outside the math lab ...................... 66
15. Bar graph of college classification compared to use of tutoring ................................ 67
16. Bar graph of college classification compared to use of the math lab ......................... 68
17. Bar graph of college classification compared to use of tutoring outside the math
lab ................................................................................................................................ 68
18. Bar graph of native and non-native English speakers compared to tutoring use ........ 71
xii
List of Figures—Continued
19. Bar graph of native and non-native English speakers compared to use of the math lab ................................................................................................................................ 71
20. Bar graph of native and non-native English speakers compared to use of tutoring
outside the math lab .................................................................................................... 72
21. Scatterplot of processing versus hours spent in the math lab if used other than test week ............................................................................................................................ 73
22. Scatterplot of space perception score compared to tutoring hours outside of test week ............................................................................................................................ 77
1
Chapter 1: Undergraduate Mathematics Tutoring
This chapter addresses the need for learning assistance in postsecondary institutions,
followed by a brief description of the various learning assistance programs common to these
schools. Next, the particular learning assistance of tutoring will be explored. The chapter will
conclude with an examination of learning style theory and its role in education.
Context of the Study
A report by the college admissions testing service ACT (2012) found that only 24% of
the 2012 high-school graduates tested met the benchmark for college readiness in the four core
areas of English, reading, mathematics, and science (p. 4). The high number of high-school
graduates who are not considered college ready is not new. Boylan and White (1994) found the
trend of high school graduates that are not college ready dates back to the late 19th century.
Following the civil war when “an unprecedented period of growth took place in the number and
variety of higher education institutions” (p. 5), the number of unprepared students grew as these
institutions grew. ACT (2012) found only 48% of tested high-school graduates were considered
college ready in mathematics.
According to Grady and Carter (2001), there has always been a need for “some type of
instructional support for college students as they pursue their individual educational programs”
(p. 431). Learning assistance programs have been designed at the postsecondary level to support
students adjusting to the college level of work (Arendale, 2010). Post-secondary institutions offer
a variety of learning assistance such as “tutorial programs, peer study groups, study strategy
workshops, computer-based learning modules, or drop-in learning centers” (Arendale, 2010,
para. 2). These programs are intended to help students who otherwise may not succeed in post-
secondary education. Developmental courses themselves are considered learning assistance, as
2
are many “noncredit activities such as tutorial programs” (p. 1). Learning assistance in the form
of tutoring is the focus of this study.
Post-secondary tutoring in the United States was used as far back as the 1600s when
Harvard and Yale provided private tutors for students who were preparing to take entrance
exams (Arendale, 2010). Once students were admitted, each student was typically given tutors to
use throughout their studies. Tutoring was provided for many classes and for almost every
student. Other schools soon started doing the same. At the time, these postsecondary students
were typically from wealthy families; so rather than not admitting unprepared students, schools
could make more money by admitting students who were not prepared for college and providing
them with tutors.
“In many colleges today, tutoring continues to be an integral part of academic support
programs” (Rheinheimer, Grace-Odeleye, Francois, & Kusorgbor, 2010, p. 25). Providing such
services can be beneficial for both the institutions and the students (Arendale, 2010). By
providing tutoring services the schools are able to promote higher academic standards, and
increase access to their institution, while the students are able to obtain the help needed to meet
the expectations of the institution.
In spite of the long tradition of tutoring, the effect of tutoring on student achievement is
inconclusive. Many studies have reported positive effects on college student learning (Baker,
Rieg, & Clendaniel, 2006; McDuffie, Mastorpieri, & Scruggs, 2009; Topping & Watson, 1996;
Xu, Hartman, Uribe, & Mencke, 2001). However, other studies have found that tutoring students
has no significant effect (Deke, Dragoset, Bogen, & Gill 2012; Greenwood & Terry, 1993;
Kenny & Faunce, 2004).
3
The question arises as to why the demand for tutoring is still high if there is evidence to
question its effectiveness. Using student evaluations and focus groups, Dvorak (2001) found that
tutors were reported as most effective if they displayed sensitivity and caring for their students
and served as role models. From Dvorak’s study one may ask whether students continue to use
tutoring because these aspects of tutoring make students more comfortable or encourage
persistence in learning.
In Wong, Chan, Chou, Heh, Tung’s 2003 study, a human tutor, virtual tutor, or a
computerized assistance program tutored Taiwanese college tutees. The tutees reported that they
were more devoted to the human tutors, and that the human tutors challenged them the most (p.
425). The human tutors working alone provided higher flexibility and lower authority than using
computer assistance alone or a combination of the two. Subjects also reported that
communicating was more flexible when using only a human tutor. However, despite preference
for the human tutors, the subjects stated that the most effective learning was done when the tutor
was used in combination to the computer program.
Some students do not use tutoring and, in fact, prefer to learn by themselves (Dunn,
Beaudry, & Klavas, 1989). This difference in the way students prefer to learn may be explained
by learning styles. An individual’s learning style has to do with the way that person works with
the environment while learning (Popescu, 2010). Learning style is the way the student behaves
when encountering a learning experience, the way the student obtains new information or skills
(Sarasin, 1999). For example, one person’s style may include the need to discuss new concepts
with others for comprehension, while another person learns better alone. It does not mean that
these two people will not gain the same level of understanding, but how they go about getting
that understanding is different.
4
Another aspect that may have an effect on tutoring use is how students feel about a
particular tutoring environment. Many scholars recommend creating a comfortable learning
environment (Bosch, 2006; Marland & Rogers, 1997; Rabow, Chin, & Fahimian, 1999;
Simmons, 2002), but whether this makes a quantifiable difference in tutoring use is unknown.
Statement of the Problem
With the long history of tutoring and its questionable affect, not much is known about the
kind of people who voluntarily use tutoring regularly. It is unknown whether the feelings
students have about the tutors or the tutoring room has any influence on usage. The effect of a
tutoring center’s appearance on the patronage is unknown. Are students are more likely to seek
out touring if they feel the tutor is entirely dedicated to assisting them or if a tutor takes a
personal interest in the students’ lives? In addition much of the research on tutoring has been in
regards to children, rather than college students.
Lecture classes “emphasize learning by listening which may disadvantage students who
favor other learning styles” (Schwerdt & Wuppermann, 2011, p. 64). When students learn in a
way that accommodates their learning styles, they may be more confident in the subject (Briggs,
2000), enjoy learning more, or learn faster (Graf, Viola, Leo, & Kinshuk, 2007; Popescu, 2010).
In a meta-analysis of the literature, Dunn and Griggs (1995) found that accommodating students’
learning styles was more effective in mathematics than any other subject and that college
students had greater academic gains when accommodated than elementary or secondary school
learners (p. 358).
Knowledge of students’ learning styles can help teachers explain the material more
effectively (Graf, Kinshuk, & Liu, 2009). Martin-Suarez and Alarcon (2010) specifically
mentioned that there are “inconsistencies between common learning styles of the engineering
5
students and traditional teaching styles of their professors” (p. 217). If such inconsistencies are
found in engineering then there may be similar incompatibility between the way mathematics
teachers teach and the way the students learn. Briggs (2000) found that when students
understood their own learning styles, they were more confident in their academic ability (p. 22).
Lenehan, Dunn, Ingham, Signer, and Murray, (1994) found that students performed better in
mathematics when shown how best to study with their individual learning styles. The question
arises as to whether the students who seek out tutoring outside of their lecture classes prefer to
learn with a person because of a learning style. More specifically, does the strength of learning
style result in more or less time spent seeking outside tutoring? Not much is known about the
effect of aligning tutoring to learning style or if students desire tutoring due to a learning style.
Little quantifiable research has been done to explain how environment influences student
learning, particularly in the tutoring setting. In addition, there is little research as to how
important the student perceptions of the tutor and the tutoring environment influence the
frequency of use. It may seem logical that students will be more likely to attend tutoring if they
have positive feelings about the space and tutor, but whether this is the case, and to what extent it
affects the time spent in tutoring is unknown.
Purpose of the Study
The purpose of this quantitative study is to investigate correlations between the number
of hours spent in tutoring, the learning styles of undergraduate mathematics students, and the
perceptions these students have of their tutoring environments. This study investigated whether
students who seek out tutoring have similar learning styles and whether they are different from
students who do not seek tutoring. It also investigated associations between learning style and
6
demographics as well an associations between demographics and perceptions of the learning
environment.
Research Questions
This study explored the relationship between learning styles and tutoring. There are four
guiding questions for this research study.
1. How are learning styles and perceptions of the tutoring environment related to the
demographics?
2. How whether students receive mathematics tutoring is related to demographics,
learning styles, and perceptions of the tutoring environment?
3. How are hours spent in mathematics tutoring related to learning style and perceptions
of the learning environment?
4. What is the difference in hours spent in tutoring among the demographic categories?
Significance of the Study
Informing the administration of post-secondary institutions about the students who use
the tutoring recourses may have a significant impact on the institutions. This knowledge may aid
these centers in deciding how to spend their resources on training or on changing the physical
tutoring space. Tutors may also benefit from knowing the learning styles of their tutees (Briggs,
2000; Lenehan et al., 1994). Knowledge of various learning styles allows tutors to change their
explanations to accommodate a wider range of learning styles. Finally students may benefit from
knowing their own learning style. Dunn et al. (1989) said, “when permitted to learn difficult
academic information or skills through their identified preferences, children tend to achieve
statistically higher test and attitude scores than when instruction is dissonant with their
preferences” (p. 56).
7
Theoretical Framework
The theoretical framework of this study will be the Felder-Silverman Learning Style
Model (FSLSM). When the FSLSM was first published by Felder and Silverman (1988), their
goal was to understand the compatibility of learning styles with teaching styles in engineering
educational programs. They defined a learning style model as a way to classify “students
according to where they fit on a number of scales pertaining to the way they receive and process
information” (p. 684). Felder and Silverman based their model on several other theories which
will be addressed as the model is explained. The original model had five components that made
up an individual’s learning style: perception, input, processing, understanding, and organization,
which was later removed from the model. Each component is measured on a bipolar scale. These
scales are “continua, not either or categories” (Felder & Spurlin, 2005, p. 104). A learner’s
preference towards one end of the scale or the other is measured. The learner is classified as
having a preference towards one end of the scale or as having no preference towards either end.
The organization component measured whether a student was most comfortable using
induction or deduction (Felder & Silverman, 1988). A student most comfortable with induction
prefers to be given simple facts and from there to infer a general concept. A student most
comfortable with deduction prefers to be given a general principle and then apply it to various
applications. Felder found this component difficult to accurately measure and later removed it
from the model (Felder, 2002). The current model, which uses the remaining four components,
(perception, input, processing, and understanding) will be used as a framework to this study.
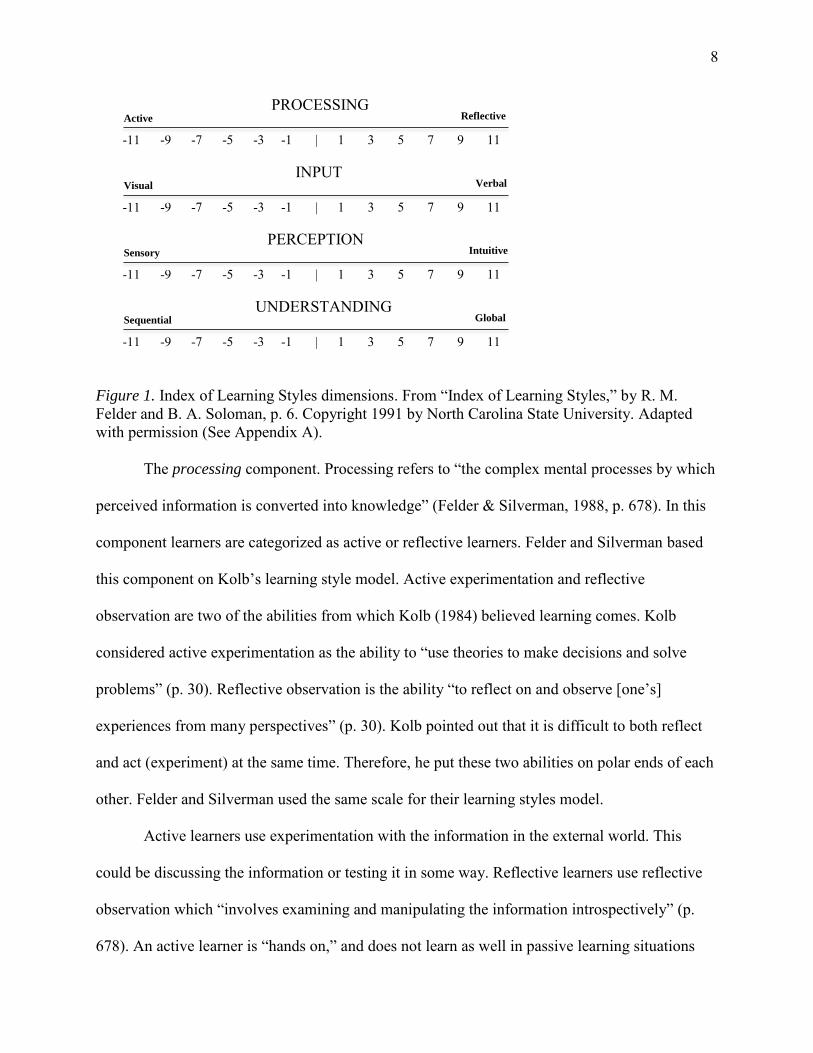
Figure 1, which is adapted from Felder and Solomon’s Index of Learning Styles (p. 6), displays
these four components with their polar ends.
8
PROCESSING
-11 -9 -7 -5 -3 -1 | 1 3 5 7 9 11
INPUT
-11 -9 -7 -5 -3 -1 | 1 3 5 7 9 11
PERCEPTION
-11 -9 -7 -5 -3 -1 | 1 3 5 7 9 11
UNDERSTANDING
-11 -9 -7 -5 -3 -1 | 1 3 5 7 9 11
Figure 1. Index of Learning Styles dimensions. From “Index of Learning Styles,” by R. M. Felder and B. A. Soloman, p. 6. Copyright 1991 by North Carolina State University. Adapted with permission (See Appendix A).
The processing component. Processing refers to “the complex mental processes by which
perceived information is converted into knowledge” (Felder & Silverman, 1988, p. 678). In this
component learners are categorized as active or reflective learners. Felder and Silverman based
this component on Kolb’s learning style model. Active experimentation and reflective
observation are two of the abilities from which Kolb (1984) believed learning comes. Kolb
considered active experimentation as the ability to “use theories to make decisions and solve
problems” (p. 30). Reflective observation is the ability “to reflect on and observe [one’s]
experiences from many perspectives” (p. 30). Kolb pointed out that it is difficult to both reflect
and act (experiment) at the same time. Therefore, he put these two abilities on polar ends of each
other. Felder and Silverman used the same scale for their learning styles model.
Active learners use experimentation with the information in the external world. This
could be discussing the information or testing it in some way. Reflective learners use reflective
observation which “involves examining and manipulating the information introspectively” (p.
678). An active learner is “hands on,” and does not learn as well in passive learning situations
Reflective Active
Verbal Visual
Intuitive Sensory
Global Sequential
9
such as lectures. Reflective learners require time to think about the information that is presented
rather than the opportunity to interact with it. Active learners work well in groups, while
reflective learners work better alone.
The input component has to do with the way learners receive information. This is similar
to Barbe, Swassing, and Milone’s (1979) modality theory (as cited in Filippidis & Tsoukalas,
2009). Felder and Silverman (1988) separated students into visual and verbal learners. Visual
learners remember information by viewing it in pictures, graphs, charts, and/or demonstrations.
Verbal learners remember best by hearing, reading, and speaking about the information.
The third component in the FSLSM is the perception component, which is based on
“Jung’s theory of psychological types” (Felder & Silverman, 1988, p. 675). Jung (1971) claimed
that sensation and intuition are two basic psychological functions. He equated sensation with the
perception of a physical stimulus. Sensation is based in bodily senses. Jung defined intuition as
that which “mediates perceptions in an unconscious way” (p. 453). With “intuition a concept
presents itself whole and complete, without our being able to explain or discover how this
content came into existence” (p. 453). Felder and Silverman (1988) used these concepts in
developing their conception styles as sensors or intuitors. Sensors prefer to work with facts, do
not mind details; they prefer to solve problems with standard algorithms. Intuitors on the other
hand prefer to work with theories, are not tolerant of details, and prefer to solve problems by
innovative methods. Sensors are “good at memorizing facts” (p. 676), while intuitors are good at
understanding new concepts. Intuitors are also more comfortable working with symbols than
sensors.
The fourth and final component to the current FSLSM is understanding (Felder &
Silverman, 1988). Understanding is categorized as sequential or global. Sequential learners must
10
follow a linear thinking process of increasing complexity. On the other hand global learners can
jump “directly to more complex and difficult material” (p. 679).
The FSLSM considers learning a two-step process: reception and processing. In the
learning process students first receive the information. The perception and input components are
included in this step. The students select to perceive information sensory or intuitively, and
which senses, visual or verbal, external information is “most effectively perceived” (Felder &
Silverman, 1988, p. 675). Next the students process the information. The processing and
understanding components are included in this step. The students select to process the
information actively or reflectively, and then progress towards understanding sequentially or
globally.
The FSLSM does not consider learning style as an unwavering, predictable pattern of
behavior. Rather “FSLSM is based on tendencies, indicating that learners with a high preference
for certain behavior can also act sometimes differently” (Graf et al., 2007, p. 81). Felder and
Spurlin (2005) point out that these preferences can also change depending on one’s experience.
Therefore, a student with a strong style for global thinking may switch towards a sequential
thinking if they are in a course which relies heavily on linear thought processes.
Overview of Methodology
This study used a quantitative research approach. A correlational methodology was used
to investigate the connections between learning style and hours per week spent in tutoring. The
participants are traditional undergraduate students enrolled in undergraduate mathematics
courses. The sample was taken from two private Hispanic-serving universities in Texas. The
tutoring takes place in university-supported mathematics tutoring centers. The instruments used
were the Index of Learning Styles (Felder & Soloman, 1991) found in Appendix B and the
11
researcher developed self-reporting survey asking the average hours per week spent in the
tutoring center found in Appendix C. In addition, the number of hours spent in tutoring facilities
other than the university sponsored tutoring center was reported.
Limitations
This study has several limitations. First, due to privacy issues, the average number of
times per week that a student seeks tutoring is self-reported. A second limitation is sample size.
The sample comes from only two postsecondary institutions and is limited to the mathematics
faculty who allow their class time to be used for the survey. A third limitation is that the tutors
all have different mathematical tutoring abilities and only tutor through calculus. These three
limitations also mean that the sample will not be a truly random sample of the institutions’ math
student population. Another limitation is the time the tutors are available. Each tutoring center
has set hours and this can limit the time a student can utilize the tutoring center. Whether the
hours of operation limited tutoring that took place outside the math labs is unknown. Another
significant limitation pointed out by Coffield, Mosely, Hall, and Ecclestone (2004) is that it is
difficult to assess the role of learning style in the learning process. Several other factors, such as
prior achievement are included in learning. Therefore, results may not be attributable to learning
style.
Other limitations are due to the Index of Learning Styles (ILS), the instrument used to
measure learning style based on the Felder-Silverman Learning Style Model (FSLSM). The ILS
is in English. Therefore any students that are not native English speakers may have difficulty
understanding the instrument. Also, the ILS has a forced choice format. Forced choice surveys
are designed to force the participant to choose one of a list of options to describe his/her
behavior, with no single choice appearing more desirable than the others (Travers, 1951). This
12
formant was developed for rating performance of personnel (Guilford, 1954). Forcing a choice
was meant to eliminate bias by asking the rater “not to say whether the ratee has a certain trait or
to say how much of a trait the ratee has but to say essentially whether he has more of one trait
than another” (p. 274). A significant limitation of forced-choice surveys that pertains to the ILS
is that it may force the participant to choose between several responses, none of which may
actually apply to the participant (Travers, 1951). For example, the question may ask whether one
prefers to read or watch television in their spare time. Some people may prefer to do a third
activity not listed. This is particularly a problem when the survey leaves out the neutral response
such as “undecided, no opinion, uncertain, or don’t know” (Friedman & Amoo, 1999, p. 116). If
the participants truly do not have preference for one of the choices, they are forced to make a
choice at random, which may skew the results.
Another limitation of forced-choice surveys identified by Travers (1951) is that the
participant cannot rank one set of items as being more characteristic than another item. For
example, a survey may measure the characteristics of communication and teamwork. A forced-
choice survey may determine whether participants communicate in writing rather than verbally,
and whether they work alone more than with teams. However, the forced-choice survey cannot
rate whether communication is more important than teamwork. This limitation is not a concern
for the ILS as each dimension measured is considered of equal importance in the FSLSM.
Definition of Terms
Tutoring. Gordon and Gordon (1990) defined tutoring as one-on-one or small group
instruction of academic subjects. For this study tutoring will include any out of class
individualized instruction.
13
Learning Style. Several scholars use the term learning style to mean different things.
This study will use Sarasin’s (1999) definition as a:
certain specified pattern of behavior and/or performance according to which the
individual approaches a learning experience, a way in which the individual takes in new
information and develops new skills, and the process by which the individual retains new
information or new skills. (p. 1)
Perception. One of the four scales to measure learning style in Felder and Silverman’s
(1988) model. This refers to the extent a student prefers perceiving information with the senses
or with intuition. Sensors are at one end of the scale and intuitors are at the other.
Sensors. Sensors are at one end of the perception scale. Learners are sensors if they are
more comfortable perceiving information by external means such as sights, sounds, and
activities.
Intuitors. Intuitors are on the opposite side of the perception scale from sensors.
Learners are intuitors if they prefer to perceive information internally through insights and
hunches. Intuitors are often able to come up with a solution but unable to explain how they came
to that solution.
Input. The second of four scales to measure learning style in Felder and Silverman’s
(1988) model. Input refers to how students prefer to receive information. At one end of the scale
are students who prefer visual data and at the other end are learners that prefer verbal data.
Visual. Learners are visual if they are most efficient at taking in visual data such as
graphs or pictures.
Verbal. Learners are verbal if they are most efficient at taking in verbal data such as
reading material and discussion.
14
Processing. The third of four scales to measure learning style in Felder and Silverman’s
(1988) model. Processing refers to how perceived information is converted into knowledge. At
one end of the scale learners are active and at the other end learners are reflective.
Active. Active learners are one end of the processing scale in Felder and Silverman’s
(1988) model. Learners are active if they prefer to process information in activities or
discussions.
Reflective. This is the polar opposite of active learners on the Felder and Silverman
processing scale. Learners are reflective if they prefers to process information through internal
introspection.
Understanding. The fourth of the four scales to measure learning style in Felder and
Silverman’s (1988) model. Understanding is the way a student progresses towards
understanding. One end of the scale is sequential and the other end is global.
Sequential. Sequential learners are on one end of the understanding scale. These learners
prefer to learn in sequential steps, leading to understanding.
Global. The polar opposite of sequential learners, these learners prefer to learn in jumps
rather than steps. Global learners may also learn holistically rather than sequentially.
15
Chapter 2: Literature Review
Many issues must be understood for this study. Tutoring was used in education for all of
recorded history (Gordon & Gordon, 1990). Evidence suggests that beginning 25 centuries ago
in Greece, tutoring was the primary form of education and has continued to be used into modern
times. Most institutions of higher education institutions today use some form of tutoring
(Rheinheimer et al., 2010, p. 24). This chapter will report the history of how tutoring has been
integrated into the western educational systems followed by what the literature states about the
effect of tutoring on academic performance. Next will be a description of learning styles, and
how the Felder-Silverman Learning Styles Model has been used in previous studies. Then a
description of the learning environment and role in learning will be presented.
History of Tutoring
Gordon and Gordon (1990) define tutoring as one-on-one or small group instruction of
academic subjects. This teaching began with tutoring oral traditions that were taught to only the
select few.
Tutoring in the East. Some of the earliest evidence for tutoring outside of schools
comes from China. The civil service exams were instituted by the Sui dynasty (581-618 AD)
(Edelman, 1991). These exams were the gateway to employment with the government. Success
in the civil service exams were the only way for the lower class to advance socially. The state
examinations had “rigorous quotas ensure[ing] that only a tiny fraction [would] pass (Spence,
1996, p. 23). Eventually these exams prompted a national school system to prepare students for
the state exams (Edelman, 1991). China financed a national school system 700 years before any
country in Europe would do the same. Although China had a national school system, according
to Lee (1999) “private classical scholars seemed to be more successful in attracting good
16
disciples,” because “private scholars often retreated to scenic sites where they admitted students
for private tutoring” (pp. 53-54).
Tutoring in Western Europe. In Greece during the 6th and 7th centuries B.C., most
education consisted of tutoring individual members of the upper class. In England from the 15th
to the 17th century, the attitude that education should be tailored to the needs of an individual
grew. English royalty used tutors to educate their children, as did other families who could afford
a private tutor. Enlightenment philosopher, John Locke, thought that private tutoring should be
used to educate all children. “Promising young teachers were in such demand as tutors for
households, that universities became seriously deprived of them as teachers” (Gordon & Gordon,
1990, p. 101). By the late 17th century private tutors were common in “aristocracy, gentry, and
rising mercantile families” (p. 135) in both England and France. Even after schools had been
established in the eighteenth century, Western Europe’s middle and upper classes still preferred
at home education by tutors or governesses.
Tutoring became prevalent in higher education by the middle of the 18th century. English
universities used tutor systems in their instructional programs. Oxford and Cambridge used
university tutors as the “principal source of instruction” during this period (Gordon & Gordon,
1990, p. 232). Collegiate instruction originally consisted of every student taking the “same
subjects at the same time of day in the same room under the same tutor” (Brubacher & Rudy,
1968, p. 83).
Tutoring in the United States. In United States tutoring was the primary source of
education in U.S. colonial times and “through the early national period” by families who could
afford it (Gordon & Gordon, 1990, p. 275). In rural areas such as the South “families were
17
scattered over such a large geographic area it was impractical to establish grammar schools” (p.
251), so tutoring at home was the only way for children to be educated.
Postsecondary education in the United States began with the founding of Harvard, the
first American university (Dvorak, 2001). Harvard had tutors for all students in particular
subjects (Gordon & Gordon, 1990). Furthermore, Yale used tutors to instruct individual students
outside of professor-run lectures. Lectures during the 18th century were used in part due to the
lack of books (Brubacher & Rudy, 1968). Lectures consisted of the professor reading his book to
the students who wrote notes on the concepts. Yale students were assigned tutors who they kept
throughout their entire program. The best Yale graduates were sought after to stay as tutors to
future students (Gordon & Gordon, 1990).
Even at the end of the frontier era around 1890, the increase in population density did not
end the use of tutors in the home. Rather, it was the obligatory school attendance laws which
slowly made the popularity of tutoring decline as a “socio-educational custom” (Gordon &
Gordon, 1990, p. 295). However, tutoring continued to be part of the education system in the
20th century. Many rural schools used peer tutoring as an educational technique. In the 1960s “as
public awareness of the tutoring process increased many parents sought private tutorial help for
their children” (p. 316), claiming that the schools were not fulfilling the academic needs of their
children.
Enrollment in postsecondary institutions more than doubled between 1970 and 2010, and
is projected to continue to increase through 2020 (Aud, Hussar, Kena, Bianco, Frohlich, Kemp,
. . . & Mallory, 2011). As postsecondary enrollment in the United States increased equal
education access programs resulted in a more diverse student population (Rheinheimer et al.,
2010). This diversity of students included students who were underprepared. Policy makers and
18
educators designed programs to increase retention of these students. As a result “today, most
higher education institutions have some form of academic support programs, most especially
tutoring” (p. 24).
A long tradition of tutoring has been documented in western education. In spite of the
wide use of tutoring, its effect on academic performance is questionable. The effect tutoring has
on students will be the subject of the next section.
Effects of Tutoring
Several studies have investigated the effects of tutoring on academic performance with
conflicting results.
Evidence that tutoring has positive effects. Beginning with students in elementary
school, Baker et al. (2006) describe an elementary school that recruited tutors from a local
university. These tutors were largely made up of elementary education majors. The tutors met
with children who were identified as being at risk of failing mathematics. Meetings lasted 90
minutes and occurred once a week. Over the course of a year, at least 72% of students improved
in mathematics (p. 289). It is important to note that this study was limited by the lack of a control
group. Therefore, it is not possible to conclude that this change in student performance correlated
with tutoring.
Menesses and Gresham (2009) had students from 2nd, 3rd, and 4th grades trained in peer
tutoring. Peer tutoring took the form of presenting math problems on flash cards and providing
correction or praise depending on the tutee’s response. These peer tutors were assigned to one of
two groups. In the first group, students were paired with one student acting as the tutor and
another as the tutee. After a while, the roles would be switched so that each student had
experience tutoring and being tutored. The second group of students was also paired but one
19
student was designated to always be the tutor and the other to always be the tutee. Each tutoring
session was performed in three minutes and ten cards were presented each session. It was found
that using either form of peer tutoring in these math classes “produced a significant increase in
math performance” (p. 272).
McDuffie et al. (2009) used peer tutoring in the form of quizzing in ten-minute sessions
for seventh grade science students. One student would ask the questions and provide feedback
while the other student would respond to the questions. “Results indicate[d] that students in the
peer tutoring condition outperformed students in traditional instruction on academic unit tests”
(p. 504). Besides academic performance tutoring has also been found to have other effects on
students. In McDuffie et al.’s study, students reported enjoying class more when peer tutoring
was used.
Topping and Watson (1996) studied secondary students. In their study 12 class hours in
an elementary calculus course were substituted with peer tutoring. Peer tutoring was used for 1
hour every other week. The tutoring sessions consisted of one student working out prepared
problems for the other student. The student not working was expected to ask questions about the
problem being presented. The students would take turns working problems of increasing
difficulty and then work together to solve new problems. Topping and Watson found that when
this form of peer tutoring was incorporated in an undergraduate calculus course, the passing rate
increased to 95% from 71% the previous year when peer tutoring was not used.
Calhoon and Fuchs (2003) initiated two programs in high school mathematics classes.
First, the Peer-Assisted Learning Strategies (PALS) program used class-wide peer tutoring to
“supplement existing math curriculum” (Calhoon & Fuchs, 2003, p. 236) peer tutoring once
again consisted of students pairing up to work together to work on math problems. The second
20
program was Curriculum-Based Measurement (CBM). The CBM is “a well-documented method
of tracking and enhancing performance of students with disabilities” (p. 236). The CBM
provides ways for teachers to “routinely monitor students’ progress toward annual curricular
goals” (p. 236). Both PALS and CBM were implemented together in high school mathematics
courses for students with disabilities. The program did not produce any significant changes in
academic performance, but “students reported that they liked working with a partner” (p. 241),
and believed that it made them “work harder in math” (p. 241). Although it was not explained
what was meant by “working harder,” it seems that working with a tutor may influence the
amount of time or effort these students put into math. Similarly, Topping and Watson (1996)
found that peer tutoring increased student confidence and engagement in learning mathematics
(para. 47).
Tutoring can also benefit teachers. Walker (2007) observed that at a particular high
school “most students seemed to have little confidence in mathematics when working
individually on problems they needed constant verification of their process and reassurance from
their instructors” (p. 59). Tutoring services can help shorten some of the time this verification
and reassurance takes as students seek help from other sources (Menesses & Gresham, 2009).
Xu et al. (2001) examined the effects of a voluntary drop-in tutoring service for a college
algebra course; students using the service scored lower on the common final exam than students
who did not use the tutoring service. However, when taking “math placement level, SAT score,
and high school GPA” (para. 10) into account, it was found that tutoring did have a positive
effect on final exam score. Furthermore, “attending tutoring made the strongest difference for
those students who were at a below average level on the SAT” (para. 10). Hendriksen, Yang,
21
Love, and Hall (2005) also examined college students who sought out tutoring at a learning
center and found the majority of tutees believed their grades had improved (p. 61).
Evidence that tutoring has no effect. Although studies such as the ones mentioned
above have suggested tutoring improves academic performance, other studies have found that
tutoring has no effect on academic performance. Kenny and Faunce (2004) found “coaching
intended for secondary school students to improve performance in end-of-year examinations in
English, mathematics, or science is generally ineffective” (p. 124). In McDuffie et al.’s study
although the tutoring group performed better on unit tests, no difference between the tutoring and
non-tutoring groups on cumulative posttests was found. This suggests that tutoring may not have
any long-term effects on learning. In addition, Dvorak (2001) found that when college students
were tutored over the course of a semester, the tutoring did not foster independent learning (p.
42).
Some scholars believe it is not possible to attribute academic performance to tutoring.
Maxwell (1994) states it is difficult to show that students who obtain the most hours of tutoring
earn the higher grades because these students who seek out the most tutoring are typically the
weakest students. That is, the stronger students may earn the higher grades without tutoring.
Baker et al. (2006) also point out that there are too many variables at work to credit
tutoring for academic improvement. For example, while students are receiving tutoring, they are
also learning material in the classroom. In addition, most students “have access to and are
strongly encouraged to utilize alternate academic support services like instructor office hours,
academic counseling, and learning support workshops” (Xu et al., 2001, para. 7). Therefore, it is
impossible to credit any academic improvement to tutoring alone.
22
Tutoring may not have any effect on academic performance, yet the demand for tutoring
remains. The difficulty of the material may have nothing to do with desire for tutoring. Lee
(2007) found that classroom instruction had no effect on the demand for tutoring. Furthermore,
Powers and Rock (1999) found that students who seek tutoring tend to be high academic
achievers, so their academic ability may have already been high before tutoring. Powers and
Rock’s study conflicts with Maxwell’s (1994) study which claimed that weak students were the
ones using tutoring. The results from Powers and Rock (1999) imply that students seeking
tutoring are not necessarily the students who have the most difficulty with the material, but there
may be something about tutoring that they enjoy. These students may have learning styles in
common, which will be addressed in the next section.
Learning Styles
The way an individual learns is influenced by several factors, particularly how a learner
“interacts with and responds to the learning environment” (Popescu, 2010, p. 243). Sarasin
(1999) defines a learning style as a:
certain specified pattern of behavior and/or performance according to which the
individual approaches a learning experience, a way in which the individual takes in new
information and develops new skills, and the process by which the individual retains new
information or new skills. (p. 1)
Exploring learning styles. Dunn et al. (1989) believed that some characteristics which
make up a student’s learning style are biological (such as sensitivity to temperature), while
others develop over time (such as motivation to complete learning tasks). Personality contributes
significantly to learning style (Sarasin, 1999). An outgoing person “may need interaction with
23
others to process information adequately enough to apply it, while more reserved student may
learn better away from other students” (p. 34).
Each learning style is unique to the individual; hence, a great diversity of learning styles
exist (Sarasin, 1999). Correlational studies done with children have found that learning style
differs among students of the same age or grade; of similar achievements, interests, or talents;
and even differs within families (Dunn et al., 1989). This diversity increases as students age
(Sarasin, 1999). By adulthood students have typically “developed and adapted in unique ways
throughout their years” (p. 3) of education. As a result, adults are usually more comfortable with
their way to learn and may have more difficulty adapting to a variety of teaching strategies than
younger learners. This can lead to frustration, and resignation to failure in the adult learner.
Therefore, Sarasin asserts that it can be particularly beneficial for teachers of postsecondary
institutions to understand basic learning styles.
It is important to note that there is a difference between learning style and learning
flexibility (Pashler, McDaniel, Rohrer, & Bjork, 2008). That is, students may learn better if
information is presented in written format rather than orally, but that does not mean they are
unable to learn from orally presented information. Therefore, even if postsecondary educators do
not accommodate particular learning styles, it does not mean that the students cannot master the
material.
It is also important to note that a common misconception is to equate learning style with
intelligence (Gardner, 1999). Howard Gardner, who developed the theory of multiple
intelligences, defined intelligence as “the ability to solve problems or to create products that are
valued within one or more cultural settings” (p. 33). Later he redefined it as “a biopsychological
24
potential to process information that can be activated in a cultural setting to solve problems or
create products that are of value in a culture” (p. 33-34).
Although understanding intelligences can help one understand the process of learning, the
multiple intelligence theory is not a learning style (Sarasin, 1999). However, Garner (1999)
explains that a learning style is an approach that a learner uses to a wide range of content, while
intelligence is the capacity for a specific content. For example, if a person’s learning style has an
auditory trait, then they typically learn best from hearing information. This student has the
potential to learn mathematics or languages by hearing the information. Therefore, the student
approaches two different intelligences with the same learning style.
Popescu (2010) reported that there has been a great interest in learning styles over the
past 30 years. According to Briggs (2000), in the past the obligation for understanding the
material had been with the learner. That is, the students were responsible for adapting to each
teacher’s teaching style. However, there has been a slow shift towards the obligation being with
the educators to be more aware and adaptive to the learning styles of individual students.
Learning styles’ influence on education. Some scholars claim that adapting to a
student’s learning style increases academic performance. Al-Balhan (2007, p. 47) found that
among middle school children in Kuwait, students performed better when teachers addressed
learning styles. Dunn, Sklar, Beaudry, and Bruno (1990) found that minority college students
performed better in mathematics when taught in accordance with a particular learning style (p.
287). Lenehan et al., (1994) tutored freshmen/transfer nursing students how to best study in
accordance with their individual learning styles. These students performed better than the
students in the control group (pp. 463-464). Sarasin (1999) explained that one reason for
increased performance is because one’s learning style includes the “amount of stimuli a person
25
can accept and still learn. . . . Learning will increase if the outside stimuli matches the amount
that a certain learning style requires or can accept” (p. 34).
In addition to possible improved performance, evidence suggests that accommodating
styles may have other benefits. Unlike Al-Balhan (2007), Briggs (2000) studied the effects of
learning style on British college students. Briggs found that when students understood their own
learning style they were more confident in their academic ability (p. 22). Other reported benefits
of learning style accommodation include increased efficiency of time needed for studying,
enjoyment, better motivation (Popescu, 2010), reduced anxiety while learning (Lenehan et al.,
1994), and less difficulty in learning (Graf et al., 2009; Popescu, 2010). Some studies also
suggest that students learn faster when their styles are accommodated (Graf et al., 2007, p. 126;
Popescu, 2010, p. 251).
Many people do not understand what learning styles are and what they are not. Pashler et
al. (2008) cautioned parents not to credit their children’s failure to learn on the institution’s
approach. He affirmed that learning styles have nothing to do with ability. In addition, some
scholars who claim the benefits of accommodating learning style listed above are questionable.
Pashler et al. found no evidence to “provide adequate support for learning-style assessments in
school settings” (p. 116). Coffield et al. (2004) mentioned that several factors contribute to the
learning process. Therefore, assessing the role that learning styles take is problematic; hence, it is
difficult to attribute increased performance and speed of learning to accommodation to style.
Learning style models. A major criticism of learning style theory is that there is no
universally accepted learning style model (Popescu, 2010). Rather, a great number of learning
style models exist, many of which have overlapping components. Coffield et al. (2004) examined
71 such models and admitted that this did not include all the models in the literature. Coffield et
26
al. classified these 71 models into five families: constitutionally based, cognitive structures,
stable personality type, learning approaches/strategies of learning, and flexibly stable learning
preferences.
Constitutionally based learning style models assume that styles are fixed or at least
extremely difficult to change (Coffield et al., 2004). Cognitive based models consider styles as a
basis for behavior towards learning. These models assume that “cognitive styles are deeply
embedded in personality structure” (p. 36). Consequently, learning style models in the cognitive
based family link the way people think to personality features. The stable personality trait family
is interested in what makes up a stable personality type. Theorists using such models believe that
learning style is “one part of the observable expression of a relatively stable personality type” (p.
46). Learning approaches/strategies of learning family of models considers an individual’s way
of learning to be an approach or strategy which takes previous experience and context into
account. Theorists working under this family use the terms “learning strategy” or “learning
approach” rather than learning style. They do this to distance themselves from previous ideas of
learning styles. The flexibly stable learning preferences are based on the idea that “a learning
style is not a fixed trait, but a differential preference for learning, which changes slightly from
situation to situation” (p. 60). Even though learners’ styles can change between situations, the
changes they make are stable. Felder-Silverman’s Learning Styles Model (FSLSM) falls under
this model of learning style, and will be discussed in the next section.
Felder-Silverman Learning Style Model. Coffield et al. (2004) categorized the FSLSM
as a flexibly stable learning preference. That is the FSLSM does not consider learning style
fixed, but rather as preferences that change depending on the situation (Felder & Spurlin, 2005).
27
The FSLSM has four components: perception, input, processing, and understanding
(Felder & Silverman, 1988). These components will be measured with the Index of Learning
Styles (ILS) (Felder & Spurlin, 2005). The ILS has been established as reliable and valid when
administered to college students and older individuals (Felder & Spurlin, 2005). Graf et al.
(2007) claimed, “the ILS is an often used and well investigated instrument to identify learning
styles” (p. 83). Furthermore, the FSLSM and ILS have been used in other educational studies
(Filippidis & Tsoukalas, 2009; Graf et al. 2009; Marin-Suarez & Alarcon, 2010). Filippidis and
Tsoukalas (2009) used the ILS to find the learning styles of students, then had their adaptive
educational system present more detailed versions of the course to sequential learners, and less
detailed to global learners. Over 70% of students in their pilot study found their adaptive
educational system helpful when it tailored their sequential/global learning styles (p. 148). Graf
et al. (2009) used the FSLSM’s classifications as basis for their tool, Detecting Learning Styles
(DeLeS), for detecting learning styles. Rather than testing students’ direction Graf et al.’s tool
determines learning style through analysis of student behavior observed by teachers. The
researchers had students take the ILS and had them analyzed with the DeLeS. They found the
results from the DeLeS were accurate over 73% of the time (p. 9). Marin-Suarez and Alarcon
(2010) used the FSLSM to classify physics students to better understand if learning style
influences the conceptual learning of physics. The results indicated that students were mostly
verbal and global learners (p. 220).
There has been, and continues to be, an interest in understanding learning styles in
education. Although some studies have shown evidence that students learn more effectively
when taught in a way that accommodates their styles, others studies have found contradictory
28
evidence. A plethora of models are used to categorize students into different learning styles. No
one model is considered the standard in education.
Learning Environment
Much has been written about learning environments of the classroom (Bosch, 2006; Dale,
1972; Emmer & Evertson, 2009; Simmons, 2002; Verduin, Miller, & Greer, 1977). Less has
been written about the learning environment of tutoring. Much of the information about learning
environments is in the form of experts suggesting the best way to create the learning
environment and not how students perceive their learning environments. According to Beer and
Darkenwald (1989) “the perceptions and reactions of students to their educative experiences are
especially salient” (p. 34).
The literature on learning environments is divided into two parts: the physical space, and
the interactions among the students/instructors. In regards to the physical learning space, Emmer
and Evertson (2009) suggested arranging students’ positions so they face away from “potential
sources of distraction such as windows, the doorway . . . or eye-catching displays” (p. 5). People
are exposed to “an enormous amount of incoming stimuli” (Gall, Gall, Jacobsen, & Bullock,
1990, p. 16). It is impossible to address all of the stimuli, so it is important to reduce the external
stimuli in the learning environment. Dale (1972) pointed out that “learning involves a creative
interaction between the stimulus and the individuals response” (p. 16), so the environment with
which the learner interacts with must be taken into account.
Another aspect of minimizing distractions is background noise. Cassidy and Macdonald
(2007) found that cognitive task performance was worse while background noise or music was
present than in silence. There is some quantitative support for a proper learning environment.
29
Reese and Dunn (2008) found that high school students with the lowest grade point averages had
a preference for “music or conversation while concentrating” (p. 105).
Besides minimizing distractions the classroom should be arranged so that students can
“see all of the significant instructional tools, such as the chalkboard” (Simmons, 2002, p. 162)
and the instructors have all necessary materials within reach. Bosch (2006) made the additional
suggestion that the physical environment should minimize distractions but should also “make
students enjoy coming to class” (p. 7). This includes making the room “bright and welcoming”
(p. 7) and adjusting the temperature to a comfortable setting. In their study, Reese and Dunn
(2008) found that students with the higher grade point averages had a preference for studying
with bright light. The comfort of the room should also be taken into consideration in students’
studying environments. Lenier and Maker (1980) recommended studying at a “well lighted desk
in a room relatively free from noise and interruptions” (p. 9).
The second aspect of a learning environment has to do with the way students feel about
interacting in the class or tutoring room. Kuh, Kinzie, Schuh, Whitt, and Associates (2005) point
out the importance of student perceptions of the environment; they stated that students must
perceive their institutional environments as “inclusive and affirming” (p. 8), where expectations
are clear. The way a person feels can have a large effect on learning (Dale, 1972); hence students
need to “feel emotionally secure and valued as persons” (Bosch, 2006, p. 45). This includes
encouraging participation and making students feel safe about making mistakes.
Marland and Rogers (1997) suggested that the tutor room should be set up for social
support between students. The tutoring room is where students get help, and should be a space
where students feel comfortable asking for and giving help to each other. Rabow et al. (1999)
recommended that tutors show enthusiasm and empathy for their tutees as well as patience, and
30
interact with them “on as equal a level as possible” (p. 25). This builds an attitude of acceptance
and trust for the learners. One of the practical obligations a tutor has in creating a trustful
learning environment is to show up consistently and on time.
Whether it has to do with the physical learning space or the way the learners interact with
others, there is no shortage of advice offered on building a learning environment. It is
recommended that the setting should minimize distractions and that the learners need to feel safe
and confident in their interactions within the learning environment.
Summary
Tutoring has been a form of instruction for many centuries (Gordon & Gordon, 1990).
The effect tutoring has on modern education is unclear. The effect of learning styles on education
is also debatable (Baker et al., 2006; Calhoon & Fuchs, 2003; Maxwell, 1994; McDuffie et al.,
2009; Topping & Watson, 1996). Some believe that understanding and accommodating learning
styles makes learning easier and more efficient (Al-Balhan, 2007; Briggs, 2000), while others
criticize learning theory for lack of a universal model (Popescu, 2010) or believe the role of
learning styles in the learning process is not understood (Coffield et al., 2004; Pashler et al.,
2008). The learning environment also may have some impact on the learner (Bosch, 2006; Dale,
1972; Emmer & Evertson, 2009; Simmons, 2002; Verduin et al., 1977). The environment set up
in a way that minimizes distractions and allows bright light is suggested, as is a supportive
interaction with the instructors. The types of learners are affected, and the extent to which the
environment affects them is unknown. The way tutoring, learning styles, and learning
environment all interact to affect an individual is unclear.
31
Chapter 3: Methodology
The current study is a quantitative study to investigate correlations between number of
hours spent in tutoring and learning styles of undergraduate mathematics students.
Research Design
A correlational design was used. According to Creswell (2008) correlational designs use
statistical tests to “describe and measure the degree of association (or relationship) between two
or more variables” (p. 356). Correlational designs should be used when the purpose is to “relate
two or more variables to see if they influence each other” (p. 356). Since this study was meant to
investigate the relationship between learning styles and average number of hours spent per week
in tutoring, a correlation design fits.
Setting
The tutoring centers of interest are “math labs” affiliated with a university. Both “Math
Labs” are located in the same building as the mathematics faculty offices. No appointments are
needed to use either lab. Students can come during any of the 40 hours per week the lab is open
to receive help. All services are free. The mathematics faculty does not require any student to
spend any amount of time in the lab; using the lab is entirely voluntary. Also, no limitations are
made as to how many hours a student may use the lab.
The type of tutoring offered in both labs is primarily homework based. Students ask
about particular problems rather than asking tutors to explain an entire concept. However, some
conceptual tutoring is often performed in the course of aiding students with problems. Most of
the tutoring is done by other undergraduate students with advanced mathematics experience,
supervised by a graduate mathematics student who also participates in some of the tutoring.
32
Participants
The participants from both locations were undergraduate students enrolled in a
mathematics class at the time of the study. The students were enrolled in traditional lecture style
mathematics courses at one of the two private liberal arts universities in Texas. Participants were
selected from developmental math, college algebra, precalculus, and calculus courses at these
institutions. These were traditional, semester-long undergraduate courses (as opposed to online
or rapid-pace courses). The selection process was dependent upon the instructor of each course.
The process began with seeking permission from the mathematics instructors to allow their
students to participate in the study. Each interested instructor’s classes were used in the study.
The reason for including all students in these classes is to investigate if any learning styles which
are common to students who seek out tutoring are also common to those who do not seek
tutoring.
Instruments
A correlational study uses two sets of variable scores (Creswell, 2008). The results may
indicate an association but do not prove an association. In this study the first variable was the
average number of hours per week a student voluntarily attends a school tutoring lab. This
variable was measured with a self-reported survey. In addition, the participant answered several
questions regarding his/her perception of the tutoring environment. A copy of this researcher-
designed survey is in Appendix C. Also included in this survey are 12 questions regarding the
participants’ feelings about the tutoring environment. These questions are answered with a four-
point Likert scale. Demographic information is also included in this researcher-designed survey.
This information includes age, gender, and whether the participant is a native English speaker.
Finally, the college classification of freshmen, sophomore, junior, and senior will be asked. This
33
classification is determined by the number of completed college course hours. Freshmen have
completed 0 to 29 hours, Sophomores 30 to 59, Juniors 60 to 89, and Seniors 90 or more.
The second set of variables will be the categories of learning style. The instrument used
was the Index of Learning Styles (ILS) developed to measure the four components of learning
style from the Felder and Silverman Learning Styles Model (FSLSM) (Felder & Soloman, 1991),
reprinted by permission of North Carolina State University, and is in accordance with permission
to use the ILS for educational research. The ILS is made up of 44 questions (Felder & Spurlin,
2005). The ILS has 11 questions assigned to measure style for each learning style component
(perception, input, processing, and understanding). Each component is a continuous scale
between to bipolar opposite styles. Perception ranges from sensory to intuitive, input from visual
to verbal, processing from active to reflective, and understanding from sequential to global. Each
question in the ILS has two possible responses, at opposite ends of the corresponding continuum.
The subject is forced to pick one of these answers. When all questions for a particular component
are scored an odd number between 1 and 11 is obtained, as is a direction towards one of the polar
ends of the component. This was coded as an odd number from -11 to 11; 11 being the strongest
preference towards one pole of the component, and -11 being the strongest preference towards
the other. Each score is associated with a moderate preference towards one polar end, strong
preference to one polar end, or no preference. For example, a question measuring perception
would have one answer associated with a sensory style and another with an intuitive style. When
all four questions about perception are scored the learner could be assessed to have a strong
sensory style, a strong intuitive style, a moderate sensory style, a moderate intuitive style, or no
perception style.
34
Protection of Human Participants
In order to protect the human rights’ of the participants, the researcher obtained approval
from the University of the Incarnate Word Institutional Review Board (IRB), and the IRBs from
participating institutions. The participants were informed that participation is purely voluntary.
Those who participated signed a consent form before the surveys were administered. A copy of
this consent form is in Appendix D. The consent form includes information about the purpose of
the study, the role the participants will play, and how much time their participation will require.
In addition, the form also states that the participants have the right to remove themselves from
the study. At the time the consent form was distributed, participants were able to ask questions to
clarify their understanding of the study. Participants were assured that the decision to participate
or not would not in any way affect their course grade, their relationship with their university.
Complete anonymity was maintained. No names were on the data collected, and participants
cannot be identified from the demographic information collected. If this study is published, only
group data will be used. This study did not involve any physical risk or expense to the
participants.
Data Analysis
The data was coded and analyzed using the Statistical Package for the Social Sciences
(SPSS). The independent variables were: Age, Gender, Course, College Classification,
Perception, Input, Processing, and Understanding, and Perceptions of the Learning Environment.
Age is a scale variable. Gender is a categorical variable with values of male or female. Course
identifies the math course the participant is currently enrolled in; Course is an ordinal variable
with values of developmental, algebra, precalculus, or calculus. College classification is an
ordinal variable from freshmen to senior. Perception, Input, Processing, and Understanding are
35
all ordinal variables with values of odd numbers between -11 and 11. The dependent variables
were the dichotomous variable of whether the student sought tutoring, and the scale variable of
average number of hours per week the student spent receiving math tutoring. If a student
reported an interval of time for average number of hours per week spent in tutoring the average
was coded into SPSS. For example if a student reported spending 2 to 5 hours in tutoring per
week, then 3.5 hours was coded into SPSS as their hours per week.
First, a principal component analysis was performed on the data from the Tutoring
Information and Demographics Survey. Once the variables within the environment survey were
identified they were treated as independent variables. Two way associations between variables
were checked. This provided information about how the variables interact with each other. An
independent sample t-test or their non-parametric equivalents was run to see if each independent
variable has an effect on the average hours per week.
In order to investigate the correlation between tutoring hours and learning styles several
questions must be addressed. Most of the guiding research questions have specific sub-questions
which are answered in Chapter 4.
1. How are learning styles related to demographics?
2. How is use of mathematics tutoring related to learning styles and demographics?
a. How are learning styles related to whether students receive tutoring?
b. How are the demographics related whether students receive tutoring?
3. How are hours spent in mathematics tutoring related to learning style and perceptions of
the learning environment?
a. How is the number of hours spent in mathematics tutoring related to the way
students prefer to process new information?
36
b. How is the number of hours spent in mathematics tutoring related to the way
students prefer to take in new information?
c. How is the number of hours spent in mathematics tutoring related to the way
students prefer to perceive new information?
d. How is the number of hours spent in mathematics tutoring related to the way
students prefer to build understanding new information?
e. How is the number of hours spent in mathematics tutoring related to the way
students perceive the learning environment?
4. What is the difference in hours spent in tutoring among the demographic categories?
37
Chapter 4: Results
The purpose of this study was to investigate correlations between the number of hours
spent in tutoring, the learning styles of undergraduate mathematics students, and the perceptions
these students have of their tutoring environments. This chapter will begin with a descriptive
analysis of the data collected. Then an investigation into associations among the variables will be
presented. Finally, the analysis for each research question will each be discussed.
Descriptives
A total of 834 undergraduate mathematics students were surveyed; 400 from one
university, and 434 from another. The frequencies of the students who submitted valid data for
each of the variables will be addressed. These variables include the use of tutoring,
demographics, learning style, and perceptions of the learning environment.
Demographics. Out of the 834 students surveyed, 709 reported their ages. Ages ranged
from 18 to 58 with 75.56% of them either 18 or 19. Table 1 shows the frequencies of the
demographic variables other than age. There were slightly more females than males. Most of the
students surveyed came from courses below the calculus level. Over half the students surveyed
were freshmen. A little over a fourth of the students were non-native English speakers. The
typical student was 18, native English speaking, female, freshmen, non-calculus student.
Use of tutoring services. The frequency of students who reported using mathematics
tutoring either in the math lab at their university or outside the math lab can be seen in Table 2.
Overall fewer students used tutoring than did not. Less than a third of the students reported using
tutoring in the math lab, and less than a fourth of the students reported using tutoring outside the
math lab. Of those who received tutoring, over two thirds used the math lab, almost half were
tutored outside the math lab, and less than a fourth were tutored both in and out of the math lab.
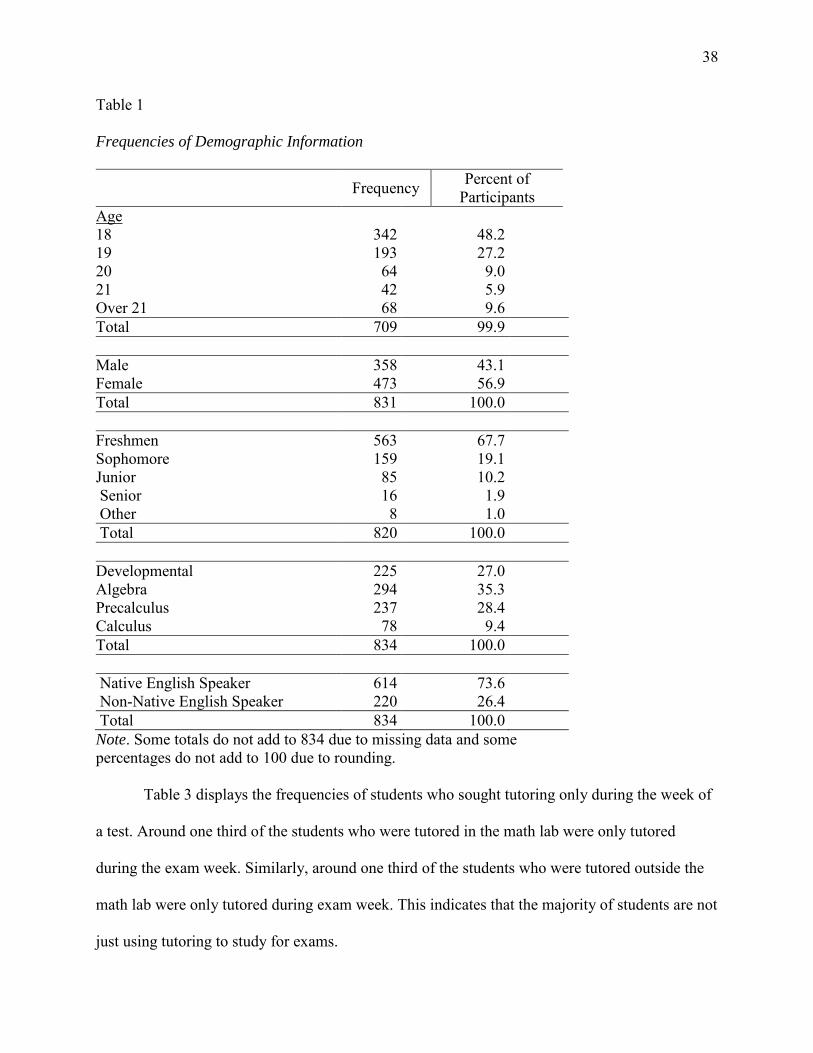
38
Table 1
Frequencies of Demographic Information
Frequency Percent of Participants
Age 18 342 48.2 19 193 27.2 20 64 9.0 21 42 5.9 Over 21 68 9.6 Total 709 99.9 Male 358 43.1 Female 473 56.9 Total 831 100.0 Freshmen 563 67.7 Sophomore 159 19.1 Junior 85 10.2 Senior 16 1.9 Other 8 1.0 Total 820 100.0 Developmental 225 27.0 Algebra 294 35.3 Precalculus 237 28.4 Calculus 78 9.4 Total 834 100.0 Native English Speaker 614 73.6 Non-Native English Speaker 220 26.4 Total 834 100.0 Note. Some totals do not add to 834 due to missing data and some percentages do not add to 100 due to rounding.
Table 3 displays the frequencies of students who sought tutoring only during the week of
a test. Around one third of the students who were tutored in the math lab were only tutored
during the exam week. Similarly, around one third of the students who were tutored outside the
math lab were only tutored during exam week. This indicates that the majority of students are not
just using tutoring to study for exams.
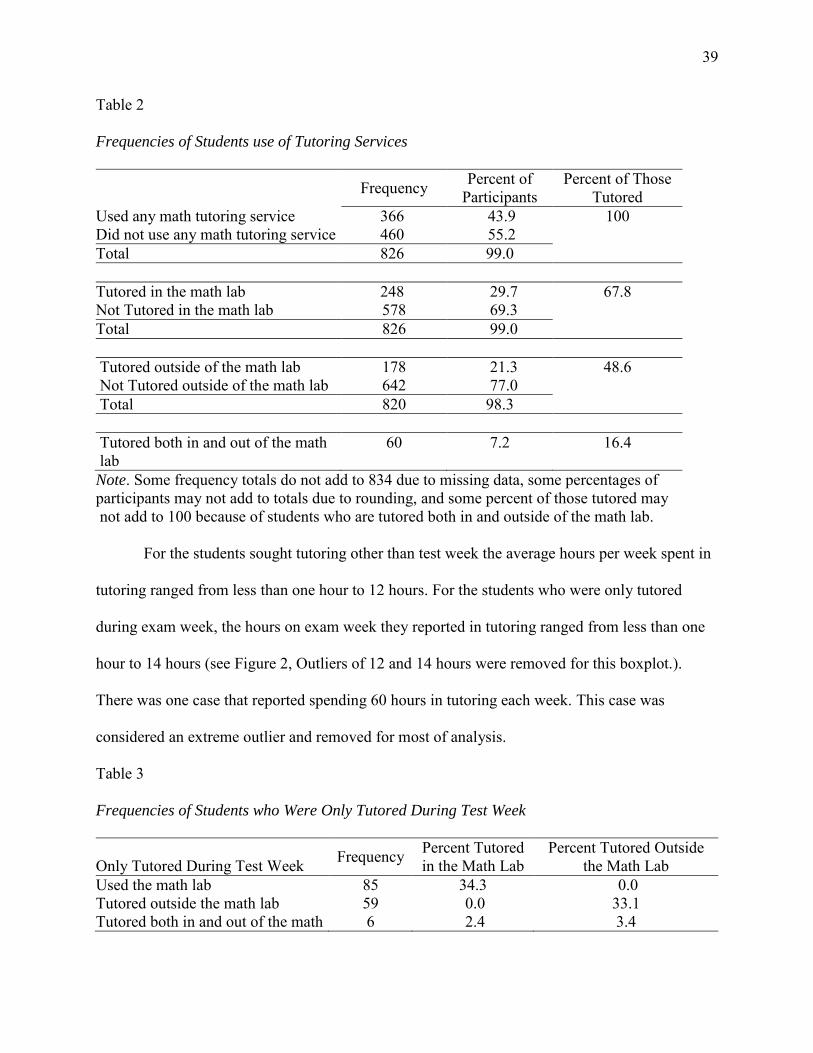
39
Table 2
Frequencies of Students use of Tutoring Services
Frequency Percent of Participants
Percent of Those Tutored
Used any math tutoring service 366 43.9 100 Did not use any math tutoring service 460 55.2 Total 826 99.0 Tutored in the math lab 248 29.7 67.8 Not Tutored in the math lab 578 69.3 Total 826 99.0 Tutored outside of the math lab 178 21.3 48.6 Not Tutored outside of the math lab 642 77.0 Total 820 98.3 Tutored both in and out of the math lab
60 7.2 16.4
Note. Some frequency totals do not add to 834 due to missing data, some percentages of participants may not add to totals due to rounding, and some percent of those tutored may not add to 100 because of students who are tutored both in and outside of the math lab.
For the students sought tutoring other than test week the average hours per week spent in
tutoring ranged from less than one hour to 12 hours. For the students who were only tutored
during exam week, the hours on exam week they reported in tutoring ranged from less than one
hour to 14 hours (see Figure 2, Outliers of 12 and 14 hours were removed for this boxplot.).
There was one case that reported spending 60 hours in tutoring each week. This case was
considered an extreme outlier and removed for most of analysis.
Table 3
Frequencies of Students who Were Only Tutored During Test Week
Only Tutored During Test Week Frequency Percent Tutored
in the Math Lab Percent Tutored Outside
the Math Lab Used the math lab 85 34.3 0.0 Tutored outside the math lab 59 0.0 33.1 Tutored both in and out of the math 6 2.4 3.4
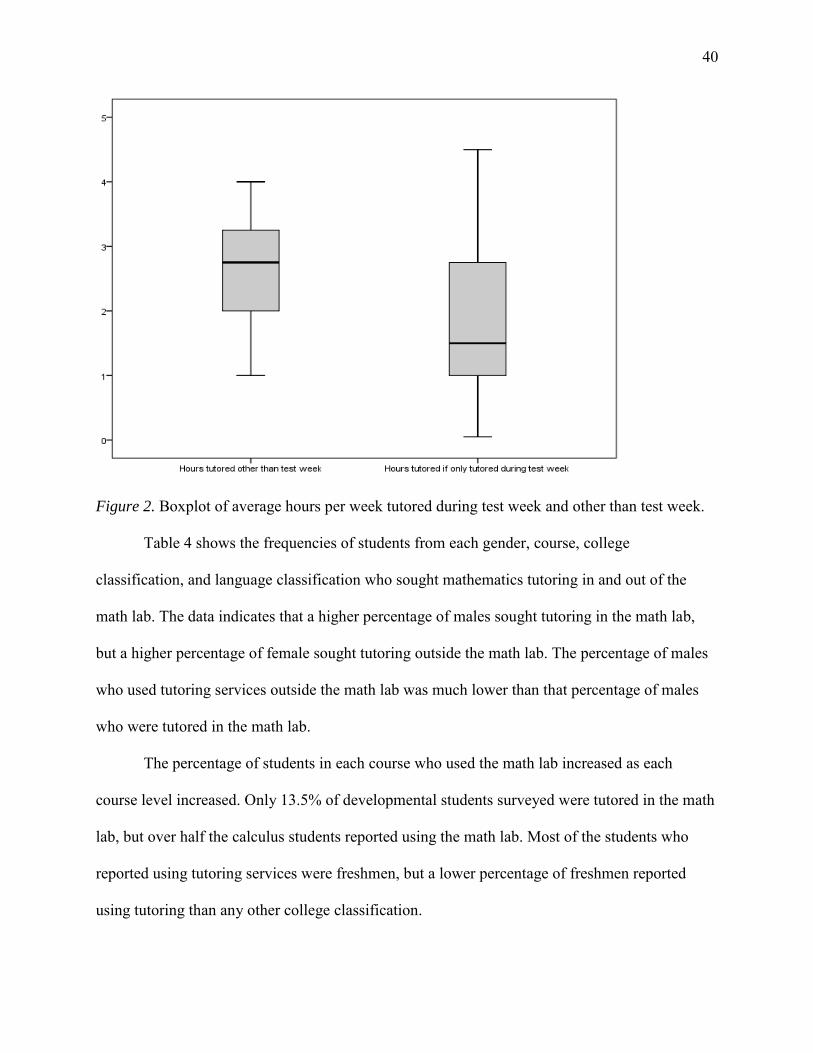
40
Figure 2. Boxplot of average hours per week tutored during test week and other than test week.
Table 4 shows the frequencies of students from each gender, course, college
classification, and language classification who sought mathematics tutoring in and out of the
math lab. The data indicates that a higher percentage of males sought tutoring in the math lab,
but a higher percentage of female sought tutoring outside the math lab. The percentage of males
who used tutoring services outside the math lab was much lower than that percentage of males
who were tutored in the math lab.
The percentage of students in each course who used the math lab increased as each
course level increased. Only 13.5% of developmental students surveyed were tutored in the math
lab, but over half the calculus students reported using the math lab. Most of the students who
reported using tutoring services were freshmen, but a lower percentage of freshmen reported
using tutoring than any other college classification.
41
The percentage of native and non-native English speakers who used the math lab were
very close. This indicates that the native language does not have a big impact on whether a
student uses the math lab. However, a smaller percentage of non-native English speakers
received tutoring outside the tutoring lab.
Learning style. Although all of the participants filled out parts of the Index of Learning
Styles (ILS), some participants left questions blank. Cases with missing data from one of the
components of the ILS were excluded from the analysis as Zywno (2003) did in his validation
study of the ILS. The number of cases this left with complete ILS component scores can be seen
in Table 5. Scores for Processing, Input, Perception, and Understanding were calculated
according to the ILS instructions.
Processing. Processing scores had a skew value of .1 with a standard error of .09, which
produced a z score of 1.11. Sheskin (2007) states that this should be within the range of -3 to 3 in
order to be assumed not skew. Since the z score is within the acceptable range from -3 to 3 the
data can be assumed to not be skewed. The kurtosis value was -.51 with a standard error of .17,
which produced a z score of -3. Since this is on the boarder of the acceptable range, the data is
not assumed kurtotic. A view of the histogram (Figure 3) for processing score show that they are
approximately normal. The processing scores were used to categorize each case in accordance
with the ILS: a processing score of, -11 to -9 is strong active preference, -7 to -5 is moderate
active preference, -3 to 3 is balanced processing, 5 to 7 is moderate reflective preference, and 9
to 11 is strong reflective preference. These five categories the frequencies can be seen in Table 6.
The majority of students had a balanced processing learning style.
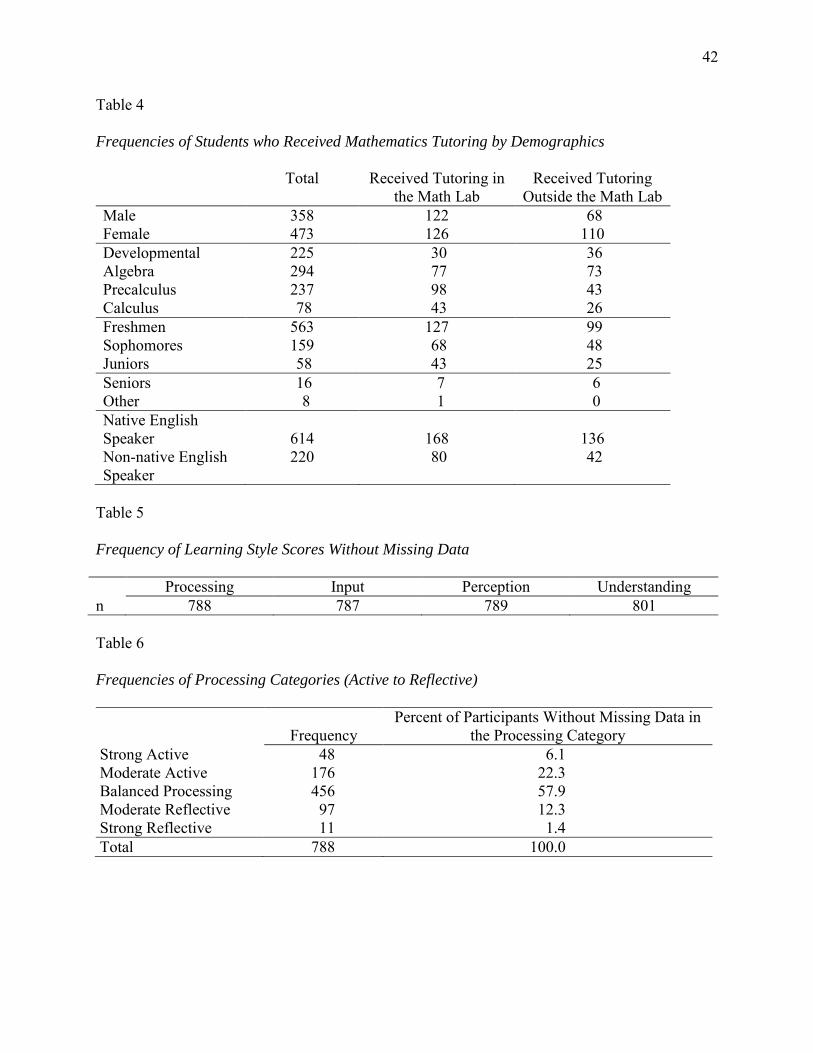
42
Table 4
Frequencies of Students who Received Mathematics Tutoring by Demographics
Total Received Tutoring in the Math Lab
Received Tutoring Outside the Math Lab
Male 358 122 68 Female 473 126 110 Developmental 225 30 36 Algebra 294 77 73 Precalculus 237 98 43 Calculus 78 43 26 Freshmen 563 127 99 Sophomores 159 68 48 Juniors 58 43 25 Seniors 16 7 6 Other 8 1 0 Native English Speaker 614 168 136 Non-native English Speaker
220 80 42
Table 5
Frequency of Learning Style Scores Without Missing Data
Processing Input Perception Understanding n 788 787 789 801
Table 6
Frequencies of Processing Categories (Active to Reflective)
Frequency Percent of Participants Without Missing Data in
the Processing Category Strong Active 48 6.1 Moderate Active 176 22.3 Balanced Processing 456 57.9 Moderate Reflective 97 12.3 Strong Reflective 11 1.4 Total 788 100.0
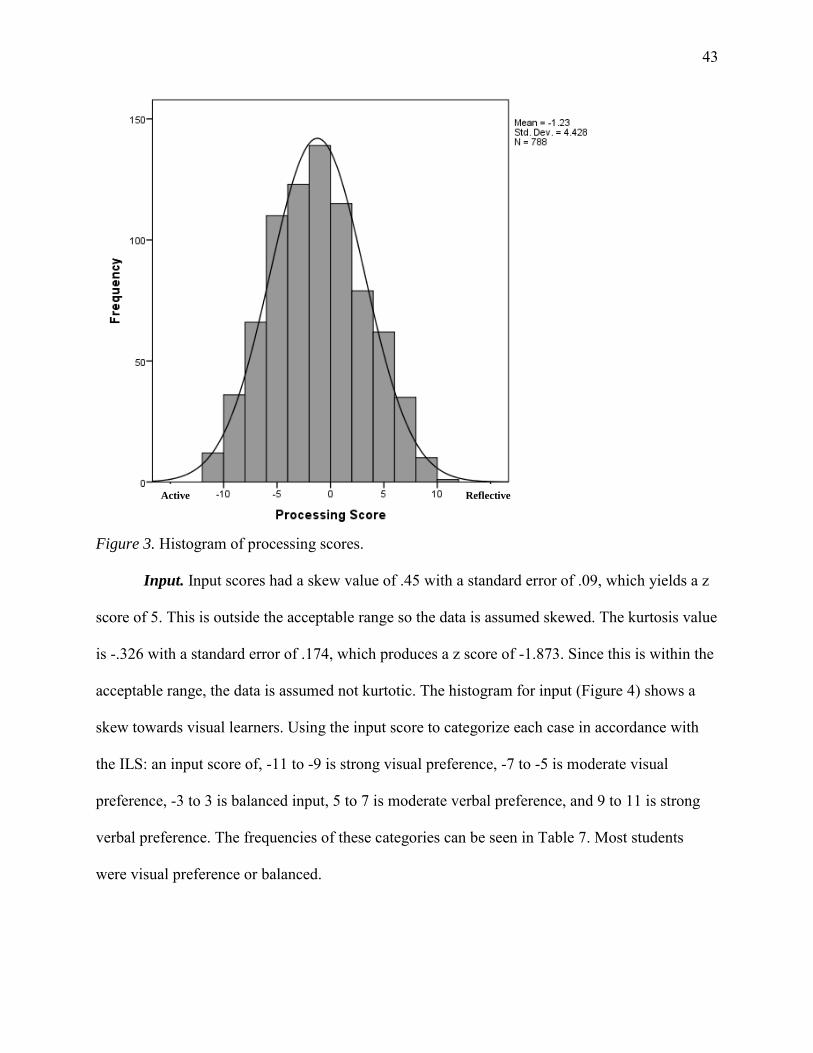
43
Figure 3. Histogram of processing scores.
Input. Input scores had a skew value of .45 with a standard error of .09, which yields a z
score of 5. This is outside the acceptable range so the data is assumed skewed. The kurtosis value
is -.326 with a standard error of .174, which produces a z score of -1.873. Since this is within the
acceptable range, the data is assumed not kurtotic. The histogram for input (Figure 4) shows a
skew towards visual learners. Using the input score to categorize each case in accordance with
the ILS: an input score of, -11 to -9 is strong visual preference, -7 to -5 is moderate visual
preference, -3 to 3 is balanced input, 5 to 7 is moderate verbal preference, and 9 to 11 is strong
verbal preference. The frequencies of these categories can be seen in Table 7. Most students
were visual preference or balanced.
Active Reflective
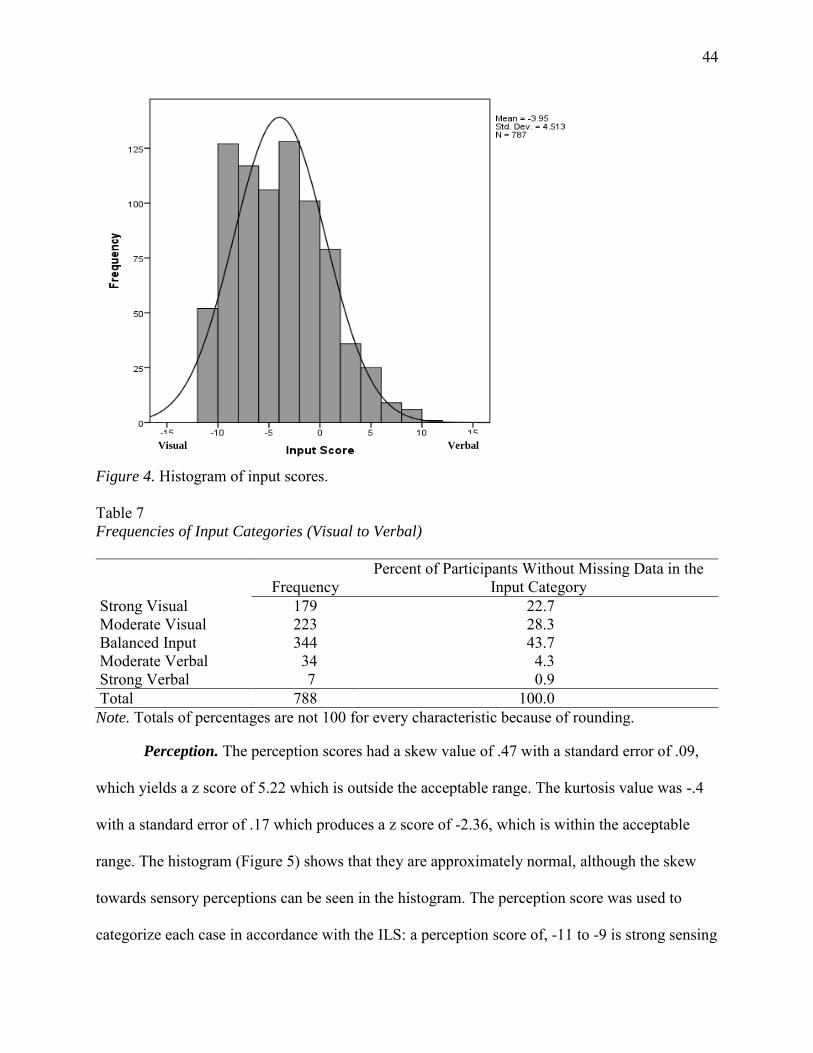
44
Figure 4. Histogram of input scores. Table 7 Frequencies of Input Categories (Visual to Verbal)
Frequency Percent of Participants Without Missing Data in the
Input Category Strong Visual 179 22.7 Moderate Visual 223 28.3 Balanced Input 344 43.7 Moderate Verbal 34 4.3 Strong Verbal 7 0.9 Total 788 100.0 Note. Totals of percentages are not 100 for every characteristic because of rounding.
Perception. The perception scores had a skew value of .47 with a standard error of .09,
which yields a z score of 5.22 which is outside the acceptable range. The kurtosis value was -.4
with a standard error of .17 which produces a z score of -2.36, which is within the acceptable
range. The histogram (Figure 5) shows that they are approximately normal, although the skew
towards sensory perceptions can be seen in the histogram. The perception score was used to
categorize each case in accordance with the ILS: a perception score of, -11 to -9 is strong sensing
Verbal Visual
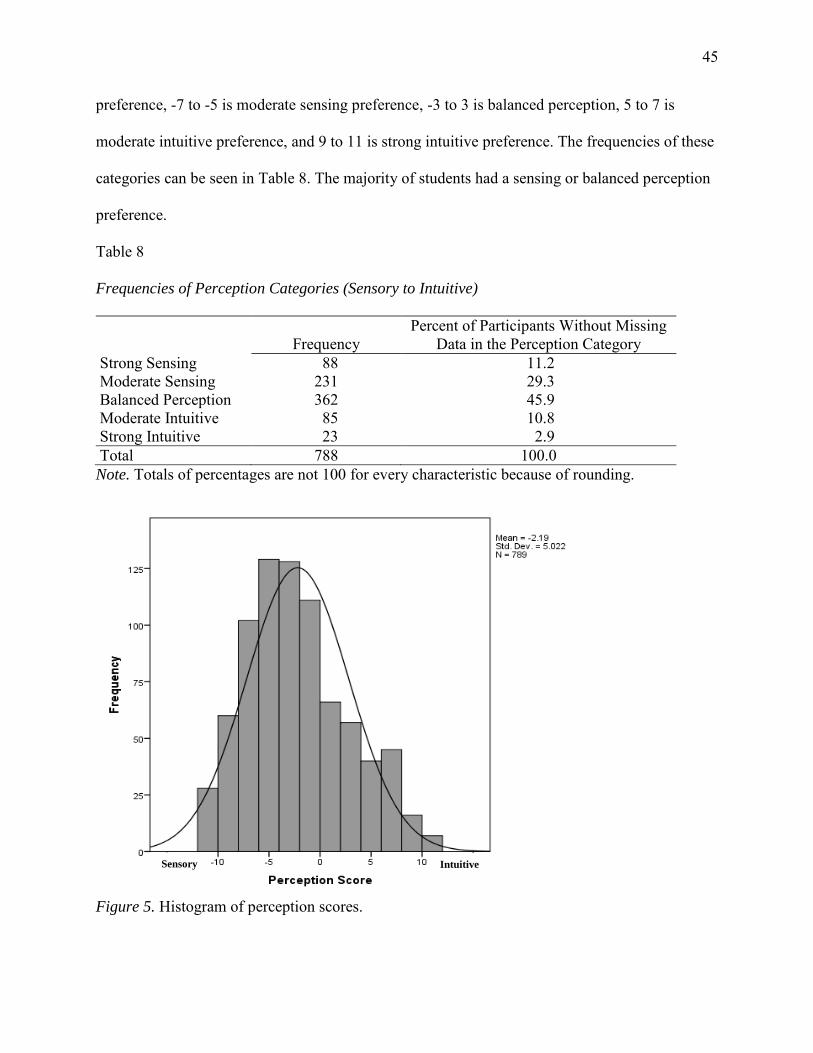
45
preference, -7 to -5 is moderate sensing preference, -3 to 3 is balanced perception, 5 to 7 is
moderate intuitive preference, and 9 to 11 is strong intuitive preference. The frequencies of these
categories can be seen in Table 8. The majority of students had a sensing or balanced perception
preference.
Table 8
Frequencies of Perception Categories (Sensory to Intuitive)
Frequency Percent of Participants Without Missing
Data in the Perception Category Strong Sensing 88 11.2 Moderate Sensing 231 29.3 Balanced Perception 362 45.9 Moderate Intuitive 85 10.8 Strong Intuitive 23 2.9 Total 788 100.0 Note. Totals of percentages are not 100 for every characteristic because of rounding.
Figure 5. Histogram of perception scores.
Intuitive Sensory
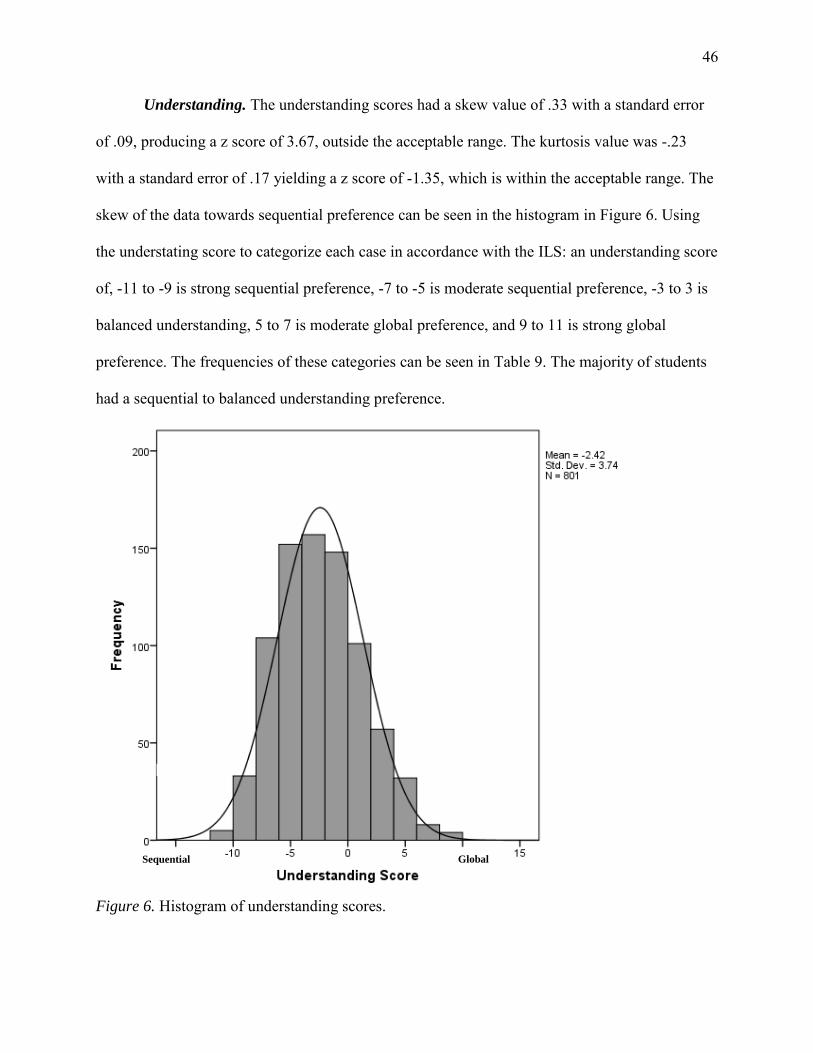
46
Understanding. The understanding scores had a skew value of .33 with a standard error
of .09, producing a z score of 3.67, outside the acceptable range. The kurtosis value was -.23
with a standard error of .17 yielding a z score of -1.35, which is within the acceptable range. The
skew of the data towards sequential preference can be seen in the histogram in Figure 6. Using
the understating score to categorize each case in accordance with the ILS: an understanding score
of, -11 to -9 is strong sequential preference, -7 to -5 is moderate sequential preference, -3 to 3 is
balanced understanding, 5 to 7 is moderate global preference, and 9 to 11 is strong global
preference. The frequencies of these categories can be seen in Table 9. The majority of students
had a sequential to balanced understanding preference.
Figure 6. Histogram of understanding scores.
Global
Sequential
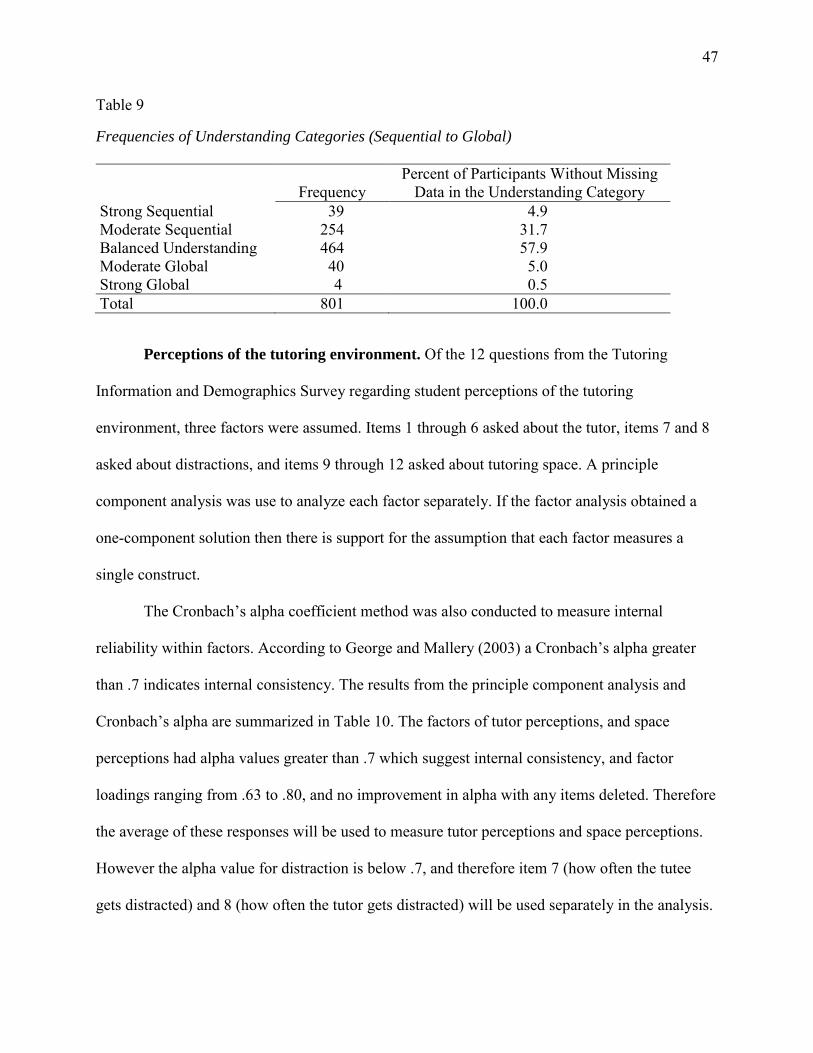
47
Table 9
Frequencies of Understanding Categories (Sequential to Global)
Frequency Percent of Participants Without Missing
Data in the Understanding Category Strong Sequential 39 4.9 Moderate Sequential 254 31.7 Balanced Understanding 464 57.9 Moderate Global 40 5.0 Strong Global 4 0.5 Total 801 100.0
Perceptions of the tutoring environment. Of the 12 questions from the Tutoring
Information and Demographics Survey regarding student perceptions of the tutoring
environment, three factors were assumed. Items 1 through 6 asked about the tutor, items 7 and 8
asked about distractions, and items 9 through 12 asked about tutoring space. A principle
component analysis was use to analyze each factor separately. If the factor analysis obtained a
one-component solution then there is support for the assumption that each factor measures a
single construct.
The Cronbach’s alpha coefficient method was also conducted to measure internal
reliability within factors. According to George and Mallery (2003) a Cronbach’s alpha greater
than .7 indicates internal consistency. The results from the principle component analysis and
Cronbach’s alpha are summarized in Table 10. The factors of tutor perceptions, and space
perceptions had alpha values greater than .7 which suggest internal consistency, and factor
loadings ranging from .63 to .80, and no improvement in alpha with any items deleted. Therefore
the average of these responses will be used to measure tutor perceptions and space perceptions.
However the alpha value for distraction is below .7, and therefore item 7 (how often the tutee
gets distracted) and 8 (how often the tutor gets distracted) will be used separately in the analysis.
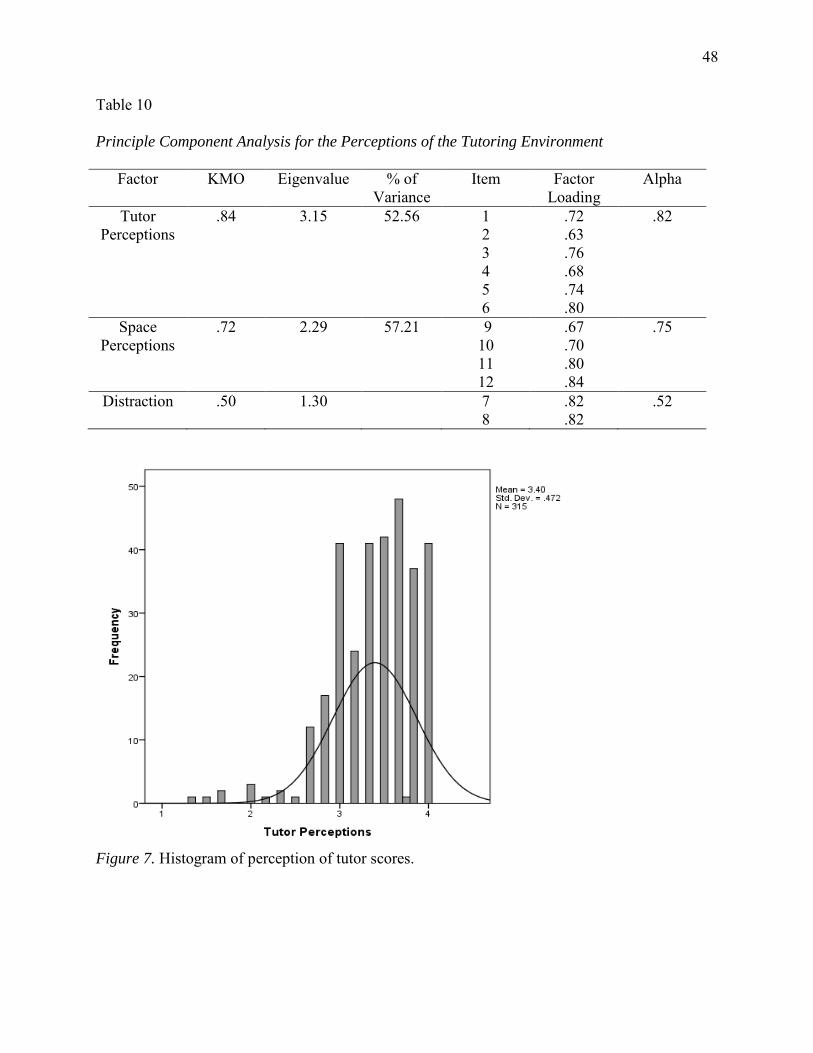
48
Table 10
Principle Component Analysis for the Perceptions of the Tutoring Environment
Factor KMO Eigenvalue % of Variance
Item Factor Loading
Alpha
Tutor Perceptions
.84 3.15 52.56 1 2 3 4 5 6
.72
.63
.76
.68
.74
.80
.82
Space Perceptions
.72 2.29 57.21 9 10 11 12
.67
.70
.80
.84
.75
Distraction .50 1.30 7 8
.82
.82 .52
Figure 7. Histogram of perception of tutor scores.
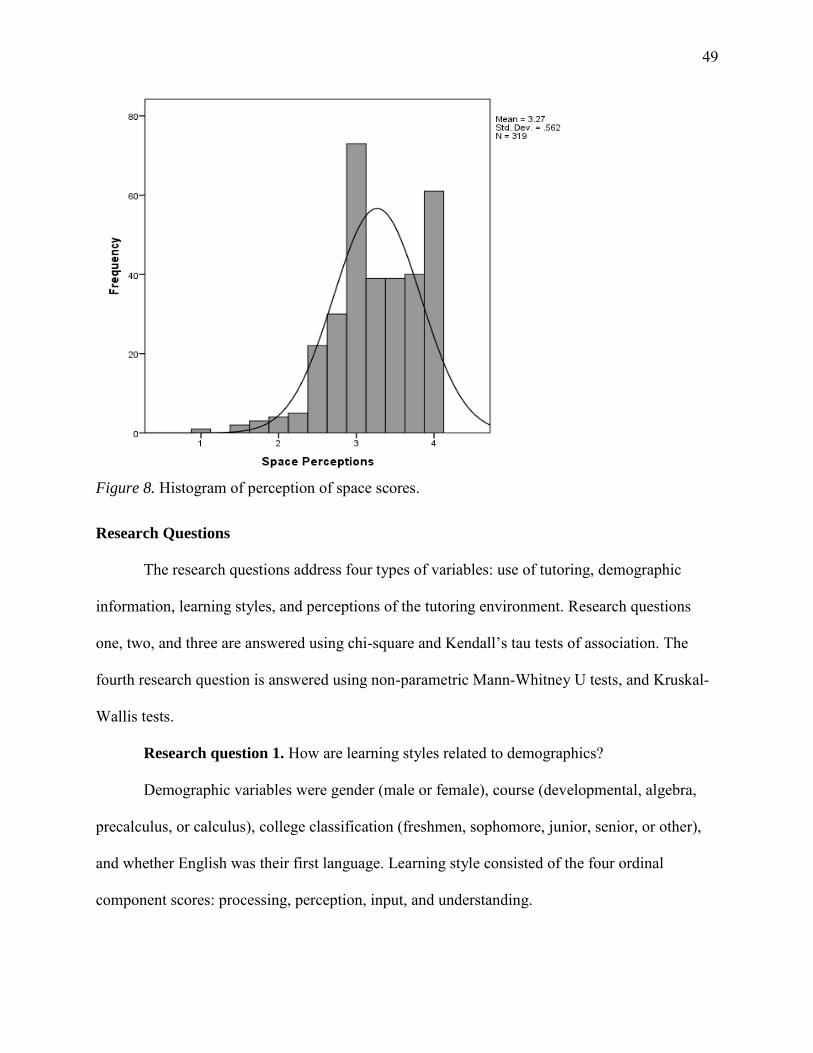
49
Figure 8. Histogram of perception of space scores.
Research Questions
The research questions address four types of variables: use of tutoring, demographic
information, learning styles, and perceptions of the tutoring environment. Research questions
one, two, and three are answered using chi-square and Kendall’s tau tests of association. The
fourth research question is answered using non-parametric Mann-Whitney U tests, and Kruskal-
Wallis tests.
Research question 1. How are learning styles related to demographics?
Demographic variables were gender (male or female), course (developmental, algebra,
precalculus, or calculus), college classification (freshmen, sophomore, junior, senior, or other),
and whether English was their first language. Learning style consisted of the four ordinal
component scores: processing, perception, input, and understanding.
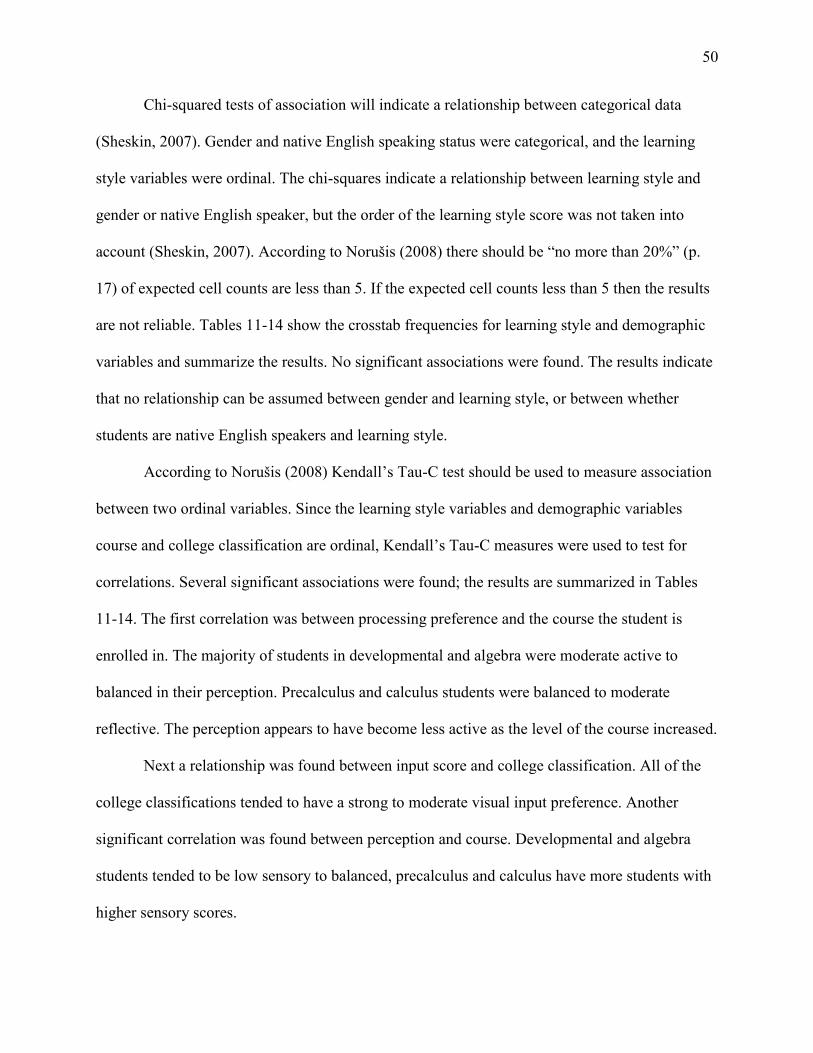
50
Chi-squared tests of association will indicate a relationship between categorical data
(Sheskin, 2007). Gender and native English speaking status were categorical, and the learning
style variables were ordinal. The chi-squares indicate a relationship between learning style and
gender or native English speaker, but the order of the learning style score was not taken into
account (Sheskin, 2007). According to Norušis (2008) there should be “no more than 20%” (p.
17) of expected cell counts are less than 5. If the expected cell counts less than 5 then the results
are not reliable. Tables 11-14 show the crosstab frequencies for learning style and demographic
variables and summarize the results. No significant associations were found. The results indicate
that no relationship can be assumed between gender and learning style, or between whether
students are native English speakers and learning style.
According to Norušis (2008) Kendall’s Tau-C test should be used to measure association
between two ordinal variables. Since the learning style variables and demographic variables
course and college classification are ordinal, Kendall’s Tau-C measures were used to test for
correlations. Several significant associations were found; the results are summarized in Tables
11-14. The first correlation was between processing preference and the course the student is
enrolled in. The majority of students in developmental and algebra were moderate active to
balanced in their perception. Precalculus and calculus students were balanced to moderate
reflective. The perception appears to have become less active as the level of the course increased.
Next a relationship was found between input score and college classification. All of the
college classifications tended to have a strong to moderate visual input preference. Another
significant correlation was found between perception and course. Developmental and algebra
students tended to be low sensory to balanced, precalculus and calculus have more students with
higher sensory scores.

51
Table 11
Crosstab Frequencies of Processing Score and Demographic Variables
Processing Score
Total
Active Reflective
-11 -9 -7 -5 -3 -1 1 3 5 7 9 11
Gender Male 6 15 33 43 47 67 55 27 19 14 5 0 331 Female 6 21 33 67 76 71 59 52 43 20 5 1 454
Total 12 36 66 110 123 138 114 79 62 34 10 1 785 χ
2(11) = 13.65, p = .25, % expected cell count less than 5 = 12.5%
Course Developmental 3 14 17 33 30 40 21 25 15 10 1 1 210 Algebra 4 12 28 46 47 45 38 22 18 9 5 0 274 Precal 4 5 16 25 37 43 39 22 20 12 3 0 226 Cal 1 5 5 6 9 11 17 10 9 4 1 0 78
Total 12 36 66 110 123 139 115 79 62 35 10 1 788 τ = .08, p =.00
College Classification
Freshmen 8 27 42 79 80 90 69 56 47 22 6 1 527 Sophomore 3 6 16 16 23 25 27 16 10 7 2 0 151 Junior 1 3 6 12 17 16 15 5 2 5 1 0 83 Senior 0 0 1 3 2 5 4 0 0 1 0 0 16 Other 0 0 1 0 1 2 0 1 3 0 0 0 8
Total 12 36 66 110 123 138 115 78 62 35 9 1 785 τ = .002, p =.94 Native English Speaker
Yes 9 29 52 75 93 108 85 58 46 25 9 0 589 No 3 7 14 35 30 31 30 21 16 10 1 1 199
Total 12 36 66 110 123 139 115 79 62 35 10 1 788 χ
2(11) = 8.4, p = .63, % expected cell count less than 5 = 16.7% Note. Totals do not add to 834 due to missing data.

52
Table 12
Crosstab Frequencies of Input Score and Demographic Variables
Input Score
Total
Visual Verbal
-11 -9 -7 -5 -3 -1 1 3 5 7 9 11
Gender Male 26 64 53 47 51 40 30 12 8 1 1 0 333 Female 26 63 62 59 77 61 49 24 17 8 5 1 452
Total 12 52 127 115 106 128 101 79 36 25 9 6 1 χ
2(11) = 14.94, p = .25, % expected cell count less than 5 = 20.8%
Course Developmental 9 31 42 28 32 27 18 11 4 4 2 0 208 Algebra 18 43 43 30 41 33 34 13 14 2 2 0 273 Precal 19 43 26 30 43 28 20 9 6 3 2 0 229 Cal 6 10 6 18 12 13 7 3 1 0 0 1 77
Total 12 52 127 117 106 128 101 79 36 25 9 6 1 τ = -.02, p =.57
College Classification
Freshmen 29 72 86 67 88 69 61 28 18 8 5 0 531 Sophomore 14 31 17 21 20 23 14 1 4 1 1 1 148 Junior 8 16 10 16 16 8 2 4 2 0 0 0 82 Senior 1 4 2 2 2 0 2 2 0 0 0 0 15 Other 0 3 1 0 2 0 0 1 1 0 0 0 8
Total 12 52 126 116 106 128 100 79 36 25 9 6 1 τ = .-08, p =.00 Native English Speaker
Yes 40 99 95 76 92 77 52 22 19 6 5 1 584 No 12 28 22 30 36 24 27 14 6 3 1 0 203
Total 12 52 127 117 106 128 101 79 36 25 9 6 1 χ
2(11) = 12.09, p = .36, % expected cell count less than 5 = 20.8% Note. Totals do not add to 834 due to missing data.

53
Table 13
Crosstab Frequencies of Perception Score and Demographic Variables
Perception Score
Total
Sensory Intuitive
-11 -9 -7 -5 -3 -1 1 3 5 7 9 11
Gender Male 12 25 45 63 54 41 30 18 22 17 6 2 335 Female 16 34 56 66 74 70 36 39 17 28 10 5 451
Total 12 28 59 101 129 128 111 66 57 39 45 16 7 χ
2(11) = 10.93, p = .45, % expected cell count less than 5 = 8.3%
Course Developmental 7 15 25 38 30 27 24 18 12 8 5 3 212 Algebra 11 17 26 51 40 46 21 23 14 19 4 2 274 Precal 4 20 40 27 43 31 14 11 10 17 7 2 226 Cal 6 8 11 13 15 7 7 5 4 1 0 0 77
Total 12 28 60 102 129 128 111 66 57 40 45 16 7 τ = -.06, p =.046
College Classification
Freshmen 13 37 73 81 79 77 49 42 32 32 14 2 531 Sophomore 11 15 18 29 26 21 11 8 3 6 1 2 151 Junior 2 5 9 13 18 11 5 5 4 5 1 3 81 Senior 0 2 0 4 4 1 0 1 1 2 0 0 15 Other 2 1 2 0 0 1 1 1 0 0 0 0 8
Total 12 28 60 102 127 127 111 66 57 40 45 16 7 τ = -.05, p =.03 Native English Speaker
Yes 24 41 69 89 98 92 46 43 32 34 12 6 586 No 4 19 33 40 30 19 20 14 8 11 4 1 203
Total 12 28 60 102 129 128 111 66 57 40 45 16 7 χ
2(11) = 13.88, p = .24, % expected cell count less than 5 = 8.3% Note. Totals do not add to 834 due to missing data.
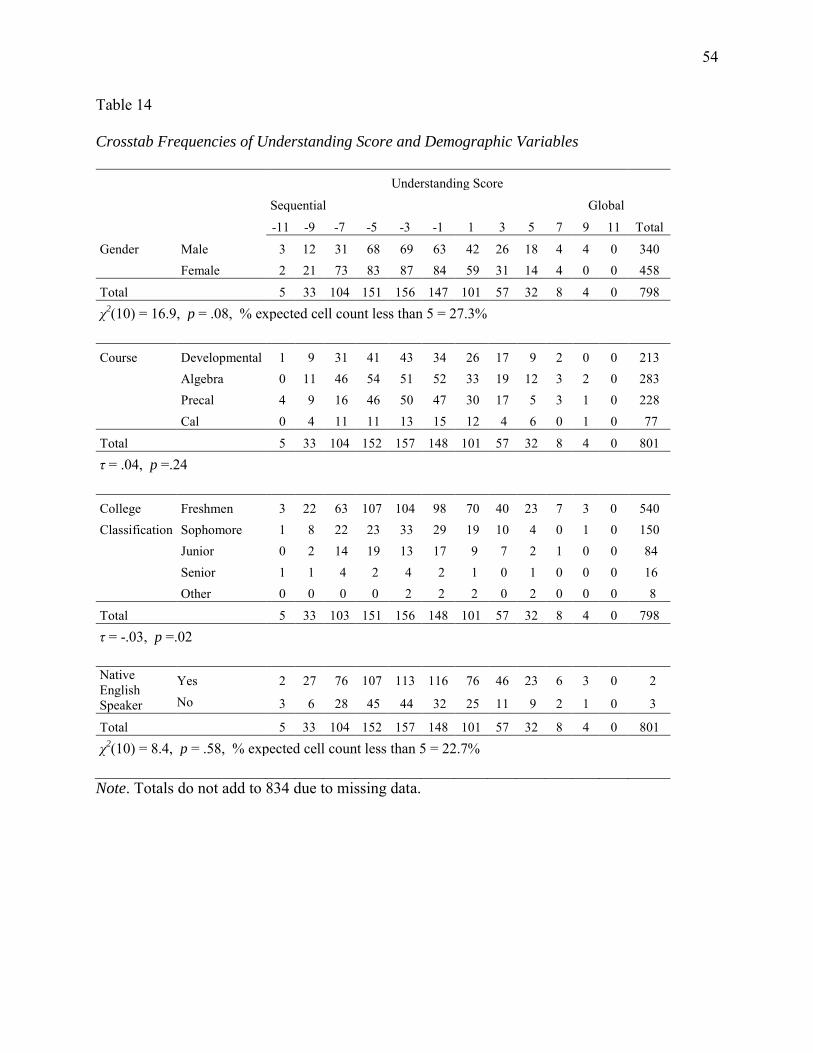
54
Table 14
Crosstab Frequencies of Understanding Score and Demographic Variables
Understanding Score
Total
Sequential Global
-11 -9 -7 -5 -3 -1 1 3 5 7 9 11
Gender Male 3 12 31 68 69 63 42 26 18 4 4 0 340 Female 2 21 73 83 87 84 59 31 14 4 0 0 458
Total 5 33 104 151 156 147 101 57 32 8 4 0 798 χ
2(10) = 16.9, p = .08, % expected cell count less than 5 = 27.3%
Course Developmental 1 9 31 41 43 34 26 17 9 2 0 0 213 Algebra 0 11 46 54 51 52 33 19 12 3 2 0 283 Precal 4 9 16 46 50 47 30 17 5 3 1 0 228 Cal 0 4 11 11 13 15 12 4 6 0 1 0 77
Total 5 33 104 152 157 148 101 57 32 8 4 0 801 τ = .04, p =.24
College Classification
Freshmen 3 22 63 107 104 98 70 40 23 7 3 0 540 Sophomore 1 8 22 23 33 29 19 10 4 0 1 0 150 Junior 0 2 14 19 13 17 9 7 2 1 0 0 84 Senior 1 1 4 2 4 2 1 0 1 0 0 0 16 Other 0 0 0 0 2 2 2 0 2 0 0 0 8
Total 5 33 103 151 156 148 101 57 32 8 4 0 798 τ = -.03, p =.02 Native English Speaker
Yes 2 27 76 107 113 116 76 46 23 6 3 0 2 No 3 6 28 45 44 32 25 11 9 2 1 0 3
Total 5 33 104 152 157 148 101 57 32 8 4 0 801 χ
2(10) = 8.4, p = .58, % expected cell count less than 5 = 22.7% Note. Totals do not add to 834 due to missing data.
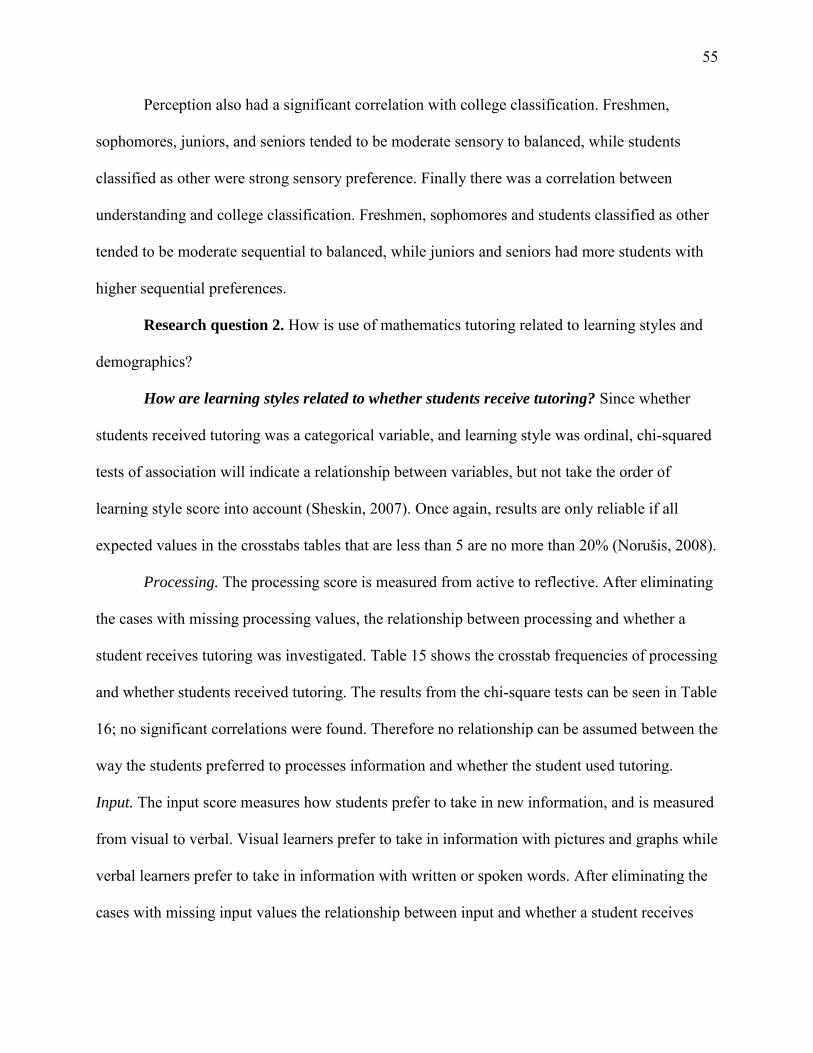
55
Perception also had a significant correlation with college classification. Freshmen,
sophomores, juniors, and seniors tended to be moderate sensory to balanced, while students
classified as other were strong sensory preference. Finally there was a correlation between
understanding and college classification. Freshmen, sophomores and students classified as other
tended to be moderate sequential to balanced, while juniors and seniors had more students with
higher sequential preferences.
Research question 2. How is use of mathematics tutoring related to learning styles and
demographics?
How are learning styles related to whether students receive tutoring? Since whether
students received tutoring was a categorical variable, and learning style was ordinal, chi-squared
tests of association will indicate a relationship between variables, but not take the order of
learning style score into account (Sheskin, 2007). Once again, results are only reliable if all
expected values in the crosstabs tables that are less than 5 are no more than 20% (Norušis, 2008).
Processing. The processing score is measured from active to reflective. After eliminating
the cases with missing processing values, the relationship between processing and whether a
student receives tutoring was investigated. Table 15 shows the crosstab frequencies of processing
and whether students received tutoring. The results from the chi-square tests can be seen in Table
16; no significant correlations were found. Therefore no relationship can be assumed between the
way the students preferred to processes information and whether the student used tutoring.
Input. The input score measures how students prefer to take in new information, and is measured
from visual to verbal. Visual learners prefer to take in information with pictures and graphs while
verbal learners prefer to take in information with written or spoken words. After eliminating the
cases with missing input values the relationship between input and whether a student receives
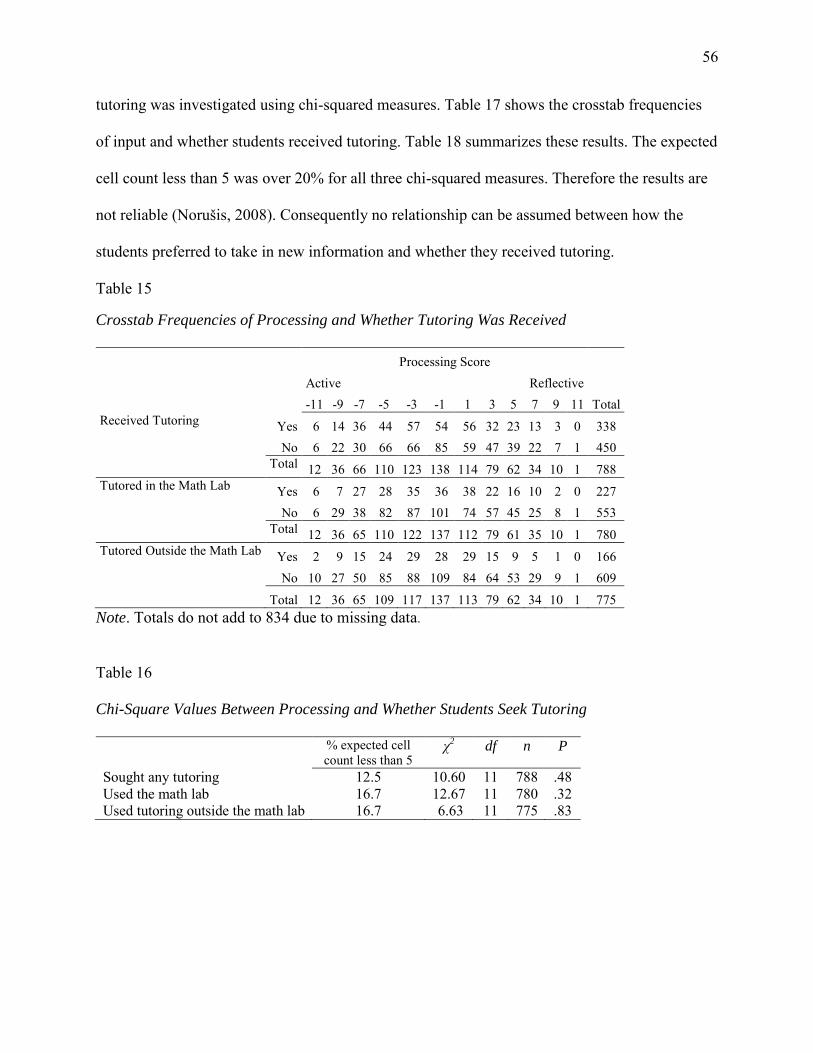
56
tutoring was investigated using chi-squared measures. Table 17 shows the crosstab frequencies
of input and whether students received tutoring. Table 18 summarizes these results. The expected
cell count less than 5 was over 20% for all three chi-squared measures. Therefore the results are
not reliable (Norušis, 2008). Consequently no relationship can be assumed between how the
students preferred to take in new information and whether they received tutoring.
Table 15
Crosstab Frequencies of Processing and Whether Tutoring Was Received
Processing Score
Total Active Reflective -11 -9 -7 -5 -3 -1 1 3 5 7 9 11
Received Tutoring Yes 6 14 36 44 57 54 56 32 23 13 3 0 338 No 6 22 30 66 66 85 59 47 39 22 7 1 450
Total 12 36 66 110 123 138 114 79 62 34 10 1 788 Tutored in the Math Lab Yes 6 7 27 28 35 36 38 22 16 10 2 0 227
No 6 29 38 82 87 101 74 57 45 25 8 1 553 Total 12 36 65 110 122 137 112 79 61 35 10 1 780
Tutored Outside the Math Lab Yes 2 9 15 24 29 28 29 15 9 5 1 0 166 No 10 27 50 85 88 109 84 64 53 29 9 1 609
Total 12 36 65 109 117 137 113 79 62 34 10 1 775 Note. Totals do not add to 834 due to missing data.
Table 16
Chi-Square Values Between Processing and Whether Students Seek Tutoring
% expected cell count less than 5
χ2 df n P
Sought any tutoring 12.5 10.60 11 788 .48 Used the math lab 16.7 12.67 11 780 .32 Used tutoring outside the math lab 16.7 6.63 11 775 .83
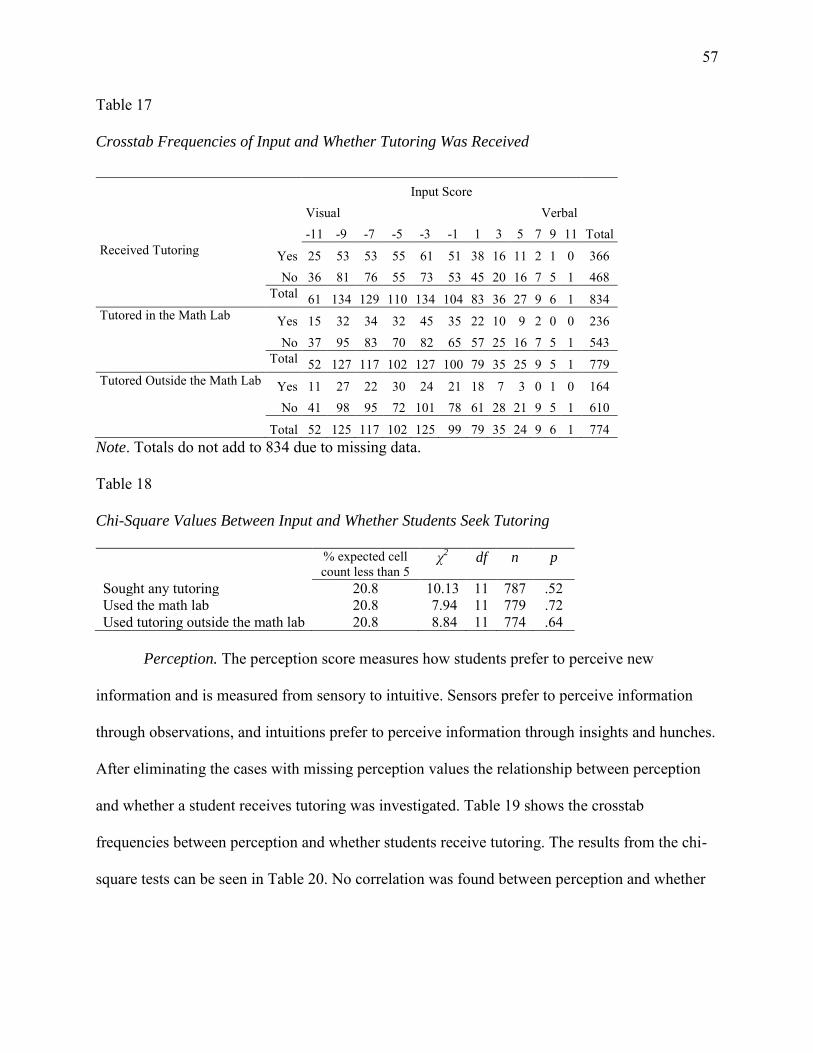
57
Table 17 Crosstab Frequencies of Input and Whether Tutoring Was Received
Input Score
Total Visual Verbal -11 -9 -7 -5 -3 -1 1 3 5 7 9 11
Received Tutoring Yes 25 53 53 55 61 51 38 16 11 2 1 0 366 No 36 81 76 55 73 53 45 20 16 7 5 1 468
Total 61 134 129 110 134 104 83 36 27 9 6 1 834 Tutored in the Math Lab Yes 15 32 34 32 45 35 22 10 9 2 0 0 236
No 37 95 83 70 82 65 57 25 16 7 5 1 543 Total 52 127 117 102 127 100 79 35 25 9 5 1 779
Tutored Outside the Math Lab Yes 11 27 22 30 24 21 18 7 3 0 1 0 164 No 41 98 95 72 101 78 61 28 21 9 5 1 610
Total 52 125 117 102 125 99 79 35 24 9 6 1 774 Note. Totals do not add to 834 due to missing data. Table 18
Chi-Square Values Between Input and Whether Students Seek Tutoring
% expected cell count less than 5
χ2 df n p
Sought any tutoring 20.8 10.13 11 787 .52 Used the math lab 20.8 7.94 11 779 .72 Used tutoring outside the math lab 20.8 8.84 11 774 .64
Perception. The perception score measures how students prefer to perceive new
information and is measured from sensory to intuitive. Sensors prefer to perceive information
through observations, and intuitions prefer to perceive information through insights and hunches.
After eliminating the cases with missing perception values the relationship between perception
and whether a student receives tutoring was investigated. Table 19 shows the crosstab
frequencies between perception and whether students receive tutoring. The results from the chi-
square tests can be seen in Table 20. No correlation was found between perception and whether
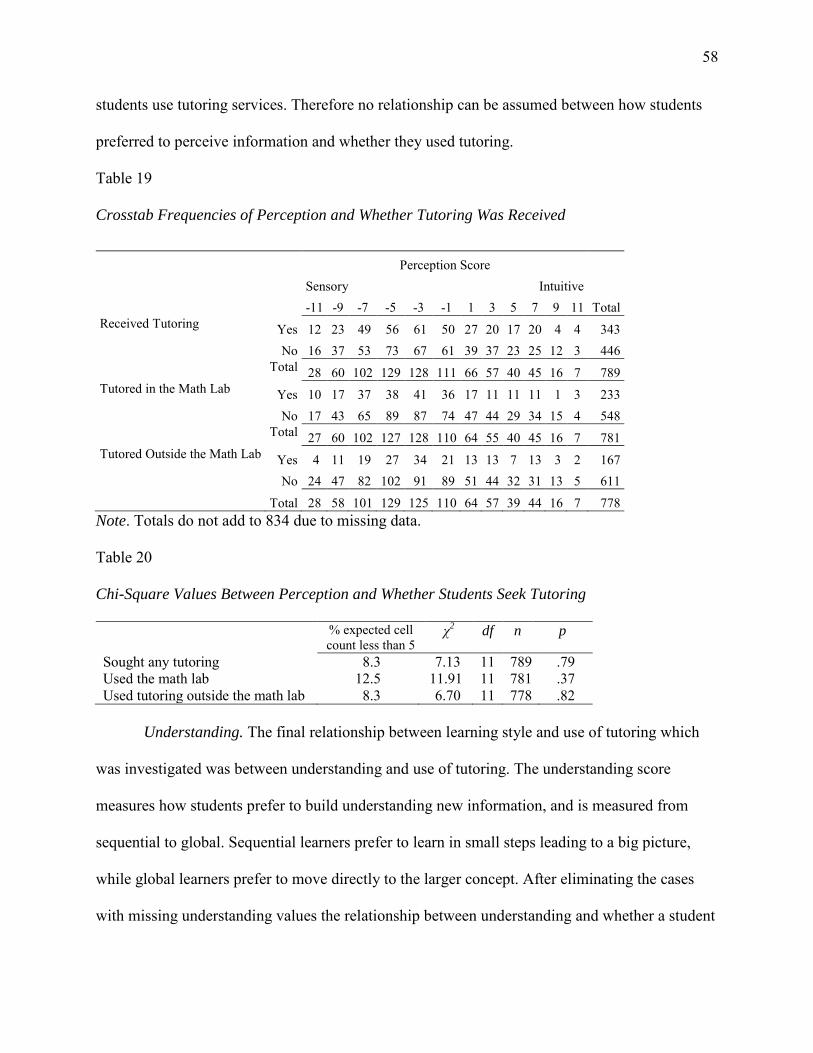
58
students use tutoring services. Therefore no relationship can be assumed between how students
preferred to perceive information and whether they used tutoring.
Table 19
Crosstab Frequencies of Perception and Whether Tutoring Was Received
Perception Score
Total Sensory Intuitive -11 -9 -7 -5 -3 -1 1 3 5 7 9 11
Received Tutoring Yes 12 23 49 56 61 50 27 20 17 20 4 4 343 No 16 37 53 73 67 61 39 37 23 25 12 3 446
Total 28 60 102 129 128 111 66 57 40 45 16 7 789 Tutored in the Math Lab Yes 10 17 37 38 41 36 17 11 11 11 1 3 233
No 17 43 65 89 87 74 47 44 29 34 15 4 548 Total 27 60 102 127 128 110 64 55 40 45 16 7 781
Tutored Outside the Math Lab Yes 4 11 19 27 34 21 13 13 7 13 3 2 167 No 24 47 82 102 91 89 51 44 32 31 13 5 611
Total 28 58 101 129 125 110 64 57 39 44 16 7 778 Note. Totals do not add to 834 due to missing data. Table 20
Chi-Square Values Between Perception and Whether Students Seek Tutoring
% expected cell count less than 5
χ2 df n p
Sought any tutoring 8.3 7.13 11 789 .79 Used the math lab 12.5 11.91 11 781 .37 Used tutoring outside the math lab 8.3 6.70 11 778 .82
Understanding. The final relationship between learning style and use of tutoring which
was investigated was between understanding and use of tutoring. The understanding score
measures how students prefer to build understanding new information, and is measured from
sequential to global. Sequential learners prefer to learn in small steps leading to a big picture,
while global learners prefer to move directly to the larger concept. After eliminating the cases
with missing understanding values the relationship between understanding and whether a student
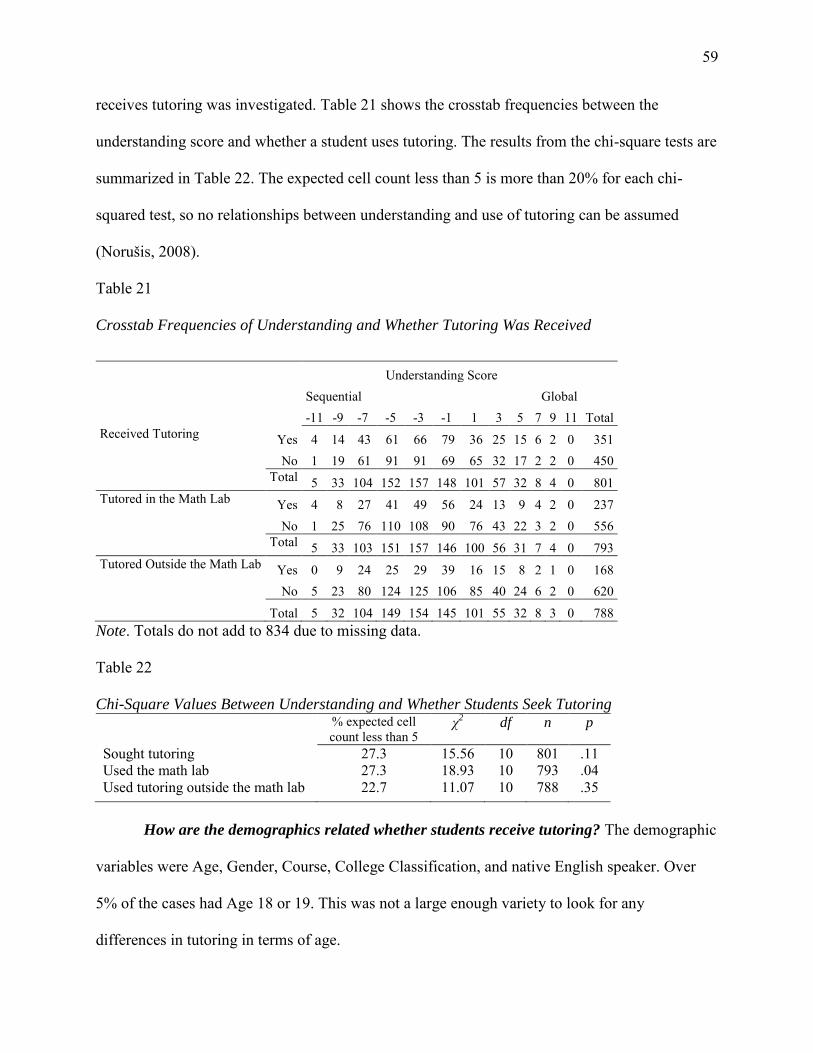
59
receives tutoring was investigated. Table 21 shows the crosstab frequencies between the
understanding score and whether a student uses tutoring. The results from the chi-square tests are
summarized in Table 22. The expected cell count less than 5 is more than 20% for each chi-
squared test, so no relationships between understanding and use of tutoring can be assumed
(Norušis, 2008).
Table 21
Crosstab Frequencies of Understanding and Whether Tutoring Was Received
Understanding Score
Total Sequential Global -11 -9 -7 -5 -3 -1 1 3 5 7 9 11
Received Tutoring Yes 4 14 43 61 66 79 36 25 15 6 2 0 351 No 1 19 61 91 91 69 65 32 17 2 2 0 450
Total 5 33 104 152 157 148 101 57 32 8 4 0 801 Tutored in the Math Lab Yes 4 8 27 41 49 56 24 13 9 4 2 0 237
No 1 25 76 110 108 90 76 43 22 3 2 0 556 Total 5 33 103 151 157 146 100 56 31 7 4 0 793
Tutored Outside the Math Lab Yes 0 9 24 25 29 39 16 15 8 2 1 0 168 No 5 23 80 124 125 106 85 40 24 6 2 0 620
Total 5 32 104 149 154 145 101 55 32 8 3 0 788 Note. Totals do not add to 834 due to missing data. Table 22
Chi-Square Values Between Understanding and Whether Students Seek Tutoring % expected cell
count less than 5 χ
2 df n p
Sought tutoring 27.3 15.56 10 801 .11 Used the math lab 27.3 18.93 10 793 .04 Used tutoring outside the math lab 22.7 11.07 10 788 .35
How are the demographics related whether students receive tutoring? The demographic
variables were Age, Gender, Course, College Classification, and native English speaker. Over
5% of the cases had Age 18 or 19. This was not a large enough variety to look for any
differences in tutoring in terms of age.
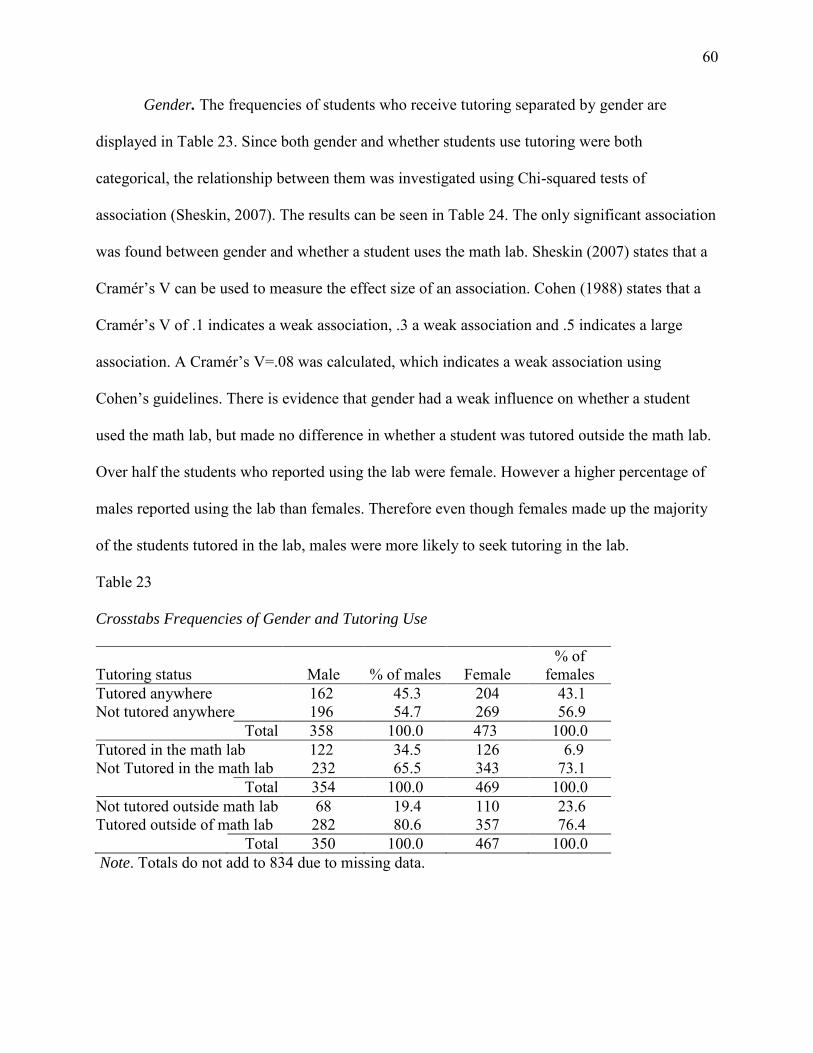
60
Gender. The frequencies of students who receive tutoring separated by gender are
displayed in Table 23. Since both gender and whether students use tutoring were both
categorical, the relationship between them was investigated using Chi-squared tests of
association (Sheskin, 2007). The results can be seen in Table 24. The only significant association
was found between gender and whether a student uses the math lab. Sheskin (2007) states that a
Cramér’s V can be used to measure the effect size of an association. Cohen (1988) states that a
Cramér’s V of .1 indicates a weak association, .3 a weak association and .5 indicates a large
association. A Cramér’s V=.08 was calculated, which indicates a weak association using
Cohen’s guidelines. There is evidence that gender had a weak influence on whether a student
used the math lab, but made no difference in whether a student was tutored outside the math lab.
Over half the students who reported using the lab were female. However a higher percentage of
males reported using the lab than females. Therefore even though females made up the majority
of the students tutored in the lab, males were more likely to seek tutoring in the lab.
Table 23
Crosstabs Frequencies of Gender and Tutoring Use
Tutoring status Male % of males Female % of
females Tutored anywhere 162 45.3 204 43.1 Not tutored anywhere 196 54.7 269 56.9 Total 358 100.0 473 100.0 Tutored in the math lab 122 34.5 126 6.9 Not Tutored in the math lab 232 65.5 343 73.1 Total 354 100.0 469 100.0 Not tutored outside math lab 68 19.4 110 23.6 Tutored outside of math lab 282 80.6 357 76.4 Total 350 100.0 467 100.0 Note. Totals do not add to 834 due to missing data.
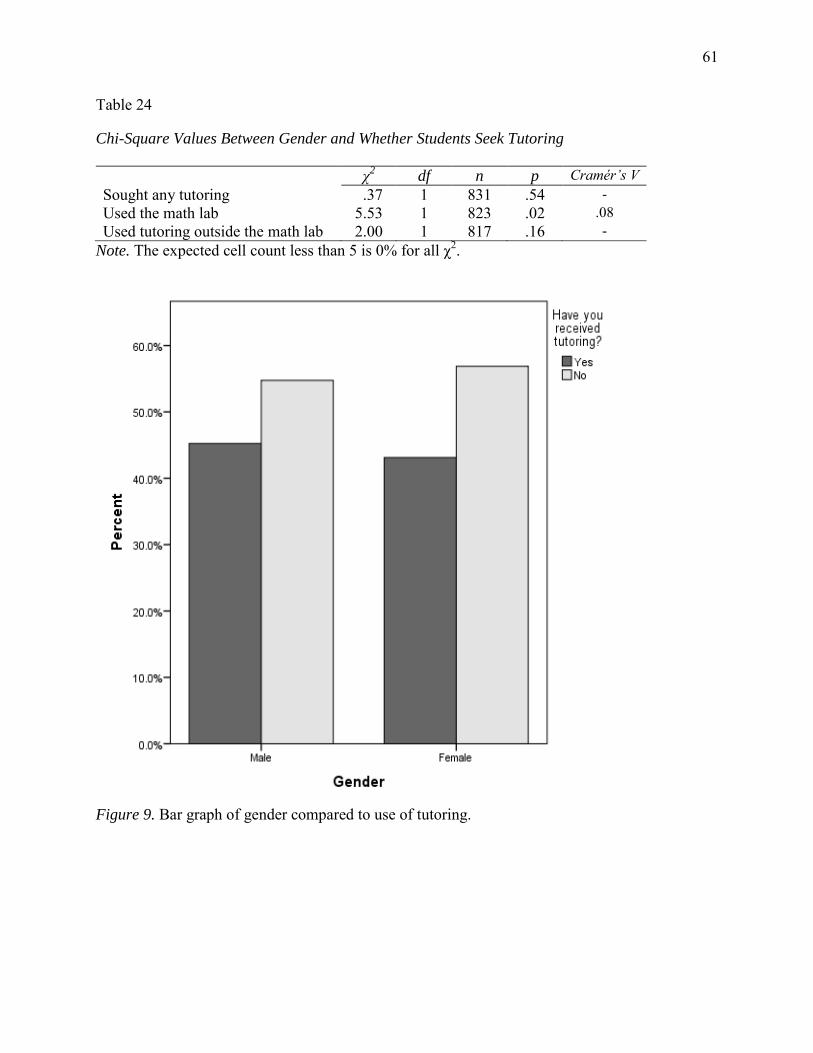
61
Table 24 Chi-Square Values Between Gender and Whether Students Seek Tutoring
χ2 df n p Cramér’s V
Sought any tutoring .37 1 831 .54 - Used the math lab 5.53 1 823 .02 .08 Used tutoring outside the math lab 2.00 1 817 .16 -
Note. The expected cell count less than 5 is 0% for all χ2.
Figure 9. Bar graph of gender compared to use of tutoring.
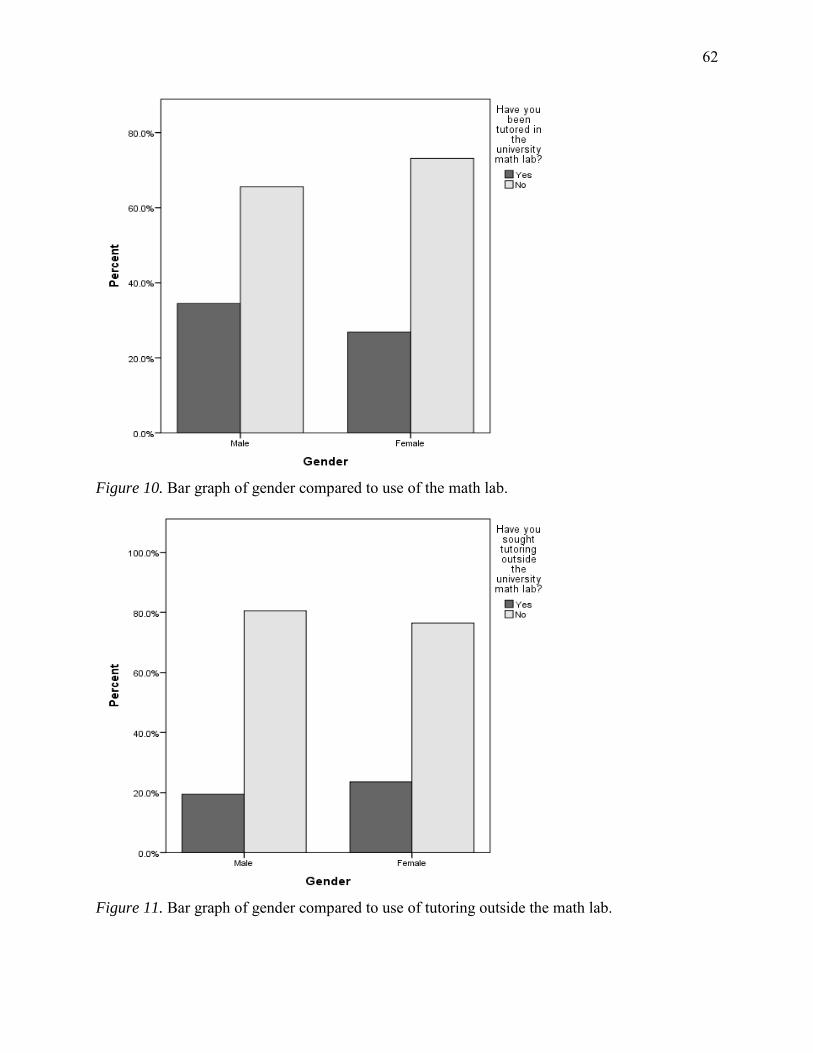
62
Figure 10. Bar graph of gender compared to use of the math lab.
Figure 11. Bar graph of gender compared to use of tutoring outside the math lab.
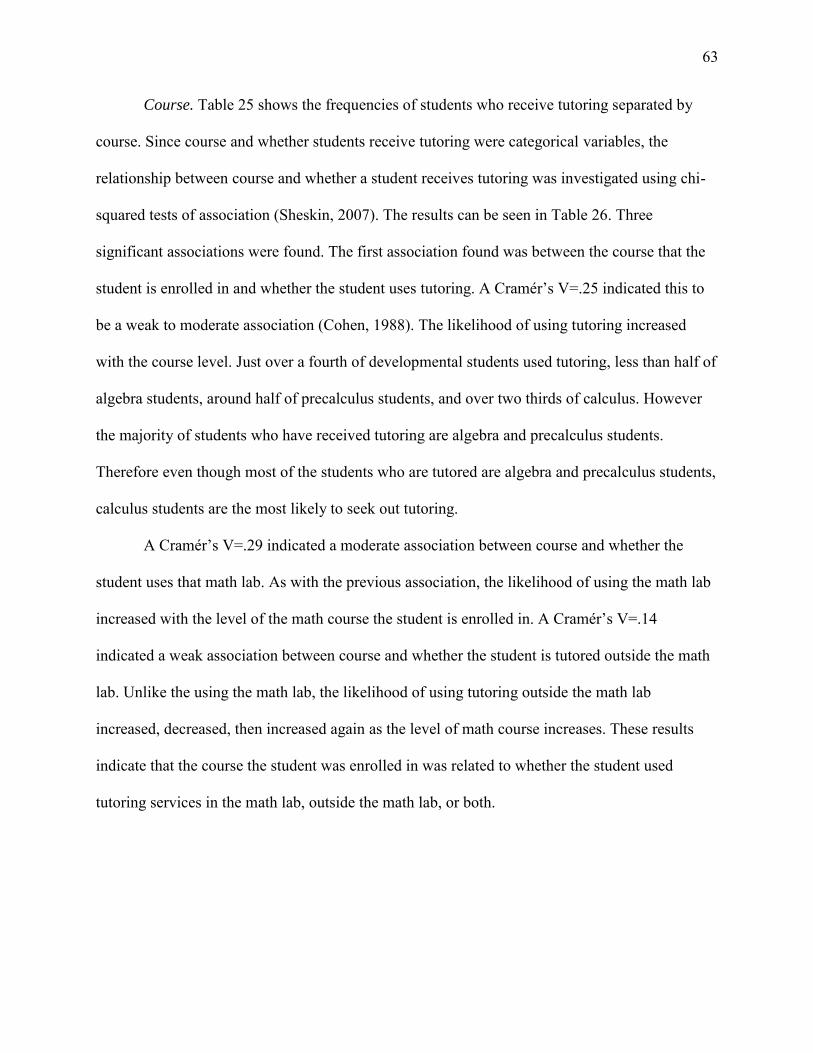
63
Course. Table 25 shows the frequencies of students who receive tutoring separated by
course. Since course and whether students receive tutoring were categorical variables, the
relationship between course and whether a student receives tutoring was investigated using chi-
squared tests of association (Sheskin, 2007). The results can be seen in Table 26. Three
significant associations were found. The first association found was between the course that the
student is enrolled in and whether the student uses tutoring. A Cramér’s V=.25 indicated this to
be a weak to moderate association (Cohen, 1988). The likelihood of using tutoring increased
with the course level. Just over a fourth of developmental students used tutoring, less than half of
algebra students, around half of precalculus students, and over two thirds of calculus. However
the majority of students who have received tutoring are algebra and precalculus students.
Therefore even though most of the students who are tutored are algebra and precalculus students,
calculus students are the most likely to seek out tutoring.
A Cramér’s V=.29 indicated a moderate association between course and whether the
student uses that math lab. As with the previous association, the likelihood of using the math lab
increased with the level of the math course the student is enrolled in. A Cramér’s V=.14
indicated a weak association between course and whether the student is tutored outside the math
lab. Unlike the using the math lab, the likelihood of using tutoring outside the math lab
increased, decreased, then increased again as the level of math course increases. These results
indicate that the course the student was enrolled in was related to whether the student used
tutoring services in the math lab, outside the math lab, or both.
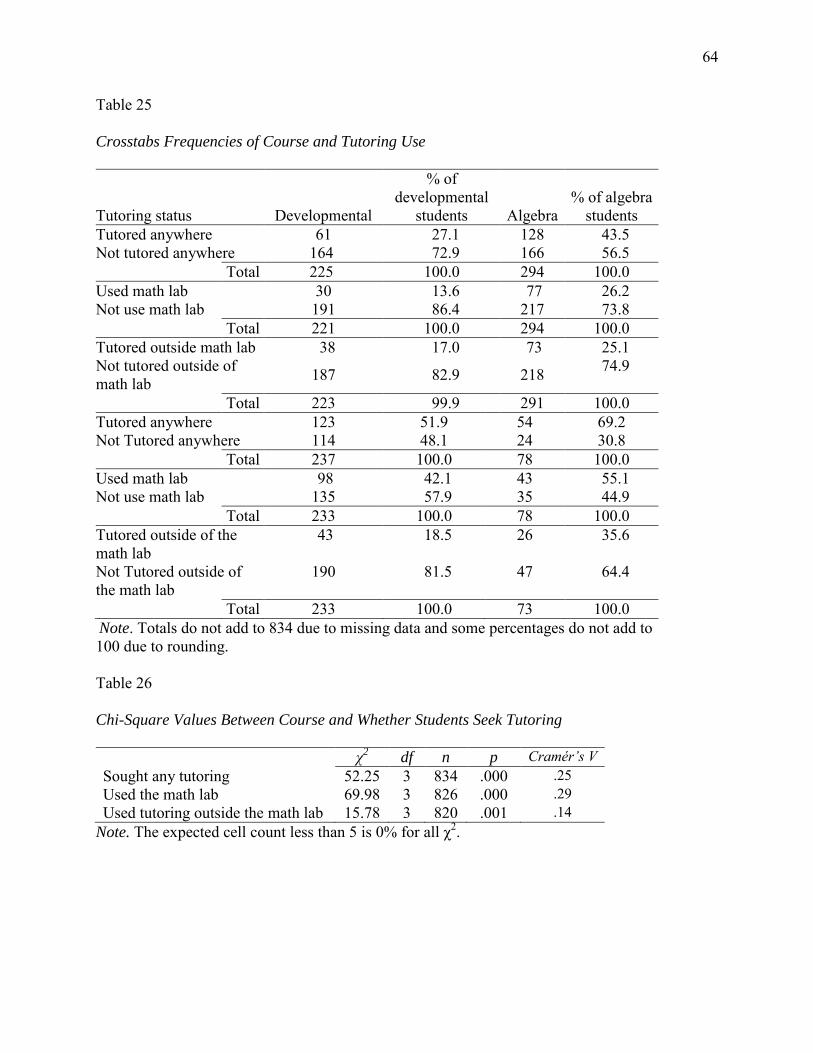
64
Table 25 Crosstabs Frequencies of Course and Tutoring Use
Tutoring status Developmental
% of developmental
students Algebra % of algebra
students Tutored anywhere 61 27.1 128 43.5 Not tutored anywhere 164 72.9 166 56.5 Total 225 100.0 294 100.0 Used math lab 30 13.6 77 26.2 Not use math lab 191 86.4 217 73.8 Total 221 100.0 294 100.0 Tutored outside math lab 38 17.0 73 25.1 Not tutored outside of math lab 187 82.9 218 74.9
Total 223 99.9 291 100.0 Tutored anywhere 123 51.9 54 69.2 Not Tutored anywhere 114 48.1 24 30.8 Total 237 100.0 78 100.0 Used math lab 98 42.1 43 55.1 Not use math lab 135 57.9 35 44.9 Total 233 100.0 78 100.0 Tutored outside of the math lab
43 18.5 26 35.6
Not Tutored outside of the math lab
190 81.5 47 64.4
Total 233 100.0 73 100.0 Note. Totals do not add to 834 due to missing data and some percentages do not add to 100 due to rounding. Table 26
Chi-Square Values Between Course and Whether Students Seek Tutoring
χ2 df n p Cramér’s V
Sought any tutoring 52.25 3 834 .000 .25 Used the math lab 69.98 3 826 .000 .29 Used tutoring outside the math lab 15.78 3 820 .001 .14
Note. The expected cell count less than 5 is 0% for all χ2.
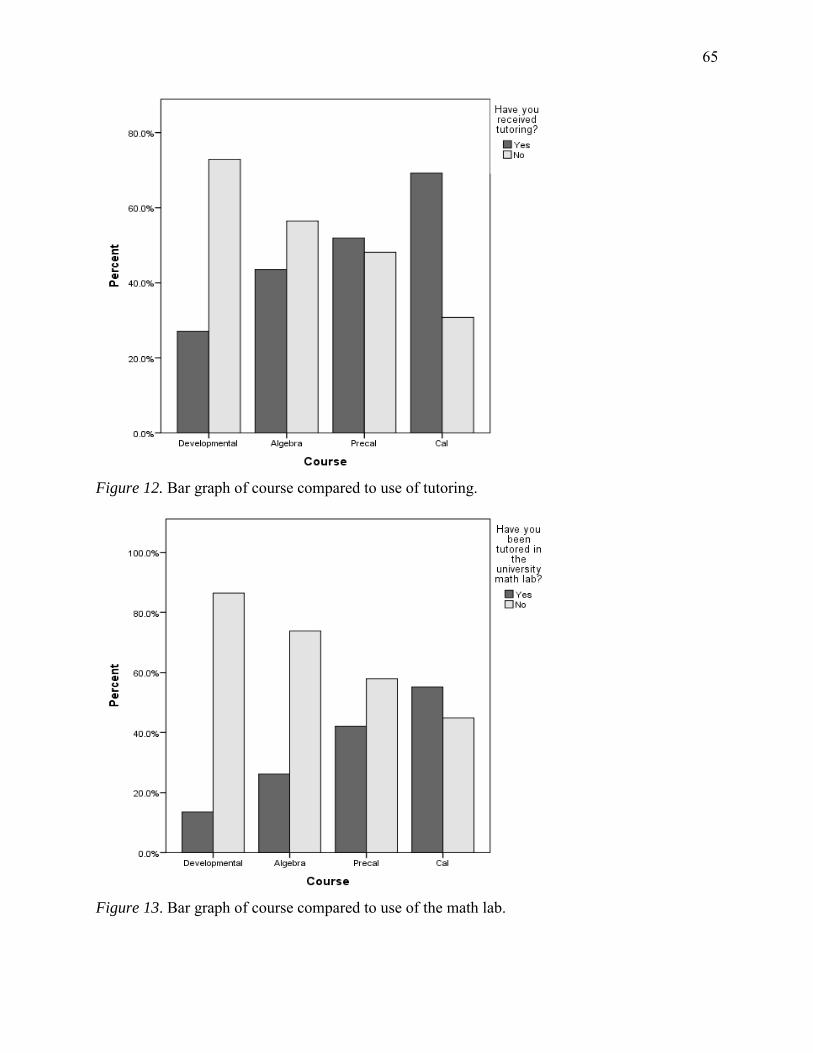
65
Figure 12. Bar graph of course compared to use of tutoring.
Figure 13. Bar graph of course compared to use of the math lab.
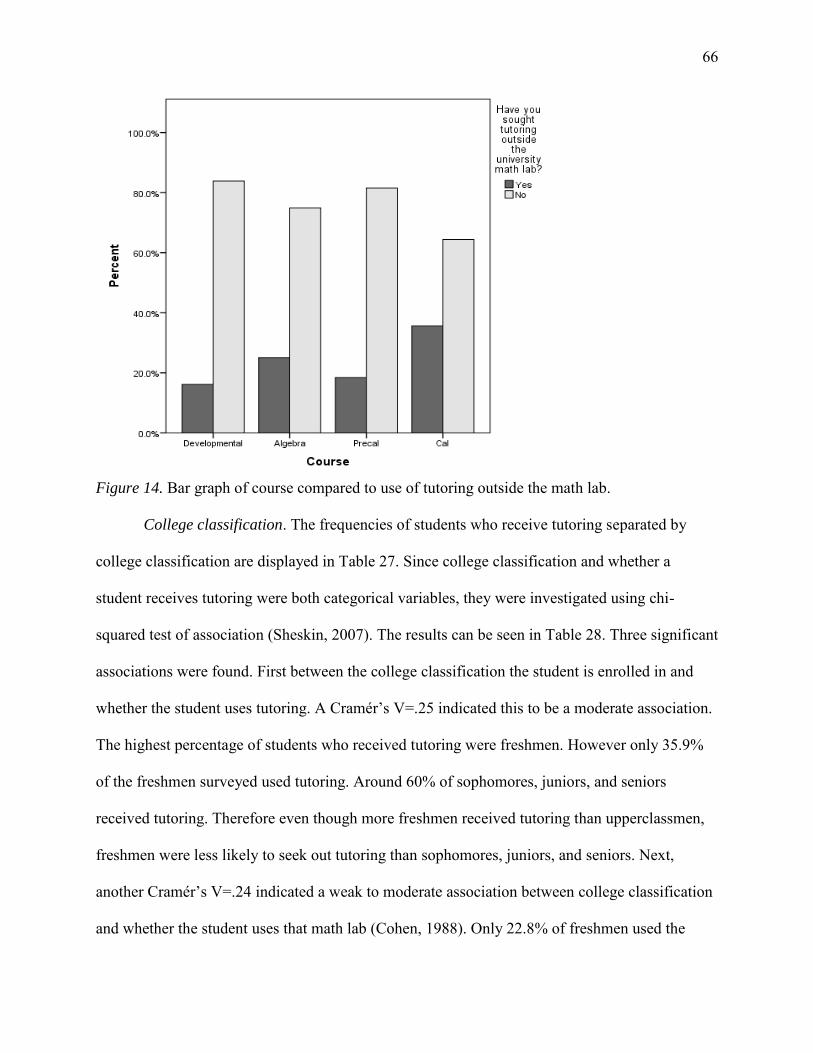
66
Figure 14. Bar graph of course compared to use of tutoring outside the math lab.
College classification. The frequencies of students who receive tutoring separated by
college classification are displayed in Table 27. Since college classification and whether a
student receives tutoring were both categorical variables, they were investigated using chi-
squared test of association (Sheskin, 2007). The results can be seen in Table 28. Three significant
associations were found. First between the college classification the student is enrolled in and
whether the student uses tutoring. A Cramér’s V=.25 indicated this to be a moderate association.
The highest percentage of students who received tutoring were freshmen. However only 35.9%
of the freshmen surveyed used tutoring. Around 60% of sophomores, juniors, and seniors
received tutoring. Therefore even though more freshmen received tutoring than upperclassmen,
freshmen were less likely to seek out tutoring than sophomores, juniors, and seniors. Next,
another Cramér’s V=.24 indicated a weak to moderate association between college classification
and whether the student uses that math lab (Cohen, 1988). Only 22.8% of freshmen used the
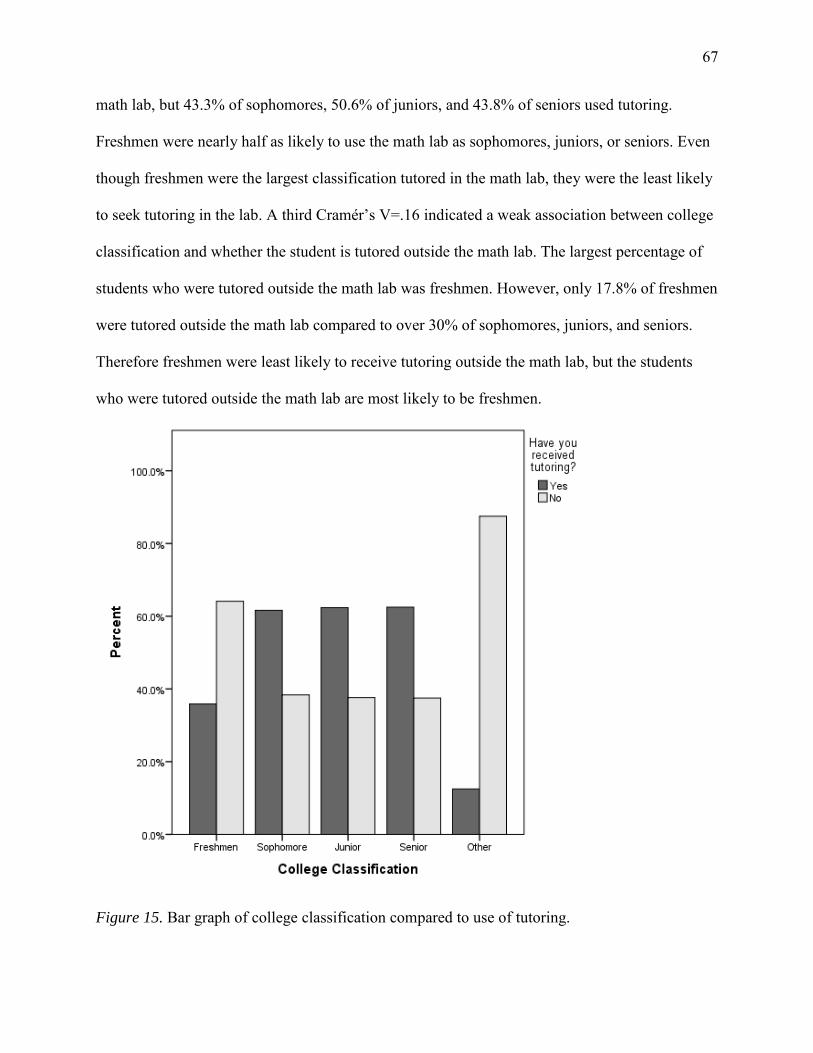
67
math lab, but 43.3% of sophomores, 50.6% of juniors, and 43.8% of seniors used tutoring.
Freshmen were nearly half as likely to use the math lab as sophomores, juniors, or seniors. Even
though freshmen were the largest classification tutored in the math lab, they were the least likely
to seek tutoring in the lab. A third Cramér’s V=.16 indicated a weak association between college
classification and whether the student is tutored outside the math lab. The largest percentage of
students who were tutored outside the math lab was freshmen. However, only 17.8% of freshmen
were tutored outside the math lab compared to over 30% of sophomores, juniors, and seniors.
Therefore freshmen were least likely to receive tutoring outside the math lab, but the students
who were tutored outside the math lab are most likely to be freshmen.
Figure 15. Bar graph of college classification compared to use of tutoring.
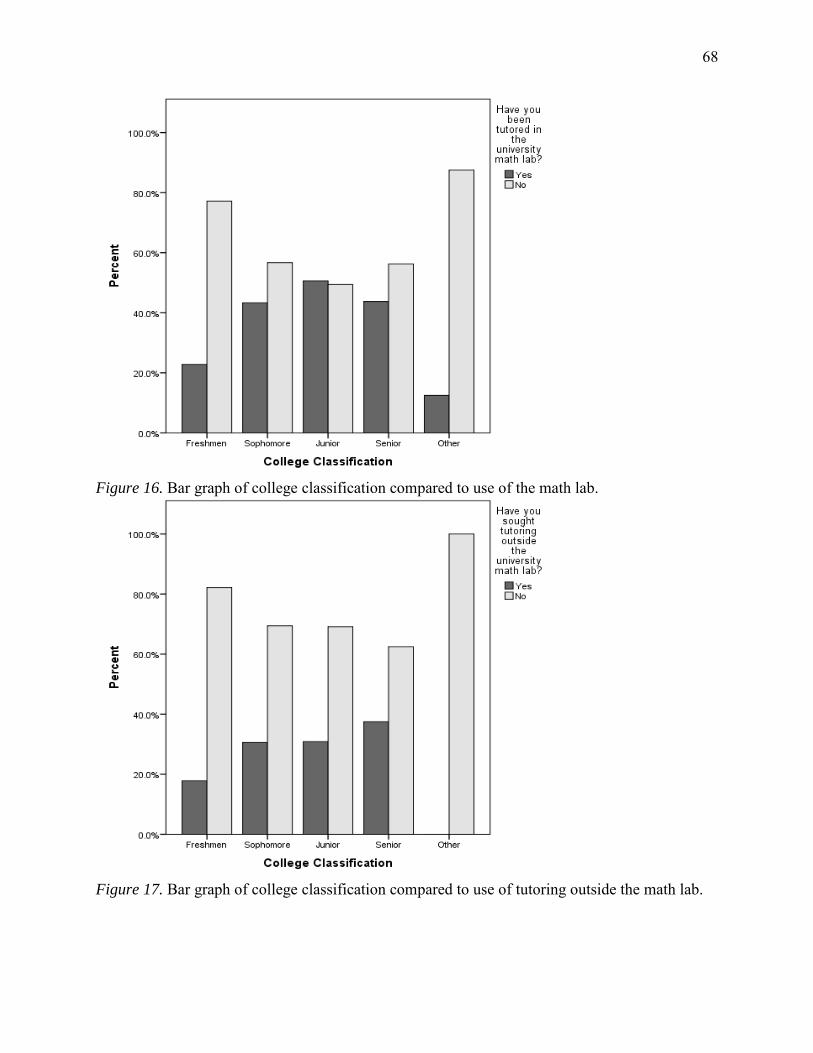
68
Figure 16. Bar graph of college classification compared to use of the math lab.
Figure 17. Bar graph of college classification compared to use of tutoring outside the math lab.
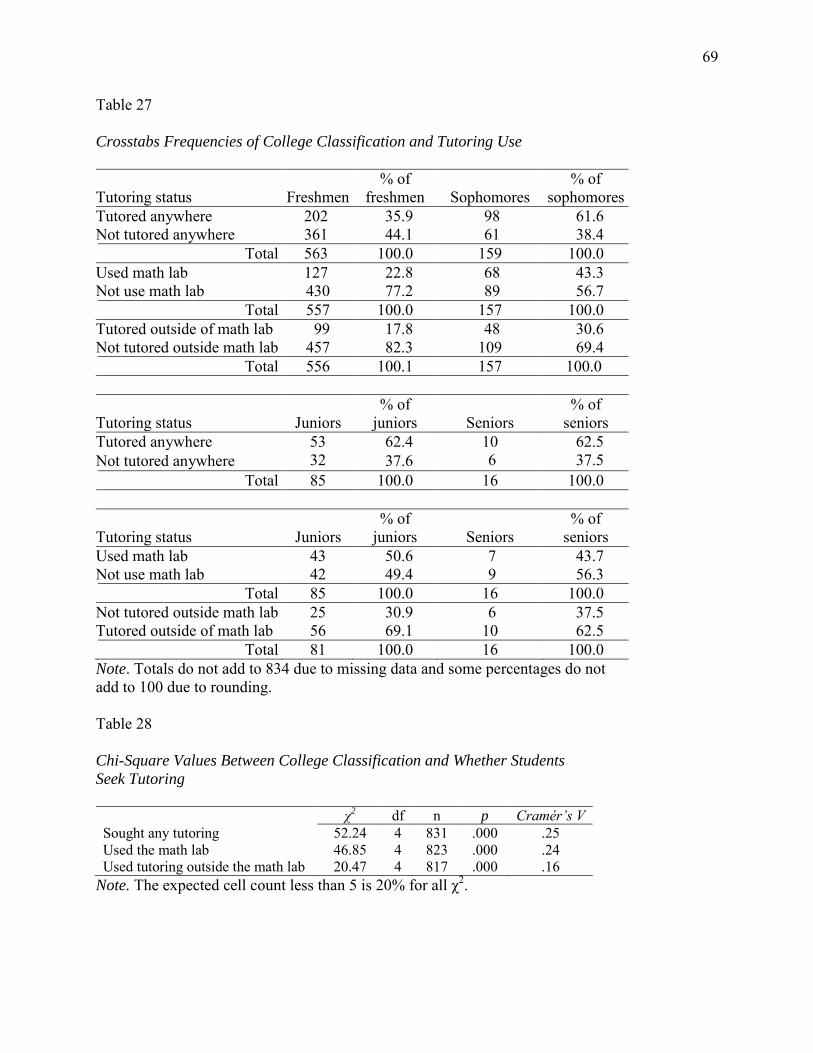
69
Table 27
Crosstabs Frequencies of College Classification and Tutoring Use
Tutoring status Freshmen % of
freshmen Sophomores % of
sophomores Tutored anywhere 202 35.9 98 61.6 Not tutored anywhere 361 44.1 61 38.4 Total 563 100.0 159 100.0 Used math lab 127 22.8 68 43.3 Not use math lab 430 77.2 89 56.7 Total 557 100.0 157 100.0 Tutored outside of math lab 99 17.8 48 30.6 Not tutored outside math lab 457 82.3 109 69.4 Total 556 100.1 157 100.0
Tutoring status Juniors % of
juniors Seniors % of
seniors Tutored anywhere 53 62.4 10 62.5 Not tutored anywhere 32 37.6 6 37.5 Total 85 100.0 16 100.0
Tutoring status Juniors % of
juniors Seniors % of
seniors Used math lab 43 50.6 7 43.7 Not use math lab 42 49.4 9 56.3 Total 85 100.0 16 100.0 Not tutored outside math lab 25 30.9 6 37.5 Tutored outside of math lab 56 69.1 10 62.5 Total 81 100.0 16 100.0 Note. Totals do not add to 834 due to missing data and some percentages do not add to 100 due to rounding. Table 28
Chi-Square Values Between College Classification and Whether Students
Seek Tutoring
χ
2 df n p Cramér’s V
Sought any tutoring 52.24 4 831 .000 .25 Used the math lab 46.85 4 823 .000 .24 Used tutoring outside the math lab 20.47 4 817 .000 .16
Note. The expected cell count less than 5 is 20% for all χ2.
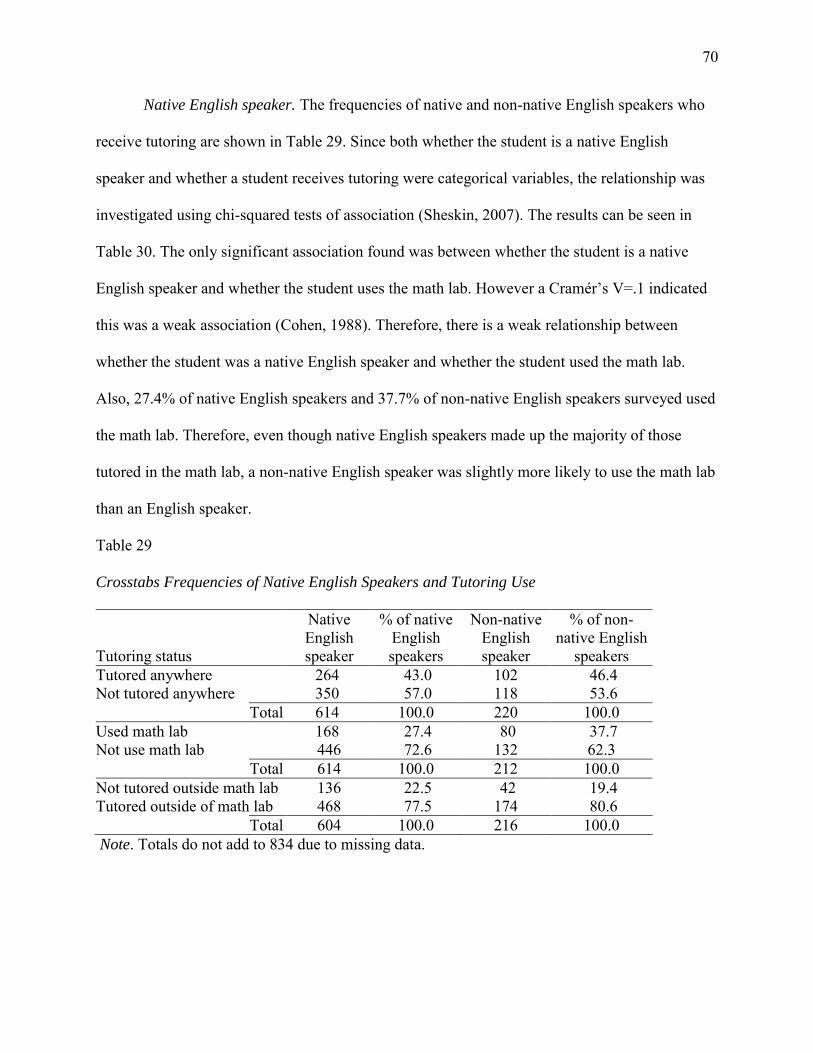
70
Native English speaker. The frequencies of native and non-native English speakers who
receive tutoring are shown in Table 29. Since both whether the student is a native English
speaker and whether a student receives tutoring were categorical variables, the relationship was
investigated using chi-squared tests of association (Sheskin, 2007). The results can be seen in
Table 30. The only significant association found was between whether the student is a native
English speaker and whether the student uses the math lab. However a Cramér’s V=.1 indicated
this was a weak association (Cohen, 1988). Therefore, there is a weak relationship between
whether the student was a native English speaker and whether the student used the math lab.
Also, 27.4% of native English speakers and 37.7% of non-native English speakers surveyed used
the math lab. Therefore, even though native English speakers made up the majority of those
tutored in the math lab, a non-native English speaker was slightly more likely to use the math lab
than an English speaker.
Table 29
Crosstabs Frequencies of Native English Speakers and Tutoring Use
Tutoring status
Native English speaker
% of native English speakers
Non-native English speaker
% of non-native English
speakers Tutored anywhere 264 43.0 102 46.4 Not tutored anywhere 350 57.0 118 53.6 Total 614 100.0 220 100.0 Used math lab 168 27.4 80 37.7 Not use math lab 446 72.6 132 62.3 Total 614 100.0 212 100.0 Not tutored outside math lab 136 22.5 42 19.4 Tutored outside of math lab 468 77.5 174 80.6 Total 604 100.0 216 100.0 Note. Totals do not add to 834 due to missing data.
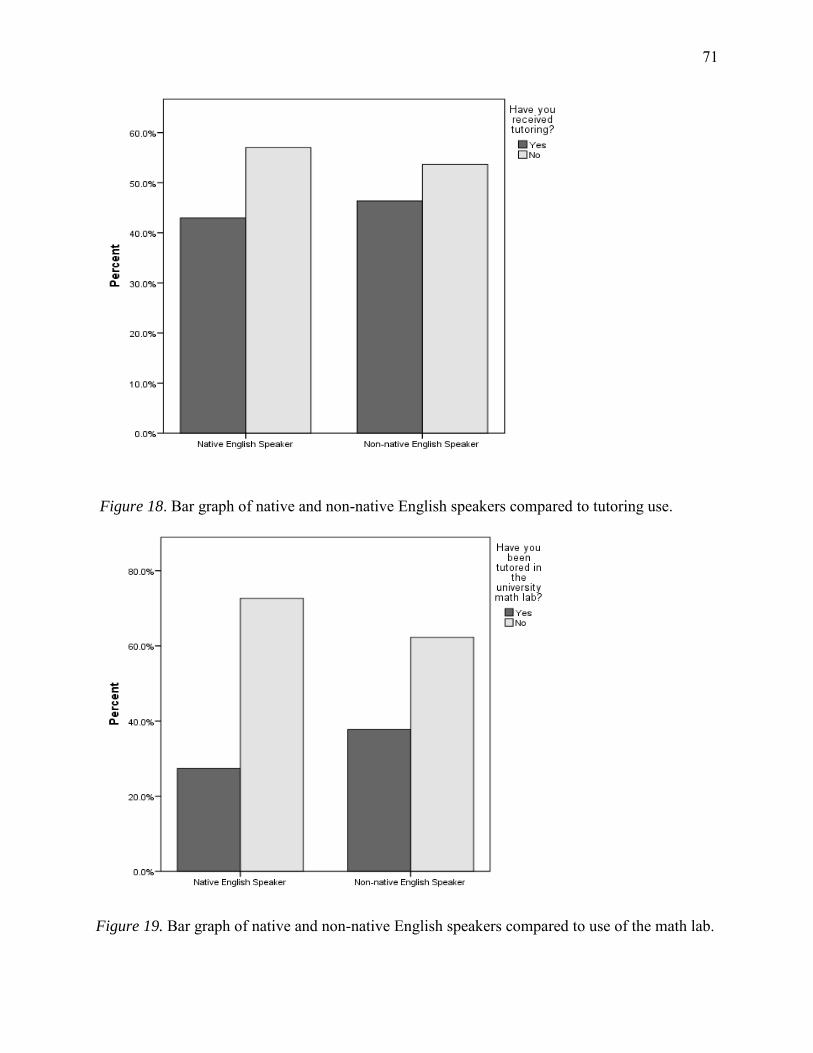
71
Figure 18. Bar graph of native and non-native English speakers compared to tutoring use.
Figure 19. Bar graph of native and non-native English speakers compared to use of the math lab.
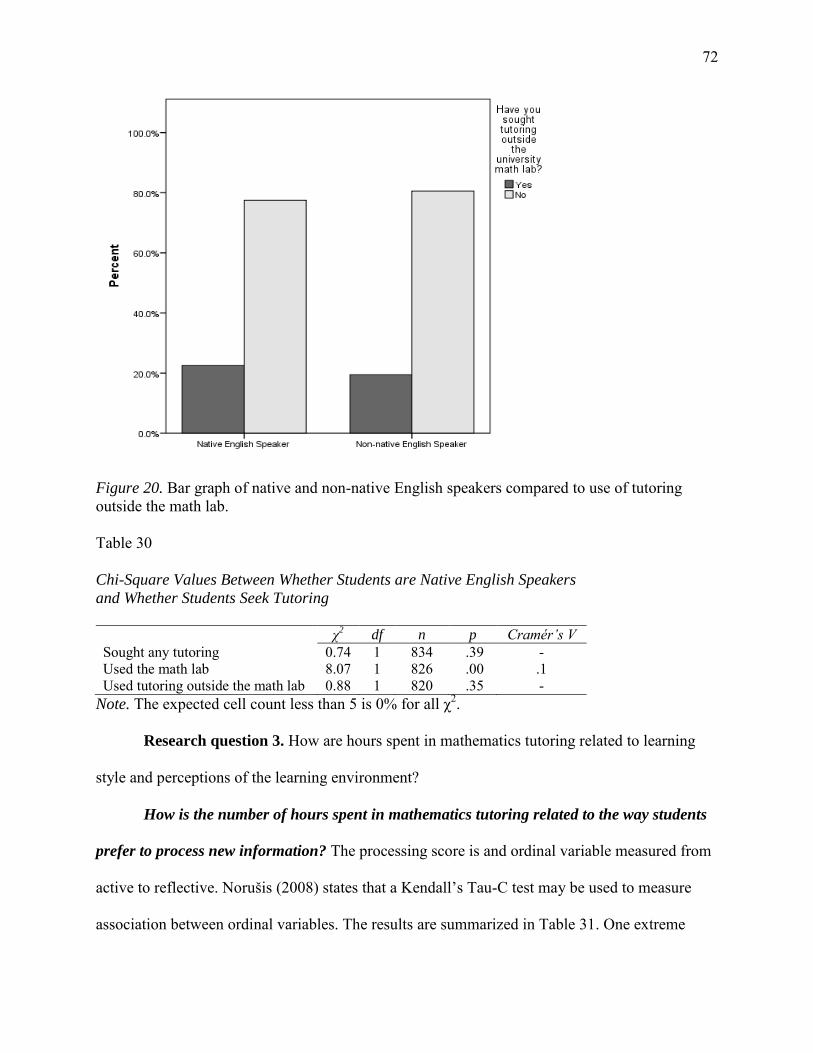
72
Figure 20. Bar graph of native and non-native English speakers compared to use of tutoring outside the math lab. Table 30
Chi-Square Values Between Whether Students are Native English Speakers
and Whether Students Seek Tutoring
χ
2 df n p Cramér’s V
Sought any tutoring 0.74 1 834 .39 - Used the math lab 8.07 1 826 .00 .1 Used tutoring outside the math lab 0.88 1 820 .35 -
Note. The expected cell count less than 5 is 0% for all χ2.
Research question 3. How are hours spent in mathematics tutoring related to learning
style and perceptions of the learning environment?
How is the number of hours spent in mathematics tutoring related to the way students
prefer to process new information? The processing score is and ordinal variable measured from
active to reflective. Norušis (2008) states that a Kendall’s Tau-C test may be used to measure
association between ordinal variables. The results are summarized in Table 31. One extreme
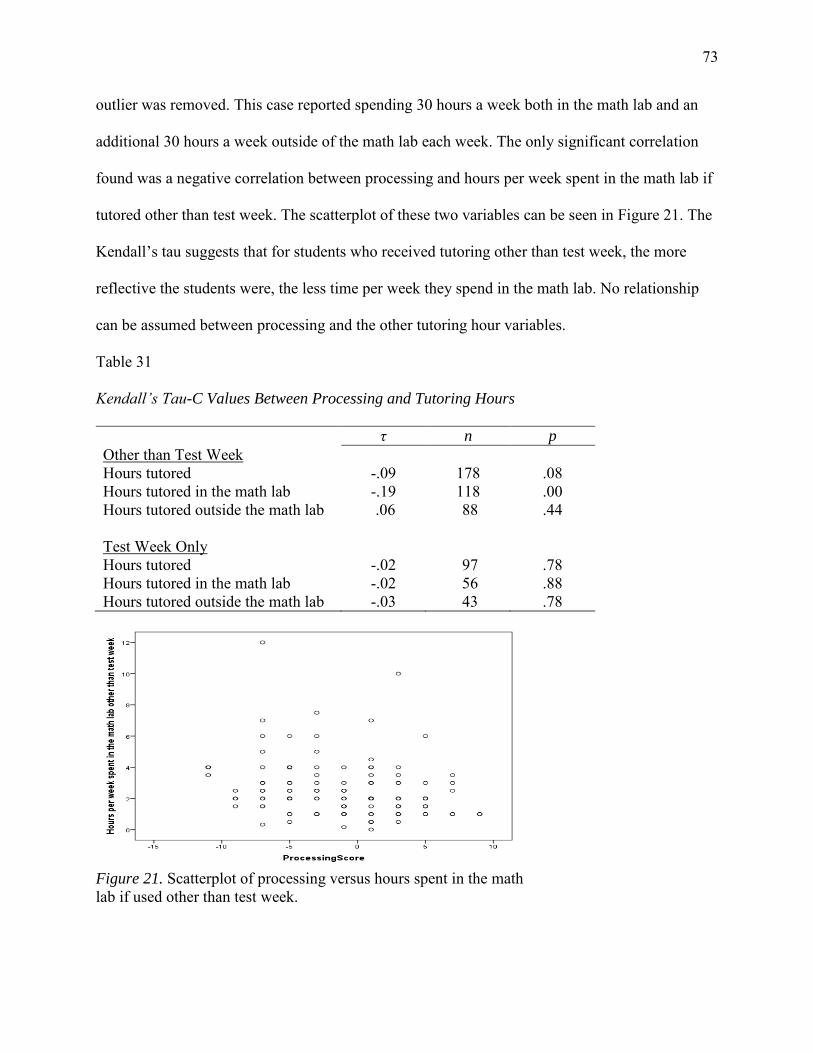
73
outlier was removed. This case reported spending 30 hours a week both in the math lab and an
additional 30 hours a week outside of the math lab each week. The only significant correlation
found was a negative correlation between processing and hours per week spent in the math lab if
tutored other than test week. The scatterplot of these two variables can be seen in Figure 21. The
Kendall’s tau suggests that for students who received tutoring other than test week, the more
reflective the students were, the less time per week they spend in the math lab. No relationship
can be assumed between processing and the other tutoring hour variables.
Table 31
Kendall’s Tau-C Values Between Processing and Tutoring Hours
τ n p
Other than Test Week Hours tutored -.09 178 .08 Hours tutored in the math lab -.19 118 .00 Hours tutored outside the math lab .06 88 .44
Test Week Only Hours tutored -.02 97 .78 Hours tutored in the math lab -.02 56 .88 Hours tutored outside the math lab -.03 43 .78
Figure 21. Scatterplot of processing versus hours spent in the math lab if used other than test week.
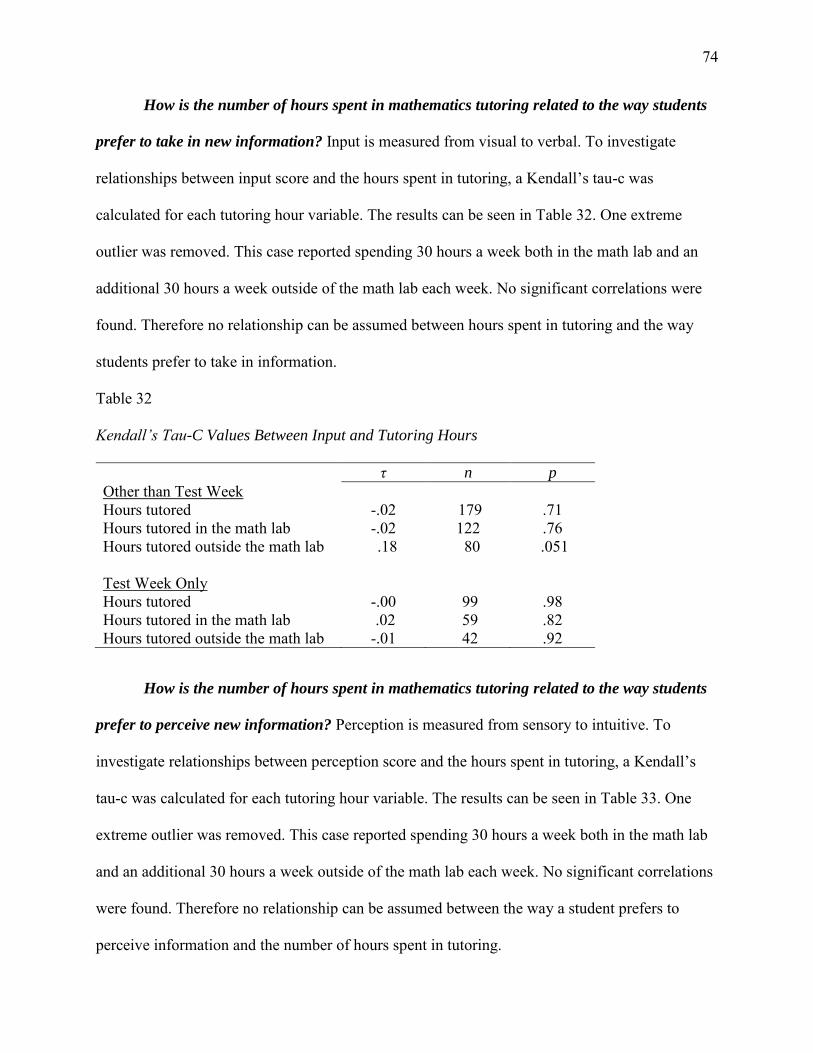
74
How is the number of hours spent in mathematics tutoring related to the way students
prefer to take in new information? Input is measured from visual to verbal. To investigate
relationships between input score and the hours spent in tutoring, a Kendall’s tau-c was
calculated for each tutoring hour variable. The results can be seen in Table 32. One extreme
outlier was removed. This case reported spending 30 hours a week both in the math lab and an
additional 30 hours a week outside of the math lab each week. No significant correlations were
found. Therefore no relationship can be assumed between hours spent in tutoring and the way
students prefer to take in information.
Table 32
Kendall’s Tau-C Values Between Input and Tutoring Hours
τ n p
Other than Test Week Hours tutored -.02 179 .71 Hours tutored in the math lab -.02 122 .76 Hours tutored outside the math lab .18 80 .051
Test Week Only Hours tutored -.00 99 .98 Hours tutored in the math lab .02 59 .82 Hours tutored outside the math lab -.01 42 .92
How is the number of hours spent in mathematics tutoring related to the way students
prefer to perceive new information? Perception is measured from sensory to intuitive. To
investigate relationships between perception score and the hours spent in tutoring, a Kendall’s
tau-c was calculated for each tutoring hour variable. The results can be seen in Table 33. One
extreme outlier was removed. This case reported spending 30 hours a week both in the math lab
and an additional 30 hours a week outside of the math lab each week. No significant correlations
were found. Therefore no relationship can be assumed between the way a student prefers to
perceive information and the number of hours spent in tutoring.
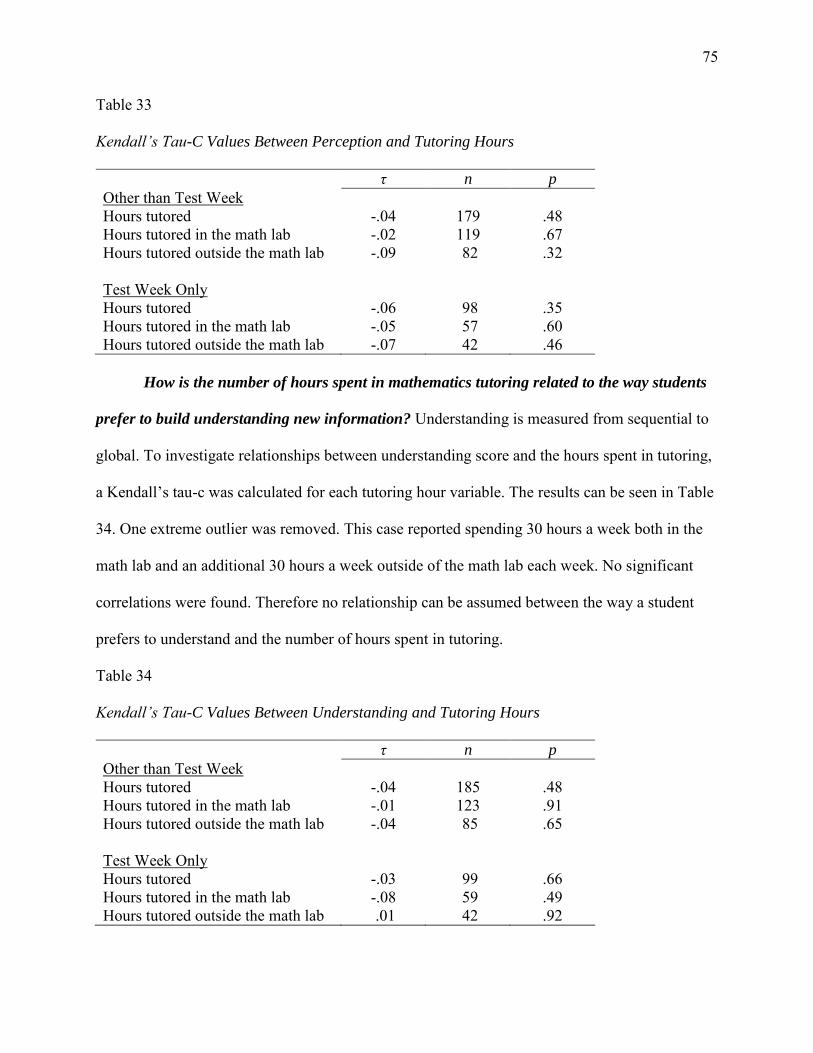
75
Table 33
Kendall’s Tau-C Values Between Perception and Tutoring Hours
τ n p
Other than Test Week Hours tutored -.04 179 .48 Hours tutored in the math lab -.02 119 .67 Hours tutored outside the math lab -.09 82 .32
Test Week Only Hours tutored -.06 98 .35 Hours tutored in the math lab -.05 57 .60 Hours tutored outside the math lab -.07 42 .46
How is the number of hours spent in mathematics tutoring related to the way students
prefer to build understanding new information? Understanding is measured from sequential to
global. To investigate relationships between understanding score and the hours spent in tutoring,
a Kendall’s tau-c was calculated for each tutoring hour variable. The results can be seen in Table
34. One extreme outlier was removed. This case reported spending 30 hours a week both in the
math lab and an additional 30 hours a week outside of the math lab each week. No significant
correlations were found. Therefore no relationship can be assumed between the way a student
prefers to understand and the number of hours spent in tutoring.
Table 34
Kendall’s Tau-C Values Between Understanding and Tutoring Hours
τ n p
Other than Test Week Hours tutored -.04 185 .48 Hours tutored in the math lab -.01 123 .91 Hours tutored outside the math lab -.04 85 .65
Test Week Only Hours tutored -.03 99 .66 Hours tutored in the math lab -.08 59 .49 Hours tutored outside the math lab .01 42 .92
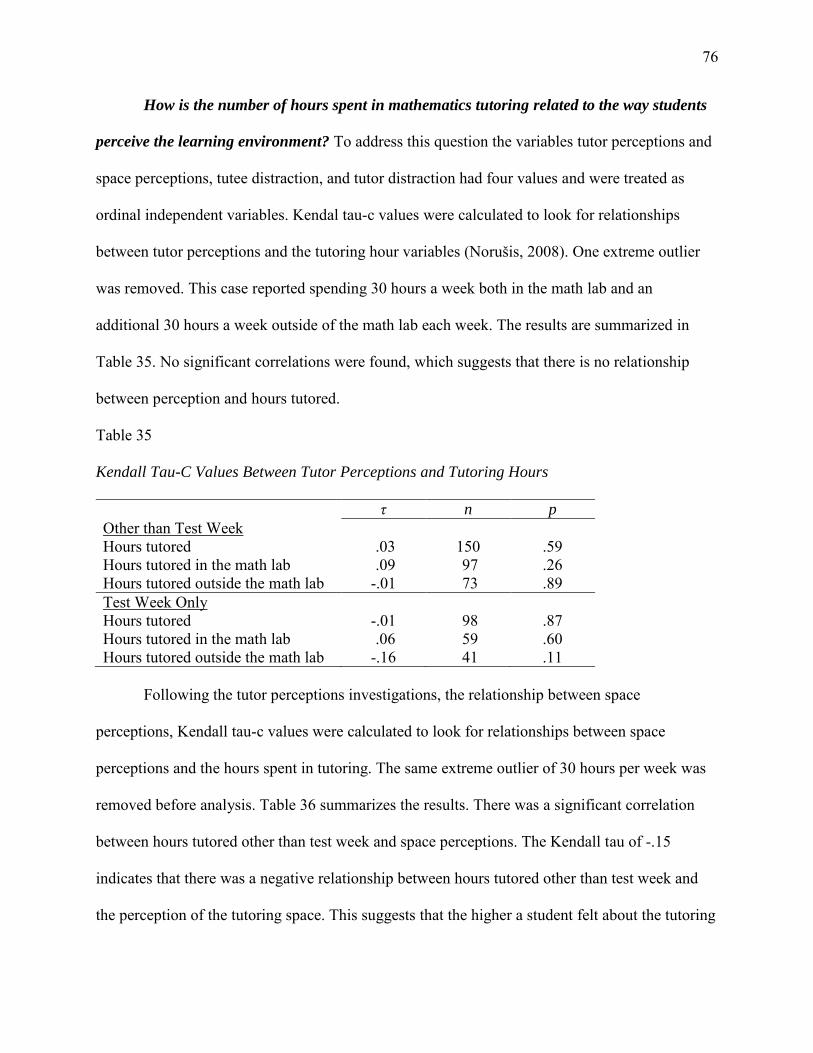
76
How is the number of hours spent in mathematics tutoring related to the way students
perceive the learning environment? To address this question the variables tutor perceptions and
space perceptions, tutee distraction, and tutor distraction had four values and were treated as
ordinal independent variables. Kendal tau-c values were calculated to look for relationships
between tutor perceptions and the tutoring hour variables (Norušis, 2008). One extreme outlier
was removed. This case reported spending 30 hours a week both in the math lab and an
additional 30 hours a week outside of the math lab each week. The results are summarized in
Table 35. No significant correlations were found, which suggests that there is no relationship
between perception and hours tutored.
Table 35
Kendall Tau-C Values Between Tutor Perceptions and Tutoring Hours
τ n p
Other than Test Week Hours tutored .03 150 .59 Hours tutored in the math lab .09 97 .26 Hours tutored outside the math lab -.01 73 .89 Test Week Only Hours tutored -.01 98 .87 Hours tutored in the math lab .06 59 .60 Hours tutored outside the math lab -.16 41 .11
Following the tutor perceptions investigations, the relationship between space
perceptions, Kendall tau-c values were calculated to look for relationships between space
perceptions and the hours spent in tutoring. The same extreme outlier of 30 hours per week was
removed before analysis. Table 36 summarizes the results. There was a significant correlation
between hours tutored other than test week and space perceptions. The Kendall tau of -.15
indicates that there was a negative relationship between hours tutored other than test week and
the perception of the tutoring space. This suggests that the higher a student felt about the tutoring
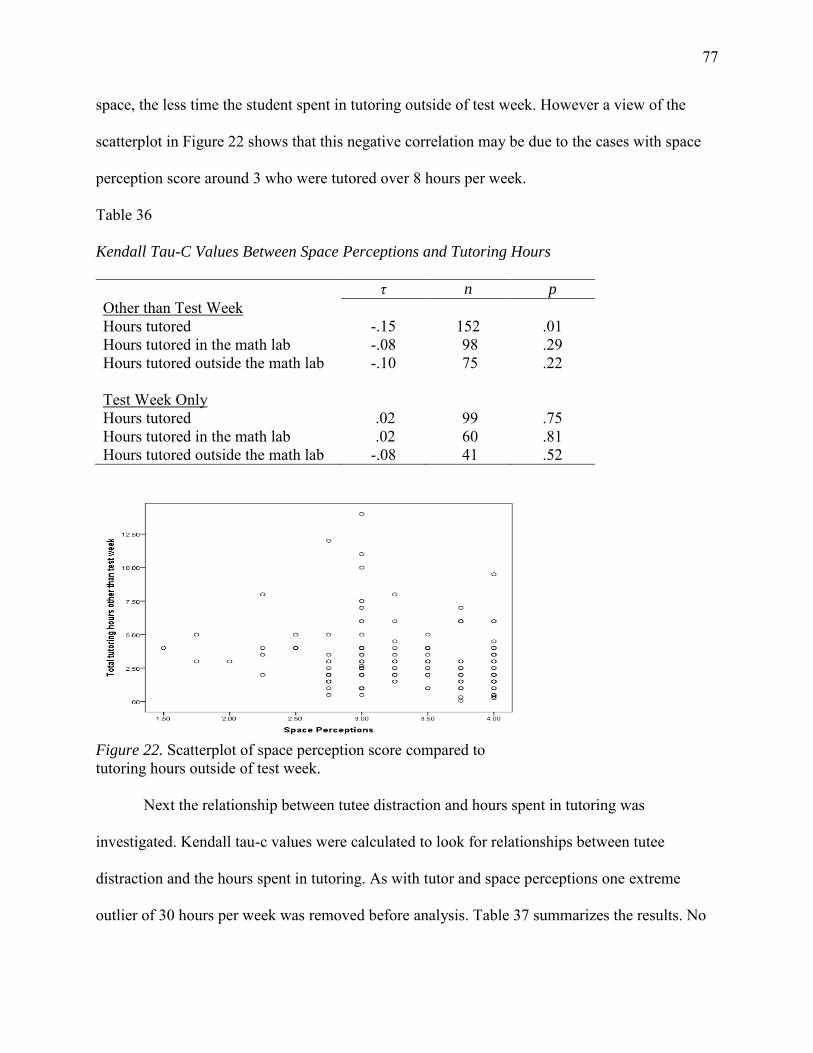
77
space, the less time the student spent in tutoring outside of test week. However a view of the
scatterplot in Figure 22 shows that this negative correlation may be due to the cases with space
perception score around 3 who were tutored over 8 hours per week.
Table 36
Kendall Tau-C Values Between Space Perceptions and Tutoring Hours
τ n p
Other than Test Week Hours tutored -.15 152 .01 Hours tutored in the math lab -.08 98 .29 Hours tutored outside the math lab -.10 75 .22
Test Week Only Hours tutored .02 99 .75 Hours tutored in the math lab .02 60 .81 Hours tutored outside the math lab -.08 41 .52
Figure 22. Scatterplot of space perception score compared to tutoring hours outside of test week.
Next the relationship between tutee distraction and hours spent in tutoring was
investigated. Kendall tau-c values were calculated to look for relationships between tutee
distraction and the hours spent in tutoring. As with tutor and space perceptions one extreme
outlier of 30 hours per week was removed before analysis. Table 37 summarizes the results. No
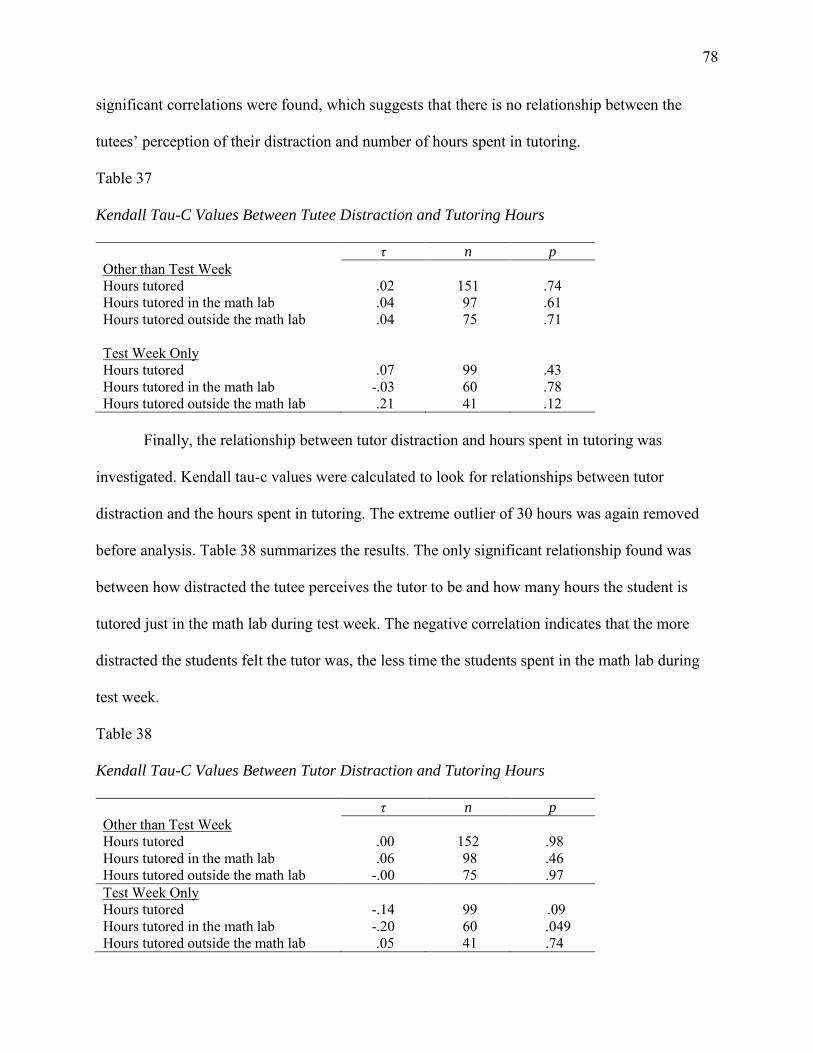
78
significant correlations were found, which suggests that there is no relationship between the
tutees’ perception of their distraction and number of hours spent in tutoring.
Table 37
Kendall Tau-C Values Between Tutee Distraction and Tutoring Hours
τ n p
Other than Test Week Hours tutored .02 151 .74 Hours tutored in the math lab .04 97 .61 Hours tutored outside the math lab .04 75 .71
Test Week Only Hours tutored .07 99 .43 Hours tutored in the math lab -.03 60 .78 Hours tutored outside the math lab .21 41 .12
Finally, the relationship between tutor distraction and hours spent in tutoring was
investigated. Kendall tau-c values were calculated to look for relationships between tutor
distraction and the hours spent in tutoring. The extreme outlier of 30 hours was again removed
before analysis. Table 38 summarizes the results. The only significant relationship found was
between how distracted the tutee perceives the tutor to be and how many hours the student is
tutored just in the math lab during test week. The negative correlation indicates that the more
distracted the students felt the tutor was, the less time the students spent in the math lab during
test week.
Table 38
Kendall Tau-C Values Between Tutor Distraction and Tutoring Hours
τ n p
Other than Test Week Hours tutored .00 152 .98 Hours tutored in the math lab .06 98 .46 Hours tutored outside the math lab -.00 75 .97 Test Week Only
Hours tutored -.14 99 .09 Hours tutored in the math lab -.20 60 .049 Hours tutored outside the math lab .05 41 .74
79
Research question 4. What is the difference in hours spent in tutoring among the
demographic categories?
Gender. Norušis (2008) states an independent sample t-test should be used to test
whether two populations’ means are equal. To use an independent sample t-test, the distributions
for each population must be normally distributed. The number of hours tutored in or out of the
math lab was not normally distributed among males and females. Logarithmic, and root
transformations did not produce a normally distributed population. When the population
distributions are not normal, Norušis recommends using the non-parametric Mann-Whitney U
test in order to test whether two populations’ medians are equal. Therefore non-parametric
Mann-Whitney U tests were performed to test whether there was a difference in the median
hours spent in tutoring between genders. The results can be seen in Table 39. The only
significant difference found was between median hours per week spent in the math lab if used
other than test week. This suggests that there was a difference of number of hours per week spent
in the tutoring lab if used other than test week for males and females. The median value for hours
per week spent in the math tutoring lab for males was 2.5 hours, and the median for females was
2 hours. Since there is a significant difference in the median hours per week spent in the math
tutoring lab between genders and the median for males was greater than females, there is
evidence that males spend more time per week in the lab than females if the lab is used other
than the week of a test.
Course. Norušis (2008) states that an analysis of variance should be used to test whether
there is a difference in means among several independent populations. One of the conditions for
an analysis of variance is that the data must be normally distributed among all the populations.
Agresit and Finlay (2009) state that a sample greater than 30 is needed for normality to be
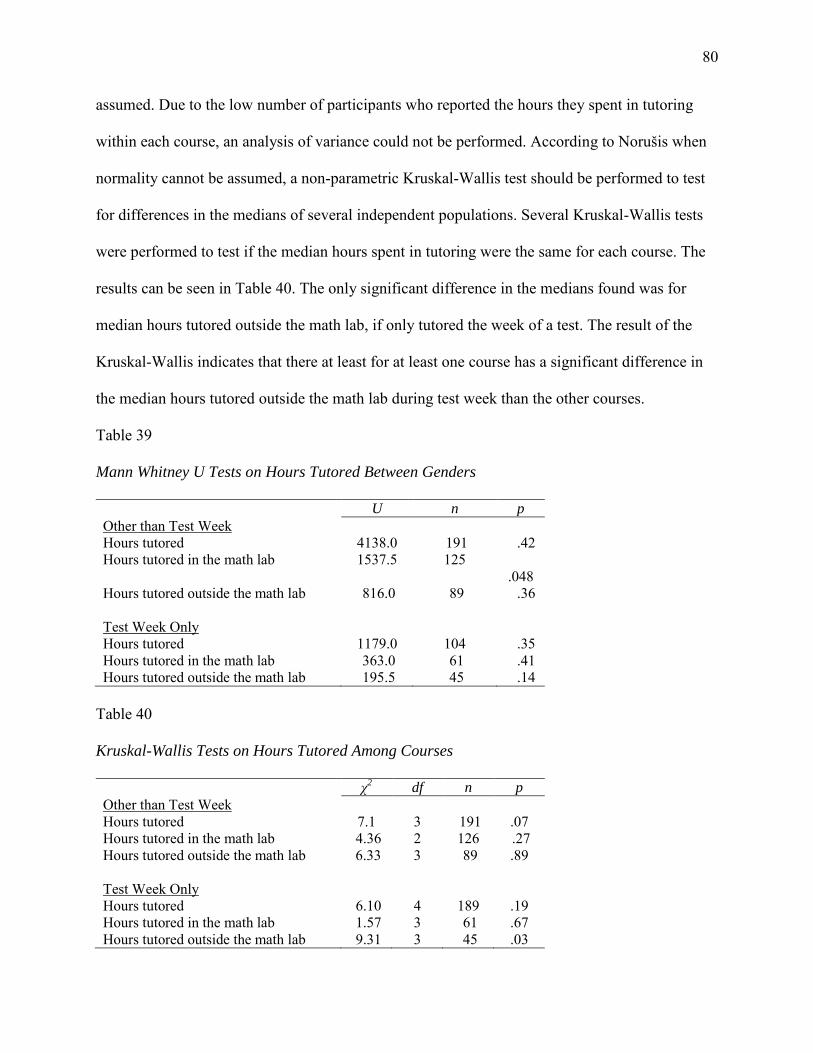
80
assumed. Due to the low number of participants who reported the hours they spent in tutoring
within each course, an analysis of variance could not be performed. According to Norušis when
normality cannot be assumed, a non-parametric Kruskal-Wallis test should be performed to test
for differences in the medians of several independent populations. Several Kruskal-Wallis tests
were performed to test if the median hours spent in tutoring were the same for each course. The
results can be seen in Table 40. The only significant difference in the medians found was for
median hours tutored outside the math lab, if only tutored the week of a test. The result of the
Kruskal-Wallis indicates that there at least for at least one course has a significant difference in
the median hours tutored outside the math lab during test week than the other courses.
Table 39
Mann Whitney U Tests on Hours Tutored Between Genders
U n p
Other than Test Week Hours tutored 4138.0 191 .42 Hours tutored in the math lab 1537.5 125
.048 Hours tutored outside the math lab 816.0 89 .36
Test Week Only Hours tutored 1179.0 104 .35 Hours tutored in the math lab 363.0 61 .41 Hours tutored outside the math lab 195.5 45 .14
Table 40
Kruskal-Wallis Tests on Hours Tutored Among Courses
χ2 df n p
Other than Test Week Hours tutored 7.1 3 191 .07 Hours tutored in the math lab 4.36 2 126 .27 Hours tutored outside the math lab 6.33 3 89 .89
Test Week Only Hours tutored 6.10 4 189 .19 Hours tutored in the math lab 1.57 3 61 .67 Hours tutored outside the math lab 9.31 3 45 .03
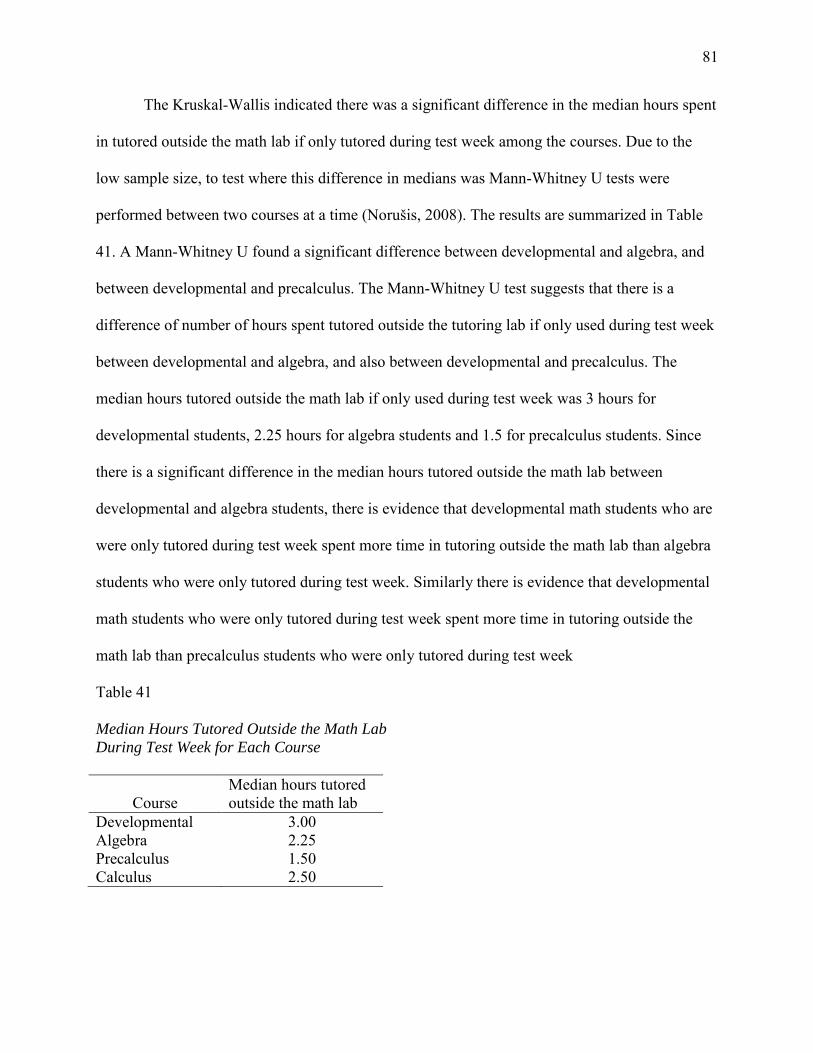
81
The Kruskal-Wallis indicated there was a significant difference in the median hours spent
in tutored outside the math lab if only tutored during test week among the courses. Due to the
low sample size, to test where this difference in medians was Mann-Whitney U tests were
performed between two courses at a time (Norušis, 2008). The results are summarized in Table
41. A Mann-Whitney U found a significant difference between developmental and algebra, and
between developmental and precalculus. The Mann-Whitney U test suggests that there is a
difference of number of hours spent tutored outside the tutoring lab if only used during test week
between developmental and algebra, and also between developmental and precalculus. The
median hours tutored outside the math lab if only used during test week was 3 hours for
developmental students, 2.25 hours for algebra students and 1.5 for precalculus students. Since
there is a significant difference in the median hours tutored outside the math lab between
developmental and algebra students, there is evidence that developmental math students who are
were only tutored during test week spent more time in tutoring outside the math lab than algebra
students who were only tutored during test week. Similarly there is evidence that developmental
math students who were only tutored during test week spent more time in tutoring outside the
math lab than precalculus students who were only tutored during test week
Table 41
Median Hours Tutored Outside the Math Lab
During Test Week for Each Course
Course Median hours tutored outside the math lab
Developmental 3.00 Algebra 2.25 Precalculus 1.50 Calculus 2.50
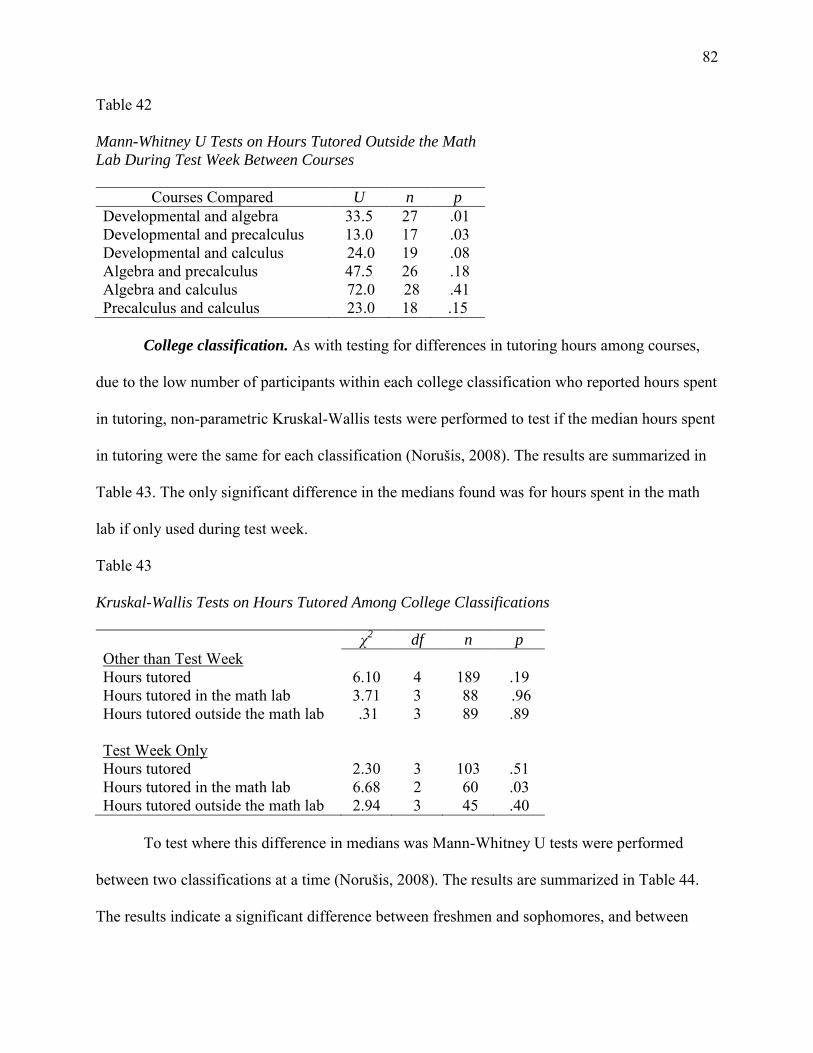
82
Table 42
Mann-Whitney U Tests on Hours Tutored Outside the Math
Lab During Test Week Between Courses
Courses Compared U n p
Developmental and algebra 33.5 27 .01 Developmental and precalculus 13.0 17 .03 Developmental and calculus 24.0 19 .08 Algebra and precalculus 47.5 26 .18 Algebra and calculus 72.0 28 .41 Precalculus and calculus 23.0 18 .15
College classification. As with testing for differences in tutoring hours among courses,
due to the low number of participants within each college classification who reported hours spent
in tutoring, non-parametric Kruskal-Wallis tests were performed to test if the median hours spent
in tutoring were the same for each classification (Norušis, 2008). The results are summarized in
Table 43. The only significant difference in the medians found was for hours spent in the math
lab if only used during test week.
Table 43
Kruskal-Wallis Tests on Hours Tutored Among College Classifications
χ2 df n p
Other than Test Week Hours tutored 6.10 4 189 .19 Hours tutored in the math lab 3.71 3 88 .96 Hours tutored outside the math lab .31 3 89 .89
Test Week Only Hours tutored 2.30 3 103 .51 Hours tutored in the math lab 6.68 2 60 .03 Hours tutored outside the math lab 2.94 3 45 .40
To test where this difference in medians was Mann-Whitney U tests were performed
between two classifications at a time (Norušis, 2008). The results are summarized in Table 44.
The results indicate a significant difference between freshmen and sophomores, and between
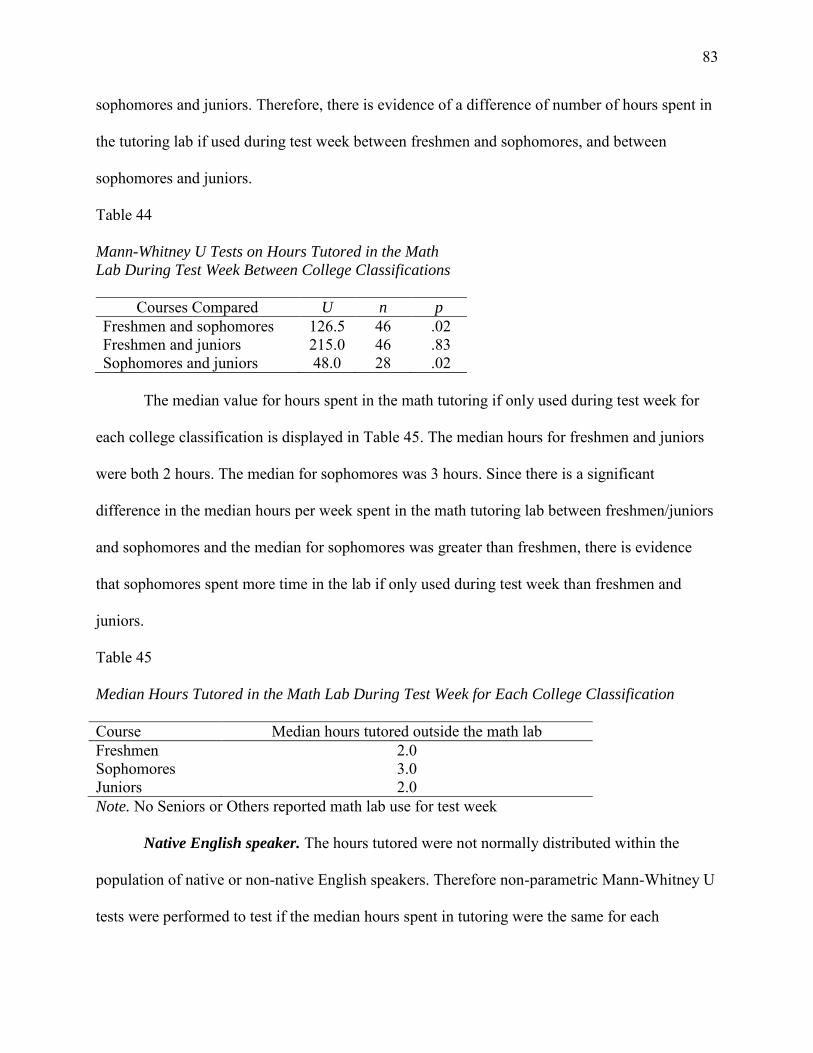
83
sophomores and juniors. Therefore, there is evidence of a difference of number of hours spent in
the tutoring lab if used during test week between freshmen and sophomores, and between
sophomores and juniors.
Table 44
Mann-Whitney U Tests on Hours Tutored in the Math
Lab During Test Week Between College Classifications
Courses Compared U n p
Freshmen and sophomores 126.5 46 .02 Freshmen and juniors 215.0 46 .83 Sophomores and juniors 48.0 28 .02
The median value for hours spent in the math tutoring if only used during test week for
each college classification is displayed in Table 45. The median hours for freshmen and juniors
were both 2 hours. The median for sophomores was 3 hours. Since there is a significant
difference in the median hours per week spent in the math tutoring lab between freshmen/juniors
and sophomores and the median for sophomores was greater than freshmen, there is evidence
that sophomores spent more time in the lab if only used during test week than freshmen and
juniors.
Table 45 Median Hours Tutored in the Math Lab During Test Week for Each College Classification
Course Median hours tutored outside the math lab Freshmen 2.0 Sophomores 3.0 Juniors 2.0 Note. No Seniors or Others reported math lab use for test week
Native English speaker. The hours tutored were not normally distributed within the
population of native or non-native English speakers. Therefore non-parametric Mann-Whitney U
tests were performed to test if the median hours spent in tutoring were the same for each
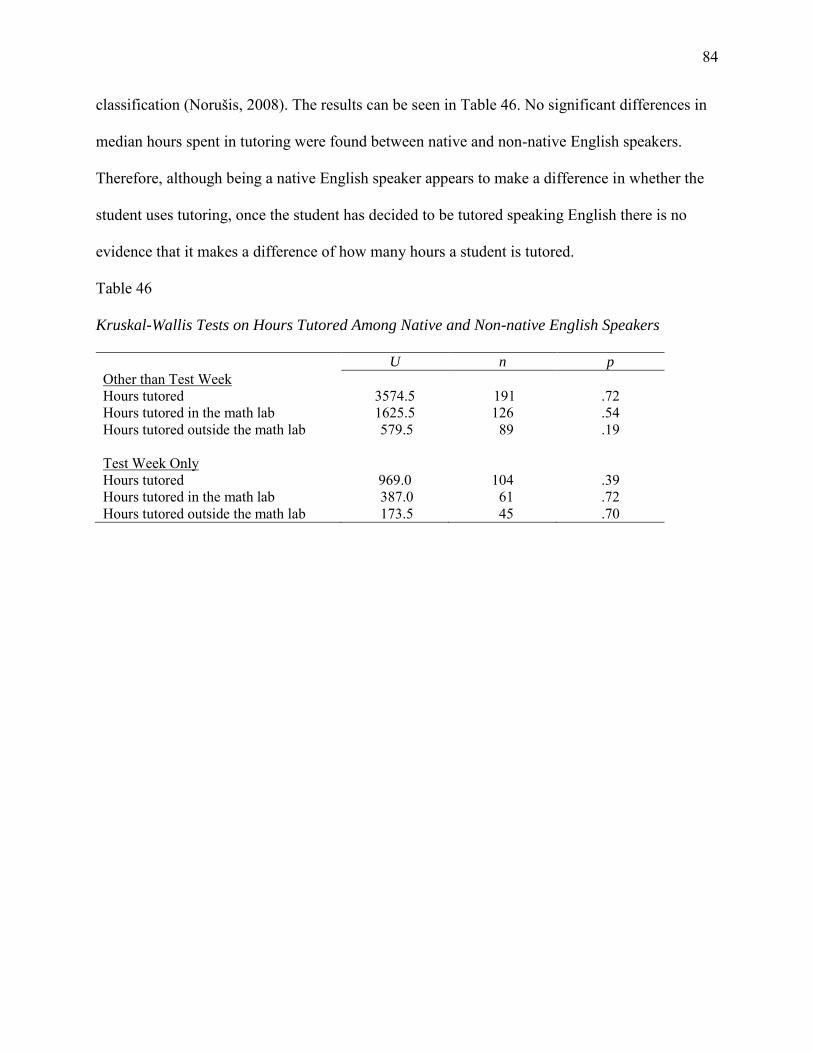
84
classification (Norušis, 2008). The results can be seen in Table 46. No significant differences in
median hours spent in tutoring were found between native and non-native English speakers.
Therefore, although being a native English speaker appears to make a difference in whether the
student uses tutoring, once the student has decided to be tutored speaking English there is no
evidence that it makes a difference of how many hours a student is tutored.
Table 46
Kruskal-Wallis Tests on Hours Tutored Among Native and Non-native English Speakers
U n p
Other than Test Week Hours tutored 3574.5 191 .72 Hours tutored in the math lab 1625.5 126 .54 Hours tutored outside the math lab 579.5 89 .19 Test Week Only
Hours tutored 969.0 104 .39 Hours tutored in the math lab 387.0 61 .72 Hours tutored outside the math lab 173.5 45 .70
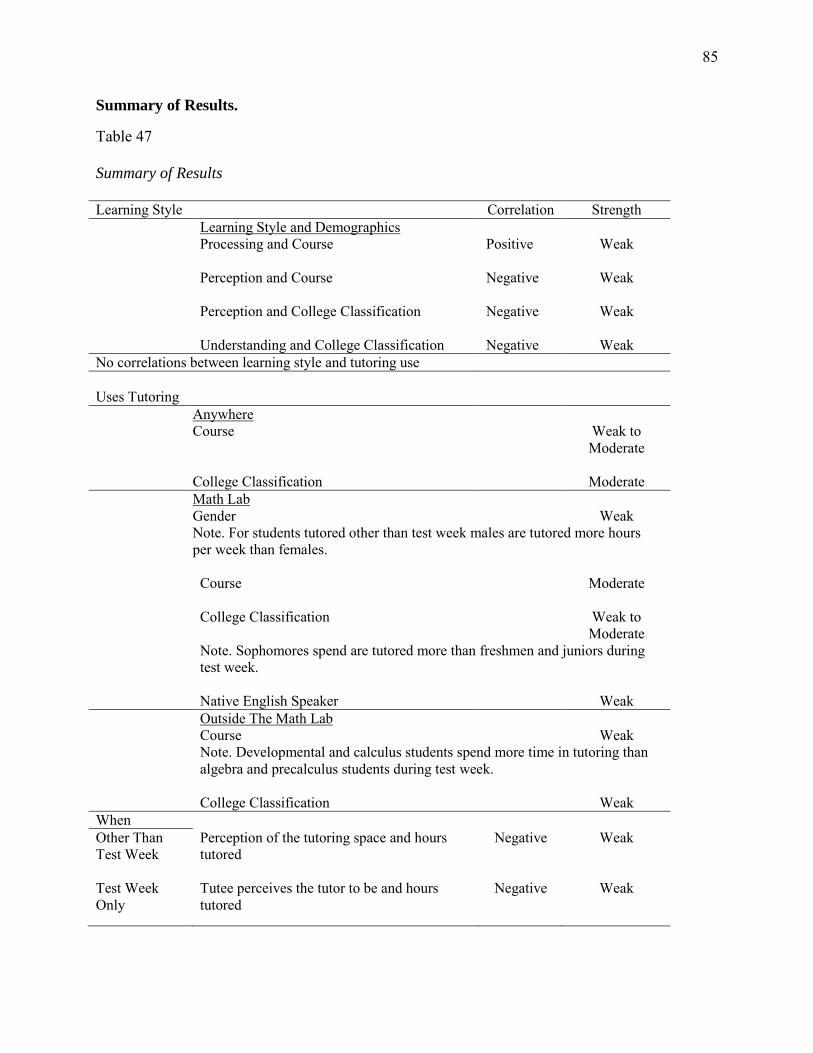
85
Summary of Results.
Table 47
Summary of Results
Learning Style Correlation Strength Learning Style and Demographics Processing and Course
Positive Weak
Perception and Course
Negative Weak
Perception and College Classification
Negative Weak
Understanding and College Classification Negative Weak No correlations between learning style and tutoring use Uses Tutoring
Anywhere Course Weak to
Moderate
College Classification Moderate Math Lab Gender Weak Note. For students tutored other than test week males are tutored more hours
per week than females.
Course Moderate College Classification Weak to
Moderate Note. Sophomores spend are tutored more than freshmen and juniors during
test week.
Native English Speaker Weak Outside The Math Lab Course Weak Note. Developmental and calculus students spend more time in tutoring than
algebra and precalculus students during test week.
College Classification Weak When Other Than Test Week
Perception of the tutoring space and hours tutored
Negative Weak
Test Week Only
Tutee perceives the tutor to be and hours tutored
Negative Weak
86
Chapter 5: Conclusions
This study provided information about undergraduate students enrolled in mathematics
courses who seek math tutoring. Few relationships were found, but the results still have
implications. This chapter will first present the findings of the study followed by a comparison of
the results to the previous literature. Next the limitations of the results will be discussed. Then
the implications of this study will be investigated and the chapter will finish with suggestions for
future research.
Discussion
The results from this study had four parts. The first was the relationship between learning
style and demographics, second between learning style and mathematics tutoring, third the
relationship between perceptions of the tutoring environment and tutoring, and fourth was the
relationship between demographic information and mathematics tutoring. The results from each
of these parts will be compared to the literature previously published on the subject.
Learning style and demographics. The results from this study were that students in
developmental and algebra courses tended to have a lower sensory perception preference, while
precalculus and calculus students tended to have a stronger sensory perception preference.
Freshmen and sophomores tended to be less sequential than juniors and seniors.
Learning style and tutoring. The results from this study indicate that the popularity of
tutoring is not strongly related to learning style. The results add support to the scholars who
claim that the benefits of accommodating learning style are questionable (Coffield et al., 2004;
Pashler et al., 2008). No significant relationships were found between any of the learning style
components and whether the student sought tutoring. The only learning style that had a
relationship with time spent in tutoring was processing for students who use the math lab other
than the week of a test. No one learning style strongly preferred to be tutored over another. This
87
supports Coffield et al.’s (2004) claim that the role that learning styles take is problematic.
Learning style may still play a part in a student’s desire for tutoring, but there is no definitive
correlation between learning style and use of tutoring services.
Perceptions of the learning environment and tutoring. This study did not find
evidence that any other perceptions of the tutor influence the use of tutoring. There was evidence
to support the notion that creating a comfortable learning space had any benefit to the tutoring
center as many scholars recommend (Bosch, 2006; Marland & Rogers, 1997; Rabow et al., 1999;
Simmons, 2002). In fact the correlation found that for students who were tutored other than test
week, the higher the student felt about the tutoring space, the less time the student spent in
tutoring.
The level of tutor distraction was related to the hours spent in the math lab for those
students who were only tutored during test week. This may support the literature’s notion that
students need to feel “valued as persons” (Bosch, 2006, p. 45) as these students may have felt
that their time was not valued when the tutor did not focus on tutoring. However no support was
found that any other perceptions of the tutor influenced on use of tutoring.
Demographics and tutoring. College learning assistance programs have been designed
to support students adjusting to the college level of work (Arendale, 2010). However, this study
found that freshmen sought math tutoring both in and out of the math lab at a lower rates than
sophomores, juniors and seniors. Also, developmental math students were tutored in and out of
the math lab at a lower percentage than any other course. Algebra had the next lowest percentage
of students who sought mathematics tutoring. Calculus, the highest level math course surveyed,
had the highest percentage of students who sought tutoring in the math lab. Although tutoring
88
centers may have been developed for unprepared math students, the students in the highest level
mathematics courses were the students using the tutoring resources that the universities offer.
Limitations of Results
The results of this study are subject to some limitations. First, the amount of time spent in
tutoring does not necessarily reflect the time the student spent actively being tutored. Rather,
how much time was spent waiting for the tutor to become available, and how much of the time
the student was able to work without the tutor are also factors.
Tutors’ previous knowledge of learning styles was not assessed. Neither were their
teaching styles assessed. These tutors may have already had a basic knowledge of learning style
and had the ability to adjust their teaching styles accordingly. Therefore, although no strong
relationships between learning style and whether the student seeks tutoring were found, it cannot
be concluded how helpful knowledge of learning styles is in tutoring.
In addition, this study found no positive correlation between perception of the tutoring
space or the tutor. This indicates that students who had a higher perception of the tutor or
tutoring space did not spend more hours in tutoring. However, only students who used tutoring
reported their perceptions of the tutoring environment. This did not take into account the students
who did not seek tutoring. For example, did a student never use the math lab because they did
not like the atmosphere, or did the student try it once but did not feel the tutor was helpful?
Knowing this would have given a fuller picture of the role perceptions of the tutoring
environment played in a student’s use of tutoring.
Implications
Although knowledge of learning style may make tutoring more effective, this study does
not provide evidence to recommend that mathematics tutoring centers would benefit by changing
89
the tutors’ teaching style to match the learning styles of the students. Furthermore, the
perceptions students have of the tutoring environment did not seem to influence how often they
use tutoring services. Therefore, there does not seem to be any evidence to support making
changes to tutoring space or training the tutors in a way to please the students will make any
difference in the patronage of the tutoring center. Instead the evidence from this study suggests
that the tutoring centers could benefit from reminding the tutors to keep focused on the students.
This could be done with a supervisor who ensures that the tutors are not distracted while they are
assisting students. On the other hand, it was only for the students who waited until test week to
get tutored that tutor distraction was linked to fewer hours spent in tutoring. It is possible that
these students perceive the tutor to be more distracted because they are rushing to cram before
the test. Therefore it may advantage educators to find ways to convince these students into
tutoring before the week of the exam.
No evidence was found to suggest that that tutoring centers will increase usage by
making the tutoring center look aesthetically pleasing. Students do not appear to spend less time
in tutoring based if their perception of the room is low. In spite of this, it should be noted that
making a pleasant tutoring space could have benefits for the employees and it could make a
subconscious difference to the tutees. However, the results from this study suggest that making
changes to the physical space may not need to be a major priority. Instead, the evidence from this
study suggests that the tutoring centers would benefit more from reminding the tutees to keep
focused on the material. On the other hand, it was only the students who waited until test week to
get tutored that tutee distraction was linked to hours spent in tutoring. It is possible that these
students are spending more time in tutoring because their distraction is keeping them from
focusing on studying. Furthermore, it is possible that these students are waiting until exam week
90
to receive tutoring because they are distracted away from studying until they must cram before
the test. Therefore, it may advantage tutoring centers to find ways to convince these students into
tutoring before the week of the exam.
Learning assistance is geared to help students adjust to college level material; this would
imply mostly freshmen or sophomores. However, this study found that these students used math
tutoring less than juniors or seniors. It would also seem that developmental students would need
the most assistance since they are by definition not ready for college level work. Logically
algebra students would also need assistance because algebra students come from non-college
level courses and thus would be the population needing help adjusting to college level work.
However, this study found that developmental and algebra students used tutoring less than
precalculus and calculus students. Postsecondary institutions may need to assess how they are
advertising university sponsored tutoring. College instructors may need to consider how strongly
they recommend tutoring to these students. The institutions of higher education might want to
consider requiring tutoring for freshmen and/or developmental math in order to ensure that they
are using these resources.
Although the percentage of native English speakers who used the math lab was very close
to the percentage of non-native English speakers (in fact, the percentage of non-native English
speakers who used the math lab was only slightly higher than that of native English speakers),
most of the students who used the math lab were native English speakers. The weak correlation
between whether the student is a native English speaker and whether the student uses the math
lab is important. Once the students chose to use the math lab there was no difference in the
amount of time spent in tutoring. This implies that if the postsecondary institutions can convince
the non-native English speakers to use the math tutoring services then the students will continue
91
to use them. This is especially significant since the United States Census Bureau (2014) found
that 16.3% of Texas families, and over a third of American families do not speak English at
home.
Recommendations for Future Research
Future research is needed in further investigating the interactions between learning style,
perceptions, and tutoring. A starting place for future research would be to address the limitations
of this study. First, it would be beneficial to explore why the students who never sought tutoring
did not use the service. Did the students feel they did not need math tutoring, did they not like
the atmosphere, did they not like the tutors, were the hours not convenient for them, and so on?
Investigating this could lead to a better understanding of whether the student perceptions were
involved in the decision to receive tutoring. This could also help the math labs understand why a
lower percentage of developmental and algebra students sought tutoring than precalculus and
calculus students.
It would also be beneficial to explore why the students who sought tutoring did so. Were
these students recommended to get tutoring from the teacher, did they feel they needed it, were
they more confident if they had a tutor, was it just a way to force themselves to get their
homework done? An in-depth investigation of this could better help educators understand the
role tutoring plays in these students’ education. Knowing the reasons students do or do not seek
tutoring can help postsecondary institutions decide on the best way to spend their resources. If it
is found that students do not seek tutoring because they do not believe they need it then the
institutions may want to find a way to convince these students to use this resource.
Math labs may also want to consider investigating the students who are and are not using
their services. Why are male who use the math lab other than test week spend more time in
92
tutoring than females? This could mean that females do not have as many questions, or it could
mean that females are being rushed out of the lab. Why do developmental students spend more
time in tutoring outside the math lab than algebra and precalculus during test week? Is there a
reason why these students are not spending more time in the math lab during test week?
Investigating whether there is a social stigma to seeking tutoring which makes females or
younger students less likely to seek tutoring. Could these students feel that use of tutoring shows
academic weakness?
Another opportunity for future research would be to assess the teaching style of the tutors
in accordance with the teaching style model Felder and Silverman proposed to parallel their
learning style model (Felder & Silverman, 1988). This way it could be determined whether the
learning style components which had no relationship with hours spent in tutoring were because
all the different learning styles were accommodated. Related to this, it would be beneficial to
examine if the tutors have knowledge of learning styles. Graf et al. (2009) claimed that when
teachers know the students’ learning styles, it helps the teacher explain the material more
effectively. Asking the tutors about their knowledge of learning styles and assessing how they
use this knowledge in their tutoring could help explain the lack of relationship between learning
style and tutoring.
Finally, it may be beneficial to look how grades relate to tutoring. Correlations between
grades and use or frequency of tutoring may indicate whether tutoring helps academic
performance. As Chapter 2, it is faulty to attribute high grades to tutoring (Baker et al., 2006).
However, finding a correlation between tutoring and grades may convince some students who
would not otherwise receive tutoring to do so. Looking for a correlation between grades and
93
perceptions of the tutoring environment may also be beneficial. Could the way students feel
about their tutor or the tutoring space influence their mathematics performance?
Baker et al. (2006) also point out that there are too many variables at work to credit
tutoring for academic improvement. For example, while students are receiving tutoring, they are
also learning material in the classroom. In addition, most students “have access to and are
strongly encouraged to utilize alternate academic support services like instructor office hours,
academic counseling, and learning support workshops” (Xu et al., 2001, para. 7). Therefore, it is
impossible to credit any academic improvement to tutoring alone.
Tutoring has a long tradition in education. Although the effect tutoring has on academic
performance is unknown it continues to be a large part of postsecondary institutions’ learning
assistance programs (Rheinheimer et al., 2010). This study has found that the reasons why
students continue to seek out mathematics tutoring in spite of the debatable effects may not be
due to a learning preference that tutoring accommodates. However, more research should be
done to understand the role tutoring plays in adults learning of mathematics.
94
References
ACT. (2012). The condition of college & career readiness 2012. ACT. Retrieved from http://media.act.org/documents/CCCR12-NationalReadinessRpt.pdf?_ga=1.8319666.1218311825.1427928899
Agresti, A. & Finlay, B. (2009). Statistical methods for the social sciences (4th ed.). Upper
Saddle River, NJ: Pearson Prentice Hall. Al-Balhan, E. M. (2007). Learning styles in relation to academic performance in middle school
mathematics. Digest of Middle East Studies, 16(1), 42-57. Arendale, D. R. (2010). Special Issue: Access at the Crossroads--Learning Assistance in Higher
Education. ASHE Higher Education Report, 35(6), 1-145. Aud, S., Hussar, W., Kena, G., Bianco, K., Frohlich, L., Kemp, J., . . . Mallory, K. (2011). The
condition of education 2011. Washington, DC: U.S. Department of Education Institute of Education Sciences National Center for Education Statistics. Retrieved from http://nces.ed.gov/pubs2011/2011033.pdf
Baker, J., Rieg, S., & Clendaniel, T. (2006). An investigation of an after school math tutoring
program: University tutors + elementary students = a successful partnership. Education, 127(2), 287-293.
Beer, C. T. & Darkenwald, G. G. (1989). Gender differences in adult student perceptions of
college classroom social environments. Adult Education Quarterly, 40(1), 33-42. doi: 10.1177/074171368904000104
Bosch, K. (2006). Planning classroom management: A five-step process to creating a positive
learning environment (2nd ed.). Thousand Oaks, CA: Corwin Press. Boylan, H. R., & White, W. G. (1994). Educating all the nation’s people: The historical roots of
developmental education. In M. Maxwell (Ed.), From access to success: A book of readings
on college developmental education and learning assistance programs (pp. 3-7). Clearwater, FL: H&H.
Briggs, A. R. J. (2000). Promoting learning style analysis among vocational students. Education
& Training, 42(1), 16-24. doi: 10.1108/00400910010371482 Brubacher, J. S., & Rudy, W. (1968). Higher education in transition: A history of American
colleges and universities, 1663-1968. New York, NY: Harper & Row. Calhoon, B. M., & Fuchs, L. S. (2003). The effects of peer-assisted learning strategies and
curriculum-based measurement on the mathematics performance of secondary students with disabilities. Remedial and Special Education. 24(4), 235-245.
95
Cassidy, G. & Macdonald, R. A. R. (2007). The effect of background music and background noise on the task performance of introverts and extraverts. Psychology of Music, 35(3), 517-537. doi: 10.1177⁄0305735607076444
Coffield, F., Mosely, D., Hall, E., & Ecclestone, K. (2004). Learning styles and pedagogy in
post-16 learning: A systematic and critical review. Learning and Skills Research Centre, London, United Kingdom. Retrieved from http://sxills.nl/lerenlerennu/bronnen/Learning%20styles%20by%20Coffield%20e.a..pdf
Cohen, J. (1988). Statistical power analysis for the behavioral sciences (2nd ed.). Hillsdale, NJ,
England: Lawrence Erlbaum. Creswell, J. W. (2008). Educational research: Planning, conducting, and evaluating quantitative
and qualitative research (3rd ed.). Upper Saddle River, NJ: Pearson Education. Dale, E. (1972). Building a learning environment. Bloomington, IN: Phi Delta Kappa. Deke, J., Dragoset, L., Bogen, K., & Gill, B. (2012). Impacts of Title I supplemental educational
services on student achievement. Retrieved from http://ies.ed.gov/ncee/pubs/20124053/pdf/20124053.pdf
Dunn, R., Beaudry, J. S. & Klavas, A. (1989). Survey of research on learning styles. Educational
Leadership, 46(6), 50. Dunn, R., & Griggs, S. A. (1995). A meta-analytic validation of the Dunn and Dunn model of
learning-style preferences. Journal of Educational Research, 88(6), 353-562. doi: 10.1080/00220671.1995.9941181
Dunn, R., Sklar, R. I., Beaudry, J. S., & Bruno, J. (1990). Effects of matching and mismatching
minority developmental college students' hemispheric preferences on mathematics scores. Journal of Educational Research, 83(5), 283-88.
Dvorak, J. (2001). The college tutoring experience: A qualitative study. Learning Assistance
Review, 6(2), 33-46. Edelman, B. A. (1991). Political, social, and cultural reproduction via civil service examinations
in late imperial China. Journal of Asian Studies, 50(1), 7. Retrieved 12/18/2014 from http://search.proquest.com/docview/37115523?accountid=7139
Emmer, E. T. & Evertson, C. M. (2009). Classroom management for middle and high school
teachers. Upper Saddle River, NJ: Pearson Education. Felder, R. M. (2002). Author’s preface: Addendum to learning and teaching styles in
engineering education. Engineering Education, 78(7), 674-681.
96
Felder, R. M., & Silverman, L. K. (1988). Learning and teaching styles in engineering education. Engineering Education, 78(7), 674-681.
Felder, R. M., & Soloman, B. A. (1991). Index of learning styles. Retrieved from
http://www.ncsu.edu/felder-public/ILSpage.html Felder, R. M., & Spurlin, L. K. (2005). Applications, reliability and validity of the index of
learning styles. International Journal of Engineering Education, 21(1), 103-112. Filippidis, S. K., & Tsoukalas, L. A. (2009). On the use of adaptive3 instructional images based
on the sequential-global dimension of the Felder-Silverman learning style theory. Interactive
Learning Environments, 17(2), 135-150. Friedman, H. H., & Amoo, T. (1999). Rating the rating scales. Journal of Marketing
Management, 9(3), 114-123. Gall, M. D., Gall, J. P., Jacobsen, D. R., & Bullock, T. L. (1990). Tools for learning. Alexandria,
VI: Association for Supervision and Curriculum Development. Gardner, H. (1999). Intelligence reframed: Multiple intelligences for the 21st century. New
York, NY: Basic Books. George, D., & Mallery, P. (2003). SPSS for Windows step by step: A simple guide and reference.
11.0 update (4th ed.). Boston, MA: Allyn & Bacon. Gordon, E. E. & Gordon, E. H. (1990). Centuries of tutoring: A history of alternative education
in America and Western Europe. Lanham, MD: University Press of America. Grady, P. & Carter, A. (2001) Instructional support across the curriculum: The multi-academic
learning lab. International Journal of Instructional Media [serial online]. 28(4):431. Graf, S., Kinshuck, & Liu, T.-C. (2009). Supporting teachers in identifying students’ learning
styles in learning management systems: An automatic student modeling approach. Educational Technology & Society. 12(4), 3-14.
Graf, S., Viola, S., Leo, T., & Kinshuk. (2007). In-depth analysis of the Felder-Silverman
learning style dimensions. Journal of Research on Technology in Education, 40(1), 79-93. Greenwood, C. R., & Terry, O. (1993). Achievement, placement, and services: Middle school
benefits of classwide peer tutoring used at the elementary school. School Psychology Review, 22(3), 497-516.
Guilford, J. P. (1954). Psychometric methods. New York, NY: McGraw-Hill.
97
Hendriksen, S., Yang, L., Love, B., & Hall, M. C. (2005). Assessing academic support: The effects of tutoring on student learning outcomes. Journal of College Reading and Learning,
35(2), 56-65. Jung, C. G. (1971). Psychological types. (H. G. Baynes, Trans.). Princeton, N.J.: Princeton
University Press. Kenny, D. T., & Faunce, G. (2004). Effects of academic coaching on elementary and secondary
school students. Journal of Educational Research, 98(2), 115-126. doi: 10.3200/JOER.98.2.115
Kolb, D. A. (1984). Experiential learning: Experience as the source of learning and
development. Upper Saddle River, NJ: Prentice Hall. Kuh, Kinzie, Schuh, Whitt, and Associates. (2005). Student success in college: Creating
conditions that matter. San Francisco, CA: Jossey-Bass. Lee, J. (2007). Two worlds of private tutoring: The prevalence and causes of after-school
mathematics tutoring in Korea and the United States. Teachers College Record, 105(5), 1207-1234.
Lee, T. H.C. (1999). Education in traditional China: A History. Leiden, The Netherlands: Brill. Lenehan, M., Dunn, R., Ingham, J., Signer, B., & Murray, J. B. (1994). Effects of learning-style
intervention on college students' achievement, anxiety, anger and curiosity. Journal of
College Student Development, 35(6), 461-66. Lenier, M. & Maker, J. (1980). Keys to college success: Reading and study improvement.
Englewood Cliffs, NJ: Prentice Hall. Marin-Suarez, T., & Alarcon, H. (2010). Influence of learning styles on conceptual learning of
physics. AIP Conference Proceedings, 1289(1), 217-220. doi:10.1063/1.3515204 Marland, M & Rogers, R. (1997). The art of the tutor: Developing your role in the secondary
school. London, United Kingdom: David Fulton Publishers. Maxwell, M. (1994). Does tutoring help? A look at the literature. In M. Maxwell (Eds), From
access to success: A book of readings on college developmental education and learning
assistance programs (pp. 109-117). Clearwater, FL: H&H. McDuffie, K. A., Mastorpieri, M. A., & Scruggs, T. E. (2009) Differential effects of peer
tutoring in co-taught and non-co-taught classes: Results for content learning and student-teacher interactions. Exceptional Children, 75(4), 493-510.
98
Menesses, K. F., & Gresham, F. M. (2009). Relative efficacy of reciprocal and nonreciprocalpeer tutoring for students at-risk for academic failure. School Psychology Quarterly, 24(4),266-275.
Norušis, M. J. (2008). SPSS statistics 17.0 guide to data analysis. Upper Saddle River, NJ:Prentice Hall.
Pashler, H., McDaniel, M., Rohrer, D., & Bjork, R. (2008). Learning styles: Concepts andevidence. Psychological Science in the Public Interest (Wiley-Blackwell), 9(3), 105-119. doi:10.1111/j.1539-6053.2009.01038.x
Popescu, E. E. (2010). Adaptation provisioning with respect to learning styles in a Web-basededucational system: an experimental study. Journal of Computer Assisted Learning, 26(4),243-257. doi:10.1111/j.1365-2729.2010.00364.x
Powers, D. E., & Rock, D. A. (1999). Effects of Coaching on SAT I: Reasoning test scores.Journal of Educational Measurement, 36(2), 93-118. 10.1111/j.1745-3984.1999.tb00549.x
Rabow, J, Chin, T, & Fahimian, N. (1999). Tutoring matters: Everything you always wanted toknow about how to tutor. Philadelphia, PA: Temple University Press.
Reese, V. L., & Dunn, R. (2008). Learning-style preferences of a diverse freshmen population ina large, private, metropolitan university by gender and GPA. Journal of College Student Retention: Research, Theory & Practice, 9(1), 95-112. Retrieved from http://search.proquest.com/docview/62058918?accountid=7139
Rheinheimer, D. C., Grace-Odeleye, B., Francois, G. E., & Kusorgbor, C. (2010). Tutoring: Asupport strategy for at-risk students. Learning Assistance Review, 15(1), 23-34.
Sarasin, L. C. (1999). Learning style perspectives: Impact in the classroom. Madison, WI:Atwood Publishing.
Schwerdt, G., Wuppermann, A. C. (2011). Sage on the stage: Is lecturing really all that bad?Education Next 11(3), 62-67.
Sheskin, D. J. (2007). Handbook of parametric and nonparametric statistical procedures (4thed.). Boca Raton, FL: Chapman & Hall/CRC.
Simmons, B. (2002). Navigating the first year of teaching. Kappa Delta Pi Record, 38(4), 160-164.
Spence, J. D. (1996). God’s Chinese son. New York, NY: W.W. Norton & Company.
Thompson, W. F., Schellenberg, E. G., Letnic, K. A. (2012). Fast and loud background musicdisrupts reading comprehension. Psychology of Music, 40(6), 700-708. doi: 10.1177/0305735611400173
99
Topping, K., & Watson, G. (1996). Same-year peer tutoring with first year undergraduates.
Teaching in Higher Education. 1(3), 341-356. doi: 10.1080/1356251960010305 Travers, R. W. (1951). A critical review of the validity and rationale of the forced-choice
technique. Psychological Bulletin, 48(1), 62-70. doi:10.1037/h0055263 United States Census Bureau. (2014). State & County QuickFacts. Retrieved from
http://quickfacts.census.gov/qfd/states/48000.html Verduin, J. R., Miller, H. G., & Greer, C. E. (1977). Adults teaching adults: Principles and
strategies. Austin, TX: Learning Concepts. Walker, E. N. (2007). The structure and culture of developing a mathematics tutoring
collaborative in an urban high school. High School Journal, 91(1) 57-67. Wong, W. K., Chan, T. W., Chou, C. Y., Heh, J. S., Tung, S. H. (2003). Reciprocal tutoring
using cognitive tools. Journal of Computer Assisted Learning, 19(4) 416-428. Xu, Y., Harman, S., Uribe, G., & Mencke, R., (2001). The effects of peer tutoring on
undergraduate students’ final examination scores in mathematics. Journal of College
Reading and Learning 32(1), 22-31. Zywno, M. S. (2003). A contribution to validation of score meaning for Felder-Soloman’s Index
of Learning Styles. Proceedings of the 2003 American Society for Engineering Education,
Session 2351, Nashville TN, June 23-25, 2003.

Appendices
101
Appendix A
STATEMENT OF PERMISSION TO USE THE INDEX OF LEARNING STYLES
DIMENSIONS FIGURE
From: Richard Felder [[email protected]] Sent: Thursday, June 27, 2013 11:25 AM To: Shirley, Matthew E. Subject: Re: ILS visual aid Dear Mr. Shirley, You are welcome to reproduce the report form in your dissertation. Sincerely, Richard M. Felder Hoechst Celanese Professor Emeritus of Chemical Engineering N.C. State University http://www.ncsu.edu/effective_teaching
102
Appendix B
INDEX OF LEARNING STYLES
Copyright © 1991, 1994 by North Carolina State University (Authored by Richard M. Felder and Barbara A. Soloman). For information about appropriate and inappropriate uses of the Index of Learning Styles and a study of its reliability and validity, see <http://www.ncsu.edu/felder-public/ILSpage.html>.
Enter your answers to every question on the ILS scoring sheet. Please choose only one answer for each question. If both “a” and “b” seem to apply to you, choose the one that applies more frequently.
1. I understand something better after I
a) try it out.
b) think it through.
2. I would rather be considered
a) realistic.
b) innovative.
3. When I think about what I did yesterday, I am most likely to get
a) a picture.
b) words.
4. I tend to
a) understand details of a subject but may be fuzzy about its overall structure.
b) understand the overall structure but may be fuzzy about details.
5. When I am learning something new, it helps me to
a) talk about it.
b) think about it.
6. If I were a teacher, I would rather teach a course
a) that deals with facts and real life situations.
b) that deals with ideas and theories.
7. I prefer to get new information in
a) pictures, diagrams, graphs, or maps.
b) written directions or verbal information.
103
8. Once I understand
a) all the parts, I understand the whole thing.
b) the whole thing, I see how the parts fit.
9. In a study group working on difficult material, I am more likely to
a) jump in and contribute ideas.
b) sit back and listen.
10. I find it easier
a) to learn facts.
b) to learn concepts.
11. In a book with lots of pictures and charts, I am likely to
a) look over the pictures and charts carefully.
b) focus on the written text.
12. When I solve math problems
a) I usually work my way to the solutions one step at a time.
b) I often just see the solutions but then have to struggle to figure out the steps to get to them.
13. In classes I have taken
a) I have usually gotten to know many of the students.
b) I have rarely gotten to know many of the students.
14. In reading nonfiction, I prefer
a) something that teaches me new facts or tells me how to do something.
b) something that gives me new ideas to think about.
15. I like teachers
a) who put a lot of diagrams on the board.
b) who spend a lot of time explaining.
104
16. When I’m analyzing a story or a novel
a) I think of the incidents and try to put them together to figure out the themes.
b) I just know what the themes are when I finish reading and then I have to go back and find the
incidents that demonstrate them.
17. When I start a homework problem, I am more likely to
a) start working on the solution immediately.
b) try to fully understand the problem first.
18. I prefer the idea of
a) certainty.
b) theory.
19. I remember best
a) what I see.
b) what I hear.
20. It is more important to me that an instructor
a) lay out the material in clear sequential steps.
b) give me an overall picture and relate the material to other subjects.
21. I prefer to study
a) in a study group.
b) alone.
22. I am more likely to be considered
a) careful about the details of my work.
b) creative about how to do my work.
23. When I get directions to a new place, I prefer
a) a map.
b) written instructions.
105
24. I learn
a) at a fairly regular pace. If I study hard, I’ll “get it.”
b) in fits and starts. I’ll be totally confused and then suddenly it all “clicks.”
25. I would rather first
a) try things out.
b) think about how I’m going to do it.
26. When I am reading for enjoyment, I like writers to
a) clearly say what they mean.
b) say things in creative, interesting ways.
27. When I see a diagram or sketch in class, I am most likely to remember
a) the picture.
b) what the instructor said about it.
28. When considering a body of information, I am more likely to
a) focus on details and miss the big picture.
b) try to understand the big picture before getting into the details.
29. I more easily remember
a) something I have done.
b) something I have thought a lot about.
30. When I have to perform a task, I prefer to
a) master one way of doing it.
b) come up with new ways of doing it.
31. When someone is showing me data, I prefer
a) charts or graphs.
b) text summarizing the results.
32. When writing a paper, I am more likely to
a) work on (think about or write) the beginning of the paper and progress forward.
b) work on (think about or write) different parts of the paper and then order them.
106
33. When I have to work on a group project, I first want to
a) have “group brainstorming” where everyone contributes ideas.
b) brainstorm individually and then come together as a group to compare ideas.
34. I consider it higher praise to call someone
a) sensible.
b) imaginative.
35. When I meet people at a party, I am more likely to remember
a) what they looked like.
b) what they said about themselves.
36. When I am learning a new subject, I prefer to
a) stay focused on that subject, learning as much about it as I can.
b) try to make connections between that subject and related subjects.
37. I am more likely to be considered
a) outgoing.
b) reserved.
38. I prefer courses that emphasize
a) concrete material (facts, data).
b) abstract material (concepts, theories).
39. For entertainment, I would rather
a) watch television.
b) read a book.
40. Some teachers start their lectures with an outline of what they will cover. Such outlines are
a) somewhat helpful to me.
b) very helpful to me.
41. The idea of doing homework in groups, with one grade for the entire group,
a) appeals to me.
b) does not appeal to me.
107
42. When I am doing long calculations,
a) I tend to repeat all my steps and check my work carefully.
b) I find checking my work tiresome and have to force myself to do it.
43. I tend to picture places I have been
a) easily and fairly accurately.
b) with difficulty and without much detail.
44. When solving problems in a group, I would be more likely to
a) think of the steps in the solution process.
b) think of possible consequences or applications of the solution in a wide range of areas.
PERMISSION TO USE THE INDEX OF LEARNING STYLES The following was retrieved from Felder and Soloman’s Index of Learning Styles website at http://www4.ncsu.edu/unity/lockers/users/f/felder/public/ILS-faq.htm#research on February 8, 2013:
The ILS is available at no cost to students and faculty at educational institutions to use for non-commercial purposes, and also to individuals who wish to determine their own learning styles. The commercial rights are held by North Carolina State University. While we have chosen to provide open access to the web-based instrument and so have voluntarily relinquished control over its use, we rely on the integrity of private sector users to help cover the expense of developing and maintaining it.
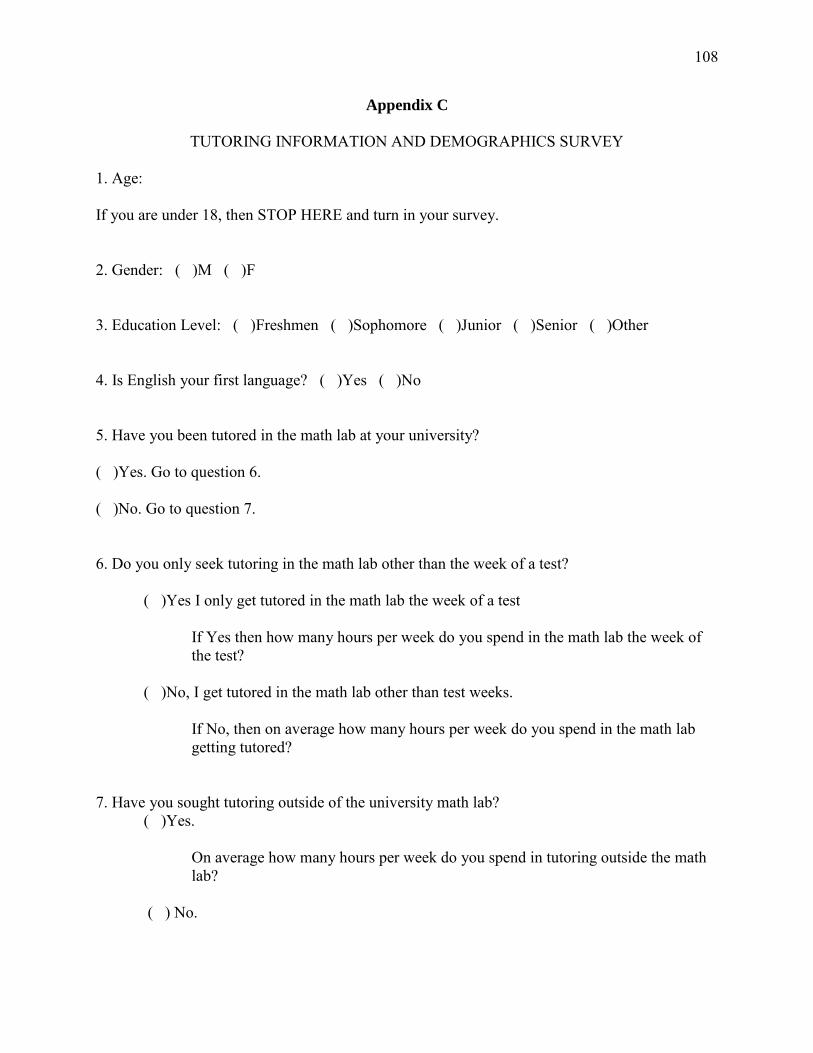
108
Appendix C
TUTORING INFORMATION AND DEMOGRAPHICS SURVEY
1. Age: If you are under 18, then STOP HERE and turn in your survey. 2. Gender: ( )M ( )F 3. Education Level: ( )Freshmen ( )Sophomore ( )Junior ( )Senior ( )Other 4. Is English your first language? ( )Yes ( )No 5. Have you been tutored in the math lab at your university? ( )Yes. Go to question 6. ( )No. Go to question 7. 6. Do you only seek tutoring in the math lab other than the week of a test?
( )Yes I only get tutored in the math lab the week of a test
If Yes then how many hours per week do you spend in the math lab the week of the test?
( )No, I get tutored in the math lab other than test weeks. If No, then on average how many hours per week do you spend in the math lab getting tutored?
7. Have you sought tutoring outside of the university math lab?
( )Yes. On average how many hours per week do you spend in tutoring outside the math lab?
( ) No.
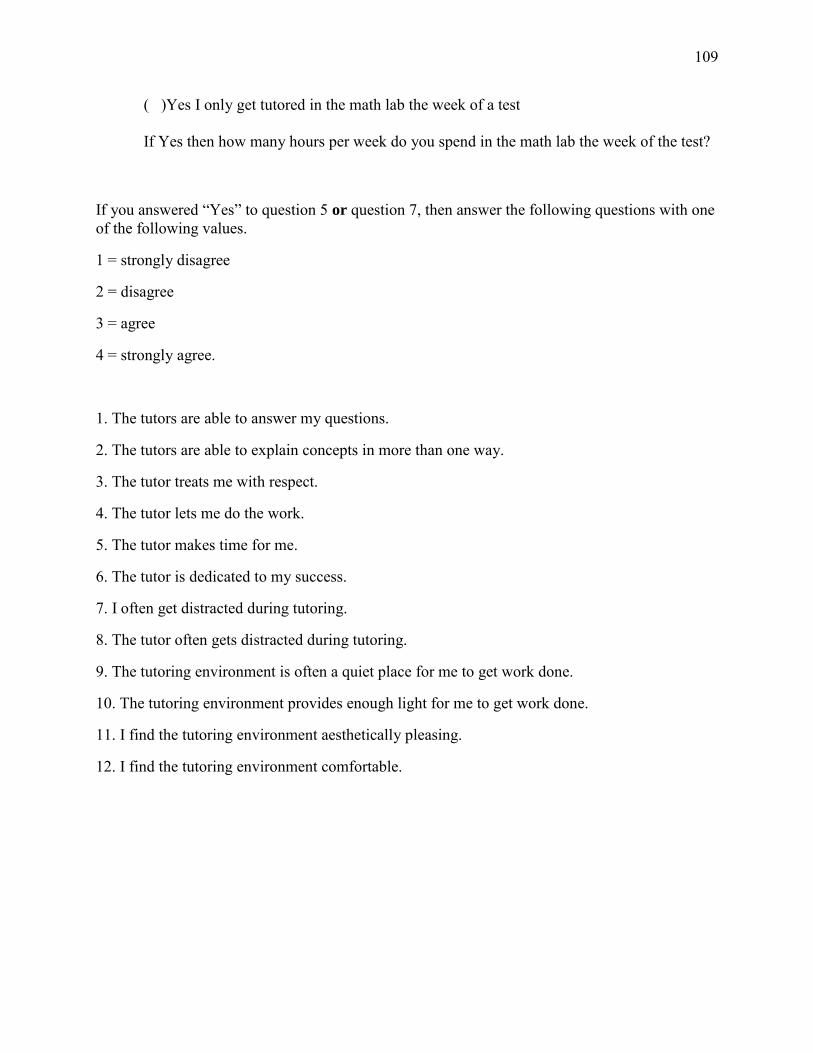
109
( )Yes I only get tutored in the math lab the week of a test
If Yes then how many hours per week do you spend in the math lab the week of the test?
If you answered “Yes” to question 5 or question 7, then answer the following questions with one of the following values.
1 = strongly disagree
2 = disagree
3 = agree
4 = strongly agree.
1. The tutors are able to answer my questions.
2. The tutors are able to explain concepts in more than one way.
3. The tutor treats me with respect.
4. The tutor lets me do the work.
5. The tutor makes time for me.
6. The tutor is dedicated to my success.
7. I often get distracted during tutoring.
8. The tutor often gets distracted during tutoring.
9. The tutoring environment is often a quiet place for me to get work done.
10. The tutoring environment provides enough light for me to get work done.
11. I find the tutoring environment aesthetically pleasing.
12. I find the tutoring environment comfortable.
110
Appendix D
SUBJECT CONSENT TO TAKE PART IN A STUDY OF LEARNING PREFERENCES OF UNDERGRADUATE MATH TUTEES
University of the Incarnate Word
I am Matthew Shirley a graduate student at University of the Incarnate Word working towards a doctorate degree in education with a concentration in mathematics education. You are being asked to take part in a research study of learning styles, perceptions of the tutoring environment and time spent outside of class tutoring. I want to learn whether there is a correlation between learning styles and hours spent in the university’s mathematics tutoring center. You are being asked to take part in this study because you are currently enrolled in a college math course and have had access to the mathematics-tutoring center this term. If you decide to take part, we will administer a 44-question questionnaire to determine your learning styles, and a survey to determine the amount of time you spend in math tutoring, and how you feel about your tutoring experiences. The surveys will be administered only once and will take around 30 minutes to complete. There are no discomforts or risks involved in this study. Your only inconvenience will be the time it takes to complete the survey. If you participate in this study you will have the benefit of knowing your learning styles. This study will provide knowledge that may help math tutors become more efficient in their profession. Everything learned about you in the study will be confidential. If the results of the study are published, you will not be identified in any way. Your decision to take part in the study is voluntary. You are free to choose not to take part in the study or to stop taking part at any time. If you choose not to take part or to stop at any time, it will not affect your current and future status at University of the Incarnate Word or St. Edward’s University. If you have questions now, feel free to ask us. If you have additional questions later or you wish to report a problem that may be related to this study, contact Matthew Shirley (210)-832-5601, [email protected] . The University of the Incarnate Word committee that reviews research on human subjects, the Institutional Review Board, will answer any questions about your rights as a research subject (829-2759—Dean of Graduate Studies and Research). You will be given a copy of this form to keep. Your signature indicates that you (1) consent to take part in this research study, (2) that you have read and understand the information given above, and (3) that the information above was explained to you. _____________________________________ Signature of Subject
__________________/___________________ Date (Time)