Embed Size (px)
Citation preview

knowledge management for the information age
Learning to Succeed: understanding and addressing Key Stage 4 (GCSE)
underachievement in Yorkshire and Humber
20 August 2007

1
Learning to Succeed: understanding and addressing Key Stage 4 (GCSE) underachievement in Yorkshire and Humber
knowledge management for the information age
Contents Contents................................................................................................................................................................................................. 1 Executive Summary.............................................................................................................................................................................. 3
Context and Research Brief ......................................................................................................................................................... 3 A Note on Assessment and Statistics ........................................................................................................................................ 3 Analysis and Findings ...................................................................................................................................................................... 4 Recommendations........................................................................................................................................................................... 5
1 Background, the Issues and the Approach ........................................................................................................................... 7 Project Aims ..................................................................................................................................................................................... 7 Project Objectives........................................................................................................................................................................... 7 The Brief............................................................................................................................................................................................ 8 Performance Data for Schools (adapted from Ray 2006) ..................................................................................................... 9 Value Added ...................................................................................................................................................................................12
2 Measuring Attainment .............................................................................................................................................................13 Summary..........................................................................................................................................................................................13 How important is Attainment? ..................................................................................................................................................14 The Reliability of Data and Statistical Methods......................................................................................................................15
3 Factors Affecting Attainment – Overview and CVA Variables....................................................................................19 4 School Level Factors affecting Attainment .........................................................................................................................24
Summary..........................................................................................................................................................................................24 Pedagogy and Teaching Quality .................................................................................................................................................25 The National Curriculum ............................................................................................................................................................26 Alternative Curricula....................................................................................................................................................................28 School Leadership .........................................................................................................................................................................29 Target Setting and Motivation....................................................................................................................................................30 Class and School Size ...................................................................................................................................................................31 School Resources ..........................................................................................................................................................................32 The Ethos ........................................................................................................................................................................................33 Labelling and Motivation ..............................................................................................................................................................34 Improvement Factors ...................................................................................................................................................................35 Raising Attainment in Under-Performing Areas ....................................................................................................................38 The Effects of Selection ...............................................................................................................................................................39
5 Societal Factors affecting Attainment ..................................................................................................................................41 Summary..........................................................................................................................................................................................41 Age within School Year ...............................................................................................................................................................41 Movement between Schools ......................................................................................................................................................41 Gender.............................................................................................................................................................................................42 Ethnicity ...........................................................................................................................................................................................42 Parents’ Education.........................................................................................................................................................................43 Deprivation .....................................................................................................................................................................................44 Income .............................................................................................................................................................................................45 Social Class .....................................................................................................................................................................................46 Social Segregation..........................................................................................................................................................................47 The Labour Market.......................................................................................................................................................................47 The Effects of Multiple Variables ...............................................................................................................................................51
6 Under Attainment in Yorkshire and Humber: a detailed analysis ................................................................................56 Summary..........................................................................................................................................................................................56 The Reliability of Key Stage 2 SATs Scores ............................................................................................................................57 Does Yorkshire and Humber have an Attainment Problem? .............................................................................................58

2
Learning to Succeed: understanding and addressing Key Stage 4 (GCSE) underachievement in Yorkshire and Humber
knowledge management for the information age
The Use of Alternative Curricula..............................................................................................................................................60 Social Segregation within Yorkshire and Humber’s Schools ..............................................................................................65 A Final Observation......................................................................................................................................................................77
7 Conclusions and Recommendations....................................................................................................................................79 Attainment Measures, Targets and Indicators........................................................................................................................79 Societal versus School Based Factors Affecting Attainment ...............................................................................................79 The Importance of English Language ........................................................................................................................................80 Deprivation, Social Class and Segregation ..............................................................................................................................80 Perceptions of the Labour Market ............................................................................................................................................81 School Resources, Leadership and Ethos ................................................................................................................................82 Teaching Quality, Content and Techniques............................................................................................................................82
Appendix 1: Methodology ................................................................................................................................................................87 Issues with the Available Data....................................................................................................................................................87 Our Approach in Summary.........................................................................................................................................................89 Start Up Meeting ...........................................................................................................................................................................90 Secondary Research and Consultation with Educationalists...............................................................................................90 Statistical Analysis and Modelling...............................................................................................................................................92 The Reliability of Attainment Measures...................................................................................................................................93 The Reliability of Value Added Measures ................................................................................................................................95 Special Educational Needs...........................................................................................................................................................96 Case Study Interviews..................................................................................................................................................................97 Focus Group...................................................................................................................................................................................97
Appendix 2: Glossary ........................................................................................................................................................................98

3
Learning to Succeed: understanding and addressing Key Stage 4 (GCSE) underachievement in Yorkshire and Humber
knowledge management for the information age
Executive Summary
Context and Research Brief In Progress in the Region (Yorkshire Futures 2006) the point was once again made that attainment levels in the Region drop between Key Stage 2 (where levels are comparable to the English average) and Key Stage 4 (where levels are considerably
behind the English Average). The percentage drop in attainment compared to the English average between Key Stage 2 and Key Stage 4 has been fairly consistent, and it has ranged from between 3 and 5 percentage points over the last 5 years. Over this period, the Region’s attainment at Key Stage 2 is not more than 2.3 percentage points below the English average, but there is clearly a more pronounced gap when pupils reach Key Stage 4. Latest data shows the Region 2 percentage points behind the English
average across English, Maths and Science at Key Stage 2, whilst at Key Stage 4, 54.6% of pupils in Yorkshire and Humber achieve five good GCSEs, compared to 59.2% nationally, a gap of 4.6 percentage points.
Our brief was to look at the relative drop in attainment in the Yorkshire and Humber region between Key Stage 2 and Key Stage 4. To a certain degree, this relative drop in attainment is dependant on the measure for attainment that we use. Nevertheless based on all measures available to us the Region underperforms and this underperformance although narrowing compared with other regions has become more consistent. Our investigation uses a number of statistics
including the 2006 National Pupil Database, DfES (the relevant part now called DCSF) Performance Tables (across a number of years) and the 2001 Census of Population. It included extensive statistical tests including Pearson’s Coefficient, Multiple Regression and Multi-Level Modelling. All our findings were triangulated through more qualitative techniques including semi-structured interviews and a focus group.
A Note on Assessment and Statistics Based on our assessment of attainment statistics (and Contextual Value Added) we believe that they have become so complex and statistically unpredictable that they are of limited value for local policy development. Furthermore, they provide parents with confusing evidence to make choices’ with (where choice is prevalent) and are likely to simply reinforce existing divisions between schools. Indeed current attainment patterns are partially a reflection of the inadequacies of
KS2 English Level 4 %
66
68
70
72
74
76
78
80
82
1999 2000 2001 2002 2003 2004 2005 2006
%
North East North WestYorkshire and the Humber East MidlandsWest Midlands East of EnglandLondon South EastSouth West
5+ GCSEs %
35
40
45
50
55
60
1999 2000 2001 2002 2003 2004 2005 2006
%
North East North WestYorkshire and the Humber East MidlandsWest Midlands East of EnglandLondon South EastSouth West

4
Learning to Succeed: understanding and addressing Key Stage 4 (GCSE) underachievement in Yorkshire and Humber
knowledge management for the information age
attainment measures and targets and partially the actual patterns of attainment. For example, we doubt if minor changes in School’s Performance Table position actually measure differences in attainment. Our own models suffer from the same level of unreliability (a product of the synthetic nature of much of the data that we had access to) and are therefore, more valid in determining what is not related to the Region’s underattainment, than in what is.
Analysis and Findings Only 7% of the variance in Key Stage 4 attainment can be accounted for by school level issues, in other words broader policy issues are much more significant than what happens in schools. Nevertheless, school level factors do appear to discriminate between low attainment and very low attainment. Our research has questioned the accepted belief within education that low attainment is directly related to deprivation itself, as this is bundled together with other factors including social class, learning culture and the effects of labour market perceptions on aspirations that are difficult to disaggregate. What our research does suggest to us, is that a pupil’s perception of their labour market chances impact on their attainment (from a relatively early age) and that the balance within a school of those believing that they will successfully engage within the labour market and those who do not, is a crucial factor affecting attainment (which provides schools with their ‘ethos’). Because pupils from households of semi and unskilled manual workers have lower attainment than those who are on benefits we question whether perceptions of the labour market and potentially other factors associated with social class or and type of occupation are more important than deprivation in determining attainment. In a seemingly buoyant labour market with high skilled occupations, pupils will have high aspirations, because they need to acquire these skills to compete. The same is true for a seemingly depressed labour market, as only those with high skill levels will compete, although for those that know that they cannot compete, this could be a disincentive. However, for seemingly buoyant labour markets with an abundance of low skilled employment, this disincentive will also exist. Added to this are important gender differences in attainment, with females now doing markedly better than boys do. We believe that attainment is strongly related to the level of social segregation in our schools. In order to understand social segregation we constructed a Dissimilarity Index of the difference between manual semi and unskilled households and managers and professionals. This explained around half of the variance of Key Stage 4 results. We believe that this is because those from managerial and professional backgrounds more often hold positive attitudes towards education (where it has been important in helping them in their career path) than those from manual backgrounds (as attainment is unlikely to be a prerequisite for obtaining such jobs). We hypothesise that it is important for schools that they have enough pupils with positive attitudes, hence our concern regarding social segregation. Another measure of social segregation was to look at the distribution (we actually measured Kurtoisness – essentially the consistency around a mean rather than a

5
Learning to Succeed: understanding and addressing Key Stage 4 (GCSE) underachievement in Yorkshire and Humber
knowledge management for the information age
wide variation in data) of results within each school. We found that the lower the Kurtoisness (or the wider the distribution) in Key Stage 2 English the lower the attainment at Key Stage 4. We believe this is because Key Stage 2 English measured those communications skills that are so important across all GCSE subjects. Yorkshire and Humber had the highest level of Kurtoisness of any region, which we believe plays a large part in explaining its relative underperformance.
Overall, we believe that the different parts of our model are better at explaining comparisons with different regions. Income deprivation appears to explain the differences between northern and southern regions. In other words, the higher numbers of people on income support in the north appear to explain why the north underperforms at GCSE when compared with the south. However, the differences between the north and the midlands appear to be more related to the social mix by region (measured by our Dissimilarity Index using AB-D). Within the north, the relative differences by region appear to be more related to the distribution of attainment at Key Stage 2 English, as well as factors such as the degree to which use of alternative curricula to GCSEs affects results.
The exception to our generalisations is London; indeed in many of our investigations London appeared to be a special case, possibly as a result of the major investment that has recently occurred in London’s schools (Excellence in Cities). Although income deprivation provides a partial explanation for the Region’s differences to London, the distribution of Key Stage 2 English results also looks important. Overall, we believe this is a reflection on London’s unique labour markets, with many residents enjoying high status and paid employment, the capital is home to some of those who are most disadvantaged within the labour market and certainly to some with the lowest disposable incomes. In addition, pupils (including those at primary schools) travel long distances across London to attend the school of their choice.
Recommendations 1. Promote the indicator of five GCSEs at A*-C including English and Maths as
the main benchmark that is reported on, coupled with a wider indicator such as total GCSEs passed per pupil that depends upon the success of all pupils, including those who are likely to far exceed or fall below the five good GCSEs benchmark.
2. Use alternative curricula positively but carefully in a child centred rather than
target centred way. This means balancing the benefits of young people attaining qualifications most valued by employers with the need to maximise
Factors Affecting Regional Attainment at Key Stage 4
Yorkshire and the Humber
North East
NorthWest
West Midland
East Midlands
EasternRegion
London
South East
SouthWest
Key Stage 4 Attainment
Income Deprivation Defines Distance from Yorkshire and the Humber
Social Segregation Defines Distance from Yorkshire and the Humber
Kurtoisness of Key Stage 2 English Defines Distance from Yorkshire and the Humber

6
Learning to Succeed: understanding and addressing Key Stage 4 (GCSE) underachievement in Yorkshire and Humber
knowledge management for the information age
their chances of gaining qualifications to keep them engaged and prevent them being labelled a failure. In addition, put emphasis on enlivening the core curriculum to motivate and stimulate pupils.
3. Yorkshire and Humber has the lowest attainment nationally at Key Stage 2
English. Given the influence of this on subsequent performance place additional emphasis on English Language and communication skills within schools generally, especially for primary schools and pupils with low Key Stage 2 attainment.
4. Any increase in selection of pupils by schools is likely to increase segregation
and by implication worsen overall performance. Selection should be avoided unless there are very pressing reasons and strong evidence that override this presumption.
5. Strive to locate new schools so that their local catchment areas span mixed
communities and hence attract a well-balanced intake of pupils. Planning, especially of housing and neighbourhoods is also a key tool in creating more balanced communities long term.
6. Carefully review and adopt systems for allocating pupils to schools to reduce
segregation and improve attainment, whilst retaining sufficient local support to be sustainable.
7. Continue to support and place extra emphasis on early learning, parental
engagement and on enhancing home learning environments. Where needed and desired this could include helping parents to improve their own reading, writing and numeracy skills and to support their children’s learning more fully and effectively.
8. Implement the Regional Economic Strategy to make progress in transforming
the economy and labour markets, especially those areas facing the greatest economic challenges and/or trapped within a low skills equilibrium.
9. Strongly communicate positive information about changing local economies
and new job opportunities to schools, teachers and parents so that perceptions of labour markets are more positive and factual, especially in areas, which have experienced changing labour markets or economic problems.
10. Promote role models within schools and communities, such as business
people, successful people from sports or culture, or those who have made a difference in their communities and are from the local area or one like it.
11. Conduct and apply further research into what constitutes positive leadership
and a good ethos within schools, how this might vary by the type of school and its circumstances, and how to nurture this.
12. Further explore the nature and impact of teachers and teaching within
different school environments, and how far exposure to the best teachers makes a difference to performance and variation within as well as between schools.

7
Learning to Succeed: understanding and addressing Key Stage 4 (GCSE) underachievement in Yorkshire and Humber
knowledge management for the information age
1 Background, the Issues and the Approach
Education is seen as a key issue within Yorkshire and Humber as it is seen to affect both pupil’s life chances and economic achievement. One of the key high-level measures the Region uses within its set of ‘Advancing Together’ high-level indicators is the proportion of 16 year olds passing 5 ‘good’ GCSEs (i.e. grades A-C). On this ‘Key Stage 4’ measure, despite some absolute improvement in recent years in the proportion of pupils meeting this benchmark, this proportion is the lowest of the nine English regions. For instance, in 2006 the 54.5% of pupils in Yorkshire and Humber attained 5 good GCSEs, whereas the national average was 59.2%. In exploring educational performance and the reasons for it, it is notable that the Region’s pupils do rather better (compared to national average) in the Key Stage 2 standard attainment tests (in Maths and English) at age 11. On this measure, in 2006, attainment was only 2.8% below national average. A similar trend can be observed in previous years too, with apparent decline in educational attainment between ages 11-16 (Key Stages 2-4). As it would be implausible to suggest that pupils’ mental capacities should be expected to decline relative to others elsewhere during this time, it appears that factors within or outside schools (typically secondary schools) in the Region operate to undermine performance here more than for most other regions. Understanding what factors contribute to relative decline in performance compared to national average between Key Stages 2 and 4 is a vital step to effectively raising performance at GCSE. This report, commissioned by Yorkshire Futures (after input from a number of educational stakeholders and experts in Local Educational Authorities ([LEAs] and elsewhere) explores what factors are at work. It has been completed by Hoshin, using extensive statistical testing and modelling as well as interviews with key stakeholders and experts. The specific aims and objectives of the project were:
Project Aims
1. To investigate the reasons for a drop in attainment between Key Stage 2 and
Key Stage 4 in Yorkshire and Humber, when compared with the English average;
2. To identify best practice in pedagogy and educational management that may
help to improve attainment; and
3. To investigate the differences in attainment by ethnicity and gender and other demographic factors, when controlled with other factors influencing attainment.
Project Objectives To achieve these aims, the research sought to: 1. Track the performance of all schools in Yorkshire and Humber at Key Stage 2
and Key Stage 4 over a period of at least 5 years;

8
Learning to Succeed: understanding and addressing Key Stage 4 (GCSE) underachievement in Yorkshire and Humber
knowledge management for the information age
2. Consult with regional educationalists on a series of indicators and on how to
interpret the qualitative evidence;
3. Identify schools in Yorkshire and Humber whose performance cannot be readily explained by normal variation and investigate best practice in those schools whose value added is beyond normal variance;
4. Investigate the factors that contribute towards educational attainment
(including ethnicity and gender), based on national and international evidence; 5. Identify the importance of factors contributing towards educational attainment
based on national data; 6. Identify the relative importance of multiple factors in contributing towards
educational attainment based on national data; 7. Develop a model to explain the performance at Key Stage 2 and Key Stage 4
for schools in Yorkshire and Humber; 8. Track the value added from Key Stage 2 to Key Stage 4 for at least 2 cohorts
for all schools in Yorkshire and Humber; 9. Make recommendations on how Yorkshire and Humber can close the gap on
the rest of England in terms of performance at Key Stage 4.
The Brief
As discussed above, the objective of this study was to understand why attainment dips in Yorkshire and Humber between Key Stage 2 and Key Stage 4 when compared with the English average and to provide recommendations on how to reduce this gap. There are a number of important questions raised by this. Not least, what is meant by attainment? In Yorkshire and Humber, the high-level indicator that was adopted (based on a nationally stipulated measure which is usually
reported in the media) to report on progress at age 16 is the proportion of pupils with at least five ‘good’ (grade C or better) GCSEs or equivalent. Yorkshire Futures based their initial data and analysis on a comparison of the performance on this indicator compared to performance at Key Stage 2. There are other ways of tracking performance too. These include tracking ‘Value Added’ within schools, which ais based on total points scored (calculated through different passes in different exams or tests being allocated a particular points value). For 2006 DfES also introduced data on the attainment of 5+ GCSEs at grades A*-C, including
KS2 English Level 4 %
66
68
70
72
74
76
78
80
82
1999 2000 2001 2002 2003 2004 2005 2006
%
North East North WestYorkshire and the Humber East MidlandsWest Midlands East of EnglandLondon South EastSouth West

9
Learning to Succeed: understanding and addressing Key Stage 4 (GCSE) underachievement in Yorkshire and Humber
knowledge management for the information age
English and Maths, which has proved to be the most reliable of measures (within our investigations)1.
Although we feel it is important to look at attainment year on year, we also believe that it is important to attempt to track cohorts, so that we can look at actual value added and not simply at year on year changes. Given that we have some performance data from 1992, it was possible for us to track ten individual cohorts. However, tracking cohorts does not pick up recent improvements at Key Stage 2, so we also looked at year on year change across cohorts. Although the data is not always consistent and therefore some normalisation of the data is
necessary (we used Z scores; which subtracts the mean and divides by the standard deviation for each observation in an array of data).
Performance Data for Schools (adapted from Ray 2006) There are approximately 25,200 state-maintained and independent schools (7% of pupils are in the independent sector) in England and 1,890 in Yorkshire and Humber. Schools vary in size, however the average size of a secondary school is 980 pupils (approximately 140 pupils per year group); primary schools have about 240 pupils on average, 40 per year, this means that in total there are around 8,200,000 pupils within the system. There are about 17,500 primary schools, which generally cover ages 4-11, and about 3,400 secondary schools, normally covering ages 11-16 (some have ‘sixth forms’ covering post-16 as well). In Yorkshire and Humber, there are around 1,500 primary (and middle) schools and 380 secondary schools. In addition, some Local Authorities (e.g. parts of Kirklees and the Craven District of North Yorkshire) have retained middle schools for Key Stages 2 and 3. Some pupils are classified as special educational needs (SEN) and are educated in maintained schools; others are educated separately in Special Schools. Maintained schools are funded through local government: there are 150 Local Authorities (we have used the old term LEAs to denote Local Authorities with control over school budgets in this report) covering England. The smallest LEA is the Isles of Scilly with just one school and the largest is Kent with 103 secondary schools and 470 primary schools. Amongst secondary schools some LEAs have maintained a degree of selection with around 164 schools (or 4% of schools) being Grammar Schools, which maintain selection and 6% Secondary Moderns for those who fail in the selection process (there are also a number of schools in the Region that are effectively Secondary Moderns, but not designated as such). Grammar Schools can be found in 36 LEAs, of which 10 are entirely selective. No LEA in the Region is entirely selective, although there are a number of isolated Grammar Schools (such as
1 NOTE: we have used different measures throughout this report and in our graphics. This is largely dependant of the availability of measures for different geographies (facilitating comparisons).
5+ GCSEs %
35
40
45
50
55
60
1999 2000 2001 2002 2003 2004 2005 2006
%
North East North WestYorkshire and the Humber East MidlandsWest Midlands East of EnglandLondon South EastSouth West

10
Learning to Succeed: understanding and addressing Key Stage 4 (GCSE) underachievement in Yorkshire and Humber
knowledge management for the information age
Heckmondwike Grammar School), including two in Skipton alone. The remaining 90% of schools have traditionally been Comprehensive, although a number of new schools types have been introduced over recent years, including City Technology Colleges and Academies (such as Dixon’s City Academy, in Bradford), which may use a degree of selection in their enrolments. Vocational Centres (or Academies) are becoming popular and provide a vocational curriculum often aimed at 14-19 year olds. Although none currently exists in Yorkshire and Humber, a number of LEAs are planning to introduce them. The school year runs from September to July, divided into three terms. Assessment of attainment is made at the end of the school year, so data for the calculation of value added becomes available in the following autumn. In 1992, the Performance Tables (for 16 year olds, now called Key Stage 4) for schools were introduced with the aim of raising standards through introducing a quasi market in education through parental choice. In 1996, the first tables for primary schools were produced with results for the new Key Stage 2 tests taken by 11 year olds. Value added scores were introduced for all secondary schools and were included in 2002, with value added for primary schools in 2003. These have been refined to include geodemographic variables and are known as contextual value added (CVA). The Office for Standards in Education (OFSTED) inspects all maintained schools and LEAs in England; OFSTED’s overall inspection reports are published. Schools are graded as Outstanding, Good, Satisfactory or Inadequate; schools in this last category may be put into ‘special measures’ or given a Notice to Improve. In addition, all schools whose attainment is below the Neighbourhood Renewal Floor Targets receive special attention from their LEA. Inspectors use school attainment data in developing their recommendations, traditionally these have been called Performance and Assessment (PANDA) Reports. Whilst school improvement analysis could already be provided by LEAs and academic institutions, schools did not always have access to this data. In 1998, value added statistics for groups of schools were introduced, facilitating individual schools to benchmark their attainment and set targets. This supplemented the OFSTED PANDA, which already contained data for specific schools (although not value added measures until they were introduced into Performance Tables). In recent years, the Autumn Package has evolved into a software package, called the Pupil Achievement Tracker (PAT). This year PANDA and PAT have been merged to create the RAISEonline facility. In 1999, a unique pupil identifier (UPN) was introduced which enabled data to be matched throughout the school system. In addition, there was the move to an annual pupil-level census of schools, which collected background characteristic data that schools recorded for administrative purposes. The Pupil Level Annual Schools’ Census (PLASC which contains data on around 577,000 pupils in state secondary schools until the age of 16) was introduced in 2002. This has been amalgamated over the years to form the National Student Database.

11
Learning to Succeed: understanding and addressing Key Stage 4 (GCSE) underachievement in Yorkshire and Humber
knowledge management for the information age
Points are allocated for attainment at the various Key Stages, that are collated in the Performance Tables and in PLASC. For Key Stage 2 these are as follows:
Key Stage 2 Test Outcome Points Distribution (%) for Mathematics in 2006 Level 5 33 33 Level 4 27 42 Level 3 21 17 Compensatory 2 15 1 N (not awarded a test level) 15 2 B (working below the level of the test) 15 4 Disapplied Disregarded 0 Absent Disregarded 1
For Key Stage 4 they are:
Key Stage 4 Qualification
Grade Points Qualification Grade Points
A* 58 D 220 A 52 M 196 B 46 P 160 C 40
GNVQ Full Intermediate
U/X 0 D 34 D 110 E 28 M 196 F 22 P 160 G 16
GNVQ Part 1
U/X 0
GCSE
U/X/Q 0 D 136 A*A* 116 M 112 AA 104 P 76 BB 92
GNVQ Full Foundation
U/X 0 CC 80 DD 68 EE 56 FF 44 GG 32
Vocational GCSE
U/X/Q 0 A* 29 A 26 B 23 C 20 D 17 E 14 F 11 G 8
GSCE Short Course
U/X/Q 0
In addition, there has been a growth in the use of alternative courses (especially GNVQs) such as the GNVQ Language Unit at Foundation and Intermediate level, for which passes are awarded 17 and 26 points respectively (representing a part of a full GNVQ). More recently, with the phasing out of the GNVQ there has been a growth in the use of NVQs and VQs within schools, especially in the area of

12
Learning to Succeed: understanding and addressing Key Stage 4 (GCSE) underachievement in Yorkshire and Humber
knowledge management for the information age
ICT, although other subjects like sports and recreation are also becoming popular. In addition, there are a range of non-GCSE qualifications like DIDA and ALAN that are extremely popular across the Region. Furthermore, the examination boards are currently extremely active in developing new qualifications to replace the GNVQ, including BTECs. We feel that new vocational GCSEs, are somewhat different as they are designed to be truly vocational alternatives to the current more academic GCSEs.
Value Added
Using this points system, it is possible to look at simple value added each year, within a LEA or an individual school; or across a cohort either at LEA, school or pupil level. This is based on Key Stage 2 average point score for English, Maths and Science compared with total points from up to 8 of the highest Key Stage 4 qualifications. However, as the potential points allocated to Key Stage 4 are greater than those for Key Stage 2, some normalisation of the data is often undertaken.
The distribution of (simple) value added scores for England in 2005 is somewhat abnormal. A normal distribution is one with a ‘bell shaped curve’ with symmetry either side of the mid point (or mean). Given that, the assessment and allocation of points are synthetic rather than naturally occurring, this should come as no surprise. Indeed, there is a long tail at the lower end of Key Stage 4 attainment, meaning that whilst many pupils attain just above the average, there are a considerable number attaining well below the average. Many commentators have used this fact, together
with data on functional reading and writing to suggest that our school system is currently failing far too many of our young people. However, we believe that it actually suggests that GCSE’s have become less discriminatory for higher achievers, curtailing the distribution at the higher end (especially when points are curtailed to a maximum of eight subjects; although our data and graphic from the National Pupil Database shows that a small number of candidates are clearly doing large numbers of GCSEs). Chapter 3 focuses on factors that may affect attainment and includes details of Contextual Added Value (CVA) statistics that are intended to show how well a school is actually performing given the intake of pupils it has. This measure takes into account factors (such as socio-economic backgrounds) which have been shown to correlate to performance. In effect this CVA analysis also acts as a predicative tool to suggest what a pupil at age 11 may normally be capable of at age 16 – in itself a factor that can potentially influence actual performance. The next Chapter focuses on this question of measuring attainment.
KS4 Points Score
0
10000
20000
30000
40000
50000
60000
70000
<= .00 67.61 -
101.40
169.01 -
202.80
270.41 -
304.20
371.81 -
405.60
473.21 -
507.00
574.61 -
608.40
676.01 -
709.80
777.41 -
811.20
878.81 -
912.60
980.21 -
1014.00
1081.61
-
1115.40
1183.01
-
1216.80
1318.21
-
1352.00
Passes
Pup
ils
13
Learning to Succeed: understanding and addressing Key Stage 4 (GCSE) underachievement in Yorkshire and Humber
knowledge management for the information age
2 Measuring Attainment
Summary
The rationale for commissioning this research is that low educational attainment adversely affects life chances and economic performance. This Chapter looks at this question from fundamentals. Whilst concluding that educational attainment, labour markets and economic performance are indeed related, it emerges that the relationship between them is complex and most probably two way. The argument that qualifications gained (increasingly alongside generic skills like communication, initiative, creativity and problem solving, teamwork, etc.) affects both an individual’s job and salary opportunities, and the productivity of employees within a work context is well rehearsed. Skills are identified as a key driver of productivity, and for instance, the Yorkshire and Humber Regional Economic Strategy for 2006-15 states that: “… we need people with the right skills and attributes, that match good employment opportunities. This factor is vital as the skills, attitudes and abilities of people here will govern how much our businesses innovate, whether people access good jobs, and how many people start a business. Trends suggest knowledge will be even more important in the future…high level skills in particular appear to make a telling difference to business performance”. As attainment at age 16 at GSCE or equivalent is often a necessary stepping stone to higher level qualifications which are in turn linked to economic performance, the case is made firmly that qualifications in blunt terms affect jobs and the economy. However, the case can also be made that the relationship also works the other way round – that it is also plausible that perceptions of poor labour market opportunities adversely affect attainment. This is explored in more depth - linked to deprivation, social class, segregation and culture – in Chapters 4 and 5 of this report. Ultimately, both scenarios are inter-related and can never be effectively disaggregated, and a combination of the two is the most likely. Indeed the reality is most likely to be that whilst low skills may impact on the Region’s image with investors and the extent to which existing business fully utilise the potential of their employees and innovate, a lack of high skilled jobs will negatively affect attainment. In short, the relationships are circulatory and the result is a ‘low skills equilibrium’ that tends to be self-reinforcing. Despite SATs and School’s Performance Tables having been around for a number of years there is only limited standardisation of the datasets available (indeed there is no attempt to identify normal variation using a simple technique like Statistical Process Control) and the National Pupil Database only contains those items already used by DCSF in Contextual Value Added. Furthermore, the way that SATs and Contextual Value Added (CVA) are reported are so opaque, that we believe they are of limited value in school improvement and could well result in headteachers reacting in ways that are counter productive. Indeed commercial quality management would suggest that headteachers reacting to normal variation could harm the quality of education (known as ‘tampering with the controls’).

14
Learning to Succeed: understanding and addressing Key Stage 4 (GCSE) underachievement in Yorkshire and Humber
knowledge management for the information age
Despite these limitations, we have been able to develop a tool that is more accurate than CVA in predicting Key Stage 4 results. Overall, we feel that this is as much a reflection on the inadequacy of CVA and the other data available for improvement rather than, that we have developed a profound insight into the English education system.
How important is Attainment?
There is a strong body of evidence to show that individuals with higher qualifications enjoy higher wages (see Campbell 2000). This is also borne out in Yorkshire and Humber as well as England, where survey data2 as shown graphically shows the proportion of people earning high incomes is far higher for those with higher-level qualifications. Conversely those with no qualifications are by far the most likely to have a very low household income of £10,000 or below. Others argue that this relationship between attainment and the economy is overstated. For instance, Tunny (2006) argues that at an international level there is only partial evidence to suggest that comparable countries with higher levels of attainment have higher productivity. In the UK, Bartholomew (2006) suggests that whilst people with vocationally relevant high level qualifications (such as Law and Medicine) do enjoy higher wages, the majority do not do so, in fact, many Arts graduates receive lower wages than if they had not chosen to study in Higher Education. Whilst it may be true for significant numbers, that argument does not appear strong for the majority when set against the previous table which is based on average incomes across the whole spread of qualifications. Equally, Bartholomew’s analysis does not appear to consider whether an individual who by
nature is of an artistic bent is likely to earn more if he or she studies to a higher level or not. Overall, this research remains based on the premise that attainment is likely to affect life and career chances and economic performance, alongside other factors and in an often complex and circular fashion.
2 © Acxiom UK Ltd. Research Opinion Poll, (2006). All rights in the data contained in this data belong to Acxiom UK Ltd and may not be used or reproduced without the express permission of Acxiom UK Ltd.
0 5
10 15 20 25 30 35 40 45
no qualification up to NVQ level 2 up to NVQ level 3 up to NVQ level 4 up to degree /post graduate
degree
NVQ equivalent level
% o
f peo
ple
with
sal
ary
band
s
£0-9999
£10-25K
£25-40K
£40k+
Qualifications by Salary Band: Yorkshire and Humber (Acxiom UK Ltd, 2006)
0 5
10 15 20 25 30 35 40 45
no qualification
up to NVQlevel 2
up to NVQ level 3
up to NVQlevel 4
up to degree /post graduate
degree
NVQ equivalent level
%of
peop
lew
ithin
sala
ryba
nds
£0-9999
£10-25K
£25-40K
£40k+
Qualifications by Salary Band: England (Acxiom UK Ltd, 2006)

15
Learning to Succeed: understanding and addressing Key Stage 4 (GCSE) underachievement in Yorkshire and Humber
knowledge management for the information age
The notion of NVQ level is relatively new and have never really been accepted by a number of employers as describing many of the highly job specific skills they are looking for. In many respects, this mirrors the differences between the use of competence in NVQs (based on acceptable performance across a variety of tasks) and an employers’ search for job related talent (based on exceptional performance on possibly a few key tasks). A further factor in investigating attainment is what is being measured by SATs (especially the average score), GCSEs and other examinations. Although SATs have been rigorously tested, we are surprised that they are not as effective at predicting GCSE results, as we would have expected them to be. Indeed, we find that Key Stage 2 English is much better at predicting Key Stage 4 results overall than the Average Points Score (an important finding in Cassen and Kingdon’s study [2007]). This is probably because GCSEs measure communication skills every bit as much as they measure the individual subjects taught. Our first reaction was to see SATs as a purer (‘more scientific’) measure, but given that we believe GCSEs to have more resonance with employers, we have to question the value of these seemingly purer measures. “GCSEs are much more important than SATs.” Pupil at High Attainment School “GCSEs are important, they have an effect on your future.” Pupil at High Attainment School Our study has also cast some doubts on the regime of target setting that exists within our schools and whether this, as currently pursued, can have unintentional and undesirable effects. Indeed Jesson (2000) reminds us of the reason for education: “… schools do not exist simply as production lines for the generation of examination results; they are communities whose good health is enhanced by introducing pupils to a wide and liberal familiarity with the range and depth of our cultural heritage and its religious and philosophical underpinnings.” Based on our school visits as part of this study we found that such a vision of education was obscured within many state schools by target setting and the paramount nature of league table position. Nevertheless most high attaining schools we visited had an ethos that put the whole person before attainment and league table positions. Clearly high attaining schools use available data on attainment, but critically this is not the only tool they have in school management.
The Reliability of Data and Statistical Methods
In his entertaining description of British social attitudes, Michael Bywater (2006) doubts the validity of current measurement within education: “… it must be measured, because training people to do a job then letting them get on with it would be treating them like grown ups; so a spurious set of measurements which have nothing to do with what is supposed to be being measured, are established, laboriously monitored, collected, collated, published…”

16
Learning to Succeed: understanding and addressing Key Stage 4 (GCSE) underachievement in Yorkshire and Humber
knowledge management for the information age
From a more considered perspective Stephen Gorard, from York University, questions the reliability of DCSF published attainment data and therefore, its use in investigating value added.
“… it is extremely difficult to claim that small differences in ‘surface’ attainment between students represent real differences in achievement. However, it is important to realize the asymmetry involved in such evidence based claims. If an unreliable measure shows a small difference between two groups in any comparison we may, as here, consider whether the observed difference is large enough to override the inherent error. However, if the same measure shows no difference between two groups in the comparison, we cannot use the unreliability to claim that there is, in fact, a difference.” Gorard and Smith (2004) In particular, he argues that the Key Stage 2 scores are not discriminatory enough to be used to calculate value added between Key Stage 2 and Key Stage 43. He therefore concludes that performance data is not wholly reliable to be of value to policy makers (Gorard 2005). We not only agree with Stephen, but remind the reader that if this is the case then de facto it also applies to our findings and recommendations. We believe that a part of the reason for this lack of reliability is the synthetic nature of Key Stage 2 Average Points Score and have therefore, used Key Stage 2 English Fine Grades (raw scores) as a more reliable alternative (in modelling performance). Our preference for Fine Grades has a firm statistical precedence: “There is an extensive statistical literature on the dangers of drawing conclusions from using aggregated data, especially where the disaggregated data are available.” Thompson, Treadaway and Knight (2005). Nevertheless judged by psychometric testing standards the SATs Fine Grades are highly reliable and a strong predictor of GCSE attainment. We do not take issue with this, but simply believe that they are being used in ways which should demand far more accurate measures. One reason for this is that GCSE subjects are broad, with many requiring a high level of communication skills (indeed many subjects still rely on essays to assess pupils). “You can’t compare apples and pears.” Headteacher High Attainment School “I can’t see how the science learning would help with the science SATs.” Headteacher of a School with Exemplary Science Attainment Taylor and Nguyen (2006) reach a similar conclusion, also arguing that social class is more important than prior attainment in determining the (simple) value added score. Their explanation for this is highly compelling:
3 In fact he found (2005) a strong correlation between attainment at Key Stage 4 and (simple) value added (he found it to be a staggeringly high r = 0.96 on a sample of schools in Yorkshire and Humber [r is a measure of correlation, with 1 being perfectly positively correlated, -1 perfectly negatively correlated and 0 being totally uncorrelated, or random]), suggesting that this was more important than Key Stage 2 attainment (he found this to be r = 0.87. This is much higher than our correlations due to it being at a higher level of geographical aggregation) or other variables in determining DCSF’s published value added data.

17
Learning to Succeed: understanding and addressing Key Stage 4 (GCSE) underachievement in Yorkshire and Humber
knowledge management for the information age
“… there is a major problem in using the value added indicator to measure a school’s performance. Specifically, it cannot be assumed that the knowledge gained by pupils during any of the Key Stages is due solely to the contribution of the schools…” Whilst Gray et al (1999) produce a very similar argument, adding that it is often difficult to dissect the methodology from the ‘baggage’ a researcher brings with them. Hoshin’s background is in labour market research and quantitative analysis and not in educational statistics. Our approach to this has been to use a variety of methods, at a variety of levels, but including multi-level modelling. This enables us to triangulate our results and reach informed conclusions, rather than solely relying on the output from a sophisticated statistical package. In addition, we have contextualised our findings by also including qualitative research techniques, an approach supported by Gray et al (1999). Nevertheless, such a methodology inevitably leads to contradictions. Many contradictions mirror those in real life. The art of the statistician is to edit the contradictions so that the overall picture is a balance of the normative and insightful observations. In conclusion, Gorard’s work provides notes of caution on the premise behind this very research project. “There is no reason to assume that achievement in different parts of the UK, or in different types of schools, is different for equivalent students. There is no reason to assume that achievement differs between social groups, as defined by ethnicity, social class, language or sex (for otherwise equivalent students). There is some evidence that achievement in state-funded schools is improving over time, and that, to the contrary of popular reports, the gap in attainment between individuals are declining… a considerable amount of public funding has been wasted in attempting to solve a specific problem of underachievement at school that does not actually exist.” Gorard and Smith (2004) “The enormity of the problem, once accepted, for policy-making, the local reputation of schools, and for studies of school effectiveness would be difficult to emphasise.” Gorard (2005) In fact, given that we have been able to produce a predictive model as reliable as the CVA model (used by all schools and inspectors, see Chapter 6), as a by-product of our investigation, we have to wonder if this is simply a product of the unreliability of the data and measurements. We actually produced many regression models in developing our findings, all had similar levels of reliability (and one was slightly higher than the DCSF CVA model), suggesting that we are close to the threshold of the reliability of what can be done with attainment data. In addition, a conversation with Stephen Gorard, uncovered that we may have produced but one of a number of equally unreliable yet plausible explanations for attainment at Key Stage 4 in Yorkshire and Humber. Certainly, we doubt that the current CVA model should be so integrated into school management and quality assurance, when it is not wholly reliable. Interestingly Fischer Family Trust (2005b) only fall slightly short of drawing this same conclusion: “The explanatory factors used by SX [Fischer Family Trust’s version of CVA] and CVA model accounted in both cases for just over half the variation in pupil KS4 outcomes. Neither model statistically explained a substantial proportion of the differences in pupil achievement at the end of compulsory secondary school.”

18
Learning to Succeed: understanding and addressing Key Stage 4 (GCSE) underachievement in Yorkshire and Humber
knowledge management for the information age
In addition, most headteachers, teachers and academics share our misgivings regarding CVA. “The government's continuing attachment to performance tables is ‘incomprehensible’… value added tables shuffle the winners and losers without addressing the fundamental flaws behind the tables in the first place." Doug McAvoy, General Secretary the National Union of Teachers (NUT) "The current system of publishing performance tables is still very flawed, in effect does not do what it says on the can.” Harvey Goldstein of London University's Institute of Education “It is our strongly held conviction that the CVA - or indeed any other single measure - is not strong enough to bear the weight of accountability being placed on it.” John Dunford, General Secretary of the Association of School and College Leaders
Despite a huge body of literature on school level improvement measures, many commentators argue that measures aimed at reducing the inequality pupils’ face, at home, would have a greater effect. “Poverty reduction programmes may… be an important way of increasing value added, especially in schools with a large proportion of pupils from poor families.” Taylor and Nguyen (2006) Our own data would appear to support the gist of this conclusion, that socio-economic variables affect performance more than in-school factors (see Chapter 5), although not necessarily based primarily on income. However, it was equally clear to us that attainment in some schools and across some LEAs could not be readily explained by our models, regardless of how sophisticated they became (as indeed is the case with the DCSF’s own CVA model). Therefore, whilst concluding that socio-demography is the main determinant there are also likely to be important LEA and school level effects, that policy makers may be able to influence. Although as Gorard and Smith (2004) have identified, this could be due to normal variance and error rather than actual differences.

19
Learning to Succeed: understanding and addressing Key Stage 4 (GCSE) underachievement in Yorkshire and Humber
knowledge management for the information age
3 Factors Affecting Attainment – Overview and CVA Variables
For 2006, DfES released Key Stage 2 to Key Stage 4 contextual value added (CVA) statistics based on points scored for all schools in England. These take account of a large number of variables contained on the National Pupils Database (which includes PLASC). These are summarised as follows:
Variables Affecting KS4 Attainment
2005 Key Stage 2-4 English
2005 Key Stage 2-4 Mathematics
2005 Key Stage 2-4 Science
(Constant) 20.55 13.39 17.07 Key Stage 2 fine grade average points score -1.16 -0.84 -1.56 Key Stage 2english -Key Stage 2 average point score fine grades 0.71 -0.02 -0.25 Key Stage 2maths -Key Stage 2 average point score fine grades -0.12 0.90 -0.20 Quadratic of Key Stage 2 Average Point Score 0.05 0.05 0.07 free school meal - no 0.00 -1.77 -1.89 free school - yes -1.70 -1.77 -1.89 In care at current school - no 0.00 -1.93 -1.57 In care at current school - yes -1.38 -1.93 -1.57 Income Deprivation Affecting Children Index score -5.02 -5.51 -5.78 Non-SEN 0.00 0.00 0.00 School Action -2.74 -2.62 -2.70 Action+ / Statement -3.97 -3.50 -3.36 pupil joined school after Sept Yr 10 -3.93 -4.39 -5.43 pupil joined school not in July/Aug/Sept Yr 7- 9 -1.49 -1.88 -1.78 Male 0.00 0.00 0.00 Female 2.31 0.36 -0.28 Age (within year) -0.98 -1.66 -1.69 First language: English or believed to be English 0.00 2.04 1.81 First language: Other or believed to be other 1.43 2.04 1.81 White British 0.00 0.00 0.00 Irish 0.35 -0.18 -0.12 Traveller of Irish heritage -1.31 -2.86 -4.43 Gypsy Roma -2.50 -2.49 -2.91 Any other white background 1.24 0.83 1.06 White and Black Caribbean 0.17 -0.43 -0.36 White and Black African 0.65 0.04 0.50 White and Asian 0.81 0.75 0.73 Any other mixed background 0.85 0.35 0.52 Indian 1.67 3.06 2.78 Pakistani 1.80 2.18 2.19 Bangladeshi 2.17 2.75 2.97 Any other Asian background 2.08 3.60 3.59 Caribbean 1.16 0.95 0.85 Black African 2.95 3.02 3.21 Any other black background 0.83 0.28 0.73 Chinese 1.59 4.04 3.65 Any other ethnic group 1.86 2.47 2.56 Unclassified ethnic group -0.70 -1.00 -0.94 Key Stage 2 average point score of cohort 0.45 0.44 0.59 Key Stage 2 standard deviation in cohort -0.44 -0.64 -0.43 Var between schools (B) 3.99 5.38 6.88 Var within schools (W) 43.87 52.98 53.73
On our graphics (that follow), the constant is the horizontal axis so variables in blue (with a positive score in the model) improve a pupil’s chances and variables in white (with a negative score) decrease them. This clearly shows a strong negative correlation between income deprivation and (simple) value added for pupils

20
Learning to Succeed: understanding and addressing Key Stage 4 (GCSE) underachievement in Yorkshire and Humber
knowledge management for the information age
joining school in Year 10 and statemented pupils (pupils with a statement of Special Educational Needs). It also shows positive correlations for many BME groups. Interestingly it suggests that the variance within schools is greater than that between schools, suggesting that individual pupil characteristics are more important than the environment within the school, when allowing for other factors.

21
Learning to Succeed: understanding and addressing Key Stage 4 (GCSE) underachievement in Yorkshire and Humber
knowledge management for the information age
2005 Key Stage 2-4 English
15
16
17
18
19
20
21
22
23
24
25K
ey S
tage
2 fi
ne g
rade
ave
rage
poi
nts
scor
e
Key
Sta
ge 2
engl
ish -
Key
Sta
ge 2
ave
rage
poin
t sc
ore
fine
grad
es
Key
Sta
ge 2
mat
hs -
Key
Sta
ge 2
ave
rage
poin
t sc
ore
fine
grad
es
Qua
drat
ic o
f Key
Sta
ge 2
Ave
rage
Poi
nt
Scor
e
free
sch
ool m
eal -
no
free
sch
ool -
yes
In c
are
at c
urre
nt s
choo
l - n
o
In c
are
at c
urre
nt s
choo
l - y
es
Inco
me
Dep
rivat
ion
Affe
ctin
g C
hild
ren
Inde
x sc
ore
Non
-SEN
Scho
ol A
ctio
n
Act
ion+
/ St
atem
ent
pupi
l joi
ned
scho
ol a
fter
Sep
t Y
r 10
pupi
l joi
ned
scho
ol n
ot in
July
/Aug
/Sep
t
Yr
7- 9
Mal
e
Fem
ale
Age
(w
ithin
yea
r)
Firs
t la
ngua
ge: E
nglis
h or
bel
ieve
d to
be
Engl
ish
Firs
t la
ngua
ge: O
ther
or
belie
ved
to b
e
othe
r
Whi
te B
ritish
Irish
Tra
velle
r of
Irish
her
itage
Gyp
sy R
oma
Any
oth
er w
hite
bac
kgro
und
Whi
te a
nd B
lack
Car
ibbe
an
Whi
te a
nd B
lack
Afr
ican
Whi
te a
nd A
sian
Any
oth
er m
ixed
bac
kgro
und
Indi
an
Paki
stan
i
Bang
lade
shi
Any
oth
er A
sian
back
grou
nd
Car
ibbe
an
Blac
k A
fric
an
Any
oth
er b
lack
bac
kgro
und
Chi
nese
Any
oth
er e
thni
c gr
oup
Unc
lass
ified
eth
nic
grou
p
Val
ue
2005 Key Stage 2-4 Mathematics
6
7
8
9
10
11
12
13
14
15
16
17
18
19
Key
Sta
ge 2
fine
gra
de a
vera
ge p
oint
s
scor
e
Key
Sta
ge 2
engl
ish -
Key
Sta
ge 2
ave
rage
poin
t sc
ore
fine
grad
es
Key
Sta
ge 2
mat
hs -
Key
Sta
ge 2
ave
rage
poin
t sc
ore
fine
grad
es
Qua
drat
ic o
f Key
Sta
ge 2
Ave
rage
Poi
nt
Scor
e
free
sch
ool m
eal -
no
free
sch
ool -
yes
In c
are
at c
urre
nt s
choo
l - n
o
In c
are
at c
urre
nt s
choo
l - y
es
Inco
me
Dep
rivat
ion
Affe
ctin
g C
hild
ren
Inde
x sc
ore
Non
-SEN
Scho
ol A
ctio
n
Act
ion+
/ St
atem
ent
pupi
l joi
ned
scho
ol a
fter
Sep
t Y
r 10
pupi
l joi
ned
scho
ol n
ot in
July
/Aug
/Sep
t
Yr
7- 9
Mal
e
Fem
ale
Age
(w
ithin
yea
r)
Firs
t la
ngua
ge: E
nglis
h or
bel
ieve
d to
be
Engl
ish
Firs
t la
ngua
ge: O
ther
or
belie
ved
to b
e
othe
r
Whi
te B
ritish
Irish
Tra
velle
r of
Irish
her
itage
Gyp
sy R
oma
Any
oth
er w
hite
bac
kgro
und
Whi
te a
nd B
lack
Car
ibbe
an
Whi
te a
nd B
lack
Afr
ican
Whi
te a
nd A
sian
Any
oth
er m
ixed
bac
kgro
und
Indi
an
Paki
stan
i
Bang
lade
shi
Any
oth
er A
sian
back
grou
nd
Car
ibbe
an
Blac
k A
fric
an
Any
oth
er b
lack
bac
kgro
und
Chi
nese
Any
oth
er e
thni
c gr
oup
Unc
lass
ified
eth
nic
grou
p
Val
ue

22
Learning to Succeed: understanding and addressing Key Stage 4 (GCSE) underachievement in Yorkshire and Humber
knowledge management for the information age
2005 Key Stage 2-4 Science
10
11
12
13
14
15
16
17
18
19
20
21
22
23K
ey S
tage
2 fi
ne g
rade
ave
rage
poi
nts
scor
e
Key
Sta
ge 2
engl
ish -
Key
Sta
ge 2
ave
rage
poin
t sc
ore
fine
grad
es
Key
Sta
ge 2
mat
hs -
Key
Sta
ge 2
ave
rage
poin
t sc
ore
fine
grad
es
Qua
drat
ic o
f Key
Sta
ge 2
Ave
rage
Poi
nt
Scor
e
free
sch
ool m
eal -
no
free
sch
ool -
yes
In c
are
at c
urre
nt s
choo
l - n
o
In c
are
at c
urre
nt s
choo
l - y
es
Inco
me
Dep
rivat
ion
Affe
ctin
g C
hild
ren
Inde
x sc
ore
Non
-SEN
Scho
ol A
ctio
n
Act
ion+
/ St
atem
ent
pupi
l joi
ned
scho
ol a
fter
Sep
t Y
r 10
pupi
l joi
ned
scho
ol n
ot in
July
/Aug
/Sep
t
Yr
7- 9
Mal
e
Fem
ale
Age
(w
ithin
yea
r)
Firs
t la
ngua
ge: E
nglis
h or
bel
ieve
d to
be
Engl
ish
Firs
t la
ngua
ge: O
ther
or
belie
ved
to b
e
othe
r
Whi
te B
ritish
Irish
Tra
velle
r of
Irish
her
itage
Gyp
sy R
oma
Any
oth
er w
hite
bac
kgro
und
Whi
te a
nd B
lack
Car
ibbe
an
Whi
te a
nd B
lack
Afr
ican
Whi
te a
nd A
sian
Any
oth
er m
ixed
bac
kgro
und
Indi
an
Paki
stan
i
Bang
lade
shi
Any
oth
er A
sian
back
grou
nd
Car
ibbe
an
Blac
k A
fric
an
Any
oth
er b
lack
bac
kgro
und
Chi
nese
Any
oth
er e
thni
c gr
oup
Unc
lass
ified
eth
nic
grou
p
Val
ue

23
Learning to Succeed: understanding and addressing Key Stage 4 (GCSE) underachievement in Yorkshire and Humber
knowledge management for the information age
Our own analysis of CVA suggests that differences in CVA between schools are as likely to reflect those important variables not contained within PLASC, as the actual effect of the schools themselves. For example, PLASC does not contain any of the main variables that our study has identified as important (see Chapter 6), it is therefore, possible the differences in CVA simply reflect differences within these missing variables. Furthermore CVA points are capped, suggesting that there is some incongruity between the multi-level model and its application in calculating CVA (although this will reflect the synthetic nature of attainment data, this is itself capped). Interestingly Fischer Family Trust (2005:2) identify our main concern in their assessment of DfES’s and their own versions of CVA: “A school’s contextualised value added is the amount of KS4 achievement unexplained by the models: a school’s performance relative to other schools and to national norms may be affected by factors applicable nationally for which no data is available (or, at least, not included in the models) and by reasons sustainable locally.” Whatever its shortcomings are in attempting to show a fuller picture of the difference schools make to pupils than a league table based purely on results would, the CVA analysis does point to a number of variables that correlate to attainment at Key Stage 4 that (alongside others) warrant further investigation. Looking across the board for English, Maths and Science, those variables that appear to have the strongest positive correlation to good performance between Key Stages 2-4 are gender (girls do better) and ethnicity (those ethnic groups who are not White British, Gypsy Roma, Traveller of Irish Heritage or unclassified do better). Aside from the converse of the ethnic and gender-based correlations just noted, factors that are linked to typically poorer attainment include income deprivation and free school meals. These are considered in the next chapters, linked to other factors, which they are related to, or potentially expressions of.

24
Learning to Succeed: understanding and addressing Key Stage 4 (GCSE) underachievement in Yorkshire and Humber
knowledge management for the information age
4 School Level Factors affecting Attainment
Summary Considerable attention and debate is focused on the performance of schools and how well they serve their pupils’ needs. This is to be expected given the key role of schools within individuals’ lives and society, and the naturally high expectations for schools to make the biggest possible positive difference. Equally, factors such as class sizes, schools expenditures, discipline etc. are regularly in the media and political spotlight. However, despite this attention, in statistical terms, only 7% of differences in attainment can be explained by school level variables (in fact, it is around 7.3% of variance in the DCSF multi-level model). A higher, but still relatively low figure is produced if analysis is specifically on low achievement rather than attainment across the board. Cassen and Kingdon (2007) have shown that school level variables account for 14% of differences in low achievement. Overall, that suggests that whilst school level factors may not be the most important in raising attainment they can impact on under achievement. Equally, as with socio-economic variables, there are likely to be in-school factors that are not easily and/or adequately measured (e.g. quality and suitability of individual teachers) which may contribute to variation but are not included within the statistics that most modelling is based on. Given this position in this study we have considered and reported key available evidence on school factors, complemented by interviews within schools, and gone into further depth, especially statistically for the societal factors affecting attainment (see Chapter 5). Within schools, a number of factors spring to the fore. There is a universal belief that a school’s ethos has a major effect on attainment and whilst we were unable to define ethos strictly we were aware of its presence in a number of schools that we visited. A commonly (and popularly) held view is that leadership (or even mission statements) creates this ethos, however, we believe that it is more to do with the social mix (that is the mix of cultural norms, peer pressures, aspirations and labour market expectations) within a school, than how a school is managed. Nevertheless, we do recognise that leadership can be observed in some schools and that this has contributed towards their performance. When it does contribute towards high performance, it appears to be based on a belief in the whole child over and above targets and performance tables. However, in low attainment schools that are improving it involves a focus on targets and performance tables. This could be related to the management concept of the situational leader or even the concept of the collaborative leader which suggests that differing personalities can be the most appropriate leaders at certain times. There is also some evidence that performance can be enhanced by finding a curriculum and pedagogy that is suited to every child. Indeed those schools that have effectively abandoned the National Curriculum by using alternatives to GCSEs do appear to have raised the morale of their pupils and teachers. This needs to be balanced against the need to gain skills in key subjects such as English and Maths and to ensure what is learned is valued by employers. The opposite of finding a suitable curriculum and pedagogy is to label pupils as failures with limited

25
Learning to Succeed: understanding and addressing Key Stage 4 (GCSE) underachievement in Yorkshire and Humber
knowledge management for the information age
labour market chances. We are certain that such messages still reach young people and have a major negative effect on attainment. In fact, the availability of potentially unreliable data on predicted grades could increase labelling and stereotyping. Our belief is that when schools have a positive social mix, differences between attainment by school is largely due to normal variation, although there will of course be examples where demonstrable boosts in performance can be observed and linked to particular leaders, teachers or practices. However, when this social mix is negative the organisation of the school can determine the level of underattainment of its pupils.
Pedagogy and Teaching Quality
All headteachers in high attainment schools praised the quality of their teaching staff. It is also clear that an enthusiastic teacher with enlivened teaching can have a dramatic effect on pupils’ interest in the curriculum. We do not question this, simply the extent of this effect and the degree to which many teachers feel able to experiment with creative pedagogy within many of the Region’s schools. Furthermore, the emphasis placed on normative target setting and assessment has demoralised many teachers, taking away their enthusiasm for the subject and teaching that is so vital. We were acutely aware of the pressures on teachers (and headteachers) in many of the Region’s schools, but especially in core metropolitan areas. Indeed, if we asked a straw poll of adults to recall inspirational teachers a high proportion would describe mavericks. Unfortunately, recent educational policies and theories of learning and educational management are specifically designed to neuter or even eradicate such individualism. It is also clear to us that a teacher that is enthusiastic about their subject, finds creative ways of enlivening their lessons, and pitches at an appropriate level can have a dramatic effect on a young person’s life, let alone their academic achievement. It is our belief that despite the pressures on the role, good teaching is the norm rather than the exception, and that good teachers are found in all schools. What exactly constitutes a ‘good’ teacher is itself open to debate. There is a strong argument that like leadership, teaching is in part situational with some teachers thriving in an environment others would be unable to cope within. Likewise views of what is good or bad teaching may vary. Nevertheless, as within any profession, there will inevitably be a range of abilities and some teachers will excel more than others, even compared to those of a similar situational disposition. The proportion of such really excellent teachers who motivate and get the very best out of their pupils may well vary between schools. The extent to which individual pupils are exposed to the very best teachers is also likely to vary within a school, given simple logistics as much as anything. It is hence possible that teaching quality contributes to variability in attainment within as well as between schools. Unfortunately, OFSTED Inspection Reports have become of limited value in independently assessing the quality of teaching and pedagogy. This is because the inspectors now rely so heavily on RAISEonline and the school plans to address

26
Learning to Succeed: understanding and addressing Key Stage 4 (GCSE) underachievement in Yorkshire and Humber
knowledge management for the information age
issues identified by RAISEonline. We therefore, do not have an independent measure on the quality of teaching in schools in the Region. Overall, however, we cannot find any evidence to suggest that teaching quality is worse or better in the Region than in other regions. However, with so much of the Region being metropolitan and urban we cannot discount the effects of poorer teaching quality resulting from more prescriptive interpretations of what teachers should do in the classroom. Equally, the extent to which the teachers may be motivated to apply for teaching jobs in different school contexts is unclear. If for instance, there is more competition for teaching jobs in ‘good’ schools, often in more affluent neighbourhoods, than in schools that face bigger challenges in more deprived areas, laws of supply and demand would suggest that the former would find it easier to fill vacancies and recruit the most able teachers. Further research on this issue would be helpful, but if it is the case, it would further point to interrelationships between in-school and societal factors that affect attainment. Moreover, the cyclical forces that, unchallenged, can drive high attainment schools to becoming even more successful, could also make it even harder for low attainment schools to gain a good social mix and raise aspirations and results.
The National Curriculum As qualified teachers, we are frequently surprised by the lack of experimentation and creativity within our schools especially at Key Stage 4 and in part at least resulting from the importance of Performance Tables and the National Curriculum. “Two independent thoughts in one day, the children must be over stimulated.” Principal Skinner in the Simpsons Indeed, we believe that the National Curriculum is stifling creativity and individuality both amongst teachers and pupils. As one headteacher told us ‘there are no mavericks left in teaching’; even though most adults when questioned will point to the major influence maverick teachers had on their lives. Many teachers believe that the National Curriculum is particularly ill-suited to poorer performing pupils. Indeed one headteacher traced a range of social problems back to the lack of stimulation less able (or less engaged) pupils got from the curriculum. “The curriculum is a bit dull.” Headteacher in High Attainment School “You’ve got to make teaching fun.” Pupil in High Attainment School Pupils at a high attainment school identified that an uninteresting curriculum had led to behavioural problems in their primary schools. “Our school allowed anyone in and tried to teach us more about behaviour than the subjects.” Pupil in High Attainment School “I didn’t have any friends in my Primary, they called me a ‘swot’.” Pupil in High Attainment School “We don’t have behavioural problems.” Headteacher at High Attainment School
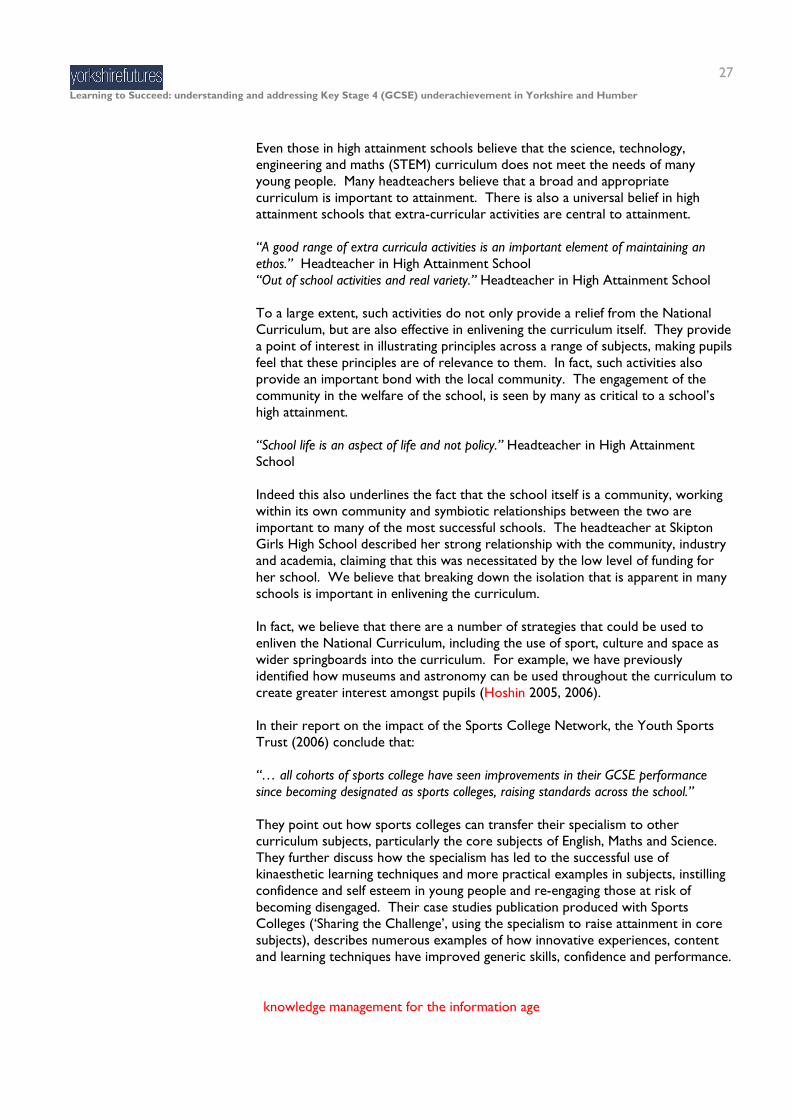
27
Learning to Succeed: understanding and addressing Key Stage 4 (GCSE) underachievement in Yorkshire and Humber
knowledge management for the information age
Even those in high attainment schools believe that the science, technology, engineering and maths (STEM) curriculum does not meet the needs of many young people. Many headteachers believe that a broad and appropriate curriculum is important to attainment. There is also a universal belief in high attainment schools that extra-curricular activities are central to attainment. “A good range of extra curricula activities is an important element of maintaining an ethos.” Headteacher in High Attainment School “Out of school activities and real variety.” Headteacher in High Attainment School To a large extent, such activities do not only provide a relief from the National Curriculum, but are also effective in enlivening the curriculum itself. They provide a point of interest in illustrating principles across a range of subjects, making pupils feel that these principles are of relevance to them. In fact, such activities also provide an important bond with the local community. The engagement of the community in the welfare of the school, is seen by many as critical to a school’s high attainment. “School life is an aspect of life and not policy.” Headteacher in High Attainment School Indeed this also underlines the fact that the school itself is a community, working within its own community and symbiotic relationships between the two are important to many of the most successful schools. The headteacher at Skipton Girls High School described her strong relationship with the community, industry and academia, claiming that this was necessitated by the low level of funding for her school. We believe that breaking down the isolation that is apparent in many schools is important in enlivening the curriculum. In fact, we believe that there are a number of strategies that could be used to enliven the National Curriculum, including the use of sport, culture and space as wider springboards into the curriculum. For example, we have previously identified how museums and astronomy can be used throughout the curriculum to create greater interest amongst pupils (Hoshin 2005, 2006). In their report on the impact of the Sports College Network, the Youth Sports Trust (2006) conclude that: “… all cohorts of sports college have seen improvements in their GCSE performance since becoming designated as sports colleges, raising standards across the school.” They point out how sports colleges can transfer their specialism to other curriculum subjects, particularly the core subjects of English, Maths and Science. They further discuss how the specialism has led to the successful use of kinaesthetic learning techniques and more practical examples in subjects, instilling confidence and self esteem in young people and re-engaging those at risk of becoming disengaged. Their case studies publication produced with Sports Colleges (‘Sharing the Challenge’, using the specialism to raise attainment in core subjects), describes numerous examples of how innovative experiences, content and learning techniques have improved generic skills, confidence and performance.

28
Learning to Succeed: understanding and addressing Key Stage 4 (GCSE) underachievement in Yorkshire and Humber
knowledge management for the information age
Given this analysis, the recently announced (July 2007) move to reduce the extent of the National Curriculum to allow room for other areas of teaching and subjects that engage pupils should be a positive development. There may also be benefit in highlighting examples of how teachers have enlivened topics within the national curriculum to bring subjects to life and motivate reluctant learners. Anything that makes this easier for teachers within the context of an exacting role, whether professional development, supportive messages or exchange of good practice between schools and teachers, is likely to have a positive influence.
Alternative Curricula
We have used the term alternative curricula to describe a range of non-GCSE qualifications that are becoming increasingly popular within our schools. Most are vocational in their nature and are traditionally seen to be more suited to less able pupils and in enlivening the curriculum. Our concern is that rarely do such qualifications match the requirements of employers in the industries they appear to be concerned with and that often there is only limited local employment in these industries. Nevertheless, we do feel that the alternative curricula offers a true alternative to over-prescriptive GCSEs within the National Curriculum and therefore have chosen to describe all non-GCSE qualifications as ‘alternative curricula’. Interestingly despite our scepticism about the suitability of non-GCSE qualifications for many pupils, we noted that many of those school that had improved their performance by the use of alternative curricula, had also increased attainment in real terms. This could simply be related to a greater emphasis on targets, but we believe it also relates to the motivational factors of introducing more suitable subjects and qualifications within a school that is deemed to be underperforming. In addition, by improving a school’s position within the performance tables it will start to recruit more able pupils, completing a virtuous circle. “Assessment for Learning: children become responsible for their own learning.” Headteacher describing a Feature of their School’s Exemplary Attainment This emphasis on targets and selection of qualifications suited to pupils (see Chapter 6 for an analysis of the use of alternative curricula by region), would go some way to explaining the superior attainment of schools in the North East region compared to those in Yorkshire and Humber. That reflects greater use of alternative curricula in the North East. Some pupils passing these may have otherwise gained 5 good GCSEs per se, but gain qualifications ‘equivalent’ to that through an alternative route. The fact that the gap between the two regions is far less pronounced when pupils gaining 5 good GCSEs including English and Maths is used as the basis for comparison would add further weight to this potential explanation, as following alternative curricula will not always include GCSE English and Maths. The debate about the merits of this approach is complex with both pros and cons, and it needs to be carefully and flexibly thought through depending upon the circumstances of a school and its pupils. By using alternative qualifications schools are able to escape from the National Curriculum, which evidence suggests is disaffecting pupils across all ability levels,

29
Learning to Succeed: understanding and addressing Key Stage 4 (GCSE) underachievement in Yorkshire and Humber
knowledge management for the information age
but especially those of lower ability. In fact, our visit to The Ridings, in Halifax, showed that many young people had not been entered for qualifications that counted towards their position in the School Performance Tables. Achieving some success, albeit small was the new headteacher’s priority. Nevertheless, we remain sceptical that such qualifications are providing pupils with a suitable academic grounding for employment in our globalised economy, or further education, and doubt their attractiveness and even suitability to many modern employers, even in relatively low skilled industries. Ideally, we would like to see the introduction of greater flexibility within GCSEs in much the same way as there was within Mode C CSEs. Certainly, the new vocational GCSEs may offer some flexibility and should be welcomed. We also feel that negative labelling could be an important factor and target setting and alternative curricula are clearly a part of raising aspirations.
School Leadership
Some commentators identified leadership as an important factor in raising attainment. “I worked with a school in Special Measures to get sustained improvement over the years.” Advisor in Low Attainment LEA Indeed some policy advisors to the DCSF itself appear now to see school leadership as a panacea to low attainment. “… good leadership has a significant impact on both pupils academic and non-academic outcomes. In other words, good leadership and management leads to good teaching and learning which in turn lead to higher standards for all pupils.” Price Waterhouse Coopers (2007). Although much of the popular debate on performance is linked to a concept of leadership, we were unable to find consensus on the nature of this leadership. However, we could identify that some headteachers had a sense of purpose that arose from their firmly held belief in the nature of education. This often included a focus on the whole child, a disregard for the performance tables and a disregard for the latest trends in education. “I didn’t focus on passing the exam but on the children.” Headteacher from High Attaining School In fact, from high performing schools and LEAs we were told that leadership was about ignoring most of the policies, directives and support that come from DCSF. Indeed a good LEA is seen as one that shields schools from the Department. “They appear to filter the information before it gets to you.” Headteacher of High Attaining School Describing a High Performing LEA My most important piece of equipment is my bin.” Headteacher in a Metropolitan Comprehensive

30
Learning to Succeed: understanding and addressing Key Stage 4 (GCSE) underachievement in Yorkshire and Humber
knowledge management for the information age
This said, for poorly performing schools, LEA support may be fundamental to their improvement (we are unclear if this extends to all schools performing below the Floor Targets as DCSF currently suggests). Such different features of leadership are consistent with a situational or even collaborative leadership theory.
Target Setting and Motivation We were struck by the degree to which performance tables and target setting are central to modern school management. All schools we visited make extensive use of predicted grades (via either RAISEonline, Fischer Family Trust data, or variations supplied by their LEAs) and a pupil’s progress towards their predicted grades. Indeed, in some schools this appears to have become synonymous with management if not leadership. “Headteachers are under significant pressure, the system adapts to meet the need of the political masters.” Headteacher in High Attainment School “It feels like they’re going to get you anyway.” Headteacher in Exemplary School describing CVA “It’s because of the league table… It’s just to evaluate pupils.” Pupil Although we are clear that such data and management of performance is important to all schools and particularly in raising the attainment of low attainment schools, it is used with caution in moderate and high attainment schools. In high attainment schools, such data was used to identify the most appropriate pedagogy for each pupil and to support wider issues of education, including out of school activities. However, in some of the poorest attaining LEAs, headteachers complained that they were faced with a regime of target setting that was counter productive to the education of their pupils. East Yorkshire LEA provided schools with additional funds to raise attainment in ways that were appropriate to their school and designed by their school. Judging by the LEAs impressive rise in attainment this appears to have worked much better than providing schools with panaceas. Like finding the appropriate curriculum for each pupil, each school needs to respond appropriately to each pupil and each LEA to each school. In fact, this is consistent with the management theories of situational or even collaborative leadership. Although schools in London have also improved their performance as a result of additional resources (Excellence in Cities). In conclusion, a statistician arguing against the collection and analysis of data is like turkeys arguing in favour of Christmas. Nevertheless it is our belief that data should be used to inform and not as an end in itself. Indeed we find that the CVA model and predicted grades to be too unreliable to be used as extensively as they are. A part of the reason for this is that they are made available in a software package (RAISEonline) which has the veneer of reliability. Overall, we feel that Key Stage 2 English raw scores could be used by schools as a baseline to assess pupil’s progress. However, average scores and CVA are rough instruments that are subject to normal variations. Using them as daily performance indicators is asking too much of the statistics themselves.
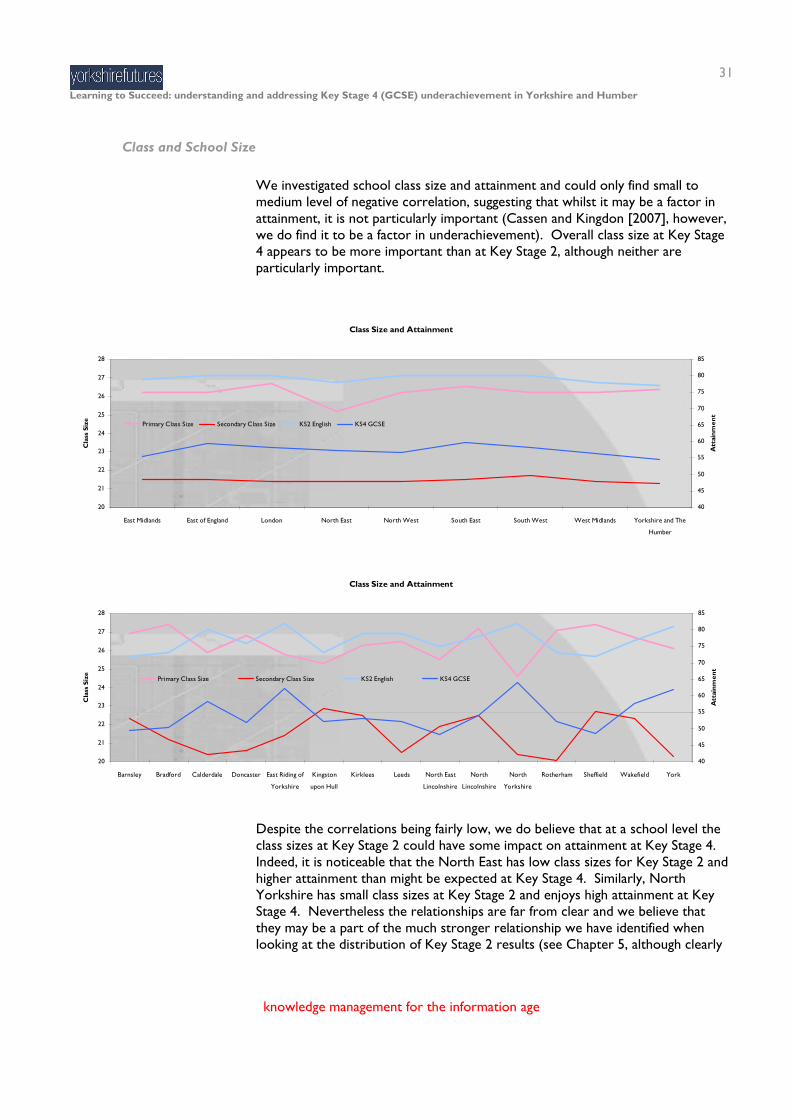
31
Learning to Succeed: understanding and addressing Key Stage 4 (GCSE) underachievement in Yorkshire and Humber
knowledge management for the information age
Class and School Size
We investigated school class size and attainment and could only find small to medium level of negative correlation, suggesting that whilst it may be a factor in attainment, it is not particularly important (Cassen and Kingdon [2007], however, we do find it to be a factor in underachievement). Overall class size at Key Stage 4 appears to be more important than at Key Stage 2, although neither are particularly important.
Class Size and Attainment
20
21
22
23
24
25
26
27
28
East Midlands East of England London North East North West South East South West West Midlands Yorkshire and The
Humber
Cla
ss S
ize
40
45
50
55
60
65
70
75
80
85
Att
ainm
ent
Primary Class Size Secondary Class Size KS2 English KS4 GCSE
Class Size and Attainment
20
21
22
23
24
25
26
27
28
Barnsley Bradford Calderdale Doncaster East Riding of
Yorkshire
Kingston
upon Hull
Kirklees Leeds North East
Lincolnshire
North
Lincolnshire
North
Yorkshire
Rotherham Sheffield Wakefield York
Cla
ss S
ize
40
45
50
55
60
65
70
75
80
85
Att
ainm
ent
Primary Class Size Secondary Class Size KS2 English KS4 GCSE
Despite the correlations being fairly low, we do believe that at a school level the class sizes at Key Stage 2 could have some impact on attainment at Key Stage 4. Indeed, it is noticeable that the North East has low class sizes for Key Stage 2 and higher attainment than might be expected at Key Stage 4. Similarly, North Yorkshire has small class sizes at Key Stage 2 and enjoys high attainment at Key Stage 4. Nevertheless the relationships are far from clear and we believe that they may be a part of the much stronger relationship we have identified when looking at the distribution of Key Stage 2 results (see Chapter 5, although clearly

32
Learning to Succeed: understanding and addressing Key Stage 4 (GCSE) underachievement in Yorkshire and Humber
knowledge management for the information age
not directly related to the social segregation that we believe to be the main factor behind this distribution). Another feature of education that is difficult to disentangle from other features is that of school size. A number of academics and educationalists argued that larger schools led to higher attainment because they could offer a broader curriculum with more specialist teachers. The problem in assessing this is that larger schools tend to be in lower attaining urban areas. In addition, we are aware of negative factors around community and manageability beginning to outweigh the economies of scale. Nevertheless the more schools can work together to offer a broad curriculum that is appropriate to all pupils the more motivated we believe their pupils will be.
School Resources During our visit to East Riding, our attention was drawn to the fact that they have amongst the lowest spending per capita on pupils (only the City of York has lower) and amongst the highest attainment. We were also made aware that Skipton Girls High Schools had the lowest spending per pupil, yet the highest attainment in the Region. We believed these to be a casual relationship, however, when we investigated this across all LEAs we find that there is an inverse relationship between spending on education and attainment. This relationship is not so strong as to form a part of our model, but the negative correlations occur at both Key Stage 2 and Key Stage 4.
Funding and Attainment
0
1,000
2,000
3,000
4,000
5,000
6,000
East Midlands East of England London North East North West South East South West West Midlands Yorkshire and The
Humber
£/pu
pil
40
45
50
55
60
65
70
75
80
85
Att
ainm
ent
Funding/Pupil £ KS2 English KS4 GCSE

33
Learning to Succeed: understanding and addressing Key Stage 4 (GCSE) underachievement in Yorkshire and Humber
knowledge management for the information age
Funding and Attainment
0
500
1,000
1,500
2,000
2,500
3,000
3,500
4,000
4,500
5,000
Barnsley Bradford Calderdale Doncaster East Riding of
Yorkshire
Kingston
upon Hull
Kirklees Leeds North East
Lincolnshire
North
Lincolnshire
North
Yorkshire
Rotherham Sheffield Wakefield York
£/P
upil
40
45
50
55
60
65
70
75
80
85
Att
ainm
ent
Funding/Pupil £ KS2 English KS4 GCSE
Overall, the data is skewed by the additional funding (Excellence in Cities) that London LEAs have received over recent years (the funding was targeted at improving attainment and certainly appears to have worked during this experiment). However, if we take London out of our correlations they then become even more negative (r = -0.63 for Key Stage 2 and r = -0.47 for Key Stage 4, p<0.001; p values relate to the significance of the correlation, a p value of <0.01 is significant and of <0.001 is highly significant). In short, there is a real negative relationship between funding and attainment. There are, of course many reasons why poorly performing LEAs should receive additional funding, including the need to raise attainment and social disadvantage within their schools. Therefore, we are certainly not suggesting in itself any causal relationship between higher funding per pupil and lower performance. However, there could be factors indirectly associated with higher levels of funding in some LEAs, which may have negative impact. For instance, we cannot rule out the negative effects an overly prescriptive LEA has on morale within its schools, especially given that we were told this in a number of metropolitan (high spend) authorities. Indeed, spending per pupil is very slightly negatively correlated to class size! This suggests that at least a proportion of higher spending in significant numbers of schools could be on administration or capital costs rather than teaching. Cassen and Kingdon (2007) did not find the same negative relationship when looking at underachievement and believe that additional resources, when spent on the pupil can effectively target underachievement. This probably explains the contradictory nature of our findings related to London and the East Riding of Yorkshire, in that extra resources per se do not raise attainment, but when targeted can be used to reduce underachievement, or if wisely and flexibly applied, to raise attainment.
The Ethos An ethos of attainment was evident in all of the high performance schools we visited and their headteachers were quick to identify with this ethos. “It’s down to the environment.” Pupil in High Attainment School “Ethos is self-fulfilling.” Headteacher in High Attainment School

34
Learning to Succeed: understanding and addressing Key Stage 4 (GCSE) underachievement in Yorkshire and Humber
knowledge management for the information age
“The pupils have a strong work ethic.” Pupil in High Attainment School “The teachers here aren’t trying to control the class, they just teach.” Pupil in High Attainment School “Early intervention is important.” Headteacher in High Attainment School “Children and staff respect each other.” Headteacher in High Attainment School Tanner, Jones and Treadaway (1999) report an almost identical experience when they visited high attainment schools. “In nearly all the schools visited the ethos of the school was judged to be a significant factor in accounting for its success. Heads reported consistently that they were proud of their staff, their hard work, dedication, and commitment to the school. In nearly all cases, the physical environment was very well cared for - sometimes in very difficult circumstances. Heads and teachers talked about the messages sent to children by their environment.” Nevertheless this ethos tended to express itself through a sense of purpose rather than target chasing, which high performance schools felt to be counter productive. “To get that extra element out of the results is counter-productive.” Headteacher in High Attainment School However, in low attainment schools a focus on targets and attainment data could be fundamental to their ethos. To a large extent our measures of social segregation and the distribution (we’ve measured this by Kurtoisness, which is a statistical measure of distribution around a mean, the more evenly spread and closer to the mean and the higher the Kurtoisness) of prior attainment are a statistical attempt to uncover the rather nebulous concept of ethos, interestingly many headteachers understood this, when we explained it to them (see Chapter 5). We therefore, believe that a school’s ethos is more a product of the pupils at the school than leadership or the teaching staff, although, a well resourced school with enthusiastic teachers certainly contributes towards this ethos. Our definition of ethos would therefore, be the balance of positively engaged pupils with those who are not.
Labelling and Motivation We cannot rule out the effects on attainment of negatively labelling pupils. Indeed, such effects would appear to be central to our thesis that if social segregation is a major component of attainment, then it should be apparent that those young people attending schools with a high proportion of pupils from manual working families may have already experienced the effects of conscious or unconscious labelling (although we have to recognise that such labelling is also more likely for pupils for workless families). Furthermore, during the public debate prior to the introduction of comprehensive schooling, a major argument against the selective system was the labelling of those who failed the 11 plus. It is therefore, important for schools to reinforce the positive labour market opportunities that now exist in almost every LEA in England (not to mention ever

35
Learning to Succeed: understanding and addressing Key Stage 4 (GCSE) underachievement in Yorkshire and Humber
knowledge management for the information age
widening further and higher education opportunities) and to encourage pupils for their efforts. “Our [primary] school didn’t teach you to pass for the Grammar.” Pupil in High Attainment School In fact, as a part of other studies Hoshin have undertaken, we have been aware that some schools and teachers appear unaware of the opportunities that exist for their pupils, believing that their local labour market has changed little since the mass unemployment of the 1970s and 1980s. These are particularly acute in areas where there is a tradition of employment in heavy industries (including many of the Region’s LEAs), and manifest themselves in the belief that there are few, if any opportunities, for young people to pursue careers in engineering or other local career options demanding good qualifications and skills . Such notions can only reinforce pupils mis-led belief that there are few opportunities for them and therefore that attainment is irrelevant. To a large extent, this concept of labelling is the opposite to many people’s concept of le adership. It can also be argued that a different kind of labelling, often unconscious and cultural in nature, is also likely to take place within homes and communities, as the attitudes of parents and peers are likely to influence the extent to which children see learning and education as something that is important and for them (chapter 5 explores this further). Given this, whilst any negative labelling within school will simply make matters worse, it is likely that more than a simply laissez fair attitude is necessary. Pupils, especially boys from disadvantaged and working class backgrounds, need to be positively encouraged about the value of learning and their own academic potential in order to counteract the doubts or negative perceptions they may already hold. Unfortunately, we believe that the opportunities for labelling and stereotyping have increased with the release of predicted grades. This is of particular concern when we have found them to be potentially unreliable.
Improvement Factors Despite the numerous observations (often popularly upheld) regarding the impact of schools on attainment, many commentators believe that schools actually have only limited impact on a pupil’s attainment (Taylor and Nguyen 2006). Indeed the various multi-level models of PLASC have established that the level of variance within a school is much more significant than that between schools (which only accounts for around 7% of the variance). Nevertheless, we have concluded that some school level factors are likely to be influencing Yorkshire and Humber’s apparent underperformance at Key Stage 4, especially in relation to the North East region. Perhaps, unsurprisingly some teachers in the higher attaining schools pointed to school level issues as being the reason for their higher attainment (albeit not as commonly or strongly as DCSF strategy would imply). Whilst at lower attaining schools the effects of deprivation were seen as critical to attainment. All headteachers we spoke to believed that good teachers trained in their subject were critical to high attainment.

36
Learning to Succeed: understanding and addressing Key Stage 4 (GCSE) underachievement in Yorkshire and Humber
knowledge management for the information age
“Every member of the team makes an impact.” Headteacher in High Attainment School “It’s the good teachers that make the difference.” Headteacher in High Attainment School “Staff are the key to attainment.” Headteacher in High Attainment School Indeed many headteachers in high attaining schools were critical of the ‘cult of the leader’, emphasising team effort and often describing a situational leader, whereby different headteachers were suited to different situations. An example being when one headteacher in a high attainment school described the need for collaboration with other schools, parents and the community in general. “There has to be a vision that’s not just us, us, us.” Based on interviews with teachers and headteachers Gray et al (1999) attempted to quantify their views on the effects of various measures being used in schools to improve attainment:

37
Learning to Succeed: understanding and addressing Key Stage 4 (GCSE) underachievement in Yorkshire and Humber
knowledge management for the information age
Area of Change Mean Change Over
Past 5 Years (scale of 0 to 3)
Number of Schools Where a Lot (or Exceptional Amount) of Change had Occurred (from a study of 12)
Mission and Ethos Nature of School Mission 1.3 5 Rewards, Recognition and Sanctions for Pupils
1.6 7
Responsibilities Given to Pupils 1.4 5 Involvement of Parents in School’s Activities
1.7 9
Building of Relationships with External Group (feeder school, industry, local media, etc)
1.4 4
Appearance of School Environment 1.3 4 Focus on Achievement Strategies for Maximising Exam Grades 1.3 7 Structure and Content of Curriculum (timetable, length of day, etc)
1.2 3
Provision of Extra-Curricula Activities 0.9 1 Policies for Teaching and Learning (codes of conduct, homework, etc)
1.5 6
Learning Environment and Resources 1.3 4 Processes of Teaching and Learning (classroom management, teaching methods, etc)
1.1 3
Planning and Management Management Style of the SMT 1.7 9 Structure of the SMT 1.7 7 Arrangements for Consensual/Participative Management and Planning
1.6 6
Development Strategies for Individual Departments/Faculties
1.2 3
Structure of Middle Management 1.0 5 Integration of Academic and Pastoral Responsibilities
1.2 4
Involvement of External Support (LEA, external partners, etc)
1.3 6
Interestingly teachers themselves did not see extra curricula activities as being important, despite this being paramount to the headteachers in the high attainment schools we visited. Taylor and Nguyten (2006) have also identified that schools with a high proportion of part-time staff, have higher levels of attainment. They also found that the level of subject specialisation available had a positive effect on attainment (although this finding appears to be based on the attainment of specialist schools and not a broad curriculum). As we have not been able to corroborate these findings statistically we have omitted them from our recommendations, but nevertheless believe that they could be very important findings. Certainly, the level of subject specialisation is consistent with our recommendation that schools

38
Learning to Succeed: understanding and addressing Key Stage 4 (GCSE) underachievement in Yorkshire and Humber
knowledge management for the information age
should strive to find a curriculum that is appropriate to all pupils. Furthermore, a number of headteachers in high attainment schools suggested that a broad curriculum was important to attainment. Despite these findings, our own statistical analysis would suggest that the following areas of change are most important in improving attainment in low attainment schools (although not necessarily in improving educational standards): • Strategies for Maximising Exam Grades; • Structure and Content of Curriculum (timetable, length of day, etc). Although our opinion is that for most schools the following are more important: • Responsibilities Given to Pupils; • Involvement of Parents in School’s Activities; • Structure and Content of Curriculum (timetable, length of day, etc); • Provision of Extra-Curricula Activities; • Integration of Academic and Pastoral Responsibilities.
We of course would add to these the importance of positive labelling and the appropriateness of the curriculum.
Raising Attainment in Under-Performing Areas The former coalfields have been a particular area of concern in the Region, and indeed in all regions where they exist. It is generally accepted that low levels of attainment are a consequence of the existence of relatively well-paid jobs that required limited skills. Since the closure of the mines, some areas have begun to improve and this has been the subject of numerous investigations (Harris et al 2003). Specific strategies (Harris et al 2003) have been recommended to improve attainment, these include: • An emphasis on raising literacy and numeracy levels; • The establishment of special pupil groupings; • A commitment to data gathering and target setting; • The use of learning mentors; • Securing forms of professional support and development that impact directly
on classroom practice. These recommendations broadly concur with our own findings on raising attainment in poor performing schools and areas. However, given that we believe that the impact of perceptions of the labour market on attainment is at least as great as the extent to which employment is determined by skills in an area, we see them as marginal to changing the overall position of Yorkshire and Humber. Indeed, within former coalmining areas we are beginning to see attainment improving as the labour market starts once more to increase. Interestingly the lag in attainment improvements coincides almost directly with how the effects of changing labour markets would affect the attitudes of cohorts through the school system.

39
Learning to Succeed: understanding and addressing Key Stage 4 (GCSE) underachievement in Yorkshire and Humber
knowledge management for the information age
The Effects of Selection
The factors that determine which children go to which schools are in part social (e.g. how far parents try to and are able to get their children into desirable schools) and part about school and educational systems – in particular how and whether schools select their pupils. Hence, in many ways, the issue of selection relates both to this chapter on in-school variables and Chapter 5 on societal factors. It should be apparent that the level of selection within a school system will affect the attainment at a school level. Nevertheless, based on our analysis it is also has an affect on the overall attainment within the system and therefore on value added. With only 4% of schools in England being Grammar Schools we have not directly controlled for selection within our analysis (not withstanding the current political debate on their perceived effectiveness), and have preferred to focus on selection and quasi selection, through school catchments and increasing parental choice. Systems with low levels of selection tend to have smaller differences in attainment between pupils than those with high levels of selection (Jesson 2000). “The paper finds no evidence for the superiority of either grammar schools nor selective systems of educational provision; indeed any advantages appear to lie with those schools and systems organised on non-selective lines.” Furthermore, there is some comparative evidence that selection leads to lower levels of attainment within the system as a whole. “Systems with more differentiation lead to greater gaps in attainment between social groups. Finland, for example, has a high average reading score, a small gap between high and low achievers, comprehensive schools and a policy of free choice. Germany, on the other hand, has a much lower average reading score, a large difference between high and low attainers, and a tiered system of selective schooling. The UK is currently still in a reasonable comparative position, with a high average reading score, below average differences between high and low attainers, and comprehensive schools with a policy of (limited) choice.” Gorard and Smith (2004) Despite these findings there is some (albeit rather limited and inconclusive) evidence that inclusion of pupils with Special Educational Needs (SEN) results in lower attainment for mainstream and SEN pupils (Dyson et al 2004) at a school level. In addition, Taylor and Nguyen (2006) argue that girls perform better in girl only schools and boys better in mixed schools, although they do not comment on the overall effects of single sex schools across all pupils within the system. Furthermore, Schagen and Schagen (2001) argue rather unconvincingly that selection actually improves attainment (indeed most studies fail to identify the important socio-demographic differences between areas with Grammar Schools and those without). Not withstanding these arguments, we can see merit in diversity and a real benefit in encouraging a degree of independence. In addition, there is only one LEA in the Region where we believe that direct selection could be adversely affecting overall attainment. We therefore, hypothesise that the effects of selection on average attainment vary by area. In all probability this variation is related to the social mix and social

40
Learning to Succeed: understanding and addressing Key Stage 4 (GCSE) underachievement in Yorkshire and Humber
knowledge management for the information age
segregation that we have identified as being important factors in attainment (see Chapter 5). In Chapter 6, we explore the issue in further depth and look at a number of measures to understand the effects of selection and quasi-selection through social segregation. These include constructing a Dissimilarity Index using the difference between social grades A and B and social grade D. In addition, we measured the Kurtoisness (or narrowness) of the distribution of attainment, by school, at Key Stage 2 and 4.

41
Learning to Succeed: understanding and addressing Key Stage 4 (GCSE) underachievement in Yorkshire and Humber
knowledge management for the information age
5 Societal Factors affecting Attainment
Summary
Looking at influences on individuals affecting the Region’s attainment, we have rejected a number of important explanatory factors (such as ethnicity and gender) because whilst they are important variables, we do not believe that they would help to explain, differences between Yorkshire and Humber and other regions. That said there might be some interplay between ethnicity and gender and variables that do vary more within the region, such as social background and segregation. We have found it difficult to disaggregate data relating to deprivation, social class and perceptions of labour market opportunities and they all appear to influence attainment. However, there are a number of indications that social class and/or perceptions of labour market opportunities are more important than deprivation in explaining the Region’s underperformance. We believe that the reasons for this underperformance are likely to involve the complex interaction of a number of factors and therefore cannot be explained by single variables. However, those related to social grade and the perceptions of labour markets appear to be the most useful in predicting future attainment. The following sections discuss a wide range of factors that might in theory affect attainment and highlight any key evidence or outline findings. Chapter 6 goes on to investigate the key ones that emerge in more depth.
Age within School Year There are marked differences in attainment depending upon the age of a pupil within their school year that extend to Key Stage 4 (r = -0.98 in the DCSF multi-level model4). Although this could be important in explaining the results for individual pupils and casts some doubts on our approach to educational assessment, we do not believe that this factor could explain the Region’s underattainment.
Movement between Schools
The DCSF’s multi-level modelling of PLASC shows a negative correlation for pupils that have joined a school in Year 10 (-3.93 for the difference between Key Stage 2 English and Key Stage 4 and even higher in Maths [-4.39] and Science [-5.43]), which reduces to -1.49 (for English) for those joining in Years 7-9. It is also the case that Roma (-2.50) and Irish Traveller (-1.31) pupils suffer from particularly low levels of attainment. We can therefore conclude that movements between schools has a disruptive effect on attainment. Given that movements are more likely in core urban areas than rural (reflecting the degree to which some urban communities are transitory) this partially explains the lower level of attainment within some inner city areas. During our visits we
4 Unlike a regression model, the values are not distributed between 1 and -1, although the same inferences can be made.

42
Learning to Succeed: understanding and addressing Key Stage 4 (GCSE) underachievement in Yorkshire and Humber
knowledge management for the information age
were also alerted to the high levels of movement to and from coastal towns (such as Bridlington, Scarborough and Withensea), that may explain some of the lower attainment recorded in some of the Region’s resorts. However, our analysis of attainment using the government’s own rural/urban index was inconclusive, meaning that whilst we may be correct that movement has a negative effect on attainment, simple urban-rural indices are not discriminatory enough to identify more transient communities. Certainly, Cassen and Kingdon (2007) found that low attainment was concentrated in urban areas, including Barnsley, Bradford, Hull and Sheffield. We also believe that the presence of middle schools in Kirklees could be depressing their results at Key Stage 4. Although this is difficult to prove, it is apparent that Kirklees performs much better at post-16 than its Key Stage 4 results would indicate. Nevertheless we find it difficult (but not impossible) to suggest that middle schools result in poor performance at Key Stage 4 in the Craven District of North Yorkshire.
Gender
Although females outperform males and this is a major contribution towards variation in value added (2.31, indeed females outperform males in most other countries), we do not believe that this could explain the Region’s underachievement, we have therefore, not included gender in our main statistical tests (interestingly Gorard and Smith [2004] found that it could only explain less than one percent of differences in attainment). Cassen and Kingdon (2007) identified major gender differences when looking at low achievement, arguing that gender differences in early reading manifest themselves in attainment differences later on. “There do appear to be particular boy problems with reading. The gender aspect of reading ‘resistance’ is frequently commented on. There is still evidence that the particular needs of boys are not being attended to universally. They may develop later than girls, and also have a number of issues about reading to do with masculinity, or behavioural problems such as shortness of attention span.” An interesting hypothesis that we have related to gender, which supports our overall findings, is that a part of the higher attainment of females is in response to their disadvantage within the labour market – whether historic or in the context of women still being less prevalent in senior positions. Furthermore, the importance of social class and background as a variable (identified later in the chapter) in all likelihood links to cultural norms, peer pressures and aspirations. The nature of these is likely to vary between males and females, for instance in terms of any lingering perceptions of what is a ‘proper’ job for a man or a woman, or whether learning and academic attainment is something that is admired, accepted, or sneered at by friends.
Ethnicity Recent reports in the national press have focused on the low attainment of boys from certain BME groups (although in the most recent report on low achievement by Cassen and Kingdon [2007], white males are singled out). However, when

43
Learning to Succeed: understanding and addressing Key Stage 4 (GCSE) underachievement in Yorkshire and Humber
knowledge management for the information age
controlling for other factors such as social class, such underattainment is much less apparent. Indeed when looking at overall attainment (and not simply value added, especially at Key Stage 4) there now exists a significant body of research (Ashrad et al 2004, Wilson, Burgess and Briggs 2005) to show that all BMEs outperform their white counterparts (indeed white pupils are given a coefficient of 0.00 in the DCSF multi-level model) when allowances are made for other factors, such as social class and deprivation. As with Yorkshire Futures’ initial analysis of attainment that led to this study (2006), we have previously identified pupils of mixed race experiencing difficulties in their secondary schools (although they have a small positive correlation within the DCSF’s multi-level model) and believe that they should be treated as a separate ethnic group. In addition, despite being counter intuitive there is also significant evidence that pupils for whom English is not their first language outperform those for whom it is (Bhattacharyya and Blair 2003; 1.43 within the DCSF multi-level model). To a large extent this reflects their under attainment at Key Stage 2 and the degree to which they catch up by Key Stage 4. Nevertheless, the DCSF model goes further than this and shows that those with English as another language outperform native speakers at Key Stage 4. “The problem is with the white working class.” Advisor in Low Attaining LEA The various multi-level modelling studies based on PLASC show that all BME groups outperform white groups with the exception of Irish travellers (-1.31) and Roma (-2.50) and those with unclassified ethnic data. Although Ray (2006) also found that, those of mixed white and black Caribbean origin also under performed (-1.25 between Key Stage 2 average and Key Stage 4). As ethnicity is unlikely to be an explanatory factor in Yorkshire and Humber’s underachievement, we have not included ethnicity in our main investigation.
Parents’ Education
“Contrary to popular belief, young people do listen to their parents, stating them as their top role models and as a major source of information and advice on how they can best shape their futures.” Newby et al (2007) Although parental influence (as measured by highest qualifications held) must be an important factor in pupil attainment we were unable to find a very strong correlation between the highest qualifications held within the Lower Super Output Area of the pupil and their attainment at Key Stage 45. Surprisingly, the relationship was nothing like as strong for areas where a high proportion of residents had Level 4 and 5 qualifications (r = 0.11 [p<0.001]), than it was negatively for areas where a high proportion of residents had no qualifications. This is consistent with Cassen and Kingdon’s [2007] findings on parental education and low attainment which also cites DfES survey data which shows that in 2003, 68% of the children of ‘professional’ parents attained 5 or more good GCSEs compared to 35% of the children of those in ‘routine’ occupations. This is an indirect rather than a direct measure of parents’ education and does not present
5 r = -0.51, p<0.001. r varies between 1 which is a perfect positive correlation and -1 which is a perfect negative correlation, whilst 0 is not at all correlated or random; p<0.001, p values relate to the significance of the correlation, a p value of <0.01 is significant and of <0.001 is highly significant.

44
Learning to Succeed: understanding and addressing Key Stage 4 (GCSE) underachievement in Yorkshire and Humber
knowledge management for the information age
as simple a conclusion as might be drawn given that the typically more affluent professional parents are also more likely to have children going to better performing schools. As the level of qualifications held is strongly correlated to age of residents, we believe that this could also be a factor that complicates statistical correlations, and it is difficult to draw conclusions from this without further research. Nevertheless, we do not have enough evidence to discount parental influence. In fact, the influence of parents is probably central to our arguments on how social segregation and the labour market affect attainment. Furthermore, given the conclusion we reach about segregation, social class and perceptions of labour market opportunities being key factors in influencing levels of attainment, then it is evident that parents are likely to play a key role in shaping all of these areas. Whilst difficult to model statistically, it is evident that parents can assist their children with learning, especially in English Language which is shown to have a strong impact on subsequent performance in the round. Parents’ ability to help their children, especially in more specialised subjects they might not themselves have studied at school, is also likely to be reduced at secondary school compared to primary given the complexity of material and subjects studied, and to have links to the parent’s education. Parents can also can transmit positive or negative messages about the value of study and learning and vary in how they support their children’s progress. They can get involved in school affairs or not. They influence dietary regimes, health and leisure patterns that have also been linked to child’s learning. In addition, they can consciously or unconsciously transmit messages about the nature and extent of jobs in the labour market, how far one might travel to work, and what jobs command what salaries. “It’s down to the parents.” Pupil in High Attainment School “The support we get from our families…” Head Teacher Describing how they Achieve High Attainment “A key factor is the ‘home learning environment’: the amount parents read to their children, the number of books in a home, the degree to which parents support their children’s education in and out of school.” Cassen and Kingdon (2007) Furthermore, Blanden and Gregg (2004) have suggested that parental income rather than parental education is the most important factor, concurring with our view on the importance of perceptions regarding labour market opportunities.
Deprivation
Based on PLASC, many commentators have identified a strong negative correlation between free school meals and attainment (the DCSF multi-level model shows a coefficient of -1.70 between Key Stage 2 English and Key Stage 4, even though in the main the effects are higher for Maths and Science we have used the Key Stage 2 for English, unless otherwise identified). It is therefore, widely believed that deprivation is a major contributory factor towards low attainment. Indeed the DCSF have included the Index of Multiple Deprivation’s Income Deprivation Affecting Children Index in PLASC (-5.02) and we have found a strong

45
Learning to Succeed: understanding and addressing Key Stage 4 (GCSE) underachievement in Yorkshire and Humber
knowledge management for the information age
negative correlation with the Index of Multiple Deprivation itself (our own Pearson Coefficient based on Lower Super Output Area data showed a negative correlation of r = -0.68, p<0.001to Key Stage 4 results). Nevertheless we have unpacked variables related to social class and income and we believe that the relationship to deprivation is far from clear and that it could be more readily explained by variables connected to social class and perceptions of labour market opportunities. Unfortunately, statistical measures of deprivation and social class are so related that it is difficult to use the case convincingly for one or the other. Notwithstanding these problems, Cassen and Kingdon (2007) do believe that deprivation is an important factor in low achievement and have been able to identify a relationship with neighbourhood unemployment and single parents. This is consistent with our view of the influence of the culture and attitudes, lowered aspirations and more restricted perceptions of labour market opportunities that can be connected with deprivation. We believe that those who are most disadvantaged strive to achieve high attainment to escape their circumstances; or simply give up. This would lead to a bipolar distribution which a concentration of high attainers and low attainers; which would be masked in our investigation of average attainment.
Income
There is a reasonable volume of literature suggesting that income has an important effect on attainment. Although much of this relates to the United States, there are also a number of UK based studies, for example, Blanden and Gregg (2004) argue that: “Overall, the main result of our paper provide consistent evidence of a significant impact of family incomes on educational attainment in the UK. The results suggest that a one third reduction in income from the mean increases the probability of a child getting no A-C GCSEs by around 3 to 4 percentage points, on average, and reduces the chances of achieving a degree by a similar magnitude.” The Index of Multiple Deprivation’s Income Domain correlates negatively with attainment (r = -0.69 [p<0.001] in our Pearson Coefficient for Key Stage 4 at Lower Super Output Area level). However, we could not identify as strong a relationship to average wages of residents and even less so for those employed in an area. Ideally we would have liked to have explored the distribution of income (or it’s Kurtoisness), at Lower Super Output Area level. This is because we believe this may have resulted in much stronger correlations, as we believe that the presence of working people on very low incomes is an important determinant. As the Income Domain consists of registers of those claiming state benefits, including income support, we hypothesise that it is related to labour market opportunity, or even the negative effects of social security on aspirations (see Bartholemew, J. [2006], for an extremely thorough explanation of how welfare payments have changed behaviour). This is consistent with our findings on deprivation and social class.

46
Learning to Succeed: understanding and addressing Key Stage 4 (GCSE) underachievement in Yorkshire and Humber
knowledge management for the information age
Income Support Looking at individual benefits we can only find very weak negative correlations to attainment, except for income support (r = -0.59 [p<0.001] for Key Stage 2 and r = 0.67 [p<0.001] for Key Stage 4 at Lower Super Output Area level). This supports our view that perceptions of labour markets rather than deprivation per se are an important determinant of attainment (although we recognise that those on income support are likely to be amongst the most deprived within our country). Given that this is lower than that we recorded against the Income Domain (possibly due to time lags in the data series) and that income support is likely to be a major component of the Income Domain, we decided to keep Income Deprivation as the variable in our overall modelling. Furthermore it was very strongly negatively correlated to our Dissimilarity Index using social grades AB-D (r = -0.66 [p<0.001] at Lower Super Output Area level), suggesting that they were actually measuring similar phenomena (in other words social grade and deprivation share many important characteristics making it difficult to distinguish between them). Nevertheless, it does appear to explain some variations by LEA and region, so we have retained it within our modelling. Interestingly, Income Support is the main qualifier for free school meals. We therefore, believe that even free school meals actually measures labour market disadvantage more so than deprivation (although clearly the two are so inter-related that we cannot rule out either).
Social Class
Attainment is positively correlated to pupils from managerial and professional classes (social grades A and B: r = 0.67 [p<0.001]) and negatively to semi and unskilled manual classes (social grade D: r = -0.69 [p<0.001]). In fact, it is more negatively correlated to semi and unskilled manual classes than it is to those not in work and on benefits (social grade E: r = -0.53 [p<0.001]). “You’ve got more chance of getting a good job if you’re at this school.” Pupil in High Attainment School “We’ve some tremendously privileged children.” Headteacher in High Attainment School
Our graphic illustrates the percentage of pupils gaining 5+ GCSEs at A*-C including Maths and English and the percentage of residents in social grade D (semi and unskilled manual workers). The two lines seem to follow a remarkably inverse trajectory, although that the gap between them widens for southern regions indicating that the relationship is not linear. We have therefore, concluded that social class and the perceptions of labour market opportunities are more likely to be important determinants than deprivation in
Regional Attainment and Social Grade D
0%
5%
10%
15%
20%
25%
30%
35%
40%
North East North West Yorkshire
and the
Humber
East
Midlands
West
Midlands
Eastern
Region
London South East South West
GCSE
D

47
Learning to Succeed: understanding and addressing Key Stage 4 (GCSE) underachievement in Yorkshire and Humber
knowledge management for the information age
itself. Although all are obviously interlinked, particularly in the data measures that are available to us. Interestingly Cassen and Kingdon (2007) also believe social class to be a major influence on low attainment, especially language: “Language development is a further factor: a young child in a professional-class home will hear every day more than three times the number of words heard by a child in a home where the parents are of low socio-economic status; parents in such homes also tend to interact verbally with their children less than professional parents.” Care is needed not to draw generalisations from such powerful statistics. Notably, it is important to restate that it is not somebody’s social class which in itself is a determining factor – there of course will be many individual exceptions that fly in the face of a general trend. However, the behaviours, attitudes, language or cultural norms that are more prevalent within certain groups, and their labour market experiences and expectations that are themselves key to definition of social class, appear highly implicated as mechanisms that can influence educational attainment.
Social Segregation We believe that labour markets with a high proportion of semi and unskilled manual workers negatively influence the attainment of that area. This would be because traditionally within these labour markets young people could enter relatively well-paid jobs with few, if any qualifications. Furthermore, it goes some way to explaining the traditional under attainment of coalmining areas (nevertheless our tests related to employment in coalmining and engineering proved to be inconclusive). By contrast, areas with a high proportion of managers and professionals (for example county towns, such as York) enjoy higher levels of attainment. Indeed high attainment would be a prerequisite for entering these higher-level occupations, or indeed for leaving the area to study at a University. Furthermore, in depressed labour markets with a high proportion of people not in work (social grade E) attainment is higher than those with a high proportion of semi and unskilled manual workers (social grade D). However, we also found the relationship to be indirect and that the balance between groups AB and D to be at least as important as having high numbers of ABs. In modern management parlance, this would be called a ‘tipping point’. Cassen and Kingdon (2007) believe social segregation to be an important factor influencing low achievement and that it is increasing. “A troubling finding has been that ‘where rich and poor children live in the same place and have the same measured ability, the poor child is less likely to go to a good school’; and that ‘in parts of the country where choice is more feasible, pupils are more highly segregated…”
The Labour Market Work by Shuttleworth (1994) in Northern Ireland showed that Catholics responded to discrimination in the labour market by remaining in education for much longer periods than Protestants and that, this resulted in higher overall qualifications levels. In previous work, in West Yorkshire (Hoshin, 2002), we

48
Learning to Succeed: understanding and addressing Key Stage 4 (GCSE) underachievement in Yorkshire and Humber
knowledge management for the information age
suggested that this might also explain higher attainment levels amongst BME communities in England. However, the relationship to the labour market is far from simple, for example, whilst it could be argued that the higher attainment of females is also due to discrimination, the rapid increase in female attainment levels has occurred at a time of increasing employment opportunities for females. Traditionally coal-mining communities (along with other areas where there is an abundance of low skilled but relatively low paid work, such as the Black Country) have traditionally had very poor attainment records. More recently, Harris et al (2003) have shown that attainment in the former coalfields is rising, presumably in response to the changing labour market conditions young people find themselves in. Indeed Richard Walton (Sheffield Hallam University) described the insularity of former mining villages and its possible affect on attainment, in our consultation: “Generally low aspirations in producing generations of young people who do not see any alternatives other than the kind of culture into which they have been born and raised. I tend to believe that there is a high degree of cultural insularity in the region. This is manifest in a reluctance to travel beyond the boundaries of the local community. Big cities, such as Leeds, Bradford and Sheffield are viewed with distrust and apprehension (almost bordering on paranoia) by those who live in smaller communities - such as the former mining villages. There is a lack of positive role models in these parts of the Region - those who have succeeded have got out - so there is little to seek beyond the familiar boundaries. The traditional industries of mining and steel in the past mopped up large numbers of unskilled and unqualified labour: the culture still remains among many males that education and training is not for them because it was not the thing for their parents and grandparents. This is a coupled with a sense of pointlessness in engaging in a paperchase that will not qualify many children for anything meaningful. A perceived lack of relevance in the school curriculum to everyday life and practical issues.” Unfortunately when we investigated employment in mining or manufacturing by workplace (as opposed to the more robust measure of employment of residents in mining or manufacturing) we were unable to identify a strong relationship to attainment (r = 0.02 [p<0.001] and r = -0.22 [p<0.001] respectively using a Pearson Coefficient for Key Stage 4 at Lower Super Output Area level). In addition, tests related to the level of employment in the knowledge economy were largely inconclusive and therefore rejected against other labour market measures. Nevertheless our assessment across the variables, that we have investigated is that perceptions of the labour market is extremely important in influencing attainment, but that we have been unable to identify a single variable to capture this, partly because the relationship is far from linear, indeed we believe it to be a complex relationship that does not lend itself to traditional linear statistical models.

49
Learning to Succeed: understanding and addressing Key Stage 4 (GCSE) underachievement in Yorkshire and Humber
knowledge management for the information age
Comparision of Attainment and Labour Market Indicators
0
10
20
30
40
50
60
70
80
90
Nor
th
East
York
shir
e
and
the
Nor
th
East
York
shir
e
and
the
Nor
th
East
York
shir
e
and
the
Nor
th
East
York
shir
e
and
the
Nor
th
East
York
shir
e
and
the
Nor
th
East
York
shir
e
and
the
Nor
th
East
York
shir
e
and
the
Nor
th
East
York
shir
e
and
the
1999 2000 2001 2002 2003 2004 2005 2006
%
5+ GCSE % KS2 English Level 4 % ILO Unemployment % Level 3/4 Qualificaitons % Economic Activity Rate
An issue that is of concern to the Region and to Hoshin in explaining our views of the influence of perceptions of the labour market is the relative deterioration in the Region’s attainment when compared with the North East. That is not because of any negative view of a partner region with whom Yorkshire and Humber shares many challenges. It is simply that the North East’s education statistics (which are slightly better than those in Yorkshire and Humber) appear to buck a statistical trend of generally lower performance on most socio-economic indicators in that region, and are therefore of interest, especially in testing the labour market influence theory. There are few measures of the labour market that could be used to suggest that the North East is more buoyant than Yorkshire and Humber (in the graphic we have looked at ILO unemployment, working age level 3 and 4 qualifications and economic activity, although our dissimilarity index also shows that the social composition of the North East is the least favourable of any English region), yet relative attainment has been steadily improving in the North East. In fact, it would be really difficult to construct a series of measure which captures our views on how perceptions of the labour market affect attainment. Again this has led us to conclude that such relationships are far from linear, put another way it is not a simple straight-line relationship and therefore it cannot be readily uncovered using statistical methods like Pearson’s Correlation or Multiple Regression. Although we are somewhat critical of the suitability of the alternative curricula and non-GCSE examinations, in Chapter 6 we show that this is more common in the North East than in Yorkshire and Humber. Despite our concerns that the use of these vocational qualifications do not necessarily reflect the needs of the local labour market, we are sure that more vocationally based qualifications are more suited to depressed labour markets, as they provide a potential link to prosperity. We are therefore proposing that in using the alternative curricula the North East is responding in a positive way to its labour market disadvantage. In reality schools face a difficult decision balancing the merits of the alternative curricula in

50
Learning to Succeed: understanding and addressing Key Stage 4 (GCSE) underachievement in Yorkshire and Humber
knowledge management for the information age
engaging children and raising their chances of passing exams with the risk of this leaving gaps in other areas of their education that may impact on some employment options. Vocational GCSEs should help to address this, as might great flexibility and encouragement to teach conventional GCSEs in ways which engage a wider spread of pupils.
We believe that the reasons why we have struggled to find suitable measures for the effects of the labour market are three fold. Firstly, we believe that it is the pupils (and their influencers) perceptions of the labour market that are important and not necessarily the objective conditions in the labour market (although these are clearly related). Secondly, Travel to Work Areas vary greatly by occupation and therefore social grade. So for parents of pupils at Crayke Church of England Primary School in North Yorkshire Hull, Leeds, Teesside and York may all feature as a part of their potential commuting area; whilst for parents of pupils at Richmond Hill Primary School in Leeds may feel that even the centre of Leeds is outside their commuting area (see Hoshin 2002 where we describe unemployed adults in Burmantofts claiming that Leeds was too far to travel to work). Finally, there is a lack of a linear relationship that we previously referred to. In a buoyant labour market with high skilled occupations pupils will have high aspirations, because they need to acquire these skills to compete. The same is true for a depressed labour market, as only those with high skills levels will compete, although for those that know that they cannot compete, this could be a source of discouragement. However, for buoyant labour markets with an abundance of low skilled employment, this disincentive will also exist. We also investigated distanced travelled to work as a measure of local labour markets but although the evidence was enough to suggest that we were exploring useful areas, it did not in itself provide an explanation (r = 0.34 [p<0.001] using a Pearson Coefficient for Key Stage 4 at Lower Super Output Area level), especially given that distance travelled to work is closely related to social grade. Perceptions of the Labour Market Although we can detect a time lag in perceptions between improvement in the labour market and in attainment, these do not appear to stretch beyond the cohort. This suggests that for many young people their likely attainment is set at an early age. Therefore, for young people who are already within the school system when their local labour market experiences an upturn, their perceptions may not change quickly enough to impact on their attainment. However, for children not yet at school it would appear that such changes have an effect on their perceptions and that this impacts on the attainment. Unfortunately, we have in previous work been made aware of a greater time lag amongst teachers and headteachers in terms of their assessment of the local labour market (Hoshin 2005). Indeed in work in the West Midlands we found negative attitudes towards the engineering sector across parents, careers advisors, and teachers, despite the sector being fairly buoyant at that time. A part of the reason for this was that a proportion of each group had at some time been made redundant from the sector and were basing their assessment on their historic experience. This can result in labelling young people, because it is perceived that there will be few opportunities within the labour market for them, despite most of the Region being currently very buoyant.

51
Learning to Succeed: understanding and addressing Key Stage 4 (GCSE) underachievement in Yorkshire and Humber
knowledge management for the information age
Overall the paradox we noted in relation to improving attainment amongst females fits our overall view of the complex way in which the labour market is affecting attainment. When there were few opportunities for females in the labour market they responded by either doing exceedingly well, or effectively giving up on education. Now there are many more opportunities for females, but nevertheless they still face some disadvantage, it could be argued that the response has been to improve their attainment levels across the board. In fact, few females now underachieve, as there are few that will not find a role within the modern labour market. The impact of other possible reasons for raised female attainment need to be set against this. Notably these could include changing perceptions and realities about the role of women in society and more open cultural attitudes, and also the case that is made, that changes in the curriculum and assessment methods have suited girls more than boys over recent decades.
The Effects of Multiple Variables Ray (2006) reports on a the multi-level model (used to calculate CVA) looking at overall scores in 2005, by DfES. The intercept represents the number of points to add between Key Stage 2 and Key Stage 4 and the estimates the number of points to add (shown in blue on our graph) or subtract (shown in white on our graph) by each variable. Again, this shows very similar correlations (under the estimates column), but highlights the negative effects on pupils who move schools (also identified in Galton, Gray and Ruddock 1999). Possibly related to this it also suggests that travellers’ children are much less likely to have high levels of value added.

52
Learning to Succeed: understanding and addressing Key Stage 4 (GCSE) underachievement in Yorkshire and Humber
knowledge management for the information age
Multilevel Model to Predict Capped Key Stage 4 Points in 2005 -2logL = 6168797 n = 548,222 pupils
Explanatory Factor Variable Estimate Std. Error P value
Intercept 147.81 13.20 0.00 **
Prior attainment Key Stage 2 student APS -8.55 0.24 0.00 **
Key Stage 2 APS (using fine grades) – squared 0.45 0.00 0.00 **
Key Stage 2 English PS deviation 1.94 0.07 0.00 **
Key Stage 2 Maths PS deviation -0.32 0.07 0.00 **
Deprivation Does student have FSM? -21.36 0.30 0.00 **
Deprivation of pupil's local area Deprivation indicator – IDACI score -65.14 0.70 0.00 **
Special Educational Needs Does student have SEN - Action Plus? -64.02 0.42 0.00 **
Does student have SEN - school action? -37.91 0.35 0.00 **
Mobility Student joined other than Jul/Aug/Sep? -27.09 0.44 0.00 **
Student joined within last 2 yrs? -74.98 0.67 0.00 **
Gender Is student female? 15.80 0.20 0.00 **
Age Age within year -14.20 0.31 0.00 **
Language Is English not the student's first language? 23.83 0.65 0.00 **
Ethnic group Is the student White Irish? -0.40 1.48 0.79
Is the student a White Irish traveller? -43.76 6.84 0.00 **
Is the student White Gypsy/Roma? -43.05 4.50 0.00 **
Is the student White other? 14.68 0.79 0.00 **
Is the student Mixed White/Black Caribbean? -1.25 1.05 0.24
Is the student Mixed White/Black African? 4.91 2.19 0.02 *
Is the student Mixed White/Asian? 7.78 1.49 0.00 **
Is the student any other Mixed ethnic group? 6.08 1.09 0.00 **
Is the student Indian? 22.58 0.85 0.00 **
Is the student Pakistani? 24.50 0.91 0.00 **
Is the student Bangladeshi? 30.92 1.27 0.00 **
Is the student any other Asian ethnic group? 27.06 1.41 0.00 **
Is the student Black Caribbean? 17.13 0.84 0.00 **
Is the student Black African? 34.22 1.02 0.00 **
Is the student any other Black ethnic group? 8.07 1.49 0.00 **
Is the student Chinese? 29.01 1.66 0.00 **
Is the student any other ethnic group? 25.44 1.27 0.00 **
Is the student in an unclassified ethnic group? -11.82 0.60 0.00 **
In care Has the student ever been in care at this school? -32.85 1.35 0.00 **
Level of school prior attainment School Key Stage 3 APS (using fine grades) for CVA 3.04 0.36 0.00 **
Spread of school prior attainment School std dev of Key Stage 3 APS for CVA -5.45 0.95 0.00 **
Random components: Estimate Std.Error
Between school variance 351.16 9.63
Within school variance 4,444.83 8.51
Variance partition coefficient 0.07 Source: Ray 2006 * = <0.01, ** = <0.001

53
Learning to Succeed: understanding and addressing Key Stage 4 (GCSE) underachievement in Yorkshire and Humber
knowledge management for the information age
Multilevel Model to Predict Capped Key Stage 4 Points in 2005
-100
-80
-60
-40
-20
0
20
40
Key
Sta
ge 2
stu
dent
APS
Key
Sta
ge 2
APS
(us
ing
fine
grad
es)
–
squa
red
Key
Sta
ge 2
Eng
lish
PS d
evia
tion
Key
Sta
ge 2
Mat
hs P
S de
viat
ion
Doe
s st
uden
t ha
ve F
SM?
Dep
rivat
ion
indi
cato
r –
IDA
CI s
core
Doe
s st
uden
t ha
ve S
EN -
Act
ion
Plus
?
Doe
s st
uden
t ha
ve S
EN -
sch
ool a
ctio
n?
Stud
ent
join
ed o
ther
tha
n Ju
l/Aug
/Sep
?
Stud
ent
join
ed w
ithin
last
2 y
rs?
Is s
tude
nt fe
mal
e?
Age
with
in y
ear
Is E
nglis
h no
t th
e st
uden
t's fi
rst
lang
uage
?
Is t
he s
tude
nt W
hite
Irish
?
Is t
he s
tude
nt a
Whi
te Ir
ish t
rave
ller?
Is t
he s
tude
nt W
hite
Gyp
sy/R
oma?
Is t
he s
tude
nt W
hite
oth
er?
Is t
he s
tude
nt M
ixed
Whi
te/B
lack
Car
ibbe
an?
Is t
he s
tude
nt M
ixed
Whi
te/B
lack
Afr
ican
?
Is t
he s
tude
nt M
ixed
Whi
te/A
sian?
Is t
he s
tude
nt a
ny o
ther
Mix
ed e
thni
c
grou
p?
Is t
he s
tude
nt In
dian
?
Is t
he s
tude
nt P
akist
ani?
Is t
he s
tude
nt B
angl
ades
hi?
Is t
he s
tude
nt a
ny o
ther
Asia
n et
hnic
grou
p?
Is t
he s
tude
nt B
lack
Car
ibbe
an?
Is t
he s
tude
nt B
lack
Afr
ican
?
Is t
he s
tude
nt a
ny o
ther
Bla
ck e
thni
c
grou
p?
Is t
he s
tude
nt C
hine
se?
Is t
he s
tude
nt a
ny o
ther
eth
nic
grou
p?
Is t
he s
tude
nt in
an
uncl
assif
ied
ethn
ic
grou
p?
Has
the
stu
dent
eve
r be
en in
car
e at
thi
s
scho
ol? V
alue

54
Learning to Succeed: understanding and addressing Key Stage 4 (GCSE) underachievement in Yorkshire and Humber
knowledge management for the information age
Other commentators not restricted by the data contained in PLASC have also identified the following features as being important to attainment (although this is not the same measure as value added):
Positive Influence Negative Influence High Social Class Poor Transition Between Schools School Resources Deprivation Selection Computers in the Household Computers in School Parental Involvement
Our own analysis of independent variables suggests that a combination of the perceptions of local labour markets and social segregation are the most likely explanation for pupil attainment. We found these to be contained within the Index of Multiple Deprivation Income Domain (which actually measures income support payments), by constructing a Dissimilarity Index using Social Grades AB-D and looking at the distribution of school attainment across an LEA (r = 0.70 [p<0.001]). An index using social grades AB-DE also produced high correlations, but not quite as high as our favoured index, indeed it is prudent to utilise the most reliable measures (see Chapter 6). A part of the reason why we find combining variables to be more reliable than single variables is through our concern that the relationships to single variables are non-linear. By combining variables we are able to introduce a level of non-linear modelling into our analysis, in a similar way that multi-level models attempt to do. Income Deprivation was also an important negative influence, although we did not find a strong correlation with either the wage levels of residents or those working in the area. Again we concluded that this is a product of perceptions of the labour market as well as connected to social class and culture, but are not entirely clear that the relationship is linear, or even direct. Certainly, Income Deprivation actually measures income support claimants, which we conclude is more important than income in determining attainment. We also believe that it is important for schools to have a good mix of pupils from A and B Social Grades within them. Many consultees described how the ethos of the school could be changed by having a reasonable balance of pupils aspiring to high-level attainment. This is consistent with the observation that the higher level of selection (or potentially quasi selection, including parents moving into high performing school’s catchment areas) the more average attainment in an LEA is depressed, as AB pupils will be concentrated within a few schools. As discussed this is consistent with our view that there is a tipping point in terms of this social mix. When a school has a reasonable proportion of engaged and motivated pupils they will have a positive effect on other pupils. Where such pupils form a small minority, it is more likely that their enthusiasm will wane as a result of peer pressure. Our best way of identifying such pupils is by social grade. However, we are certainly not suggesting that there is a hereditary disposition running along class lines. We feel that subtle influences from the labour market operate according to occupations and hence social grades, which can also be associated with social norms, attitudes and behaviours. These influences include

55
Learning to Succeed: understanding and addressing Key Stage 4 (GCSE) underachievement in Yorkshire and Humber
knowledge management for the information age
parents, peers and even teachers’ perceptions. That we find this is also closely related to income deprivation should come as no surprise as we believe this to arise from labour market disadvantage.

56
Learning to Succeed: understanding and addressing Key Stage 4 (GCSE) underachievement in Yorkshire and Humber
knowledge management for the information age
6 Under Attainment in Yorkshire and Humber: a detailed analysis
Summary Our brief was to understand why there was an apparent drop in the Region’s relative performance to national average between Key Stage 2 and Key Stage 4. Firstly, we explore the nature and extent of this drop and how it fits within the context of underperformance at both levels. For instance, when we use the newer and arguably stronger measure of 5 GCSEs including Maths and English, the gap between Yorkshire and Humber and other northern regions narrows considerably. Some would argue that it is therefore possible that the apparent gap between the Region and other regions is due to normal variability and not related to the Region’s demography or the effectiveness of its LEAs, schools, headteachers or teachers. Nevertheless, such underperformance shows a historic trend and therefore is unlikely to be solely a product of normal variation.
In addition, the Region’s Key Stage 2 English results are the weakest nationally, we argue in part at least due to the effects of social segregation within the Region’s primary schools. Because communication skills are important across a range of GCSEs we believe this is adversely affecting GCSE results. In fact the exaggeration of gaps at age 11 onwards to age 16 on this measure would appear to explain much of the Region’s performance relative to other northern regions. We also find that the effective segregation of middle class from unskilled working class families across the Region’s towns and cities is contributing towards underperformance, together with relatively high levels of income support. Although the measures that we have
identified could be associated with deprivation we feel that they are more consistent with the other factors often linked to deprivation, including perceptions of the labour market affecting young people’s aspirations and views towards education. We believe that it is important for all schools to have a good social mix to ensure that there is a positive attitude towards attainment within the social mix. “It helps being around people that are good.” Pupil in High Attainment School
Factors Contributing to Low KS4 Attainment
Parents are Semi or Unskilled Manual Workers
Attend Socially Segregated Primary School
Low KS2 English Attainment
Selection and Quasi-Selection of Secondary
Schools
Uninteresting and Inappropriate Curriculum
Labelling and Stereotyping
Low Attainment at KS4
Perceptions of The Labour Market

57
Learning to Succeed: understanding and addressing Key Stage 4 (GCSE) underachievement in Yorkshire and Humber
knowledge management for the information age
The Reliability of Key Stage 2 SATs Scores Although the Region’s relative attainment at Key Stage 2 appears to be somewhat higher than that for Key Stage 4, we would question the reliability of Key Stage 2 SATs, especially the average point’s score. Some local experts suggested that some primary schools are able to inflate their Key Stage 2 scores through intensive coaching to improve their own value added measure. Taylor Fitz-Gibbon [1997] comments on how at Key Stage 4 attention is focused on borderline GCSE candidates, to improve the numbers gaining 5 GCSEs at A*-C. This is called ‘triage’ in the Cassen and Kingdon study [2007]). Anecdotally we have been told that the level to which this occurs varies considerably by school (and by LEA with it being most prevalent in metropolitan LEAs) and is especially common within more middle class schools. It is possible that such inflation is more widespread in Yorkshire and Humber than in other regions but we have no evidence for this and neither KS2 or 4 results compared to other regions suggest it is prevalent, or certainly not very successful if it is. Moreover if this coaching and/or focusing on certain pupils was more prevalent at GCSE as well as at primary school (which may be expected given the same geography and LEAs are in place), the effect one would expect would be a rise in those passing 5 good GCSEs or equivalent. This is not to say coaching or a focus on borderline pupils (in terms of their likelihood to pass a benchmark test or to gain five good GCSEs) does not occur, simply that it is more likely to explain differences between individual schools and LEAs than between regions. “I think that the data should be treated with some caution. I would argue that KS4 data (i.e. GCSE results) is very reliable, but that, bluntly, KS2 data does not discriminate to anything like the same degree. The implication of this is that the impact of disadvantage may, in reality, be just as great at age 11 as at age 16.” Patrick Scott, City of York LEA “Two of these [feeder schools] are masters in gaining grade 4 and 5 [Key Stage 2] SATs, but their ex-pupils perform the worst at GCSE.” Headteacher Metropolitan Comprehensive Certainly, a number of teachers in the region described how they adjusted predicted grades of pupils from some primary schools in the region, because they knew that these would have been inflated as a result of coaching. Whilst we have no evidence that this is more common in the region than in others, we can conclude from our discussions that it is widespread. Our own analysis of the distribution of Fine Grade Scores for Key Stage 2 subjects (from the National Pupil Database), concurs with this observation, with marked troughs’ and peaks at the cut off points for attainment levels (as shown so vividly in the following graphics). Such practices make the data potentially unreliable and would result in errors in the predictive models used by schools and inspectors and within our own models.

58
Learning to Succeed: understanding and addressing Key Stage 4 (GCSE) underachievement in Yorkshire and Humber
knowledge management for the information age
KS2 English
0
5000
10000
15000
20000
25000
30000
1 5 9 13 17 21 25 29 33 37 41 45 49 53 57 61 65 69 73 77 81 85 89 93 97 101
Passes
Pup
ils
KS2 Maths
0
2000
4000
6000
8000
10000
12000
14000
1 5 9 13 17 21 25 29 33 37 41 45 49 53 57 61 65 69 73 77 81 85 89 93 97 101
Passes
Pup
ils
KS2 Science
0
5000
10000
15000
20000
25000
30000
1 5 9 13 17 21 25 29 33 37 41 45 49 53 57 61 65 69 73 77 81 85 89 93 97 101
Passes
Pup
ils
In addition, Key Stage 2 SATs are nothing like as discriminatory as attainment at Key Stage 4 and their apparent differences might be explained by normal variation within imperfect measurements. One of the reasons why they are imperfect measures is that they are synthetically derived from Key Stage 2 Subject Fine Grades (a procedure which may be of value to schools, but renders its value to be very limited in educational research). Indeed we have found the Fine Grades (especially English) to be much more reliable than the Average Points Score.
Does Yorkshire and Humber have an Attainment Problem? An example of the importance of different definitions was apparent in our analysis of the National Pupil Database (for the 2006 Key Stage 4 pupil cohort). This suggested that whilst the Region is performing poorly the original hypothesis focused only on one frequently reported measure (5 or more good GCSEs or equivalent) whereas a range of other measures could also be explored. The following tables look at Yorkshire and Humber’s performance compared to other regions on a wider range of measures.
Comparator of 2006 Performance by Region based on Points Scored Region KS2
English KS2
Maths KS2
Science KS2
Total* Average Number of
GCSE Passes at A*-C GCSE Points
Score North East 59.57 62.54 57.77 195.71 4.22 357.88 North West 60.06 62.98 57.43 195.98 4.56 350.27 Yorkshire and Humber 59.15 61.54 56.79 193.11 4.32 344.03 East Midlands 59.63 62.05 57.12 194.48 4.62 353.91 West Midlands 59.37 61.38 56.84 193.25 4.46 358.50 East of England 60.39 62.41 57.54 195.87 4.99 367.03 London 60.18 62.86 56.93 195.44 4.90 359.24 South East 61.10 63.04 58.10 198.00 5.27 370.33 South West 60.36 62.44 57.62 196.05 5.07 363.04 Total 60.07 62.42 57.37 195.48 4.77 358.81 * NOTE: Calculated by rebasing science and totalling scores. This is not the same as DCSF Average Point Score.
Z-Scores (a data transformation that facilitates comparison between disparate datasets) were also calculated for each of these measures; the mean Z-scores by region are:

59
Learning to Succeed: understanding and addressing Key Stage 4 (GCSE) underachievement in Yorkshire and Humber
knowledge management for the information age
Comparator of 2006 Performance by Region based on a Z Score of Points Scored Region KS2
English KS2
Maths KS2
Science KS2
Total* GCSE Passes at
A*-C GCSE Points
Score North East -0.03 0.01 0.03 0.00 -0.14 -0.01 North West 0.00 0.03 0.01 0.01 -0.05 -0.05 Yorkshire and Humber
-0.06 -0.04 -0.04 -0.05 -0.12 -0.09
East Midlands -0.03 -0.02 -0.02 -0.02 -0.04 -0.03 West Midlands -0.05 -0.05 -0.04 -0.05 -0.08 0.00 East of England 0.02 0.00 0.01 0.01 0.06 0.05 London 0.01 0.02 -0.03 0.00 0.03 0.00 South East 0.07 0.03 0.06 0.05 0.13 0.07 South West 0.02 0.00 0.02 0.01 0.08 0.03 * NOTE: Calculated by rebasing science and totalling scores. This is not the same as DCSF Average Point Score.
The following table simplifies this picture by simply considering the rank order of Key Stage 2 English, Key Stage 2 Points, GCSE Passes and GCSE points score:
Ranked Comparator of 2006 Performance by Region based on Points Scored KS2 English KS2
Total* GCSE Passes at A*-C GCSE Points Score
North East 7 5 9 6 North West 5 3 6 8 Yorkshire and Humber 9 9 8 9 East Midlands 6 7 5 7 West Midlands 8 8 7 5 East of England 2 4 3 2 London 4 6 4 4 South East 1 1 1 1 South West 3 2 2 3 * NOTE: Calculated by rebasing science and totalling scores. This is not the same as DCSF Average Point Score.
This data does not fully support the initial proposition in terms of how far performance falls between ages 11 to 16 relative to national average, although this is largely a definitional issue. Indeed due to the lack of availability of data across all geographic levels we have used different definitions throughout this report. In fact, Yorkshire and Humber, according to some measures, performs poorly at both Key Stage 2 and Key Stage 4, ranking last or second to last amongst regions in both cases. It is therefore a definitional issue, nevertheless, attainment by any definition is poor. Analysis of variance of both measures confirms that the differences between regions are statistically highly significant (p<0.001), that is, there are greater regional differences than would be explained by the random distribution of pupils of different ability. The proposition also presupposes that Key Stage 2 performance is a good predictor of Key Stage 4 performance. This is in fact borne out by the data, with the two measures correlated with r = 0.71 (p<0.001). This suggests that about half of the variance in Key Stage 4 performance is accounted for by variance in Key Stage 2 performance. Nevertheless, we argue in this report that this is far too low to be used in the way it is by schools and inspectors to determine a

60
Learning to Succeed: understanding and addressing Key Stage 4 (GCSE) underachievement in Yorkshire and Humber
knowledge management for the information age
pupil’s or school’s future (a concern shared by many of the headteachers we spoke to).
The Use of Alternative Curricula
The use of qualifications other than GCSEs, is widespread, across England. This can be readily identified in the National Pupil Database by the large numbers of pupils not achieving any actual GCSE passes. Whilst some may not have been put forward for examinations (for example many SEN pupils do not take GCSEs) it is also clear that large numbers of pupils are following a vocational curriculum. We are able to gauge this by looking at the difference between the numbers of pupils achieving 5+ GCSEs at A*-C (which includes other qualifications) and
those achieving 5+ GCSE at A*-C including Maths and English (which does not include them). This alternative curricula is also very popular in Yorkshire and Humber. Indeed schools in Hull have recently dramatically increased their overall attainment scores by increasing their reliance on non-GCSE qualifications. By contrast their use is much more limited in Sheffield and to a lesser degree neighbouring North East Lincolnshire. Indeed when looking at the 5+ GCSE A*-C including Maths and English standard both Sheffield and Leeds stand out as performing better than previous measures, had suggested, because they have relied less on alternative qualifications than other metropolitan LEAs in the Region.
GCSE Passes
0
20000
40000
60000
80000
100000
120000
140000
160000
180000
0 1 2 3 4 5 6 7 8 9 10 11 12 13 14 15 16
Passes
Pup
ils

61
Learning to Succeed: understanding and addressing Key Stage 4 (GCSE) underachievement in Yorkshire and Humber
knowledge management for the information age
LEA Performance over English Average
-50.00
-40.00
-30.00
-20.00
-10.00
0.00
10.00
20.00
Barn
sley
Brad
ford
Cal
derd
ale
Don
cast
er
East
Rid
ing
of Y
orks
hire
Kin
gsto
n up
on H
ull,
City
of
Kir
klee
s
Leed
s
Nor
th E
ast L
inco
lnsh
ire
Nor
th L
inco
lnsh
ire
Nor
th Y
orks
hire
Roth
erha
m
Shef
field
Wak
efie
ld
York
, City
of
Scor
e
-0.04
-0.02
0.00
0.02
0.04
0.06
0.08
0.10
0.12
0.14
Alt
erna
tive
GC
SE
2006 Score +/-
+/- Alternative GCSE
In fact, many consultees were sceptical that the Region was underperforming compared with the North East region: “The comparison with the NE is an interesting one. When I worked in the NE, we were always told that it was the NE that presented the most significant problems. I am not sure that the difference between the two regions is as significant as the question implies.” Patrick Scott, City of York LEA

62
Learning to Succeed: understanding and addressing Key Stage 4 (GCSE) underachievement in Yorkshire and Humber
knowledge management for the information age
LEA Performance
0%
10%
20%
30%
40%
50%
60%
70%
Barn
sley
Brad
ford
Cal
derd
ale
Don
cast
er
East
Rid
ing
of
York
shir
e
Kin
gsto
n up
on H
ull,
City
of Kir
klee
s
Leed
s
Nor
th E
ast
Linc
olns
hire
Nor
th L
inco
lnsh
ire
Nor
th Y
orks
hire
Roth
erha
m
Shef
field
Wak
efie
ld
York
, City
of
GC
SE
290
300
310
320
330
340
350
360
370
380
390
Scor
e
5+ A*-C incl English and Maths
5+ A*-C
Score
As identified the use of alternative qualification is widespread within the region and is far more common than in southern regions, nevertheless, there is greater use of alternative qualifications within the North East and to a lesser extent the North West (as indicated in our next graphic). Unfortunately when using the Key Stage 4 (5+ GCSE A*-C including Maths and English) measure the Region still performs lower than any other region (albeit only marginally). Although the use of alternative curricula does not appear to fully explain the Region’s relative underperformance it certainly does show that gap in attainment with the North East is not as acute, as previous analysis had suggested. Our graphic shows the GCSE Points Score by Region for 2006, less the national average (on the right hand axis, as the national average is based on a pupil average there are a majority of regions performing below this average, which would not be the case if we had used a regional average). This clearly shows the northern regions and to a lesser extent those in the midlands are underattaining. The use of the alternative curricula is shown by the red line plotting non-GCSE qualifications (on the left hand axis). Again this shows that the alternative curricula is much more common in northern regions and to a lesser extent the midland regions. We do not believe that this is a causal relationship, nor however, do we believe that the greater use of the alternative curricula is a response to differing labour market conditions in the north.

63
Learning to Succeed: understanding and addressing Key Stage 4 (GCSE) underachievement in Yorkshire and Humber
knowledge management for the information age
Regional Performance over English Average
-20.00
-15.00
-10.00
-5.00
0.00
5.00
North
East
North
West
Yorkshire
and
Humber
East
Midlands
West
Midlands
Eastern London South
East
South
West
Scor
e
-0.03
-0.02
-0.01
0.00
0.01
0.02
0.03
0.04
Alt
eran
tive
GC
SE
2006 Score +/-
+/- Alternative GCSE

64
Learning to Succeed: understanding and addressing Key Stage 4 (GCSE) underachievement in Yorkshire and Humber
knowledge management for the information age
Regional Performance
30%
35%
40%
45%
50%
55%
60%
65%
North
East
North
West
Yorkshire
and
Humber
East
Midlands
West
Midlands
Eastern London South
East
South
West
GC
SE
335
340
345
350
355
360
365
370
375
Scor
e
5+ A*-C incl English and Maths
5+ A*-C
Score
Now that we have access to data on 5+ GCSEs including Maths and English, it is apparent that the regional performance is even less favourable compared with the English average (although not other northern regions) than we had at first believed it to be. This is because the alternative curricula is more widespread in the Region than across England as a whole (but less so than in the other northern regions), so fewer pupils are meeting this new standard than nationally. In fact, if we use a longitudinal analysis of simple value added we find that no LEA in the Region is at the English average, although Sheffield and York are not far behind.

65
Learning to Succeed: understanding and addressing Key Stage 4 (GCSE) underachievement in Yorkshire and Humber
knowledge management for the information age
Comparative (with England) Longtitudinal Simple Value Added
-1.00
-0.80
-0.60
-0.40
-0.20
0.00
0.20
0.40
Barn
sley
Brad
ford
Cal
derd
ale
Don
cast
er
East
Rid
ing
of Y
orks
hire
Kin
gsto
n up
on H
ull
Kir
klee
s
Leed
s
Nor
th E
ast L
incs
Nor
th L
incs
Nor
th Y
orks
hire
Roth
erha
m
Shef
field
Wak
efie
ld
York
Z S
core
Z2004VA
Z2005VA
Z2006VA
Social Segregation within Yorkshire and Humber’s Schools
We have advanced the hypothesis that the presence of children from what we will broadly term middle class families (social grades A and B) in schools is related to a general increase in performance in the school. Importantly, we believe that the presence of these children is related to an increase in performance in children from other backgrounds. There are several ways in which this relationship might be mediated: 1. Children from middle class backgrounds are likely to have better educated
parents and have a better mastery of the English Language (communications) used in teaching. This may increase the language skills of their peers thus enabling greater comprehension of taught material.
2. Parents of middle class families are likely to champion standards at their children’s schools more aggressively than parents from other backgrounds. This may express itself through greater demands on teaching staff, or greater support for fundraising and extra-curricular activities.
“The parents have to have the ambition.” Headteacher in High Attainment School 3. Children from middle class backgrounds are likely to have higher career
aspirations than children from other backgrounds, and to value education more highly. This difference in attitude may spread to their peers, increasing motivation to study.
“Go to University become a barrister.” Pupil at High Attainment School A further but more contentious explanation that has been advanced, and which is the received wisdom amongst some educational sociologists, is that the education system systemically discriminates against the working class. Whilst this may seem an anathema to many liberal teachers, we hypothesise that introducing pupils to a

66
Learning to Succeed: understanding and addressing Key Stage 4 (GCSE) underachievement in Yorkshire and Humber
knowledge management for the information age
middle class value system is central to our education system. In fact, if we accept that we live in a meritocracy then education is arguably the key to becoming middle class. There is a lively debate to be had around this issue, although it is not likely to be one that is resolved, or that is critical to this research. Just as some would argue that education promotes middle class values should be a tautology rather than a surprise, others would suggest that say, the laws of mathematics or science, are surely givens rather than value loaded. We tried to estimate the impact of middle class families directly from the National Pupil Database. Unfortunately, it is possible only to estimate this using Census data for the pupil’s Lower Super Output Area of residence. The DfES data was merged with the 2001 Census results for Socio-Economic Class, using the Lower Super Output Area of pupil residence. This gave a measure of the proportion of each social class in each pupil’s neighbourhood. Using this, we calculated the proportion of households in professional and managerial occupations in the neighbourhood of each pupil. Taking the mean of this measure by institution gave us an estimate of the predominance of children from middle class families in each school. Our hypothesis is that the presence of middle class families in schools improves the attainment of those from other backgrounds. We expected, however, that children from middle class families would tend to perform better than their peers. This is borne out by the data, the neighbourhood measure shows a correlation of r = 0.34 (p<0.001) with Key Stage 4 performance. In the light of this finding, we ran partial correlations of the school class measure with Key Stage 4 attainment, compensating for the neighbourhood class measure. We attempted to estimate the amount of variance in Key Stage 4 attainment attributable to the presence of middle class families in the school, allowing for the direct impact this was likely to have on the children of those families. The results were satisfactory, with a partial correlation of r = 0.12 (p<0.001). This indicates that there is a statistically significant effect of the presence of middle class families in schools over and above the direct effect on their children’s performance. However, it is difficult to assess the significance of this (in the broad sense) because the data allows us to measure the impact only indirectly.
We also constructed a Dissimilarity Index by taking the proportion of residents from social grade D, divided by the national average, from the proportion at social grades A and B, divided by the national average at Lower Super Output Level (we also constructed a Segregation Index using social grade D and found this to be slightly more reliable, although chose to report on the more commonly used Dissimilarity Index).
α+β − δ Α+Β ∆
This appears to provide a good explanation for the underperformance of northern regions over other regions (although Income Deprivation actually performs better in distinguishing the north from the south, our Dissimilarity Index is better at

67
Learning to Succeed: understanding and addressing Key Stage 4 (GCSE) underachievement in Yorkshire and Humber
knowledge management for the information age
distinguishing the northern regions from the south and the midlands), but not the relative differences by region. Nevertheless our Dissimilarity Index is an imprecise tool, affected as much by the geographies and size of Lower Super Output Areas and LEAs as the actual social segregation within an area. For example although Hull shows a very high level of segregation (as indeed do other Unitary Authorities such as Leicester and Stoke-on-Trent compared to a more positive mix in the case of Wokingham and London Boroughs including the City and Richmond), Sheffield does not, despite it instinctively appearing to be a highly socially segregated city. “We can’t do much about our social mix.” Advisor in Low Attainment LEA Furthermore, as Gorard and Smith (2004) point out, segregation is not particularly high in English schools when compared with other nations.
Value Added and Social Segregation in Yorkshire and the Humber
-0.60
-0.40
-0.20
0.00
0.20
0.40
0.60
Barn
sley
Don
cast
er
Roth
erha
m
Shef
field
Brad
ford
Cal
derd
ale
Kir
klee
s
Leed
s
Wak
efie
ld
Kin
gsto
n up
on H
ull,
City
of
East
Rid
ing
of Y
orks
hire
Nor
th E
ast L
inco
lnsh
ire
Nor
th L
inco
lnsh
ire
York
Cra
ven
Ham
blet
on
Har
roga
te
Rich
mon
dshi
re
Ryed
ale
Scar
boro
ugh
Selb
yZ S
core
Value Added
Dissimilarity Index AB-D

68
Learning to Succeed: understanding and addressing Key Stage 4 (GCSE) underachievement in Yorkshire and Humber
knowledge management for the information age
Regional Attainment
-0.25
-0.20
-0.15
-0.10
-0.05
0.00
0.05
0.10
0.15
0.20
0.25
North
East
North
West
Yorkshire
and the
Humber
East
Midlands
West
Midlands
Eastern
Region
London South East South
West
Z S
core
32%
32%
33%
33%
34%
34%
35%
35%
36%
36%
37%
37%
GC
SE
VA
DI AB-D
GCSE
Gorard (2000) appears to reach a similar conclusion about social segregation when investigating the effects of Welsh language medium schools in Wales, although does not comment on the overall effects of such segregation on average performance. A further test we applied was the Kurtoisness6 of the distribution of attainment by schools within each LEA. Although it is possible that this is simply measuring the variations in attainment within schools (possibly related to the number of schools within an LEA) and not some form of social segmentation, direct selection, or indirect selection resulting from the property market, we concluded that it also provided a reasonable measure of the level of segregation within schools. In fact, the DCSF’s own multi-level models use a measure of distribution (Standard Deviation) at Key Stage 3 to estimate attainment at Key Stage 4 (with a coefficient of -5.45; Standard Deviation and Kurtoisness are negatively related). This showed that segregation is highest in Barnsley and Wakefield and lowest in Rotherham. Overall it does explain some of the variation by LEA, but not everything, for example North East Lincolnshire appears to be underperforming, even though the levels of social segregation are not as high as other LEAs, whilst the East Riding appears to be performing extremely well.
6 Kurtosis is a statistical measure of distribution around a mean. If a data set is more kurtosis it is more evenly spread and closer to the mean, whereas lower kurtoisness would equate to a more skewed and less consistent range of data.
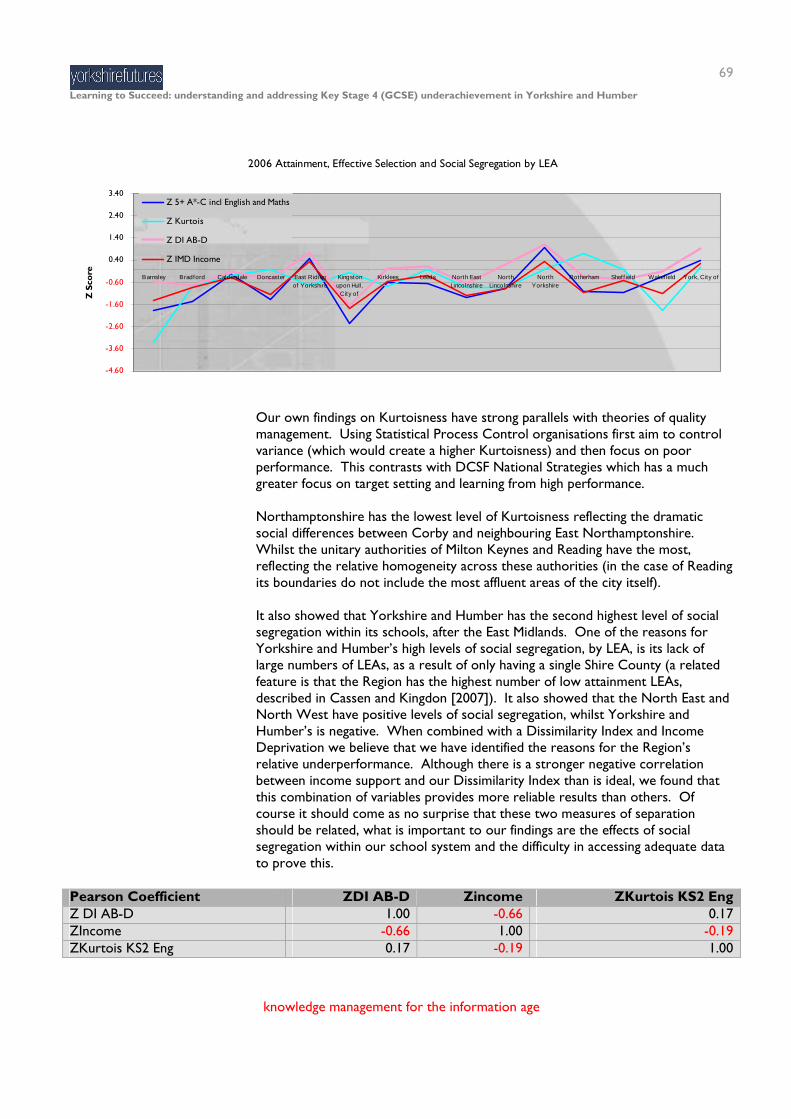
69
Learning to Succeed: understanding and addressing Key Stage 4 (GCSE) underachievement in Yorkshire and Humber
knowledge management for the information age
2006 Attainment, Effective Selection and Social Segregation by LEA
-4.60
-3.60
-2.60
-1.60
-0.60
0.40
1.40
2.40
3.40
Barnsley Bradford Calderdale Doncaster East Ridingof Yorkshire
Kingstonupon Hull,
City of
Kirklees Leeds North EastLincolnshire
NorthLincolnshire
NorthYorkshire
Rotherham Sheff ield Wakef ield York, City of
Z S
core
Z 5+ A*-C incl English and Maths
Z Kurtois
Z DI AB-D
Z IMD Income
Our own findings on Kurtoisness have strong parallels with theories of quality management. Using Statistical Process Control organisations first aim to control variance (which would create a higher Kurtoisness) and then focus on poor performance. This contrasts with DCSF National Strategies which has a much greater focus on target setting and learning from high performance. Northamptonshire has the lowest level of Kurtoisness reflecting the dramatic social differences between Corby and neighbouring East Northamptonshire. Whilst the unitary authorities of Milton Keynes and Reading have the most, reflecting the relative homogeneity across these authorities (in the case of Reading its boundaries do not include the most affluent areas of the city itself). It also showed that Yorkshire and Humber has the second highest level of social segregation within its schools, after the East Midlands. One of the reasons for Yorkshire and Humber’s high levels of social segregation, by LEA, is its lack of large numbers of LEAs, as a result of only having a single Shire County (a related feature is that the Region has the highest number of low attainment LEAs, described in Cassen and Kingdon [2007]). It also showed that the North East and North West have positive levels of social segregation, whilst Yorkshire and Humber’s is negative. When combined with a Dissimilarity Index and Income Deprivation we believe that we have identified the reasons for the Region’s relative underperformance. Although there is a stronger negative correlation between income support and our Dissimilarity Index than is ideal, we found that this combination of variables provides more reliable results than others. Of course it should come as no surprise that these two measures of separation should be related, what is important to our findings are the effects of social segregation within our school system and the difficulty in accessing adequate data to prove this.
Pearson Coefficient ZDI AB-D Zincome ZKurtois KS2 Eng Z DI AB-D 1.00 -0.66 0.17 ZIncome -0.66 1.00 -0.19 ZKurtois KS2 Eng 0.17 -0.19 1.00
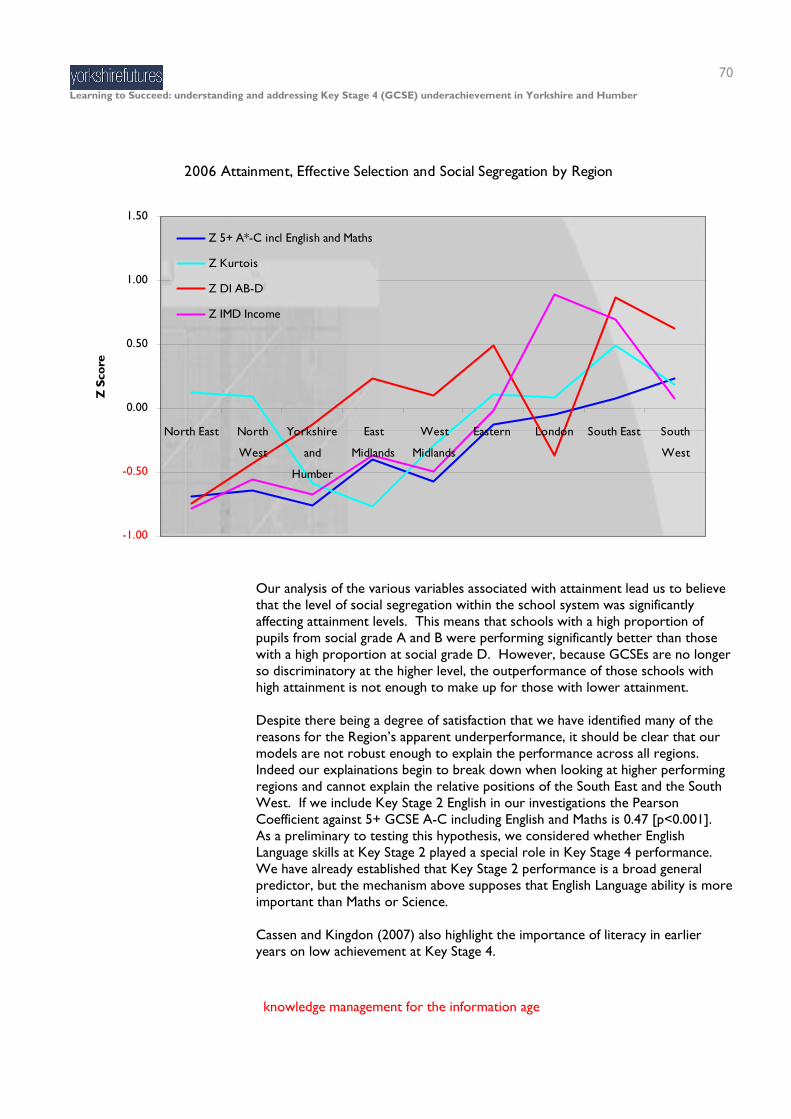
70
Learning to Succeed: understanding and addressing Key Stage 4 (GCSE) underachievement in Yorkshire and Humber
knowledge management for the information age
2006 Attainment, Effective Selection and Social Segregation by Region
-1.00
-0.50
0.00
0.50
1.00
1.50
North East North
West
Yorkshire
and
Humber
East
Midlands
West
Midlands
Eastern London South East South
West
Z S
core
Z 5+ A*-C incl English and Maths
Z Kurtois
Z DI AB-D
Z IMD Income
Our analysis of the various variables associated with attainment lead us to believe that the level of social segregation within the school system was significantly affecting attainment levels. This means that schools with a high proportion of pupils from social grade A and B were performing significantly better than those with a high proportion at social grade D. However, because GCSEs are no longer so discriminatory at the higher level, the outperformance of those schools with high attainment is not enough to make up for those with lower attainment. Despite there being a degree of satisfaction that we have identified many of the reasons for the Region’s apparent underperformance, it should be clear that our models are not robust enough to explain the performance across all regions. Indeed our explainations begin to break down when looking at higher performing regions and cannot explain the relative positions of the South East and the South West. If we include Key Stage 2 English in our investigations the Pearson Coefficient against 5+ GCSE A-C including English and Maths is 0.47 [p<0.001]. As a preliminary to testing this hypothesis, we considered whether English Language skills at Key Stage 2 played a special role in Key Stage 4 performance. We have already established that Key Stage 2 performance is a broad general predictor, but the mechanism above supposes that English Language ability is more important than Maths or Science. Cassen and Kingdon (2007) also highlight the importance of literacy in earlier years on low achievement at Key Stage 4.

71
Learning to Succeed: understanding and addressing Key Stage 4 (GCSE) underachievement in Yorkshire and Humber
knowledge management for the information age
“A significant part of our findings has been the extent to which poor reading and writing skills at primary school are associated with later low attainment…” The difficulty in testing this hypothesis is that the three measures (English, Maths and Science scores at Key Stage 2) are highly correlated:
Correlations English Maths Science English 1.00 0.73 0.73 Maths 0.73 1.00 0.77 Science 0.73 0.77 1.00
We therefore performed partial correlations between the Key Stage 4 performance and the three separate Key Stage 2 scores, controlling for the Key Stage 2 total score, to estimate the degree to which each individual score contributed to Key Stage 4 performance. We found that the Key Stage 2 English score was correlated positively with Key Stage 4 performance (r = 0.16, p<0.001) while Maths and Science scores were correlated negatively. The negative correlations may well be artefactual, but the pattern of correlations does support the hypothesis that English skills at Key Stage 2 play a special role in predicting Key Stage 4 performance. Our next analysis considered the impact of high performers in English on other students. That is, do high performers at Key Stage 2 English actually boost the performance of their peers at Key Stage 4? To test this hypothesis, we split the sample into two groups, the top quartile of Key Stage 2 English performers and the rest. We then calculated the proportion of high performers (the top quartile, those scoring more than 70) in each establishment for which Key Stage 4 results were available and associated these with pupil records. This meant that, for each pupil, we had a measure of the presence of high performers in Key Stage 2 English in their environment (which we called the ‘English Environment Measure’ or ‘EEM’). We then correlated the EEM with Key Stage 4 performance, limiting our analysis to the lower 75% of Key Stage 2 performers. The results were consistent with our hypothesis, with Key Stage 4 performance positively correlated with the EEM (r = 0.39, p<0.001). One explanation for this, however, is simply that schools with more high English attainers have these because they have, in general, higher Key Stage 2 scores in their intake. Indeed, Key Stage 2 total points was found to correlate with the EEM (r = 0.26, p<0.001). We therefore performed a partial correlation of Key Stage 4 performance with the EEM, compensating for Key Stage 2 total points. This showed a reduced, but still significant correlation (r = 0.24, p<0.001). This suggests that, as hypothesised, high performers in English do indeed boost the performance of their peer group. To make this point more vividly, we asked how the EEM impacted on the performance of pupils (using the National Pupil Database) with average Key Stage 2 scores, using a narrow range of Key Stage 2 scores to control for the fact that schools with high EEM tend to have higher Key Stage 2 scores than those with lower EEM. Our first step was to establish four EEM bands based on quartiles of the distribution of EEM scores across institutions:

72
Learning to Succeed: understanding and addressing Key Stage 4 (GCSE) underachievement in Yorkshire and Humber
knowledge management for the information age
EEM Band Percentile Proportion of high performers >= Cases (whole sample) 1 0th 0% 21,641 2 25th 2.7% 176,770 3 50th 14.6% 245,291 4 75th 25.3% 220,952
We then restricted our attention to pupils who were both in the lower performing group for English and had a Key Stage 2 total points score of between 105 and 115 (a narrow range around the mean; n = 10,729, that is the number in the sample). For this group, we examined the averages of both the Key Stage 2 and Key Stage 4 performance measures:
EEM Band 1 2 3 4 KS4 0.37 0.57 0.617 0.91 KS2 110.05 110.16 110.21 110.26
These figures show that there is a marked and steady increase in Key Stage 4 performance as EEM increases, while Key Stage 2 performance hardly changed (note that the Key Stage 4 measure has a range of 0-15 while the Key Stage 2 measure has a range of 0-300). An analysis of variance confirms this: while there is no significant difference between Key Stage 2 scores for the four bands, the change in Key Stage 4 scores is significant (p<0.001). A more dramatic demonstration can be found by considering pupils with Key Stage 2 scores of 204-207 (n = 19,601):
EEM Band 1 2 3 4 KS4 2.16 4.20 5.28 6.24 KS2 205.50 205.46 205.47 205.50
Here we see the number of GCSE passes more than double between the lowest and highest EEM bands, even though the Key Stage 2 performance is not significantly different. Again, analysis of variance confirms this observation, with no significant differences in Key Stage 2 score but Key Stage 4 performance improving significantly (p<0.001). Of course attainment in English at an early stage should be very important in determining attainment at Key Stage 4 (such as Key Stage 1, maybe even more important, but we did not have access to this data). Here we see that Yorkshire and Humber has the lowest levels of Kurtoisness at Key Stage 2 English and that despite low level of Kurtoisness at Key Stage 4, at Key Stage 2 the East Mildands Region is around average. The evidence that Yorkshire and Humber has the lowest level of Kurtoisness at Key Stage 2 is entirely consistent with our view that social segreation is higher across the region’s neighbourhoods than in other regions. The reason why East Midlands overtakes Yorkshire and Humber at Key Stage 4 is that when looking at the larger geographies of secondary school catchments, the evident north-south divide that is apparent in that region, became more important than the neighbourhood social segreation.

73
Learning to Succeed: understanding and addressing Key Stage 4 (GCSE) underachievement in Yorkshire and Humber
knowledge management for the information age
2006 Attainment, Effective Selection and Social Segregation by Region
-1.00
-0.50
0.00
0.50
1.00
1.50
North East North West Yorkshire andHumber
East M idlands West M idlands Eastern London South East South West
Z S
core
Z 5+ A*-C incl English and Maths
ZKS2English Kurt
Z DI AB-D
Z IMD Income
Looking at Key Stage 2 English SATs, Hull stands out as having very low levels of Kurtoisness, which could go some way to explaining Hull’s poor performance, particularly in later years at Key Stage 4. In fact, Hull’s distribution for Key Stage 2 English is far from normal, being closer to binomial and therefore vindicating our use of Kurtoisness. In addition, the LEA have already in place a strategy for improving low attainment in Key Stage 2 English, which appears to be producing some benefits. Interestingly Sheffield now shows low levels of Kurtoisness adding to our suspicions that it is indeed a highly socially segregated city. Other LEAs with very low levels of Kurtoisness include Middlesbrough, Manchester and Portsmouth, all LEAs with very low attainment at Key Stage 4. Although high levels of Kurtoisness can be found in better performing London Boroughs, there are some good but not outstanding performing LEAs in the south with low levels as well. In addition, London has high Kurtoisness, as a result of its neighbourhoods being socially mixed and pupils travelling across neighbourhoods to attend primary schools. The reason for the difference between Key Stage 2 and Key Stage 4 Kurtoisness is that primary school catchment areas are much smaller than those for secondary schools. Therefore, we appear to have found that whilst the Region does have high levels of social segregation, these can manifest themselves across quite small geographical areas (neighbourhoods) and not simply between sub-regions.

74
Learning to Succeed: understanding and addressing Key Stage 4 (GCSE) underachievement in Yorkshire and Humber
knowledge management for the information age
2006 Attainment, Effective Selection and Social Segregation by LEA
-4.60
-3.60
-2.60
-1.60
-0.60
0.40
1.40
2.40
3.40
Barnsley Bradford Calderdale Doncaster East Ridingof Yorkshire
Kingstonupon Hull,
City of
Kirklees Leeds North EastLincolnshire
NorthLincolnshire
NorthYorkshire
Rotherham Sheff ield Wakef ield York, City of
Z S
core
Z 5+ A*-C incl English and Maths
ZKS2English Kurt
Z DI AB-D
Z IMD Income
We constructed a similar (but not identical) model based on the National Pupil Database. This enabled us to construct a new Dissimilarity Index using the Lower Super Output Areas social grades for each primary school. This model casts some doubts on our view that the Kutoisness of Key Stage 2 English results is related to social segregation in schools. This is because in using this indicator primary schools, in the North East and West Midlands are more segregated than those in Yorkshire and Humber. Indeed, we know that the North East had a less positive Dissimilarity Index than Yorkshire and Humber at Lower Super Output Area level, so it really should come as no surprise that it does for the LSOA of where primary schools are located. We would be interested in seeing real data on social grades for each pupil, rather than these inputted values. Given that the imputting of the Dissimilarity Index on the National Pupil Database contains an ecological fallacy we are not particularly concerned by this observation. Nevertheless it does identify that the English Environment Score is lower in the Region than in the North East, confirming our views on the importance of the distribution of ability in English. In addition, the new model does broadly support our conclusions developed from Lower Super Output Area based model.

75
Learning to Succeed: understanding and addressing Key Stage 4 (GCSE) underachievement in Yorkshire and Humber
knowledge management for the information age
Model Based on the National Pupil Database
0.00
5.00
10.00
15.00
20.00
25.00
30.00
35.00
40.00
North East North West Yorkshire and
the Humber
East Midlands West Midlands East of England London South East South West
Att
ainm
ent
-0.20
-0.15
-0.10
-0.05
0.00
0.05
0.10
0.15
0.20
0.25
0.30
Mid
dle
Cla
ss E
nvri
nom
ent
KS2 School Dissimilarity Index (weighted bynumber of pupils)English Environment Score
KS4 Points Z Score
Indicator of Middle Class School Environment
We therefore, believe that had we more fully investigated the influence of parental choice, selection and quasi selection across LEAs of vastly differing sizes we may have arrived at a universal model. As stated in our methodology, because data has been taken and investigated from a variety of levels we cannot provide a full statistical description of our model. However, a multiple regression based on average points score for Lower Super Output Area produces an adjusted r2 of 0.57 (that is our model can explain 56.76% of the variance or r = 0.75). As the data on the Kurtoisness of Key Stage 2 English results measures the distribution of results by school within an LEA, they really should not have been included in this model, however, we have kept them in to illustrate the relationship (nevertheless this results in a high p value of 0.26). Interestingly, the adjusted r2 for our model is nearly identical to the regression model for the DCSF’s own CVA model. In fact, we developed numerous models with similar levels of reliability and even one with a higher r2 of 0.59 (or 58.70% of the variance, r = 0.77), using the slightly higher correlated IMD Income Deprivation Domain, which had the added benefit of being available at the Lower Super Output Area level. This suggests that if we had been able to include other data items like prior attainment, gender, ethnicity and movements between schools we would have been able to develop a more accurate model than that is currently used. As this would be well beyond our original brief we have not done so, but it certainly suggests that the variables that we have identified should be included in future CVA models. Although in fairness to the DCSF multi-level model, they are theoretically less likely to suffer from ecological fallacy, than regression models. The important features to look for in these models are the r and p values and the coefficients themselves.

76
Learning to Succeed: understanding and addressing Key Stage 4 (GCSE) underachievement in Yorkshire and Humber
knowledge management for the information age
Regression Model of Average Point Score at Key Stage 4, using Lower Super Output Area Data Regression Statistics Multiple R 0.753433 R Square 0.567661 Adjusted R Square 0.567621 Standard Error 0.656775 Observations 32,482
ANOVA Df SS MS F Significance F Regression 3 18,394.5 6,131.5 14,214.56 0 Residual 32,478 14,009.5 0.431353 Total 32,481 32,404
Coefficients Standard Error t Stat P-value Lower 95% Upper 95% Intercept 0.011159 0.003647 3.059806 0.002217 0.004011 0.018307 Z DI AB-D 2.213266 0.02381 92.95607 0 2.166598 2.259934 Zincome -2.56995 0.033566 -76.5647 0 -2.63574 -2.50416 ZKurtois KS2 Eng* 0.004647 0.004094 1.135114 0.256336 -0.00338 0.012671 * Data relates to Differences between Schools within an LEA which results in a high p-value
Regression Model of Average Point Score at Key Stage 4, using Lower Super Output Area Data (IMD model) Regression Statistics Multiple R 0.766214 R Square 0.587084 Adjusted R Square 0.587046 Standard Error 0.641843 Observations 32,484 ANOVA
df SS MS F Significance F Regression 3 19,024.46 6341.485 15,393.35 0 Residual 32,480 13380.54 0.411963 Total 32,483 32,405
Coefficients Standard Error t Stat P-value Lower 95% Upper 95% Intercept 0.421496 0.00738 57.11217 0 0.40703 0.435961 Z KS2 0.184208 0.004802 38.35692 0 0.174795 0.193621 Z IMD Income -3.65916 0.056135 -65.1847 0 -3.76919 -3.54913 Z DI AB-D 1.607731 0.027026 59.48859 0 1.554759 1.660702
However, neither our model, nor those from DCSF are particularly reliable. Ray (2006) argues that because the DCSF model used Key Stage 2 results that have a five year lag to forecast Key Stage 4, this level of reliability is acceptable (in fact by psychometric standards they are very reliable). Because we did not use Key Stage 2 attainment we cannot wholeheartedly make the same claim. It is, however, our belief that the low level of reliability is due to: 1. The overall unreliability of attainment data. In particular we used Key Stage
4 average scores and not our preferred measure of percentage achieving 5+ GCSEs including Maths and English, due to a lack of data availability;
2. The problems of modelling across a number of levels, especially when not using multi-level modelling;

77
Learning to Succeed: understanding and addressing Key Stage 4 (GCSE) underachievement in Yorkshire and Humber
knowledge management for the information age
3. The impreciseness of the data we used to estimate the level of social segregation within schools.
Nevertheless we believe that if the National Pupil Database contained actual data on pupils’ social grade, we feel confident that we could have constructed a highly reliable model based on social segregation within primary schools. Interestingly Cassen and Kingdon (2007) were researching the reasons for low achievement at an almost identical time to our own study. Like our study much of their data is from PLASC and like ourselves they are concerned with primary school English attainment, social class and social segregation. Although they do not bring their findings together in a model like ours, there are few areas of disagreement between our respective conclusions.
A Final Observation Ethos was frequently mentioned during our visits to schools. It also felt apparent that in some schools there was an ethos of achievement and a desire to learn and in others an ethos of resignation and a rejection of a set of values related to attainment and achievement. Our strong belief is that such attitudes are influenced by the labour market (or at least the perceptions of it). For those who believe they have a good future (or in a few cases need to escape from a poor future) attainment and achievement are paramount. Others feel that their labour market position is set and that educational attainment is unlikely to influence this. Social grade approximates to such attitudes, even though there are some considerable variations to this. In the main, schools with a high proportion of social grades A and B have this learning ethos and those that are mainly D’s do not. When visiting those schools that lacked this ethos, a general malaise was in evidence of pupils and teachers being resigned to underachievement. In fact, the struggle to get pupils to comply with a regime (especially the National Curriculum) that seemed alien and remote to their previous experience and their assessment of their future prospects, reminded us of the struggles to impose urban living and the factory system on the rural poor, so expressively described by Edward Thompson (1970) in The Making of the English Working Class. By contrast when pupils are offered an appropriate curricula and taught in an exciting way the obvious motivation that we observed was a credit to the schools and teachers we met. In many respects this was more reminiscent to scenes from Alan Bennett’s film The History Boys. Obviously for many schools the reality lies between these two metaphors and daily life at the school involves a constant negotiation between the learning ethos and minor challenges to the authority of teachers. Our data suggests that social segregation in the Region’s primary schools is adversely affecting this ethos within the Region’s secondary schools. The current measures we have for this are imprecise, but the distribution of Key Stage 2 English results (measured by Kurtoiseness) shows the Region’s primary schools to be the most segregated within the UK. This is consistent with a region in which social segregation manifests itself neighbourhood by neighbourhood, rather than

78
Learning to Succeed: understanding and addressing Key Stage 4 (GCSE) underachievement in Yorkshire and Humber
knowledge management for the information age
at an LEA level, as is the case in the East Midlands, or street by street as is the case in the London region. Clearly any measures to reduce this social segregation, including the location of new schools will have a positive impact on attainment within the Region.

79
Learning to Succeed: understanding and addressing Key Stage 4 (GCSE) underachievement in Yorkshire and Humber
knowledge management for the information age
7 Conclusions and Recommendations
Attainment Measures, Targets and Indicators
The desire to use targets to set ambitious directions for continuing improvement in education and to use monitoring to assess progress is both understandable and valid. However, it appears that attainment measures, statistics and testing have become too rigorous and complex. In some cases chasing specific targets or league table positions may unhelpfully skew or limit what a child is taught, or create an incentive to focus on those children who are marginal in terms of whether or not they will meet the benchmark of securing five good GCSEs. This situation risks undermining a focus on the ‘whole child’ and the progress of the whole school population. Furthermore, there is mixed evidence about the use of alternative curricula. From one angle they can provide a more appropriate and relevant curriculum that affords children a better chance of at least some academic success. From another, they can provide a way of attaining the five good GSCEs or equivalent benchmark without a pupil having to achieve core subjects (notably English and Maths) that employers value. Recommendations 1 Promote the case for using the indicator of five GCSEs at A*-C including
English and Maths as the main benchmark that is reported on (including in regional indicator sets) coupled with a wider indicator (such as based on total GCSEs passed per pupil) that depends upon the success of the vast majority of pupils, including those who are likely to far exceed or fall below the five good GCSEs benchmark.
2 Use alternative curricula positively but carefully in a child centred rather
than target centred way. This means balancing the benefits of young people attaining qualifications most valued by employers with the need to maximise their chances of gaining qualifications to keep them engaged and prevent them being labelled as a failure. In addition, put a focus on enlivening the core curriculum through the encouragement of teaching methods, content, and activities that motivate and stimulate children. The recent streamlining of the core curriculum should assist in this respect, and appropriate support for teachers, professional development and exchange of good practice will help further.
Societal versus School Based Factors Affecting Attainment Statistical analysis suggests there is far more variability in attainment within schools than between them. In this research, only 7% of attainment could be attributed to school level issues, and other research broadly concurs, with Cassen and Kingdon (2007) pointing to 14% of low achievement being attributable to school quality. Naturally the limits of what statistics can and cannot easily measure should be borne in mind (e.g. teaching quality is difficult to define and measure and will vary within as well as between schools). However, the case that there needs to be a strong and increased focus on societal factors is compelling.

80
Learning to Succeed: understanding and addressing Key Stage 4 (GCSE) underachievement in Yorkshire and Humber
knowledge management for the information age
The Importance of English Language
Performance in English Language at Key Stage 2 has a strong impact on subsequent overall performance at Key Stage 4. This reflects the importance of good communication skills in both learning and passing exams, as well as in the labour market thereafter. Experience of English Language within the home and community will vary and have an impact upon this. However, it appears that those who do not speak English as a first language actually make more progress than average between Key Stages 2-4, certainly compared to white working class children, especially boys. Yorkshire and Humber currently has the lowest attainment at Key Stage 2 English within the country. Given the broad and strong influence of this factor on subsequent success, improving performance in English Language from early years onwards is likely to be critical to improving Key Stage 4 attainment across the board. Recommendation 3 Place additional emphasis on English Language and communication skills
within schools generally, especially for primary schools and pupils with low Key Stage 2 attainment.
Deprivation, Social Class and Segregation Societal factors that appear to be most strongly connected to performance relate to deprivation, but also and more strongly to social background/class and the degree of segregation within schools and society. Children with parents from social classes A and B (professional and managerial occupations) on average have notably higher attainment than those from social classes E and (especially) D. The presence of a reasonably high number of pupils from AB backgrounds within a school appears to raise performance of those from other backgrounds more than the converse. A greater degree of segregation within a school, an LEA or a region overall correlates to lower overall attainment. The degree of segregation in this region, especially within primary schools, is amongst the highest nationally and this is a key factor in explaining its underperformance. Thus achieving more balanced, less segregated populations within schools is likely to raise overall performance. There is no reason to suggest that the strong link between average performance and social class is due to social background or occupation in itself, and the educational achievement of so many individual pupils from what would be statistically lower performing backgrounds prove it is far from a given. However, it is evident that there are factors often associated with social class that can mitigate against educational attainment. There is a strong argument that experience and perceptions of the labour market is key amongst these (as discussed in the next point). Furthermore, it is credible that other factors based on aspirations and expectations, parents’ own education, language, attitudes and peer pressures, as well as incomes could be significant. Anything that creates positive ambitions amongst children and young people, promotes a culture where learning is valued, and environments conducive to direct or indirect learning will be of value from early years onwards.

81
Learning to Succeed: understanding and addressing Key Stage 4 (GCSE) underachievement in Yorkshire and Humber
knowledge management for the information age
Recommendations 4 Any increase in selection of pupils by schools is likely to increase
segregation and by implication worsen overall performance. Selection should be avoided unless there are very pressing reasons and strong evidence that override this presumption.
5 Strive to locate new schools so that their local catchment areas span mixed
communities and hence attract a well-balanced intake of pupils. Planning, especially of housing and neighbourhoods is also a key tool in creating more balanced communities long term.
6 Carefully review and adopt systems for allocating pupils to schools to
reduce segregation and improve attainment, whilst retaining sufficient local support to be sustainable. For instance for higher performing schools, a system that combined a modestly sized, core local catchment area with a wider catchment area where places are awarded randomly between prospective pupils may have potential. Especially if safeguards are built in regarding maximum travelling distances and the ability of siblings to attend the same school.
7 Continue to support and place extra emphasis on early learning, parental
engagement and on enhancing home learning environments. Where needed and desired this could include helping parents to improve their own reading, writing and numeracy skills and to support their children’s learning more fully and effectively.
Perceptions of the Labour Market There is strong evidence that the labour market itself, or more accurately perceptions of the labour market, influences the opportunities that pupils perceive to be available and the value they place on education. As pupils cannot be expected to have perfect knowledge about the job opportunities available (locally or beyond) the experiences and messages they receive from their parents, as well as wider friends, family, communities and the media are likely to shape what labour market opportunities they believe there to be. These perceptions can be outdated and inaccurate, especially in areas where economies have improved or where the type of jobs and their skills requirements have changed with a move towards a more service based, knowledge economy. There is some evidence that even within schools, some teachers underestimate the job opportunities available to their pupils, and relay less positive messages than they might (unconsciously or otherwise) about the opportunities available. Media stories about employment (which will often focus on closures more than more incremental job gains that have outweighed them in recent years) may further dampen perceptions and ambitions.

82
Learning to Succeed: understanding and addressing Key Stage 4 (GCSE) underachievement in Yorkshire and Humber
knowledge management for the information age
Recommendations 8 Continue to implement the Regional Economic Strategy and make progress
in transforming the reality of the economy and labour markets, in especially those areas facing the greatest economic challenges and /or trapped within a low skills equilibrium.
9 Strongly communicate positive information about changing local economies
and new job opportunities to schools, teachers and parents so that perceptions of labour markets are more positive and factual, especially in areas which have experienced changing labour markets or economic problems.
10 Promote role models within schools and communities, such as business
people, successful people from sports or culture, or those who have made a difference in their communities and are from the local area or one like it.
School Resources, Leadership and Ethos Attainment in a school does not appear to be governed by its resources, and outside London, there is not a strong positive correlation between resources and attainment. However, there are cases where increases in resources specifically linked to boosting attainment have achieved just that. There is some case based evidence that allowing schools flexibility in how they use these resources to increase performance can contribute to their success. Good leadership in schools is widely credited to have a strong role in achieving success, although that may be overstated given the impact that societal factors also have on attainment within a school. A positive school ethos, linked to leadership but also the culture amongst the pupils and teaching staff, emerged strongly as a characteristic of high attainment schools. It was hard to define this specifically, but in high attainment schools, this tended to go with a belief in the ‘whole child’ more than focusing on specific attainment targets and a positive culture towards learning and achievement. In schools with lower performance, however, a focus on increasing attainment per se did tend to have a more positive role. Recommendation 11 Conduct and apply further research into what constitutes positive
leadership and a good ethos within schools, how this might vary by the type of school and its circumstances, and how to nurture this.
Teaching Quality, Content and Techniques The importance of ‘good’ teachers was nearly universally recognised as a key factor by headmasters, chiming with popular opinion and most people’s subjective experiences of school. Because this is not easily quantified, it does not emerge within statistical analysis and risks being understated, for instance if seen only as part of the 7% of attainment that is attributable to variation between schools.
83
Learning to Succeed: understanding and addressing Key Stage 4 (GCSE) underachievement in Yorkshire and Humber
knowledge management for the information age
However, there is a strong case that although there may be variation in teaching quality between schools, there may be greater variation within schools – which would accord with many people’s experience of having had excellent and less good teachers themselves at school, who they felt made a real difference to their achievement. If this argument holds true, then the importance of attracting excellent teachers to schools facing the greatest challenges is great, both in terms of exam pass rates and infusing pupils with a passion for learning. Some excellent teachers will be attracted by the challenge; and what constitutes a ‘good’ teacher may well vary by school and circumstance. Nevertheless, there is a risk that underperforming schools in difficult areas will face the biggest challenges in recruiting and retaining good teachers. This is an area that would benefit from further analysis and investigation, with any interventions developed in accordance with results. Recommendation 12 Further explore the nature and impact of teachers and teaching within
different school environments, and how far exposure to the best teachers makes a difference to performance and variation within as well as between schools.

84
Learning to Succeed: understanding and addressing Key Stage 4 (GCSE) underachievement in Yorkshire and Humber
knowledge management for the information age
Bibliography
Alker, H. (1969) ‘A Typology of Ecological Fallacies’ in Dogan, M. and Rokkan, S. (eds) Quanriratile, Ecological Fallacy in the Social Science, Cambridge MA, MIT Press. Allen, R. and Vignoles, A. (2006) What Should an Index of School Segregation Measure? London School of Economic, Centre for the Economic of Education. Ashrad, R. et al (2004) Monitoring Ethic Pupils Experiences of School in Scotland (MEPESS), Edinburgh, Centre for Education for Racial Equality in Scotland. Bartholomew, J. (2006) The Welfare State we’re in, Oxford, Blackwell. Bhattacharyya, G., Ison, L. and Blair, M. (2003) Minority Ethnic Attainment and Participation in Education and Training the Evidence, London, DfES. Blanden, J. and Gregg, P. (2004) Family Income and Educational Attainment: A Review of Approaches and Evidence for Britain, London School of Economics, Centre for the Economics of Education. Bryan, R., Treanor, M. and Hill, M. (2007) Evaluation of Pilots to Improve Primary to Secondary Transitions, Edinburgh, Scottish Executive Social Research. Bywater, M. (2006) Big Babies, Or: Why Can’t we Just Grow Up, London, Granta Books. Campbell, M. (2000) Learning Pays and Learning WorKey Stage , London, NACETT. www.cgp.upenn.edu/ope_nclb.html Cassen, R. and Kingdon, G. (2007) Tackling Low Educational Attainment, York, Joseph Rowntree Foundation. Commission Staff Research Report (2006) Growth Models: An examination within the context of NCLB, The Aspen Institute, Commission on No Child Left Behind. Crane, J. (2002) ‘The Promise of Value-Added Testing’, Progressive Policy Institute Policy Report (Nov 2002), Washington DC. Department for Education and Skills (2006) Ethnicity and Education: the evidence on minority ethnic pupils aged 5-16, London, DfES. Desforges, C. and Abouchaar, A. (2003) The Impact of Parental Involvement, Parental Support and Family Education on Pupil Achievement and Attainment: a literature review, London, DfES, Research Report 433. www.dfes.gov.uk/performancetables/schools_04/sec3b.shtml Doran, H. and Izumi, L. (2004) Putting Education to the Test: a value added model for California, San Francisco, Pacific Research Institute. Dyson, A., Farrell, P., Polat, F., Hutchinson, G. and Gallannaugh, F. (2004) Inclusion and Pupil Attainment, London, DfES, Research Report 578. Fielding, A. and Goldtein, H. (2006) Cross-classification and Multiple Membership Structures in Multilevel Models: an introduction and review, London, DfES Research Report 791. Fischer Family Trust (2004) Contextual Value Added Guidance, Cowbridge, Fischer Family Trust. Fischer Family Trust (2005:1) Database –v10.3: report –v1: Results Data – Unamended: Printed – October 2005, Cowbridge, Fischer Family Trust. Fischer Family Trust (2005:2) KS2-KS4 Contextualised Value Added Measures, Cowbridge, Fischer Family Trust. Fitz-Gibbon, C. (1997) The Value Added Project: Final Report, University of Durham. Galindo-Reuda, F. and Vignoles, A. (2004) The Heterogeneous Effect of Selection in Secondary Schools: understanding the changing role of ability, London School of Economics, Centre for Economic Performance. Galton, M., Gray, J. and Ruddock, J. (1999) The Impact of School Transition and Transfers on Pupil Progress and Attainment, London, DfES, Research Report 131. Gilbourne, D. and Mirza, H. (2000) Educational Inequality: mapping race, class and gender, London, OFSTED. Gorard, S. (2000a) Education and Social Justice, Cardiff, University of Wales Press. Gorard, S. (2000b) Questioning the Crisis Account: a review of the evidence for increasing polarization in schools, Education Research, 42, 3, 309-321.

85
Learning to Succeed: understanding and addressing Key Stage 4 (GCSE) underachievement in Yorkshire and Humber
knowledge management for the information age
Gorard, S. (c2000) Underachievement is still an ugly word: reconsidering the effectiveness of schools in England and Wales, School of Social Sciences Working Paper, Cardiff University. Gorard, S. and Fitz, J. (2000) Investigating the Determinants of Segregation Between Schools, Research Papers in Education, 15, 2, 115-132. Gorard, S., Selwyn, N. and Rees, G. (2000) ‘The ‘Conveyor Belt effect’: a re-assessment of the impact of National Targets for Lifelong Learning’, Paper at the British Educational Research Association Annual Conference, Cardiff University. Gorard, S. (2004) Comments on ‘Modelling Social Segregation’ by Goldstein and Noden, Oxford Review of Education, 30, 3, 435-440. Gorard, S. and Smith, E. (2004) What is ‘underachievement’ at school? Scholar Leadership and Management, 24, 2. Gorard, S. (2005) Value-added is of little value, Conference Paper the British Educational Research Association Annual Conference, University of Glamorgan. Gorard, S. (2006) Re-analysing the Value-added of Primary Schools, University of York, Department of Educational Studies Research Paper 2006/02. Gorard, S. (2007:1) What does an index of social segregation measure? A commentary on Allen and Vignoles, University of York, Department of Educational Studies Unpublished Paper. Gorard, S. (2007:2) Does the index of segregation matter? The composition of secondary schools in England since 1996, University of York, Department of Educational Studies Unpublished Paper. Gray, J., Hopkins, D., Reynolds, D., Wilcox, B., Farrell, S. and Jesson, D. (1999) Improving Schools Performance and Potential, Buckingham, Open University Press. Harris, A., Muijs, D., Chapman, C., Stoll, L. and Russ, J. (2003) Raising Attainment in Schools in Former Coalfield Areas, London, DfES, Research Report 423. Hoshin (2002) Engaging Non-Learners, Bradford, LSC West Yorkshire. Hoshin (2004) Research into the Supply of Skills in the West Midlands Engineering and Automotive Sector, Manchester, Hoshin. Hoshin (2005) Evaluation of STEM Activities, Manchester, Hoshin. Hoshin (2006) Evaluation of the Bradford Robotic Telescope, Manchester, Hoshin. Hox, J. (2002) Multilevel analysis: techniques and applications, London, Lawrence Erlbaum. Mouw, T. and Entwisle, B. (2004) Residential Segregation and Interracial Friendship in Schools, University of North Carolina, Working Paper. Newby, L., Kielty, S., Poulter, E. and McLaraty, L. (2007) Young People in Yorkshire and Humber: attitudes, aspirations and attributes for success, Leeds, Yorkshire Futures. New Policy Institute (2006) Monitoring Poverty and Exclusion – 9th edit, London, New Policy Institute. OFSTED (2006) Developments in online school data – important changes for 2006, London, OFSTED. www.ofsted.gov.uk/schools/dataandinformationsystems.cfm Jenkins, A., Levačić, R. and Vignoles, A. (2006) Estimating the Relationship between School Resources and Pupil Attainment at GCSE, London, DfES, Research Report 727. Jenkins, S., Micklewright, J. and Schnepf, S. (2006) Social Segregation in Secondary Schools: how does England compare with other countries? University of Essex, Institute for Social and Economic Research Working Paper 2006-2. Jesson, D. (2000) The Comparative Evaluation of GCSE Value-Added Performance by School Type and LEA, Discussion Paper in Economics 2000/52, University of York. Paterson, L. and Lannelli, C. (2005) Social Class and Educational Attainment: a comparative study of England, Wales and Scotland, University of Edinburgh, Working Paper 2. Pittards, V. and Dunn, J. (2003) The big pICTure: the impact of ICT on attainment, motivation and learning, London, DfES. Price Waterhouse Coopers (2007) Independent Study into School Leadership: Main Report, London, DfES Research Report 818A. Ray, A. (2006) School Value Added Measures in England, London, DfES. Rhode Island Department of Education (c2000) Information WorKey Stage! Technical Brief on the 1999 Statistical Model, Providence RI, The Office of Information Services and Research.
86
Learning to Succeed: understanding and addressing Key Stage 4 (GCSE) underachievement in Yorkshire and Humber
knowledge management for the information age
Robinson, W. (1950) Ecological Correlations and the Behaviour of Individuals, American Sociological Review, 15, 35, 1-357. Saunders, L. and Rudd, P. (1999) ‘Schools’ Use of ‘Value Added’ Data: a science in the service of an art?’, Paper at British Educational Research Association Conference, University of Sussex. Shuttleworth, I. (1994) Studies in Employment Equality Research Report No 3 An Analysis of Community Differences in the Pilot Northern Ireland Secondary Education Leavers' Survey, Queen's University, Belfast, Central Community Relations Unit. Schmitt, J. and Wadsworth, J. (2004) Is There an Impact of Household Computer Ownership on Chidren’s Educational Attainment in Britain?, London School of Economics, Centre for Economic Performance, Discussion Paper 625. Schagen, I. and Schagen, S. (2001) ‘The Impact of Selection on Pupil Performance’, Conference Paper at the NfER Council of Members (Oct 2001). Schagen, I. and Benton, T. (2003) ‘The Relationship Between School and Pupil Background Factors and Progress from Key Stage 1 to Key Stage 2, Conference Paper the British Educational Research Association Annual Conference, Heriot-Watt University. Simpson, L. (2004) ‘Statistics of Racial Segregation: measures, evidence and policy’, Urban Studies 41, 3, 661-681. Smith, P. (1995) ‘The unintended consequences of publishing performance data in the public sector’, International Journal of Public Administration, 18, nos. 2 and 3; and D. Dranove et al., (2002) Is More Information Better? The Effects of Report Cards on Health Care Providers, Cambridge, Mass., National Bureau of Economic Research. SMRS (2005) Evaluation of the National Curriculum Tests: 2005 Test Evaluation: Key Stage 2 English, Maths and Science. Final Report. Manchester, Social and Market Strategic Research Limited. Snijders, T. and Bosker, R. (2004) Multilevel analysis: an introduction to basic and advanced multilevel modelling, Thousand Oaks CA, SAGE. Tanner, H., Jones, S. and Treadaway, M. (1999) ‘Schools that add value: raising standards in mathematics’, Paper presented at the British Educational Research Association Conference, University of Sussex, Brighton. Taylor, C., Goprard, S. and Fitz, J. (2000) ‘A Re-Examination of Segregation Indices in Terms of Composition Invariance, Social Research Update 30, University of Surrey. Taylor, J. and Nguyen, A. (2006) An Analysis of Value Added by Secondary Schools In England: is the value added indicator of any value? Working Paper, University of Lancaster, Department of Economics. Tikly, L., Haynes, J., Cabellero, C., Hill, J. and Gilbourne, D. (2006) Evaluation of Aiming High: African Caribbean Achievement Project, London, DfES, Research Report 801. Thompson, D., Treadaway, M. and Knight, T. (2005) Investigating Data Use to Identify Learning Needs, London, DfES, Research Report 665. Thompson, E. (1970) The Making of the English Working Class, London, Pelican. Tranmer, M. (2005) Introduction to Multi-Level Modelling, University of Manchester, CCSR. Tunny, G. (c2006) Educational Attainment in Australia, Canberra, Australian Treasury. Vallentine, G., Marsh, J. and Pattie, C. (2005) Children and Young People’s Home Use of ICT for Educational Purposes: the impact of attainment at Key Stages 1-4, London, DfES, Research Report 672. Wilson, D., Burgess, S. and Briggs, A. (2005) The Dynamics of School Attainment of England’s Ethnic Minorities, University of Bristol, Centre for Market and Public Organisations, Working Paper 05/130. Yorkshire Forward (2006) Regional Economic Strategy, Leeds, Yorkshire Forward. Yorkshire Futures (2006) Progress in the Region, Leeds, Yorkshire Futures. Youth Sports Trust (2006) Know the Score, Loughborough University.

87
Learning to Succeed: understanding and addressing Key Stage 4 (GCSE) underachievement in Yorkshire and Humber
knowledge management for the information age
Appendix 1: Methodology
Issues with the Available Data In the main the data we have used is either synthetic data, or data which describes
a distribution, rather than raw data. Therefore, much of our analysis is based on a distribution that is derived from many composite distributions. This is of course, less reliable than the raw data and it does not lend itself to as many statistical tests as we would have liked to have performed with the data. A further theoretical problem is that there is a three tier hierarchical structure (LEAs, Schools and Pupils) which raises questions to how we collect data and to the availability and compatibility of datasets. The issue is not so much about which level we need to capture data on, as we will need to assess data on all levels. We are more concerned with identifying which is the most important determinant on performance. If it is LEA practices then clearly our main focus should be with the LEA, if it is
geodemographic and economic then it should be at the individual school level, however, if we believe personal psychology to be the most important then we need to understand the individual pupils. Equally important is to keep the differing levels distinct as imputing findings across the levels produces a statistical error, known as ecological fallacy. With the regression models they could be open to the ecological fallacy and have reduced standard errors. Regression analysis can only be used to make inference at the aggregated level, as to make inference at the individual level from analysis at the aggregate level would be misleading, as we have entered into what many academics call the ecological fallacy. Indeed, Tranmer (2005) identifies that if we assume that an equation estimated at LEA level also occurs at the school level, that is to make a cross level
inference, we are not allowing for the fact that people vary within geographic spaces. He goes further to suggest that such an inference is not sensible; this is known as the ecological fallacy. Hox (2002) suggests that the ecological fallacy is conceptual in nature and identifies it as an interpretation of the results at the wrong level, which consists of analysing the data at one level and formulating conclusions at another. Much work has been conducted by Robinson (1950) on the fallacy; furthermore, Snijders and Bosker (2004) highlight the importance of
Three Level Structure
Pupils
Schools
LEAs
The Distribution of Multiple Distributions

88
Learning to Succeed: understanding and addressing Key Stage 4 (GCSE) underachievement in Yorkshire and Humber
knowledge management for the information age
the fallacy with regards to interpretation of data. Indeed, they suggest that a correlation between macro-level variables cannot be used to make assertions about micro-level relations; further details of the ecological fallacy are discussed extensively by Alker (1969). When carrying out the analysis at the individual level we will not assume any higher grouping or clustering in the population, ignoring the fact that clustering occurs in the population. There may be pockets of high attainment in differing LEAs and schools pupils will be clustered in terms of their demographic characteristics. By not recognizing this in our analysis we are in essence ignoring the population structure and the statistics calculated could be biased (Tranmer 2005). Whilst PLASC contains a number of valuable social indicators on pupils (free school meals, ethnicity, gender) they are fairly limited given the sort of analysis we plan. One way of overcoming this is to use the PostCode variable to impute details about the pupil from the Lower Super Output Area (as indeed many researchers have done, including for work for DCSF and the Fischer Family Trust in their widely used Value Added Model). What should be clear, however, is this is not the same as having data directly about the pupil. Indeed, this sort of modelling does contain an ecological fallacy (as indeed does the DCSF’s Contextual Value Added Models, although theoretically the methodology eradicated this ecological fallacy) and for this reason we have only used it to identify predictive variables and not in developing models.
Even this is an over-simplification of decisions about schooling and the reliability of the data. There is now a degree of parental choice (especially in cities) and pupils do not necessarily attend their local school, or even one in their local LEA (this is known as cross-classification). Indeed, actual catchments now follow socio-economic contours across cities, as schools in poorer areas strive to attract more middle class pupils (and if they have high attainment, they can certainly do so), leaving local pupils travelling to the nearest undersubscribed school. This makes the notion of catchment areas extremely problematic. Despite this we have attached geodemographic details to schools based on their locations, as we still believe it provides a reasonable indication of the demographics of their pupils (this clearly means that any
correlations and models using correlations, will have much lower values than those using consistent datasets). Fortunately, as we are interested in value added we are already considering the effects of primary schools on Key Stage 2. In common with many other studies we have made no attempt to ensure that all data was collated at the same sampling point, at the same time, or even during the same year. This is an obvious omission in terms of quality of the data, however, we also believe that it was important to use what data was available and then validate our conclusions by using a number of techniques and statistical tests.
School Cross Classification
Pupils
Schools
Areas

89
Learning to Succeed: understanding and addressing Key Stage 4 (GCSE) underachievement in Yorkshire and Humber
knowledge management for the information age
Such issues lead us to conclude that our data modelling needed to be multilevel. In other words we will need to investigate issues at a number of levels, dependant on the availability and reliability of the data. In summary, we used a variety of statistical techniques, triangulated against other techniques to ensure that we compensated for the lack of data quality. Unfortunately, not all datasets are available to us at every level (especially attainment data), this inevitably means variables that we have found to be important cannot be tested at other levels. Therefore, unlike multi-level modelling which attempts to collate all data at all levels we can only suggest that variables will be relevant at all levels. Inevitably this means that we cannot statically describe a coherent model, but simply show how we believe different variable and combinations of variables fit within our hypothetical model.
Our Approach in Summary
Based on our secondary research and consultation with regional educationalists we identified variables and datasets that were likely to yield some useful insights into simple value added. We did repeat some national investigations on value added from PLASC, but homed in on specific issues to Yorkshire and Humber. This means that whilst our models can discriminate between lower performing regions, they are not as useful in explaining differences between higher performing regions. As noted in the previous section we used a variety of data sets at three
different levels. This means we investigated likely cause and effect by using readily available data that we could reasonably quickly manipulate. We then refined these outputs by utilising more detailed data with a higher degree of granulation. We also triangulated our results through collating more qualitative evidence during our case study interviews. As we explained in the background, there are three distinct levels at which we modelled (the individual pupil, the school and the LEA) this means that our study will be a multilevel model. Furthermore, as there are many variables that we considered through a multivariate analysis. However, we were equally keen that at least some of our modelling should be
readily accessible to the non-statistical expert, we therefore, did not solely rely on a single technique (like multi-level modelling). For the analysis at LEA and school level, our investigation was for all schools and LEAs in England, this would provide much richer data than restricting our analysis to Yorkshire and Humber. From this we identified variables, set of variables and clusters of variables to analyse at a more detailed (pupil level) across selected LEAs in Yorkshire and Humber. Overall, this provided very sound evidence on
Our ApproachLiterature Review
DfES Performance Tables- School Level- LEA Level
Geo Demographic Data- Index of Multiple Deprivation- Census of Population
Case Study Interviewsof abnormal cases- School Level- LEA Level
National Pupil Database- Pupil Level by LEA
Recommendations- For Schools- For LEA

90
Learning to Succeed: understanding and addressing Key Stage 4 (GCSE) underachievement in Yorkshire and Humber
knowledge management for the information age
which variables are not likely to be a strong influence and which are more likely to be the reason for the Region’s underperformance.
Start Up Meeting
Critical to the success of this project was engaging all partners in supporting its methodology and findings, as it was at this stage clarification of methodology was undertaken to successfully achieve the aims of the project. It was of vital importance that everyone understood and supported the aims of the project and that any grey areas are addressed at this stage to promote clarity. Hoshin therefore, utilised a full consultation with all partners in developing our approach to this project and our recommendations. The aims of the consultation was: • To finalise project aims and objectives; • To develop working definitions of attainment and change for the project; • To identify the relevant information and most importantly how it can be
accessed; • To identify data sources and reports to be made available to the project; • To identify relevant educationalists around the region to include in our
consultation.
Secondary Research and Consultation with Educationalists Hoshin believed that the initial phase of the project should begin with an analysis of the significant literature that is available on educational attainment. In addition, we worked closely with Yorkshire Futures in identifying datasets and indicators
we might incorporate in out research. Although much of the literature had a UK focus we believed that by identifying best practice from around the globe we were in a much better position to identify best practice in Yorkshire and Humber and to develop recommendations for Yorkshire and Humber. Once we identified relevant educationalists around the Region we invited (and incentivised) them to join our on-line Delphi group. We feed into this our findings from the secondary research and asked the educationalists to identify what they believed to be the most important
variables. We included in the system the ability to enter lengthy textual responses and for respondents to add features to the text, such as bold and italic. This was based on the system we have developed for on-line Delphi and Focus Groups. Those we invited to join the group included: • Wendy Arie – Barnsley LEA;

91
Learning to Succeed: understanding and addressing Key Stage 4 (GCSE) underachievement in Yorkshire and Humber
knowledge management for the information age
• Kath Tungstall – Education Bradford; • Carol White – Calderdale LEA; • Sue Howarth – Doncaster LEA; • Andrew Williams - East Riding LEA; • Nigel Richardson – Hull LEA; • Professor Tom Cannon - Ideopolis UK Ltd; • Tony Gerard – Kirklees LEA; • Professor Jim Taylor - Lancaster University; • Chris Edwards – Education Leeds; • Jackie Green – Education Leeds; • Richard Mason - North Lincolnshire LEA; • Cynthia Welbourn - North Yorkshire LEA; • Andrew Samson – North East Lincolnshire LEA; • David Light – Rotherham LEA; • Simon Snowdon – Sheffield LEA; • Aisha Jiffry – Sheffield LEA; • Dr Richard Walton - Sheffield Hallam University; • Professor Mike Bottery - University of Hull; • Professor Pete Barrar - University College Bangor; • Dr John Baruch - University of Bradford; • Professor Phil Hodkinson - University of Leeds; • Professor Steven Gorard - University of York; • Professor David Jesson - University of Sheffield; • Professor Peter Smith - University of York; • John Edwards – Wakefield LEA; • Patrick Scott – York LEA; • Stuart Keilty - Yorkshire Futures; • Les Newby - Yorkshire Futures.
This module also contained a facility to upload files, such as reports, to provide the respondents with background information on the consultation. Unfortunately only a few of those invited joined in the discussion: • Dr Richard Walton - Sheffield Hallam University; • Dr John Baruch - University of Bradford; • Professor Phil Hodkinson - University of Leeds; • Patrick Scott – York LEA; • Les Newby - Yorkshire Futures. When we checked the reason for this, many consultees stated that they felt unable to comment on the discussion areas. We also conducted face-to-face interviews with the following consultees: • David Ross – SETPOINT West Yorkshire; • Dr John Baruch - University of Bradford; • Professor Phil Hodkinson - University of Leeds; • Professor Steven Gorard - University of York; • Les Newby - Yorkshire Futures.

92
Learning to Succeed: understanding and addressing Key Stage 4 (GCSE) underachievement in Yorkshire and Humber
knowledge management for the information age
Statistical Analysis and Modelling We were fortunate in having access to a wide variety of datasets to perform our analysis and modelling with. The principle ones being:
Main Datasets used in Modelling Attainment Dataset GeoLevel Variables Geodemographic
Datasets GeoLevel Variables
Census of Population DWP Benefits Claimants
Lower Super Output Area Local Authority Region
Social Grade Social Class Ethnicity Employment in Manufacturing Employment in Mining Adults with no Qualifications Adults with Level 4/5 Qualifications
DCSF School and College Achievement and Attainment Tables (formerly Performance Tables)
School Local Authority (LEA)
% Achieving 5+ GCSEs % Achieving 5+ GCSEs (including Maths and English) (from 2003) Average Point Score Value Added (CVA 2006, SVA 1998)
Index of Multiple Deprivation
Local Authority
Multiple Deprivation Income Income affecting Children Employment Education Access Crime Living Environment
Education, Skills and Training Indicators
Lower Super Output Area
Indicators for Key Stage 2, Key Stage 3, Key Stage 4 (2003) based on Points Score
Rural and Urban Area Classification
Lower Super Output Area
Rural, Urban, Sparse and Unsparse
National Pupil Database Anonymised Pupils
Key Stage 2 and Key Stage 4 Attainment Gender School Age Ethnicity Free School Meals ESOL Movements between Schools SEN Absences Qualification Type Exclusions Super Output Area Income Deprivation affecting Children
Annual Survey of Hours and Earnings
Local Authority
Residents and Workplace
The main statistical techniques we used included: • ANOVA (analysis of variance); • Pearson’s Coefficient; • Multiple Regression; • Multi-Level Modelling.

93
Learning to Succeed: understanding and addressing Key Stage 4 (GCSE) underachievement in Yorkshire and Humber
knowledge management for the information age
Specifically we ran the following tests:
Datasets Data Transformations Tests DCSF Attainment Tables Census of Population Index of Multiple Deprivation
Z Scores
Pearson’s Coefficient Multiple Regression Multi-Level Modelling
Education, Skills and Training Indicators Census of Population Index of Multiple Deprivation Rural and Urban Classification Annual Survey of Hours and Earnings DWP Benefits Claimants
Z Scores Dissimilarity Index Segregation Index Kurtoisness
Pearson’s Coefficient Multiple Regression
National Pupil Database Census of Population Index of Multiple Deprivation
Z Scores Dissimilarity Index Segregation Index Kurtoisness
Pearson’s Coefficient Multiple Regression Multi-Level Modelling
The National Pupil Database is a massive dataset and therefore, highly reliable, where the data is actual and not imputed. The dataset used was obtained from the DCSF and contains Key Stage 2 and Key Stage 4 results, along with PLASC data, for a single cohort of pupils, namely those taking their Key Stage 4 examinations in 2006. Matching of the three data sources was based on an anoymised pupil identifier provided by DCSF; not all records in all data sources could be matched. However, the total number of matched records exceeds 500,000, making this a substantial sample. The original numbers of records provided were:
KS4 Results 637,351 KS2 Results matched to KS4 615,433 PLASC Records matched to KS4 601,230
The Reliability of Attainment Measures Gorard (and Smith 2004) quite correctly argues that all attainment measures will favour some groups over other, for example GCSEs with their emphasis on teacher assessment favour girls more so than did O’ Levels. For both Key Stage 2 and Key Stage 4 the level of coaching that takes place in schools will naturally affect attainment (as Gray et al 1999 and Doran and Izumi 2004 note ‘status-based measures lead to schools identifying and coaching borderline students at the expense of others’). Most commentators agree that this has reached unprecedented levels in schools, however, there is disagreement regarding the effects this has on the reliability of DCSF published attainment data. This is very apparent within the Key Stage 2 Fine Grades for each subject with marked troughs and peaks at the cut off point for attainment levels.

94
Learning to Succeed: understanding and addressing Key Stage 4 (GCSE) underachievement in Yorkshire and Humber
knowledge management for the information age
KS2 English
0
5000
10000
15000
20000
25000
30000
1 5 9 13 17 21 25 29 33 37 41 45 49 53 57 61 65 69 73 77 81 85 89 93 97 101
Passes
Pup
ils
KS2 Maths
0
2000
4000
6000
8000
10000
12000
14000
1 5 9 13 17 21 25 29 33 37 41 45 49 53 57 61 65 69 73 77 81 85 89 93 97 101
Passes
Pup
ils
KS2 Science
0
5000
10000
15000
20000
25000
30000
1 5 9 13 17 21 25 29 33 37 41 45 49 53 57 61 65 69 73 77 81 85 89 93 97 101
Passes
Pup
ils
The Key Stage 2 Average Points Score has a much more regular distribution if slightly skewed towards higher achievement. Unfortunately, this is synthetically created by DCSF, based on the numbers of pupils achieving specific levels. Our analysis of the Average Point Score has shown this to be a particularly unreliable measure when trying to test and correlate against other variables (in short it value statistically is limited). Key Stage 4 is more problematic with an apparent lack of parity between different
subjects, qualification boards and different qualifications. For example, the 5+ GCSE standard can been circumvented by the widespread use of GNVQs valued at 4 GCSEs (by QCA). Although these have been phased out, there are many other options available to schools to achieve the standard with pupils who may under normal circumstances have struggled to do so. In addition, there will be
some inconsistency between the number of examinations for which a pupil is entered (Gray et al 1999), which most commentators have attempted to compensate for by capping the Key Stage 4 scores (see Ray 2006, which uses the scores across the highest eight qualifications). Although we cannot control for differences between assessment methods, qualification boards, subjects and qualifications, we have looked at the spread between the percentage gaining 5+ GCSEs at A*-C grades
(and their equivalents) and the percentage gaining GCSE at A*-C grades including English and Maths. This spread provides a very strong indication of those schools (and LEAs) where alternative qualifications are more widespread. Based on numerous statistical tests we found the 5+ GCSE at A*-C grades including Maths and English to be the most reliable measure, followed by Average Points Scored and Key Stage 2 SATs. The 5+ GCSE A*-C standard did not appear to be particularly reliable, whilst the 5+ GCSE at grades A*-G appeared to be largely random and therefore not at all reliable.
KS2 Average Points Score
0
2000
4000
6000
8000
10000
12000
14000
16000
1.01 -
2.00
6.01 -
7.00
11.01
-
12.00
16.01
-
17.00
21.01
-
22.00
26.01
-
27.00
31.01
-
32.00
36.01
-
37.00
41.01
-
42.00
46.01
-
47.00
51.01
-
52.00
56.01
-
57.00
61.01
-
62.00
66.01
-
67.00
71.01
-
72.00
76.01
-
77.00
81.01
-
82.00
86.01
-
87.00
91.01
-
92.00
96.01
-
97.00
Passes
Pup
ils
KS4 Points Score
0
10000
20000
30000
40000
50000
60000
70000
<= .00 67.61 -
101.40
169.01 -
202.80
270.41 -
304.20
371.81 -
405.60
473.21 -
507.00
574.61 -
608.40
676.01 -
709.80
777.41 -
811.20
878.81 -
912.60
980.21 -
1014.00
1081.61
-
1115.40
1183.01
-
1216.80
1318.21
-
1352.00
Passes
Pup
ils

95
Learning to Succeed: understanding and addressing Key Stage 4 (GCSE) underachievement in Yorkshire and Humber
knowledge management for the information age
For this reason, we have used the 5+ GCSE at A*-C grades including Maths and English, where it is available, and the Average Points Score where it is not. We have also investigated the difference at school and LEA level of 5+ GCSEs at A*-C and 5+ GCSEs at A*-C including Maths and English to develop a proxy for the use of alternative curricula. Multi-level models of PLASC have shown that only Key Stage 2 English SATs are a good predictor of attainment at Key Stage 4, indeed Maths and Science are negatively correlated (in one multiple regression our adjusted r2
was 0.24 for English and only r2 0.10 for the average, although the reasons for this could be artefactual). For this reason, where possible we have looked at fine grades and not average points scored. Surprisingly, however, teachers feel this to be the least accurate measure at Key Stage 2 (SMSR 2005), which again leads us to question what is being measured.
The Reliability of Value Added Measures Many commentators (Gorard 2005) have criticised the way value added is calculated (although they refer to simple value added, most of their arguments hold true for contextualised value added, which builds on simple value added), however, in 1995, Peter Smith of York University questioned the concept itself (as applied in Health) suggesting that there were 8 problems that led to it being counter-productive: • Tunnel Vision: leading to a focus on those areas and subject being
measured and not the whole pupil; • Sub-Optimisation: leading to a focus on those students who will respond
the best and potential exclusion of others; • Myopia: leading to a focus on subjects that will result in higher attainment at
the expense of the needs of the labour market; • Measure Fixation: leading to a focus on league tables and not pupil centred
approaches; • Misinterpretation: leading to a differential application of resources,
meaning that value added data has not been collected in a reasonably controlled environment;
• Misrepresentation: leading to creative reporting and even fraud; • Gaming Ossification: leading to suppressing input values, for example the
marking down of pupils at Key Sate 1 so that value added at Key Stage 2 is improved (reported by Taylor Fitz-Gibbon 1997 and Bartholomew 2006).
Our own tests on simple value added concurred with the findings of Stephen Gorard (2006). “Plans to make [simple] value added more complex, via the addition of contextual information about the pupils will not solve the problem… The additional complexity will reduce further the number of potential critics able to understand the methods… The inclusion of social background information in school performance figures will have the
GCSE Passes (at least 1)
0
10000
20000
30000
40000
50000
60000
70000
80000
90000
1 2 3 4 5 6 7 8 9 10 11 12 13 14 15 16
Passes
Pup
ils

96
Learning to Succeed: understanding and addressing Key Stage 4 (GCSE) underachievement in Yorkshire and Humber
knowledge management for the information age
unintended consequence that we will no longer be able to consider the extent to which schools do, or do not compensate for difference in those backgrounds.” Whilst the new Contextual Value Added measure takes into account many of the independent variables we identified and therefore appears to be somewhat random (indeed we believe that they are a measure of what isn’t captured in the National Pupil Database more so than differences in the effectiveness of schools). Of greater concern to us was that we could identify a positive relationship between contextualised value added and those variables that are negatively correlated to attainment. In other words schools can improve their contextualised value added by selecting pupils from manual white working class families and living in Lower Super Output Area with a high proportion of benefits claimants. One reason for this is that the variables that we have identified as being important to attainment are more important at Key Stage 2 than at Key Stage 4. Therefore, social class and income deprivation are more important determinants at Key Stage 2 than at Key Stage 4. We are not entirely clear why this should be the case. Given that we believe SATs to be more ‘scientific’ in recording attainment than GCSEs and GCSEs to be more valuable in identifying pupils with specific labour market attributes, this finding is surprising. One hypothesis is that as children develop they begin to take on their own social class attributes and those of their parents become less important. As a result of our concerns regarding the measures of value added we have focused our investigation on Key Stage 2 and Key Stage 4 attainment. Of course in itself this is a measure of value added, but one that has not been overly complicated by statistical manipulation.
Special Educational Needs A specific dilemma we faced in dealing with the data was how to treat pupils with Special Educational Needs and those in Special Schools. As the number of pupils classified as having Special Educational Needs (SEN) varies greatly by LAD (indeed in many LEAs statementing is largely related to the responsiveness of the LEA in addressing parents concerns) we concluded that pupils classified as having SEN are a part of the normal distribution of attainment and should be included within our statistical testing (as indeed DCSF do in their multi-level models, in fact within these models SEN is not the most important variable). As we know that the distribution does have a long tail, which includes those with SEN, but this is far from the binomial distribution (despite there being a small spike around 0 points), which would be present if those with SEN were a special case. In retaining those with SEN in our tests we are clearly including some pupils from an LEA that will be studying at a Special School in another LEA and some error is therefore inherent (as indeed there will be for boarders at Public Schools). In addition, some mainstream schools will have specialist facilities which means that they have a high proportion of statemented pupils, again creating some errors within the data. Nevertheless we believe that our treatment of Special Education Needs is more robust than had we omitted them from the distribution. Furthermore SEN pupils are excluded from many of the datasets we have used and therefore often omitted from our analysis. In addition, where we can identify

97
Learning to Succeed: understanding and addressing Key Stage 4 (GCSE) underachievement in Yorkshire and Humber
knowledge management for the information age
Special Schools they have been omitted from our more detailed analysis (where they would skew results) and qualitative research, including the case studies. Indeed a number of the statistical tests that we have used are not designed to cope with null values and where these are related to SEN (such as Special Schools) they have been omitted.
Case Study Interviews
Based on our identification of schools and LEAs with abnormally low or high change scores, we developed a sample frame to case study. Although ideally this should contain a good mix by school type (independent, special, comprehensive, grammar) and between rural and urban; this is not as important as ensuring that those in the sample are not attributable to normal variance. Where possible prioritised those LEAs and schools that have experienced a recent change in value added, as we believe that we are more likely to uncover the reasons for this change in these areas. These included: • Crayke Church of England Primary School, North Yorkshire; • Dixon’s Academy, Bradford; • East Riding LEA; • Harewood Church of England Primary School, Leeds; • Heckmondwike Grammar School; • Hull LEA; • The Ridings, Halifax; • Wickham Parochial School, Gateshead.
Focus Group
Focus Group research techniques have the advantage of providing the necessary depth to attitudes and behaviour of the pupils. Instead of pupils being interviewed singly, the researcher gathered a group of approximately 6-10 participants and facilitates a discussion in which they can all be involved. It is often a useful way of finding out about people’s different perceptions of the same events or phenomena. The disadvantage of focus groups is that we would not be able to include as many individuals in the research as if we used face-to-face interviews. However, we feel that the depth of response more than outweighs the lower numbers. We held a focus group with the following school: • Heckmondwike Grammar School.

98
Learning to Succeed: understanding and addressing Key Stage 4 (GCSE) underachievement in Yorkshire and Humber
knowledge management for the information age
Appendix 2: Glossary Term Description Average Point Score A synthetically derived variable, applicable at the school level upwards, developed by
assigning points to the number of pupils attaining a specific level BME Black and Minority Ethnic CVA Contextual Value Added is an attempt to allow for various geodemographic factors in
calculating the change in attainment within a school (i.e. between Key Stages) DCSF Department for Children, Schools and Families DfES Department for Education and Skills (the relevant part of which is now called DCSF) Ecological Fallacy An error in interpreting statistics by suggesting that statistics at one level give rise to
observations at another level Fine Grade The raw points from specific SATs tests Key Stage 2 A part of the National Curriculum that 7-11 year olds study with SATs examinations at
the end Key Stage 4 A part of the National Curriculum that 14-16 year olds study with examinations
(normally GCSEs) at the end Index of Multiple Deprivation
A synthetically derived indication of an areas deprivation. When used in conjunction with data on individuals, for example in the National Pupil Dataset an ecological fallacy occurs, as it cannot be assumed that all individuals living in deprived areas are deprived themselves.
LEA Local Education Authority a largely redundant term that we have used to denoted the geographical district where education policy is determined
LSOA Lower Super Output Area a Census geography, that can be amalgamated to make up wards
Multi-Level Modelling A statistical technique that aims to reduce ecological fallacy when developing models across a number of levels
Multiple Regression Multiple regression is a statistical technique that allows us to predict one variable on the basis of their scores on several other variables. Our models are linear models because that assume that the relationship between the variables follows a straight line and not a curve
n The number in the sample National Pupil Database
A database containing the results of PLASC’s allocated to individual pupils
OFSTED Office for Standards in Education that inspects schools p Measures the errors in a Multiple Regression the lower the P value the lower the error PANDA Performance and Assessment Reports, OFSTED’s pupils achievement software that is
now a part of RAISEonline PAT Pupil Achievement Tracker that is now a part of RAISEonline Pearson’s Coefficient A common method of correlation with outputs as r values PLASC Pupil Level Annual Schools’ Census Point Score Points allocated to pupils in examinations that could be synthetically allocated according
to their grades r Measures the correlation r2 The correlation squared, of use because it show that actual proportion of variance that
can be attributed to a variable RAISEonline DfES’s on-line CVA system that produces predicted grades

99
Learning to Succeed: understanding and addressing Key Stage 4 (GCSE) underachievement in Yorkshire and Humber
knowledge management for the information age
SATs Standard Assessment Tests taken at the end of each Key Stage without a public examination
SEN Special Education Needs although denoting a particular problem a pupil may have with there learning, there is no universal definition
Z score A data transformation that allows comparison across datasets by taking away the mean and dividing by the standard deviation on a given variable