Embed Size (px)
Citation preview

University of Northern Iowa University of Northern Iowa
UNI ScholarWorks UNI ScholarWorks
Dissertations and Theses @ UNI Student Work
2012
Learning transfer of geospatial technologies in secondary science Learning transfer of geospatial technologies in secondary science
and mathematics core areas and mathematics core areas
Curtis P. Nielsen University of Northern Iowa
Let us know how access to this document benefits you
Copyright ©2012 Curtis P. Nielsen
Follow this and additional works at: https://scholarworks.uni.edu/etd
Part of the Curriculum and Instruction Commons
Recommended Citation Recommended Citation Nielsen, Curtis P., "Learning transfer of geospatial technologies in secondary science and mathematics core areas" (2012). Dissertations and Theses @ UNI. 251. https://scholarworks.uni.edu/etd/251
This Open Access Dissertation is brought to you for free and open access by the Student Work at UNI ScholarWorks. It has been accepted for inclusion in Dissertations and Theses @ UNI by an authorized administrator of UNI ScholarWorks. For more information, please contact [email protected].

Copyright by CURTIS P. NIELSEN
2012 All Rights Reserved
LEARNING TRANSFER OF GEOSPA TIAL TECHNOLOGIES IN
SECONDARY SCIENCE AND MATHEMATICS CORE AREAS
An Abstract of a Dissertation
Submitted
in Partial Fulfillment
of the Requirements for the Degree
Doctor of Education
Approved:
Dr. Radhi Al-Mabuk, Committee Chair
Dr. Michael Licari, Dean of the Graduate College
Curtis P. Nielsen
University of Northern Iowa
December 2012
LID RARY UNIVERSITY OF NORTH~rn,J 10\N,
CEDAR FALLS. ID ,1;
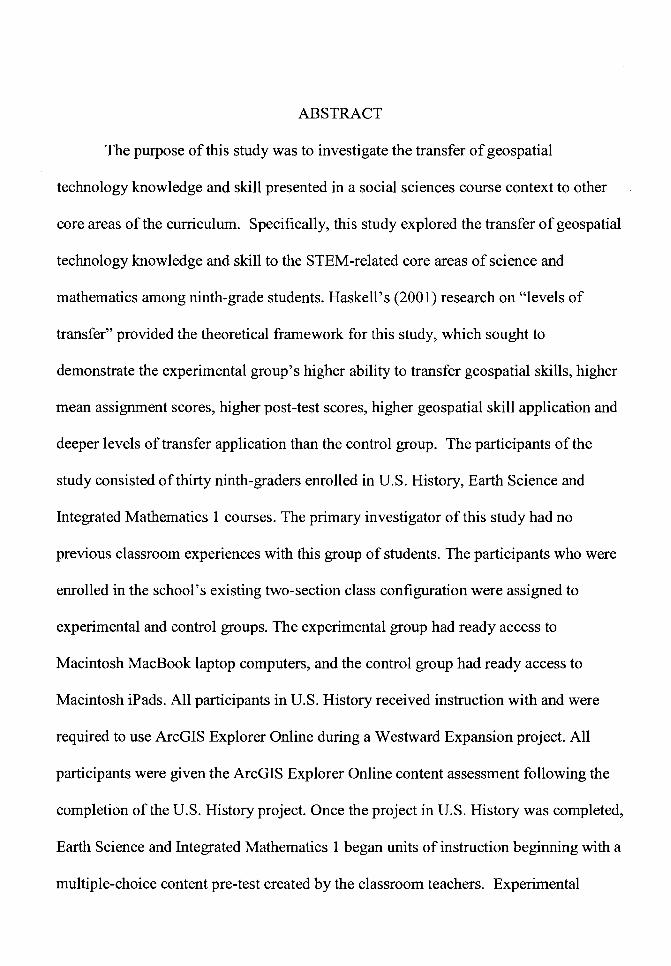
ABSTRACT
The purpose of this study was to investigate the transfer of geospatial
technology knowledge and skill presented in a social sciences course context to other
core areas of the curriculum. Specifically, this study explored the transfer of geospatial
technology knowledge and skill to the STEM-related core areas of science and
mathematics among ninth-grade students. Haskell's (2001) research on "levels of
transfer" provided the theoretical framework for this study, which sought to
demonstrate the experimental group's higher ability to transfer geospatial skills, higher
mean assignment scores, higher post-test scores, higher geospatial skill application and
deeper levels of transfer application than the control group. The participants of the
study consisted of thirty ninth-graders enrolled in U.S. History, Earth Science and
Integrated Mathematics 1 courses. The primary investigator of this study had no
previous classroom experiences with this group of students. The participants who were
enrolled in the school's existing two-section class configuration were assigned to
experimental and control groups. The experimental group had ready access to
Macintosh MacBook laptop computers, and the control group had ready access to
Macintosh iPads. All participants in U.S. History received instruction with and were
required to use ArcGIS Explorer Online during a Westward Expansion project. All
participants were given the ArcGIS Explorer Online content assessment following the
completion of the U.S. History project. Once the project in U.S. History was completed,
Earth Science and Integrated Mathematics 1 began units of instruction beginning with a
multiple-choice content pre-test created by the classroom teachers. Experimental
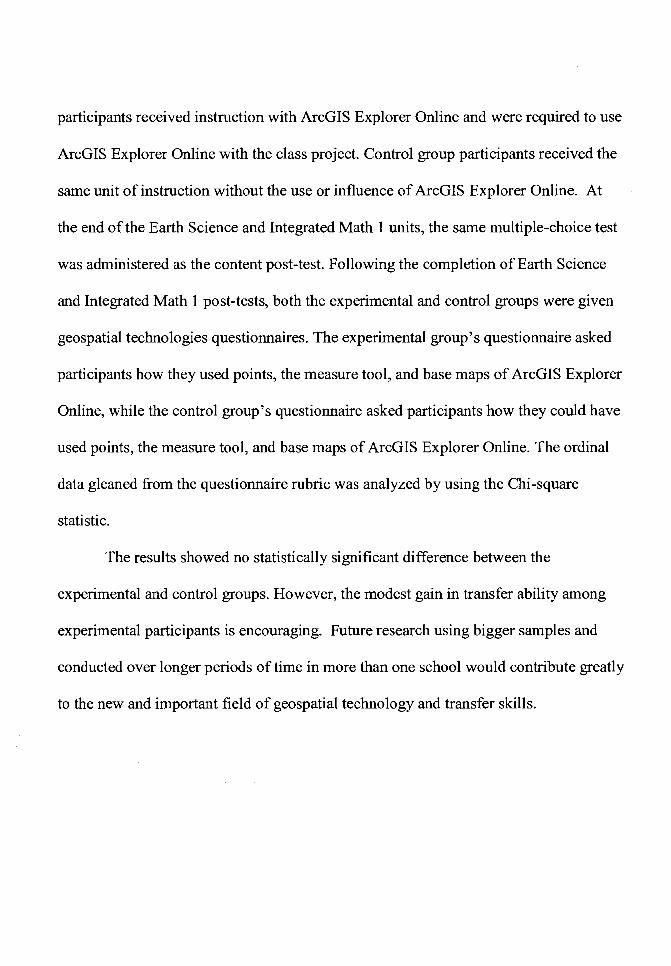
participants received instruction with ArcGIS Explorer Online and were required to use
ArcGIS Explorer Online with the class project. Control group participants received the
same unit of instruction without the use or influence of ArcGIS Explorer Online. At
the end of the Earth Science and Integrated Math 1 units, the same multiple-choice test
was administered as the content post-test. Following the completion of Earth Science
and Integrated Math 1 post-tests, both the experimental and control groups were given
geospatial technologies questionnaires. The experimental group's questionnaire asked
participants how they used points, the measure tool, and base maps of ArcGIS Explorer
Online, while the control group's questionnaire asked participants how they could have
used points, the measure tool, and base maps of ArcGIS Explorer Online. The ordinal
data gleaned from the questionnaire rubric was analyzed by using the Chi-square
statistic.
The results showed no statistically significant difference between the
experimental and control groups. However, the modest gain in transfer ability among
experimental participants is encouraging. Future research using bigger samples and
conducted over longer periods of time in more than one school would contribute greatly
to the new and important field of geospatial technology and transfer skills.

LEARNING TRANSFER OF GEOSPATIAL TECHNOLOGIES IN
SECONDARY SCIENCE AND MATHEMATICS CORE AREAS
A Dissertation
Submitted
in Partial Fulfillment
of the Requirements for the Degree
Doctor of Education
Approved:
Dr. William Callahan, Committee Member
Curtis P. Nielsen
University of Northern Iowa
December 2012

DEDICATION
To my wife Janet who:
together we raised David and Terry, great sons.
encouraged me to further my education.
enhanced my teaching through various creative activities and ideas.
supported me through cancer.
who is a once in a lifetime spouse that inspires me each day.
for 26 years has exemplified and taught me that through hard work the
impossible can be possible.
ii
iii
ACKNOWLEDGMENTS
I wish to acknowledge my dissertation chair, Dr. Radhi Al-Mabuk for his
guidance and counsel during the completion of this dissertation. His generous use of
time to give feedback and most importantly listen to my thoughts, which was
instrumental in the completion of this process. His kind words of encouragement came
at tough times that allowed me to come out the other end a better teacher and person.
I wish to also express my appreciation to Dr. Timothy Weih who served as my
graduate advisor. He got me off to a good start on my classwork and made valuable
contributions to the editing of my dissertation manuscript and defense presentation.
A special thank you to Dr. William Callahan who served as my statistics
counsel for my research. His commitment to my research, positive encouragement and
vision allowed me to connect with many in the geospatial technology field. Through his
enthusiasm for geospatial technologies he encouraged me to get connected to the top
researchers in the field. Without Dr. Callahan I would not be in the academic position I
am today.
To Dr. Ramanathan Sugumaran I owe much. It was Dr. Sugumaran's vision to
create and launch a G IS course at Price Laboratory School, the only one of it's kind. It
was his ability to supply the class with computers and software that allowed the unique
class to flourish. Through these experiences I was able to develop a direction for this
dissertation. His ability to see beyond tomorrow has been an asset to my development
as a teacher and scholar.
iv
A special thank you also goes to Dr. Jody Stone. Having known Dr. Stone for
more than 30 years as a teacher, colleague and friend she inspires me with her
continued efforts toward excellence. She provided insightful suggestions and comments
to my research and the dissertation report. She was always willing to read sections and
provide ample amounts of feedback for the betterment of my writing. Her practical
understanding of the classrooms in which my research took place was invaluable to this
work.
Others instrumental in my educational development include all of the teachers I
have had as a student. My colleagues in the profession both at Lincoln Elementary
School in Cedar Falls and those at Malcolm Price Laboratory School on the University
of Northern Iowa campus. A special mention goes to Dr. Alex Oberle, and Mrs. Amy
Lockhart for their assistance with the questionnaire scoring of my dissertation data.
Finally, thank you to my brother, Dr. Lynn E. Nielsen, for his clear guidance
during this dissertation process. His exemplary teaching and commitment to excellence
in all things is an inspiration that will live with me throughout my lifetime.

v
TABLE OF CONTENTS
LIST OF TABLES ........................................................................................................... x
LIST OF FIGURES ........................................................................................................ xi
CHAPTER 1. INTRODUCTION ................................................................................... 1
Statement of the Problem ............................................................................................. 3
Significance of the Study ............................................................................................. 5
Purpose of the Study .................................................................................................... 7
Assumptions ................................................................................................................. 8
Definition of Terms ...................................................................................................... 8
Spatial Thinking ....................................................................................................... 8
Geo spatial Technologies .......................................................................................... 8
Remote Sensing (RS) ............................................................................................... 9
Geographic Information Systems (GIS) .................................................................. 9
Global Positioning System (OPS) ............................................................................ 9
Google Earth ............................................................................................................ 9
Transfer of Learning .............................................................................................. 10
Intercontextuality ................................................................................................... 10
Situated Leaming ................................................................................................... 10
CHAPTER 2. SUMMARY OF THE LITERATURE ................................................. 11
Industry Growth ......................................................................................................... 11
vi
Intent of Geospatial Technologies ............................................................................. 12
National Survey ......................................................................................................... 13
Geospatial Technologies Instruction .......................................................................... 15
Barriers ....................................................................................................................... 16
Applications in Geospatial Technologies .................................................................. 17
Instruments ............................................................................................................. 17
Methodology .......................................................................................................... 18
Results .................................................................................................................... 20
Conclusions ............................................................................................................ 22
Atlanta Bike Route Problem ...................................................................................... 22
Participants and Instruments .................................................................................. 22
Results .................................................................................................................... 23
Transfer of Learning .................................................................................................. 24
Intercontextuality ................................................................................................... 25
Study and Participants ............................................................................................ 25
Results .................................................................................................................... 26
Situated Leaming ....................................................................................................... 26
Claim 1: Action is Grounded in Context ............................................................... 27
Claim 2: Knowledge Does Not Transfer Between Tasks ...................................... 27
Claim 3: Training by Abstraction is of Little Use ................................................. 28
Claim 4: Instruction Needs to be Done in Complex Social Environments ............ 29
Situated Learning Conclusion ................................................................................ 30

vii
Five Types of Knowledge .......................................................................................... 30
Haskell's Levels of Transfer ...................................................................................... 31
Haskell's (2001) Kinds of Transfer ........................................................................... 32
Transfer of Leaming- Conclusion ............................................................................ 32
Hypotheses and Research Questions ......................................................................... 33
CHAPTER 3. METHODOLOGY ............................................................................... 34
Subjects ...................................................................................................................... 34
Recruitment. ............................................................................................................... 35
Procedures .................................................................................................................. 35
U.S. History Course ................................................................................................... 36
Experimental and Control Groups ............................................................................. 37
Earth Science and Integrated Mathematics 1 ............................................................. 37
Questionnaire ............................................................................................................. 3 9
Analysis .................................................................................................................. 41
CHAPTER 4. RESULTS ............................................................................................. 43
CHAPTER 5. DISCUSSION ....................................................................................... 55
Context ....................................................................................................................... 56
Earth Science Overview ............................................................................................. 57
Integrated Mathematics 1 Overview .......................................................................... 57
Experimental Groups were Expected to Identify Geospatial Technology Skill Transfer ...................................................................................................................... 58
Connection Between Use of Geospatial Technologies and Assignment Scores ....... 58
viii
Difference in Content Pre- and Post-Test Between Groups ...................................... 59
Earth Science Group Comparison .............................................................................. 59
Integrated Mathematics 1 Group Comparisons ......................................................... 61
Demonstrating a Higher Ability to Identify Geospatial Technology Skill
Application than the Control Group ...................................................................... 63
Applying Deeper Levels of Transfer ......................................................................... 66
Limitations ................................................................................................................. 67
Future Directions ....................................................................................................... 68
REFERENCES .............................................................................................................. 70
APPENDIX A: APPLICATION IN GEOSPATIAL TECHNOLOGIES SURVEY .. 75
APPENDIX B: HASKELL'S (2001) KINDS OF TRANSFER .................................. 77
APPENDIX C: HUMAN PARTICIPANTS REVIEW PARENTAL PERMISSION 78
APPENDIX D: STUDY FLOW CHART .................................................................... 80
APPENDIX E: POST US HISTORY GEOSPATIAL TECHNOLOGIES CONTENT ASSESSMENT .............................................................................................................. 81
APPENDIX F: QUESTIONNAIRE EARTH SCIENCE - EXPERIMENT AL GROUP .......................................................................................................................... 83
APPENDIX G: QUESTIONNAIRE EARTH SCIENCE - CONTROL GROUP ...... 84
APPENDIX H: QUESTIONNAIRE INTEGRATED MATHEMATICS 1 -EXPERIMENT AL GROUP .......................................................................................... 85
APPENDIX I: QUESTIONNAIRE INTEGRATED MATHEMATICS 1 - CONTROL GROUP .......................................................................................................................... 86
ix
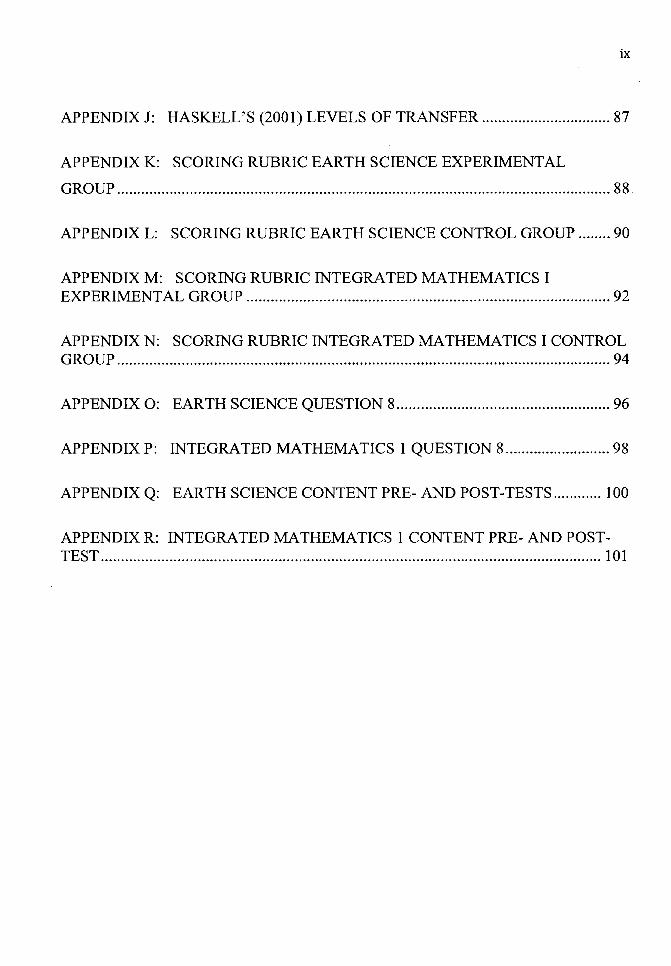
APPENDIX J: HASKELL'S (2001) LEVELS OF TRANSFER ................................ 87
APPENDIX K: SCORING RUBRIC EARTH SCIENCE EXPERIMENTAL
GROUP .......................................................................................................................... 88
APPENDIX L: SCORING RUBRIC EARTH SCIENCE CONTROL GROUP ........ 90
APPENDIX M: SCORING RUBRIC INTEGRATED MATHEMATICS I EXPERIMENTAL GROUP .......................................................................................... 92
APPENDIX N: SCORING RUBRIC INTEGRATED MATHEMATICS I CONTROL GROUP .......................................................................................................................... 94
APPENDIX 0: EARTH SCIENCE QUESTION 8 ..................................................... 96
APPENDIX P: INTEGRATED MATHEMATICS 1 QUESTION 8 .......................... 98
APPENDIX Q: EARTH SCIENCE CONTENT PRE-AND POST-TESTS ............ 100
APPENDIX R: INTEGRATED MATHEMATICS 1 CONTENT PRE- AND POST-TEST ............................................................................................................................ 101
x
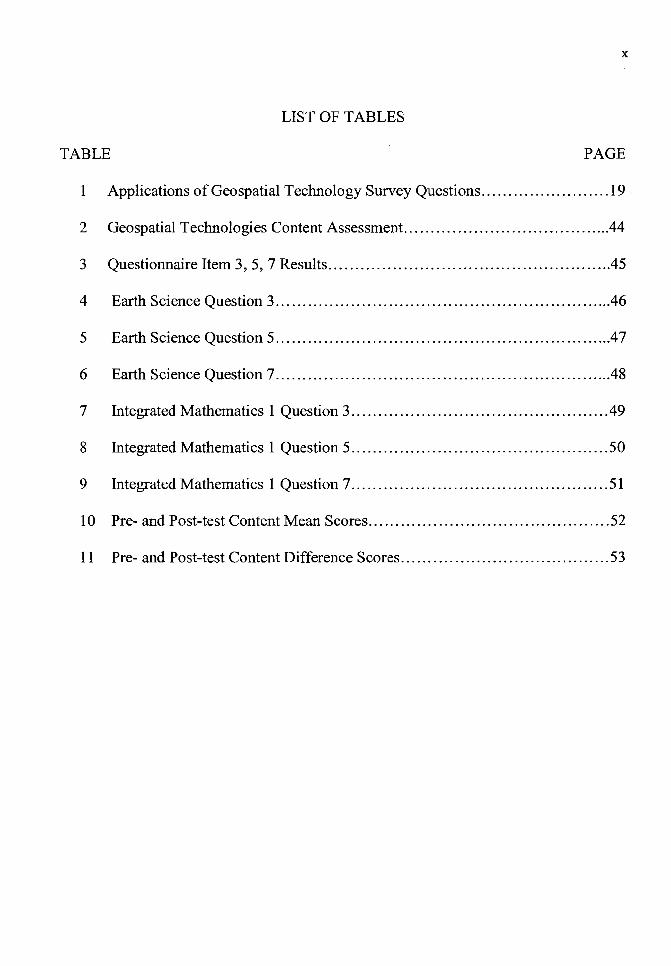
LIST OF TABLES
TABLE PAGE
1 Applications of Geospatial Technology Survey Questions ........................ 19
2 Geospatial Technologies Content Assessment ...................................... .44
3 Questionnaire Item 3, 5, 7 Results .................................................... .45
4 Earth Science Question 3 .............................................................. .46
5 Earth Science Question 5 .............................................................. .47
6 Earth Science Question 7 .............................................................. .48
7 Integrated Mathematics 1 Question 3 ............................................... .49
8 Integrated Mathematics 1 Question 5 ................................................ 50
9 Integrated Mathematics 1 Question 7 ................................................ 51
10 Pre- and Post-test Content Mean Scores ............................................. 52
11 Pre- and Post-test Content Difference Scores ....................................... 53

xi
LIST OF FIGURES
FIGURE PAGE
1 Geospatial Technologies Survey Responses .................................... 21
2 Percentage of All Survey Responses ............................................. 21
CHAPTER 1
INTRODUCTION
1
Geospatial technologies measures and analyses the earth's surface features to
create visualizations of information using global positioning systems, geographical
information systems, and remote sensing. Since its inception, geospatial technologies
have been logically restricted to well-funded research universities and large government
agencies. Yet in recent years geospatial technologies have gained momentum in the day
to-day lives of people everywhere particularly twenty-first century students (Nielsen,
Oberle, & Sugumaran, 2011 ). Given the infusion of geospatial technologies in the daily
lives of people globally, geospatial technologies needs to become part ofK-12 leaming
communities as well as our student's everyday educational processes (Coulter, 2007).
As a tool for data interpretation and problem solving geospatial technologies has
continued to expand its value-added influence in industry as well as in K-12 education.
Bednarz et al. (2007) built on Coulter' s (2007) theme as he claimed that spatial
thinking, an integral component in the use of geospatial technologies, could be framed
by investigating student's knowledge and application of space. In addition to knowledge
and application, students need a foundation of geospatial technologies skill before they
can stretch their wings and become independent learners with geospatial technologies.
Mastering knowledge of the technology, but not knowing how to apply the concepts that
go with spatial issues confidently can create students of tools rather than spatial thinkers.
A global information economy requires proficient workers of technology and spatial
thinking in combination (Mackaness, 2003; Wiske & Beatty, 2009).
Leaming demonstrations and appropriate information presentations present
opportunities of growth for students. Merrill (2002) has cited four instructional phases,
which include: (a) prior practice, (b) skill demonstration, (c) application and (d) skill
integration of real-world activities (p. 44). From these experiences students are able to
schematically form their own understandings of curricula (Merrill, 2006). Further,
Merrill's (2002) instructional phases leading to problem solving cement growth and
learning in students. Application of tools as Coulter (2007) claimed combined with
Mackaness' (2003) foundation of learning theory and Merrill's (2006) thoughts on
schematic formation of learning may well set up students to become efficient and
effective geospatial technology users as well as competent 21st Century citizens.
2
Exploring how students think and what they can do with their knowledge beyond
the walls of the school is central to the aims of education (Lobato, 2006). For students to
apply learning elsewhere students must see a similarity between the learning context and
application context. Leaming transfer is driven by connections between learning
contexts (Haskell, 2001). However, seldom-successful identification of context
connections from previous learning hinders student's ability to transfer (Haskell, 2001).
Contextually understanding today's digital native students and their thinking is
pivotal to successful instruction for transfer. In the case of geospatial technologies
transfer, knowledge is visible in all practical examples of its use, which drives
arguments for its continued inclusion in curricula. The purpose of this study is to
investigate the relationship between interdisciplinary transfer of geospatial technology
skills from a social sciences context to student achievement in the STEM-related core
courses of Earth Science and Integrated Mathematics among ninth grade students.
Statement of the Problem
The inclusion of geospatial technologies in the curricula and educational
experiences aimed at K-12 students are lagging compared to societal demands. Early in
the 21st Century Kerski (2003) found that 2% of United States high schools used
geographic information systems (GIS) in their instruction. At that time the reasons for
the lack of GIS use were unclear. In 2009 a follow up study by Baker, Palmer and
Kerski demonstrated that teachers needed collegial support in their schools to foster a
technology rich learning environment for K-12 students.
The National Research Council (2006) poses an optimistic view of geospatial
technologies inclusion in K-12 education.
Workforce demands are changing; those demands can be met only if the K-12 education system produces graduates with the requisite skills and knowledge, with a commitment to lifelong learning, and with flexibility to adapt to change. Central to changing workforce needs are knowledge workers for the rapidly growing IT sector. Central to the IT sector and many other sectors is spatial thinking. (p. 113)
Along with the National Research Council's (2006) view, the United States Department
3
of Labor Statistics (2006) included predictions for the growth of geospatial technologies
by the year 2014. Information-growth along with computer systems design was
projected to top 40 percent, more than three times faster than the average of all
occupations (Hecker, 2005, p. 72). Additionally, Hecker (2005) noted the Network and
Computer Systems Administrators field growing at a rate of 38.4%. These growth rate
4
predictions coupled with an estimated 600% market increase, from five billion to 30
billion, over the years 2002 to 2005 gave an optimistic outlook for jobs in the field of
geospatial technologies. Currently growing faster than the average for all occupations,
geospatial technologies related fields are predicted to grow at a rate of 19% from the
years 2008 to 2018 (United States Department of Labor, 2010). In relation to K-12
education the question of geospatial technologies inclusion is fostered by the
amalgamation of two events, the increased development oflnformation Technology (IT)
and the global awareness of geographical circumstances (Mackaness, 1994).
The combination of an escalating use of geospatial technologies in society and
the encouragement of the United States Department of Labor signal a call for geospatial
technologies in the K-12 schools of America. However, the enacted geospatial
technologies infused curriculum in schools is lagging significantly in comparison to the
use of geospatial technologies in society. Among the reasons impeding school use
include a lack of funding for hardware and software, little pre-service and in-service
training for teachers and school cultures that don't encourage classroom innovation. As
the integration of technology in schools hovers around 3% the availability of technology
to schools and what the schools employ in the curriculum are drastically diverse (Kerski,
2003 ). A 2008 survey found that 8% of 1000 instructors, students and IT staff employed
technology with the curriculum fully (Moeller & Reitzes, 2011). Interestingly, 43% of
students surveyed felt they were not prepared to use technology in higher education or
occupational employment.
5
Curriculum reform involving geospatial technologies at the K-12 levels may
well fundamentally change students' spatial thinking and problem solving skills, both
central to the Iowa Core Curriculum's 21st Century essential skills and concepts. This
sort of reform could challenge the current position of schools in society. To investigate
the transfer of geospatial technologies knowledge application from the core area of
social sciences to other core areas of science and mathematics among ninth grade
students could yield interesting results. Seeing the curriculum enacted through many
disciplines can build strength in student's cognitive competencies (Sinton & Lund,
2007). Key to transfer and application of thinking from one subject to another in today's
educational context could be central to the advancement of 21st Century citizens.
Significance of the Study
The application of geospatial technologies in the curriculum of schools in
America has been reported by Kerski (2003) to be less than 2%. This number could be
an indicator of the disconnection between the tools schools are using with students and
requisite skills fostered in technology rich societies. Currently, the evolving environment
that surrounds technology requires that students prepare themselves for jobs,
technologies and problems yet to be discovered (Fisch & McLeod, 2007). With the
continual emphasis in education on Science, Technology, Engineering, and Mathematics
(STEM) content courses for the advancement of student capability and preparation,
integrating geospatial technologies in the core areas of social studies, science, and
mathematics could be a way to boost well-documented student math and science scores.
Student achievement fairing better on the global stage would benefit educational

6
systems in Iowa and the nation. Additionally, students that are innovative, adept at
acquiring and applying new knowledge, and proficient in problem solving will meet 21st
Century goals as outlined by the Iowa Department of Education (2011).
Central to the application of geospatial technologies in schools is the ability of
students to transfer knowledge and skills to other contexts. The transfer of skills and
creation of new knowledge is dependent on the learner identifying connections and
similarities between the original learning context and the novel situation (Haskell,
2001). This mixed methods study was designed to investigate the use of Haskell's
(2001) levels of transfer applied to geospatial technologies in ninth grade STEM
courses. In support, Coulter (2007) asserted that geospatial technologies should become
part of a student's everyday tools for learning and Mackaness (2003) along with Wiske
and Beatty (2009) claimed that a global economy requires technology proficiencies in
combination with spatial thinking. In addition, this investigation is an extension of a
study by Nielsen et al. (2011) in which they found that by acquiring geospatial
technologies skills in isolation secondary students increased their understanding of
geospatial technologies in real-world applications (p. 65).
Today's students can be characterized as Digital Natives who fundamentally
process information differently from students in previous generations (Prensky, 2001).
Many times the K-12 schools today are based on what Collins and Halverson (2009) call
"just-in-case learning" pedagogy, schooling that is based on central knowledge (p. 3).
This study attempted to move past Collins and Halverson's (2009) "just-in-case" model
description to their "just-in-time," hands on, model of pedagogy by pairing
technologically proficient teachers with geospatial technologies in their two-section
courses.
Geospatial technology in the curriculum of schools today could cultivate a
culture of innovation demanded by social institutions and communities in Iowa, the
United States and the world. Through the investigation of geospatial technology skill
transfer this study will demonstrate that high school students can transfer learning from
one subject area to another, breaking down the institutional silos typically found in
American high schools.
Purpose of the Study
The purpose of this study is to investigate the transfer of geospatial technologies
knowledge and skill presented in a social sciences course context to other core areas of
the curriculum. Specifically this study explores the transfer of geospatial technologies
knowledge and skill to the STEM-related core areas of science and mathematics among
ninth grade students. Haskell's (2001) research on "levels and kinds of transfer"
provides the theoretical framework for this study.
1. What level of transfer did subjects demonstrate as they completed
assignments and/or projects with the use of geospatial technologies in the
context of an Earth science course?
2. What level of transfer did subjects demonstrate as they completed
assignments and/or projects with the use of geospatial technologies in the
context of an Integrated Mathematics course?
7
8
3. How does geospatial technologies infused instruction of the curriculum
impact student achievement compared to non-geospatial technologies infused
instruction?
Assumptions
It is assumed that the content and instruction in the Earth Science and Integrated
Mathematics courses are typical for the teachers involved in this study. It is also
assumed that identical course content will be delivered to each study group with the
exception of geospatial technology inclusion for the treatment group. Pre and post-tests
are assumed to be measuring the content of each unit. Additionally it is assumed that the
instructors and students involved in this study are adept at computer use as well as
website manipulation. It is also assumed that the teachers' and students' use of
geospatial technologies will be a new endeavor for each.
Definition of Terms
The following terms used in this research are defined according to their use:
Spatial Thinking
Bednarz, Acheson, and Bednarz (2006) stated, "Spatial thinking is the
knowledge, skills, and habits of mind to use spatial concepts, maps, and graphs and
processes ofreasoning in order to organize and solve problems" (p. 398).
Geospatial Technologies
Geospatial Technology is "an information technology field of practice that
acquires, manages, interprets, integrates, displays, analyzes, or otherwise uses data
focusing on the graphic, temporal, and spatial context" (National Research Council,
9
2006). geospatial technologies includes three distinct branches, which are Geographic
Information Systems (GIS), Global Positioning Systems (GPS), and Remote Sensing
(RS). Each geospatial branch has unique applications for varied spatial contexts and can
function independently or in concert with each other to reveal more in-depth spatial
relationships. The ultimate use of geospatial technologies revolves around problem
solving within contexts of spatial orientation. The demand for persons with geospatial
skills has continued its rapid growth in the twenty first century (U.S. Department of
Labor, 2006, p. 22).
Remote Sensing (RS)
Acquiring data about the Earth or phenomena of the Earth without coming in
contact with the Earth.
Geographic Information Systems (GIS)
"A geographic information systems (GIS) integrates hardware, software, and
data for capturing, managing, analyzing, and displaying all forms of geographically
references information" (GIS.com, 2011).
Global Positioning System (GPS)
"GPS is a space-based service that provides position, navigation, and timing
information to users anywhere on Earth, at any time of day or night, in any weather"
(Aerospace, 2012).
Google Earth
Dubois, Truillet and Bach (2007) define Google Earth as, "A free application
that supports navigation, bookmarks and search onto satellite pictures of the Earth.
Pictures, presented from a bird-eye view perpendicular to the surface of the globe, are
mapped on a sphere representing the Earth" (p. 32).
Transfer of Learning
10
"Transfer refers to how previous learning influences current and future learning,
and how past or current learning is applied or adapted to similar or novel situations"
(Haskell, 2001, p. 23).
Intercontextuality
"When two or more contexts become linked with one another" (Engle, 2006, p.
456)
Situated Learning
"Situated learning emphasizes the idea that much of what is learned is specific to
the situation in which it is learned" (Anderson, Reder & Simon, 1996, p. 5)
CHAPTER2
SUMMARY OF THE LITERATURE
11
The purpose of this study is to investigate the transfer of skills and creation of
geospatial technologies knowledge from social sciences to the other, STEM related, core
areas of science and mathematics among ninth grade students. Specifically this study
seeks to describe student application and transfer of acquired geospatial technologies
skills and knowledge to the curricula demands of core area courses of science and
mathematics.
Industry Growth
Currently growing faster than the average for all occupations, geospatial
technologies have been cited by the U.S. Department of Labor's Occupational Outlook
Handbook (2006, 2010) as a high growth industry. Geospatial technologies related fields
are predicted to grow at a rate of 19% from the years 2008 to 2018 (United States
Department of Labor, 2010). The events of September 11, 2001 fueled a conscience
effort in the public and private sectors to gather information for improved decision
making (U.S. Department of Labor, 2005). Foreshadowing this growth rate, on October
6, 2005 and January 27, 2006 the United States Department of Labor (2006) in
conjunction with Geospatial Information and Technology Associations, and the
Association of American Geographers convened The President's High Growth Job
Training Initiative to examine Targeted High Growth Industries. Among these industries
were geospatial technologies. The overall program objectives affirmed that educational
institutions play an important role in the development of a workforce that can meet the
12
industry demand for various geospatial tasks. A goal of the President's Initiative is to
pilot a connection of geospatial technologies tools and applications with labor needs
through education, economic development, and employment opportunities (United
States Department of Labor, 2006). This goal supports an acknowledgement that
technology is part of the world culture and the need for people to understand its use and
application (Mackaness, 1994).
Intent of Geospatial Technologies
The intent of geospatial technologies is to find the connections between data and
location-creating maps that provide a basis for contextual problem solving. A
visualization of data can frame a context from which learning and analysis will increase
student engagement (Baker &White, 2003). Furthering students' educational
engagement and experience with geospatial technologies will benefit education and
ultimately student achievement. The National Research Council (2006) in support of
geospatial technologies inclusion in K-12 education posits the demand for workers is
shifting and requires educational institutions to provide instruction that is focused on
new requisite skills such as critical thinking and data driven decision making. Workers
as life-long learners with requisite IT skill levels prior to employment are necessary to
address the perceived needs that American employers seek.
Application of geospatial technologies skills through relevant and rigorous
curriculum may allow students the opportunity to engage their relative levels of spatial
thinking skills and develop spatial skills using technological tools of all types. Lindsey
and Berger's (2009) description of authentic experiences supports the idea that relevance
is key to learner's success in the classroom (p. 120). The cumulative effect of multiple
experiences with geospatial technologies tools may well enhance the spatial thinking
processes for students thus better equipping students for geospatial technologies
applications in the future. Sinton and Lund (2007) in their book, Understanding Place:
13
GIS and Mapping Across the Curriculum, support the claim that spatial thinking comes
before all other geospatial skills. Individuals subconsciously use spatial thinking when
driving a car, riding a bike, playing video games, reading a map, organizing space, and
participating in many other daily activities.
National Survey
In a national survey of 1,520 high school teachers who owned Geographic
Information Systems (GIS) software, Kerski (2003) reported several hurdles to
overcome with the introduction of geospatial technologies tools in schools. Lack of
geospatial technologies lesson planning time, training support and perceptions of
software difficulties all contributed to barriers that needed to be overcome. Eliminating
these barriers may allow geospatial technologies to gain momentum and excitement with
teachers generating the interest among students and the community at large.
Another theme appearing in the literature is the application of geospatial
technologies that must have a real-life component for students. Real-world application
ofleaming with GIS can create an environment where students view their engagement
as having purpose (Kerski, 2003). Lindsey and Berger (2009), Merrill (2009), and
Slavery (2009) support Kerski's (2003) point in their views of authenticity and
experience. Beatty (2009) adds a brain-based view that theorizes connections between
14
the brain's biological systems and environment of learning will improve scholarship for
students, which in tum will improve education. Students who are subjected to
authenticity, connected to previous experience, will be engaged learners.
There are barriers that exist to using geospatial technologies in schools. A
national survey revealed that GIS has not made significant advancements in terms of the
number of secondary schools using it. There were over a half million Arc View users
worldwide but less than 1,500 users were in the database of U.S. educators (Kerski,
2003). Couple that with Kerski's other finding that only 20% of teachers using GIS do
so in more than one lesson indicates there are other issues, barriers to use, with GIS.
Why are so few teachers using geospatial technologies in their classrooms? The
literature indicates three basic barriers to geospatial technology use in classrooms: (a)
Pre-service teacher training and teacher in-service training, (b) lack of software and data,
(c) the systematic barriers to encouraging innovation in education.
Kerski (2003) pointed to the lack of pre-service training as a significant barrier in
the use of geospatial technologies in the classroom. This only leaves teachers with an in
service opportunity to learn the necessary skills to competently instruct with and about
geospatial technologies. Given this response and the lack of nation-wide state mandated
requirements of geospatial technologies in the schools, it seems reasonable that only
20% of all teachers using GIS in their classroom use it with more than one lesson. The
context of an environment with an emphasis on student assessment success pressures
teachers to stay within the curricular norm. However, when teachers were asked to what
extent they planned to use the technology the next year, 71 % stated they would increase
15
their use of the software. In a follow up to Kerski's (2003) study Baker et al. (2009)
found that teachers used GIS as a catalyst for multi-disciplinary instructional
approaches. GIS has effectively become a tool for instruction and learning in multiple
settings, which was a change from the previous findings. Barriers such as technology
access, cost of software and complexity have been replaced by length of class periods,
time for fieldwork and routine pressures on educators in the later survey. Furthering
students' experience with geospatial technologies will benefit education and ultimately
student achievement.
In sum, teachers liked the technology and felt strongly that the application and
potential for meaningful learning was a positive addition to their classrooms. geospatial
technologies can be an effective tool to support student growth, learning and change in
classroom contexts (Environmental Systems Research Institute, 1995). Effective use of
geospatial technologies in the classroom could raise the level of meaningful learning and
instruction for students and teachers alike.
Geospatial Technologies Instruction
A constructivist approach to teaching with geospatial technologies is supported
by Johansson (2003) as he believes a constructivist approach will allow the teacher to
move from being the sole source of information to that of a guide. Doering and
Veletsianos (2007) studied student use ofreal-time data in conjuction with Google Earth
to follow researchers in the arctic. They found students were more enthusiastic and
engaged learners through this use of geospatial technologies embedded into the
curriculum of the classroom.
16
Another view by Kerski (2003) suggested that in order for GIS to be
institutionalized in the school, teams of teachers from the same school should be trained
at the same time. This organization of cohort groups could give teachers a sense of
camaraderie when instructing with this new technology as well as a common knowledge
base. They would be able to share their experiences with each other and in effect
become each other's trainers in the use of geospatial technologies. Both of these
approaches could be welcomed in many schools.
Barriers
Many schools experience barriers to the infusion of geospatial technologies into
their curricula. First, there is a monetary commitment the school district will have to
assume in order for this type of technology to flourish. Grant opportunities and other
private funding can overcome the monetary barriers. Essentially, those committed to
using GIS in their classrooms must be active players in the search for funding. Secondly,
support from the information technicians will need to be in place. In Kerski' s (2003)
survey teachers deemed training support as a major constraint on using GIS in their
classrooms. According to teacher responses to the Kerski's (2003) survey questions, a
technological support structure must be in place. The third barrier to geospatial
technologies inclusion in K-12 classrooms is situated in the school climate and the level
of acceptance of educational innovation (Bednarz & Audet, 1999). As an example of a
systematic barrier to successful geospatial technologies implementation, Meyer,
Butterick, Olkin and Zack (1999) found that issues of bureaucracy stifled the purchase
of needed geospatial technologies application software in a GIS case study. Systemic
17
barriers to the infusion of geospatial technologies in schools have long been an issue to
overcome.
Johansson (2003) referenced Bednarz and Audet (1999) and their claim that the
impediments to the successful infusion of geospatial technologies in K-12 classrooms
include a lack of software and data as the first restraint. The second was the lack of
teacher training and curriculum materials, and the third were the systematic barriers to
encouraging innovation in education (p. 3). Teacher's need support in all of these areas
to move spatial thinking and geospatial learning forward in education. According to
Johansson (2003) addressing these barriers is a must to facilitate the inclusion of
geospatial technologies in schools. In spite of the barriers, one school has attempted to
facilitate the inclusion of geospatial technologies in their school, reporting their results
in the form of a pilot study using a case study format. The following case study frames
the experience of fourteen secondary students learning about and with geospatial
technologies.
Applications in Geospatial Technologies
Instruments
Applications in Geospatial Technologies is a high school student problem
solving and spatial thinking course offered by a K-12 school in Midwestern United
States. Nielsen et al. (2011) used a Likert survey and blog entry data from 14
participants to report on this unique course investigating positive changes in student
understanding of spatial thinking, geospatial technologies, and ability to apply both to
view the world in which they live. The course offered opportunities for students to use
tools to problem solve community concerns and provided a platform to identify
prerequisite skills students needed to close the knowledge gap between high school
geospatial introductions and college level geospatial courses.
Methodology
18
The participants of the Likert survey were the students of the Application in
Geospatial Technologies classes in the spring and fall of 2008. Fourteen high school
students participated in the survey from an available student population of 19 between
the two classes. The Likert survey included 10 questions that were arranged from global
Geospatial Technology awareness to specific school and life application of Geospatial
Technologies to solve problems (see Table 1). Each item included response choices of 1-
Strongly Disagree, 2-Disagree, 3-Indifferent, 4-Agree, and 5-Strongly Agree. Favorable
responses were considered to be 4-Agree and 5-Strongly Agree. Unfavorable responses
were considered to be 2-Disagree and 1-Strongly Disagree. The coding of each of the
response selections was important for further analysis. Additionally students were asked
open-ended questions that focused on their assessment of the course (Nielsen et al.,
2011).
19
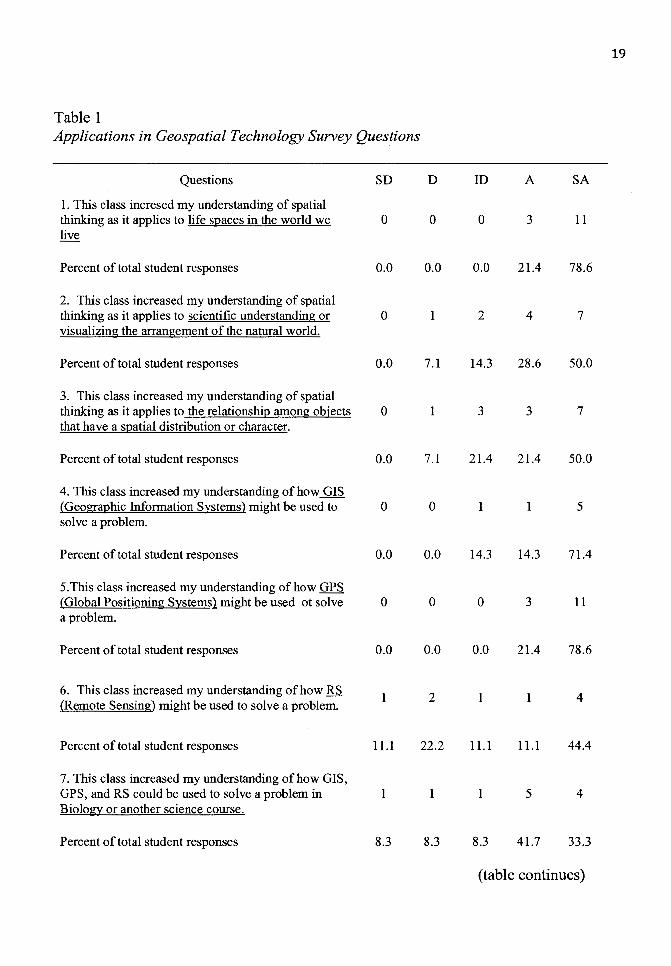
Table 1 Applications in Geospatial Technology Survey Questions
Questions SD D ID A SA
I . This class incresed my understanding of spatial thinking as it applies to life spaces in the world we 0 0 0 3 11 live
Percent of total student responses 0.0 0.0 0.0 21.4 78.6
2. This class increased my understanding of spatial thinking as it applies to scientific understanding or 0 2 4 7 visualizing the arrangement of the natural world.
Percent of total student responses 0.0 7.1 14.3 28.6 50.0
3. This class increased my understanding of spatial thinking as it applies to the relationship among objects 0 3 3 7 that have a spatial distribution or character.
Percent of total student responses 0.0 7.1 21.4 21.4 50.0
4. This class increased my understanding of how GIS (Geographic Information Systems) might be used to 0 0 5 solve a problem.
Percent of total student responses 0.0 0.0 14.3 14.3 71.4
5.This class increased my understanding of how GPS (Global Positioning Systems) might be used ot solve 0 0 0 3 11 a problem.
Percent of total student responses 0.0 0.0 0.0 21.4 78.6
6. This class increased my understanding of how RS 1 2 1 4
(Remote Sensing) might be used to solve a problem.
Percent of total student responses 11.l 22.2 11.l 11.l 44.4
7. This class increased my understanding of how GIS, GPS, and RS could be used to solve a problem in 1 5 4 Biology or another science course.
Percent of total student responses 8.3 8.3 8.3 41.7 33.3
(table continues)
20
Questions SD D ID A SA
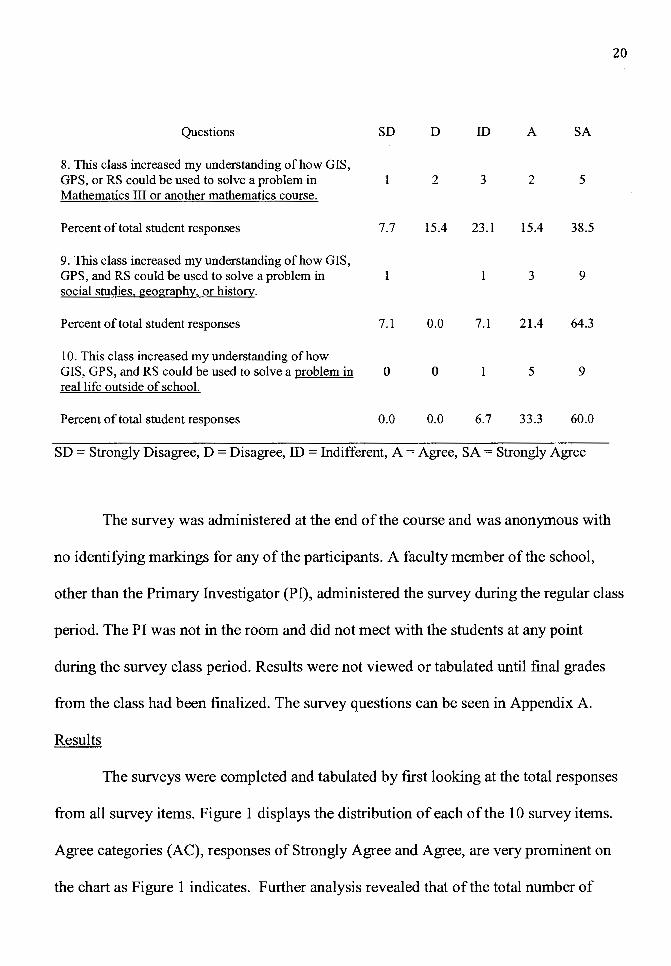
8. This class increased my understanding of how GIS, GPS, or RS could be used to solve a problem in 2 3 2 5 Mathematics III or another mathematics course.
Percent of total student responses 7.7 15.4 23.1 15.4 38.5
9. This class increased my understanding of how GIS, GPS, and RS could be used to solve a problem in 3 9 social studies. geography, or history.
Percent of total student responses 7.1 0.0 7.1 21.4 64.3
10. This class increased my understanding of how GIS, GPS, and RS could be used to solve a problem in 0 0 5 9 real life outside of school.
Percent of total student responses 0.0 0.0 6.7 33.3 60.0
SD = Strongly Disagree, D = Disagree, ID = Indifferent, A = Agree, SA= Strongly Agree
The survey was administered at the end of the course and was anonymous with
no identifying markings for any of the participants. A faculty member of the school,
other than the Primary Investigator (Pl), administered the survey during the regular class
period. The PI was not in the room and did not meet with the students at any point
during the survey class period. Results were not viewed or tabulated until final grades
from the class had been finalized. The survey questions can be seen in Appendix A.
Results
The surveys were completed and tabulated by first looking at the total responses
from all survey items. Figure 1 displays the distribution of each of the 10 survey items.
Agree categories (AC), responses of Strongly Agree and Agree, are very prominent on
the chart as Figure 1 indicates. Further analysis revealed that of the total number of
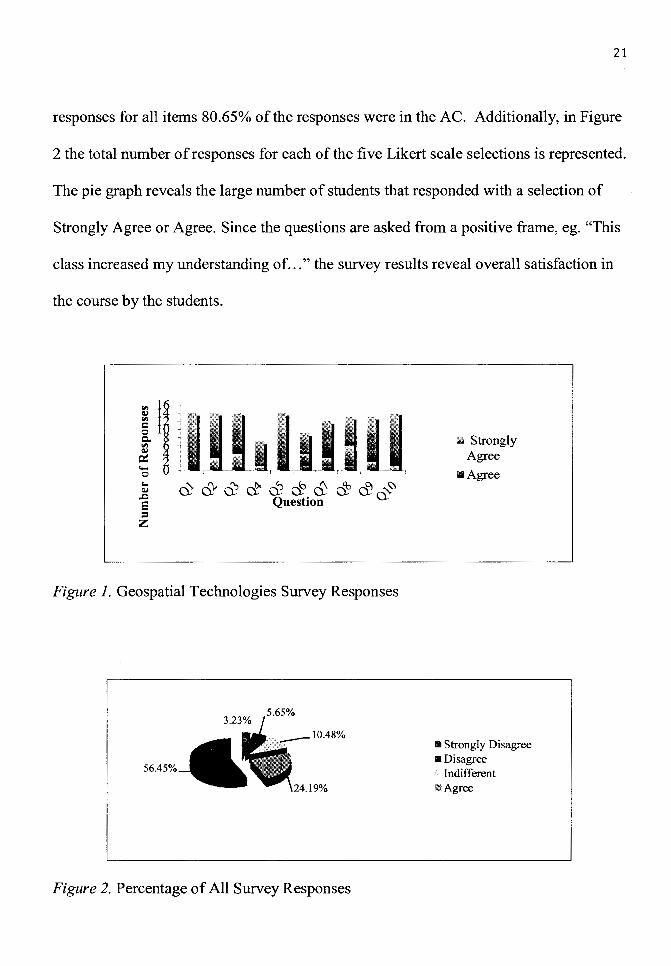
21
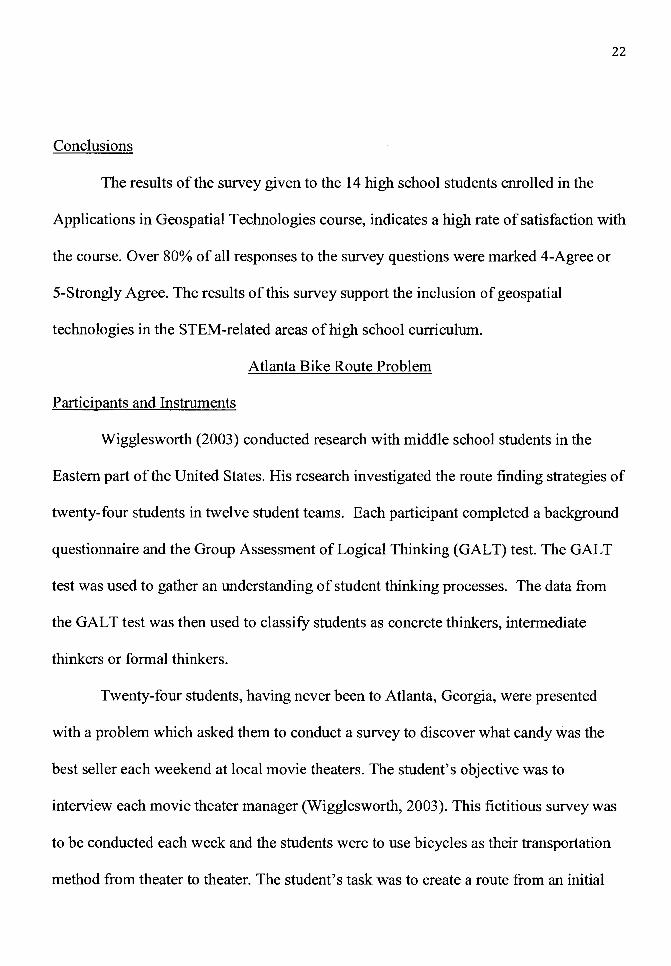
responses for all items 80.65% of the responses were in the AC. Additionally, in Figure
2 the total number ofresponses for each of the five Likert scale selections is represented.
The pie graph reveals the large number of students that responded with a selection of
Strongly Agree or Agree. Since the questions are asked from a positive frame, eg. "This
class increased my understanding of ... " the survey results reveal overall satisfaction in
the course by the students.
Figure 1. Geospatial Technologies Survey Responses
56.45%
Figure 2. Percentage of All Survey Responses
.,. Strongly Agree
111Agree
II Strongly Disagree •Disagree
Indifferent ~Agree
22
Conclusions
The results of the survey given to the 14 high school students enrolled in the
Applications in Geospatial Technologies course, indicates a high rate of satisfaction with
the course. Over 80% of all responses to the survey questions were marked 4-Agree or
5-Strongly Agree. The results of this survey support the inclusion of geospatial
technologies in the STEM-related areas of high school curriculum.
Atlanta Bike Route Problem
Participants and Instruments
Wigglesworth (2003) conducted research with middle school students in the
Eastern part of the United States. His research investigated the route finding strategies of
twenty-four students in twelve student teams. Each participant completed a background
questionnaire and the Group Assessment of Logical Thinking (GALT) test. The GALT
test was used to gather an understanding of student thinking processes. The data from
the GALT test was then used to classify students as concrete thinkers, intermediate
thinkers or formal thinkers.
Twenty-four students, having never been to Atlanta, Georgia, were presented
with a problem which asked them to conduct a survey to discover what candy was the
best seller each weekend at local movie theaters. The student's objective was to
interview each movie theater manager (Wigglesworth, 2003). This fictitious survey was
to be conducted each week and the students were to use bicycles as their transportation
method from theater to theater. The student's task was to create a route from an initial
23
business through four theater complexes to interview the theater managers, and then end
at an ice cream parlor. The route students designed needed to avoid major highways and
include the knowledge and skills they had learned from the GIS tutorial they participated
in earlier in the study.
Results
The Atlanta Bike Route Problem (ABRP) yielded interesting results that were
confirmed with the use of the GALT assessment, transcriptions of discussions and
Arc View Network Analyst, a computer mapping program (Wigglesworth, 2003). The
ABRP was a simplistic problem for the ArcVeiw network analyst. The network analyst
solution chose a route through four movie theaters and then to the final business.
Seventy five percent of the student pairs selected similar routes as the Network Analyst,
but the student pair groups each selected different street routes. Because of the simplistic
nature of the problem it could be assumed that students with a range of cognitive
abilities could solve the problem. However, when one looked for the best route the task
became more difficult.
This research provided evidence that students with previous map experience
displayed a more reasoned approach to solving the problem. The researcher concluded
that before working with geospatial technologies teachers should use other visual
devices such as organizers to help students configure their thinking and provide
opportunities for discussion and reading to gain further knowledge of geospatial
technologies (Wigglesworth, 2003).
24
Skills, such as the ability to find, read, and apply symbols from the map key to
the map are beneficial to the student when working with geospatial technologies. The
literature and current pedagogy regarding geospatial technologies in schools is squarely
focused on teaching students to think spatially first, then developing geospatial
technologies skills all incased in relevant projects for supporting student achievement
(Coulter, 2007; National Research Council, 2006; Sinton, 2007). Moreover,
Wigglesworth's (2003) experiment followed Merrill's (2006) instructional phases when
he asked students to; use prior experience, demonstrate skills using a GIS, apply the skill
through problem solving and use a real-world context from which to solve the Atlanta
Bike Route Problem.
Transfer of Learning
Transfer oflearning occurs in an environment where a learner discovers
analogous connections between separate and distinct contexts as compared to the
original learning milieu. Engle (2006) suggests that if a learner chooses to apply learning
in a particular context, the learner then is likely to see the context of the original learning
at least similar to the application context. Haskell (2001) links transfer of previous
learning to the influence it has on new situations. Along with Engle's (2006) and
Haskell's (2001) themes of contextual similarity and previous learning transfer
requirements, Anderson et al. (1996) explain transfer from a situative perspective. Their
thesis foundation centers on the specificity oflearning to the situation in which it is
formalized. The bond between previous learning contexts and present contexts when

learning seems clear. Discovering contextual connections from previous learning is at
the heart of transfer for the learner (Salomon & Perkins, 1989).
Intercontextuality
25
The linking of contexts, or intercontextuality, is hypothesized by Engle (2006) to
heighten the chance of learning transfer from one context to another. Relevance is a key
component in the creation of intercontextuality. When a learner sees the relevance of
learning in a new context and applies their learned knowledge, intercontextuality is
created. Moreover, Engle (2006) hypothesizes that when teachers make frequent
references to both the past and future learning the framing of time in this way connects
the contexts allowing students the ability to visualize connections and see a relevance of
the learning in new and different ways. With the real world applications of geospatial
technologies as Kerski (2003) refers, intercontextuality has natural applications in the
geospatial technologies realm.
Study and Participants
Engle (2006) reports on a research team that used observation, recording devices
and student work to try to understand four target research groups. Each of the fifth grade
target research groups was assigned an endangered animal to focus their study and from
which to prepare a report. One research group was chosen as the focus ofEngle's (2006)
study because this group, initially disinterested, exemplified transfer in their learning
about whales. The fifth graders research study was framed around three activities, which
hypothetically would encourage transfer and help to make generalizations: (a) reading in
reciprocal teaching sessions an article about the fit of species to environments, (b)
meeting in breakout groups to compare notes about how different animals do or do not
satisfy a given survival need, ( c) meeting in jigsaw groups to compare explanations to
different species (Engle, 2006).
Results
26
There were significant challenges of this research. During the study a five-week
teacher strike limited the flexibility in the curriculum schedule to take appropriate time
to complete the reports. Modifications were made on the fly, to ensure the students did
complete the reports, breakout sessions and reciprocal teaching sessions were suspended
after the strike. The jigsaw stage was less effective because of the significant time issue
the teacher strike imposed on the study (Engle, 2006).
Engle (2006) found that the framing of student activities did promote students
transfer of learning, especially when activities took place outside of the classroom,
allowing for more broadly referenced applications. The broad application ofleaming
could have been helpful in cueing students to relevant application contexts outside the
classroom. How the student's experiences in this study were framed and the
intercontextuality that existed could lead one to further this study toward a situated
theory of transfer.
Situated Leaming
Anderson et al. (1996) posit that situated learning promotes the ideal that
knowledge is specific to the situation in which it is learned. In their review of the
literature Anderson et al. (1996) look to four claims as the focus of their review. The
first claim is centered on action and its ties to situations in which it occurs. The second
27
claim asserts that knowledge between tasks does not transfer. Thirdly, they examine the
claim that abstract training is essentially not useful. Finally, the fourth claim Anderson
et al. (1996) review is the imperative that instruction has to be presented in a specific
context (p. 3-10).
Claim 1: Action is Grounded in Context
The central claim of situated learning thought is that action is grounded in the
context or situation in which it occurs. This claim has been supported by research and
has also been over generalized to infer that all learning and transfer is context bound.
General knowledge can be transferred. An example of this is in Carraher, Carraher and
Schliemann's (1985) account of Brazilian street children that were adept at completing
mathematics operations when conducting sales on the streets, but were much less
successful when asked to use the same skills in a school context. Carraher et al. (1985)
findings may suggest that concrete thought is inexorably tied to the context in which the
learner had applied the skill.
Claim 2: Knowledge Does Not Transfer Between Tasks
Anderson et al. (1996) examine a second claim, "Knowledge does not transfer
between tasks" (p. 6). The examination conducted by the researchers reviewed transfer
theory from as far back as 1844 and 185 8 in Weber's work, from Throndike and
Woodworth in the very early 201h Century, to Gick and Holyoak in the 1980's. Anderson
et al. (1996) through their research has come to the following conclusions regarding
transfer between tasks, (1) there can be either large amounts of transfer, a modest
amount, no transfer at all, or even negative transfer, (2) transfer varies from one context
28
to another depending on the shared components, and (3) the learner attention during
learning impacts the level and amount of transfer. In addition, Anderson et al. (1996) are
supported by Singley and Anderson (1989) in their findings that revealed the amount of
direct cognitive connection between tasks influenced the amount of transfer.
Claim 3: Training by Abstraction is of Little Use
In a review of this claim Anderson et al. (1996) position that the strong
advocates of apprentice type learning view typical school instruction as oflittle use. In
apprenticeship learning the apprentice would receive on-the-job training in specific
skills that they would continually use toward the success of specific responsibilities.
Apprenticeship learning can be effective in areas requiring highly skill-based activities
for the completion of tasks. However the application of apprentice-type schooling in all
walks of life would fail, especially in jobs that require a problem solving application. In
problem solving applications the abstract learning of a school setting could prepare
future workers with a reservoir oflearning opportunities.
Abstract learning, however, can be ineffective if the content of the learning and
the application on the job don't match (Anderson et al., 1996). The authors make
reference to a Los Angeles police officer being told to forget their academy training by
veteran officers. This opinion by veteran police officers could reveal disconnections
between what is presented for learning and what is required in the field for successful
law enforcement.
Anderson et al. ( 1996) support the effectiveness of abstract instruction. As proof
in a study completed by Biederman and Shiffrar (1987) 36 college age students with no
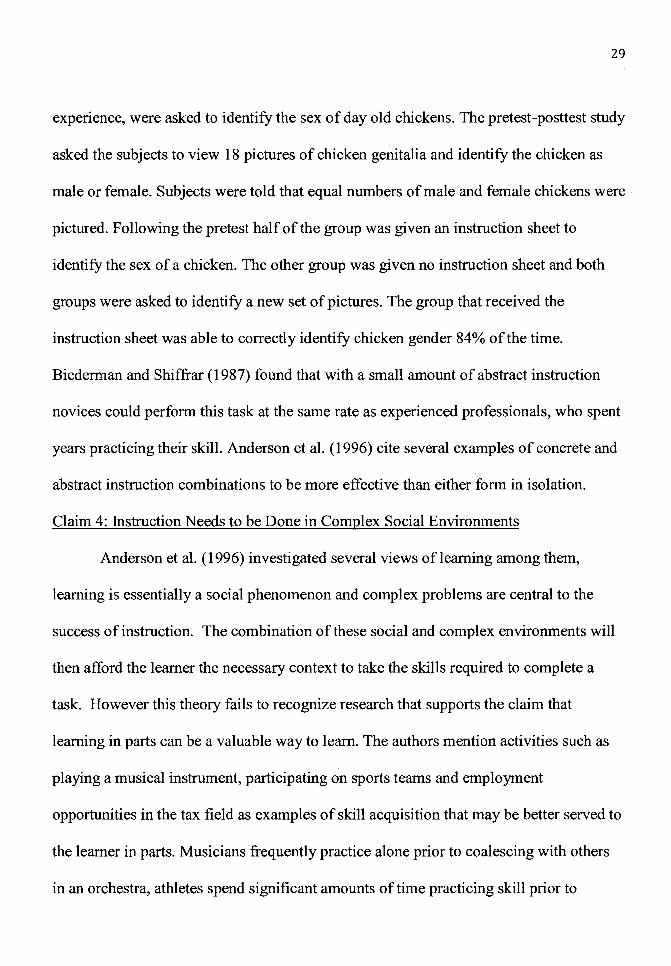
29
experience, were asked to identify the sex of day old chickens. The pretest-posttest study
asked the subjects to view 18 pictures of chicken genitalia and identify the chicken as
male or female. Subjects were told that equal numbers of male and female chickens were
pictured. Following the pretest half of the group was given an instruction sheet to
identify the sex of a chicken. The other group was given no instruction sheet and both
groups were asked to identify a new set of pictures. The group that received the
instruction sheet was able to correctly identify chicken gender 84% of the time.
Biederman and Shiffrar (1987) found that with a small amount of abstract instruction
novices could perform this task at the same rate as experienced professionals, who spent
years practicing their skill. Anderson et al. (1996) cite several examples of concrete and
abstract instruction combinations to be more effective than either form in isolation.
Claim 4: Instruction Needs to be Done in Complex Social Environments
Anderson et al. (1996) investigated several views of learning among them,
learning is essentially a social phenomenon and complex problems are central to the
success of instruction. The combination of these social and complex environments will
then afford the learner the necessary context to take the skills required to complete a
task. However this theory fails to recognize research that supports the claim that
learning in parts can be a valuable way to learn. The authors mention activities such as
playing a musical instrument, participating on sports teams and employment
opportunities in the tax field as examples of skill acquisition that may be better served to
the learner in parts. Musicians frequently practice alone prior to coalescing with others
in an orchestra, athletes spend significant amounts of time practicing skill prior to
30
performance in games, and accountants can learn tax laws and technology skills prior to
consulting with clients. Each of these activities requires participants to develop specific
knowledge and learn skills to apply their learning in complex ways (p. 9).
The result of the Nielsen et al. (2011) case study showed that geospatial
technology skills and their application might be enhanced by isolated introduction first,
followed by application. Building on the results of the Nielsen et al. (2011) case study,
this investigation will examine the application of geospatial technology skills in the core
areas of science and mathematics after initial introduction and application in a social
sciences context.
Situated Leaming Conclusion
While each of the claims that Anderson et al. ( 1996) approaches in their paper is
supported with research, there is evidence that the reciprocal of their argument is also
true. There are examples where geospatial technologies have been presented in an in
service opportunity, or abstractly, prior to classroom opportunities (Baker et al. 2009;
Bednarz & Audet 1999; Kerski 2003). Simply put, geospatial knowledge and skills may
be best learned in situations or context, or geospatial knowledge and skills may best be
learned abstractly.
Five Types of Knowledge
Haskell (2001) has identified five types of knowledge; (a) declarative-about
things, (b) procedural-how to, (c) strategic-cognitive processes, (d) conditional-when to
apply knowledge and (e) theoretical-explanatory connections (p. 101). Each knowledge
type has its own uniqueness's that in reality are difficult to distinguish one from each
31
other. The differences among the knowledge types are minute, however Haskell (2001)
believes that declarative knowledge is at the heart of transfer, which leads into the
others. Haskell (2001) states five reasons that declarative knowledge is the most vital for
transfer; (a) it provides the "preconditions necessary for the other four kinds of
knowledge", (b) it can include or initiate the other four, (c) it can assimilate new
knowledge, (d) it can facilitate the elaboration of new knowledge and (e) it can help
facilitate mental models for understanding (p. 101).
Haskell's Levels of Transfer
Calais (2006) reviewed Haskell's (2001) taxonomies of transfer of learning.
Calais (2006) found that Haskell (2001) described six levels of transfer which are; (1)
nonspecific transfer, (2) application transfer, (3) context transfer, (4) near transfer, (5)
far transfer and (6) displacement or creative transfer (p. 2-3). Each transfer level has it's
own characteristics which require increasing awareness of past learning connections to
new contexts (Calais, 2006). Level 1 and 2 do not promote transfer as such because each
level is a repurposing of previous learning. Level 3 is largely taking what was learned in
a different context and applying that learning to a new context, which does not fully
engage transfer to occur. Level 4, 5 and 6 require the student to learn something new for
transfer to take place. Near, far and creative transfers are each centered on new learning
which is cultivated from previous experiences. Furthermore it is clear that in Haskell's
(2001) view for noteworthy transfer to happen, new learning has to occur in order for
each transfer level to be actualized.
32
Haskell's (2001) Kinds of Transfer
A second way Haskell (2001) views transfer is by classifying the kinds of
transfer that occurs. The kinds of transfer may each seem it's own state, yet Haskell
warns that kinds of transfer can be connected one to another in any way; the kinds of
transfer are not exclusive to one another. Each of the 14 kinds of transfer Haskell
(2001) has identified has its own characteristics and reveals a transfer mode that
supports learning. The focus of each kind of transfer is the quest for new knowledge as
the learner chooses which mode of transfer to apply to new learning situations. For a list
of Haskell's (2001) 14 kinds of transfer see Appendix B.
Transfer of Leaming - Conclusion
Transfer of learning can occur in various forms, continuously and in all contexts
and situations for learners. Barnett and Ceci (2002) make an important point, "There is
little agreement in the scholarly community about the nature of transfer, the extent to
which it occurs, and the nature of its underlying mechanisms" (p. 612). There is,
however, agreement that transfer in fact does occur.
The purpose of this study is to investigate the transfer of geospatial technologies
skills and knowledge from social sciences to the other, STEM related, core areas of
science and mathematics among ninth grade students. Specifically this study seeks to
describe student application and transfer of geospatial technology skills to the core area
courses of Earth Science and Integrated Mathematics 1. Haskell's (2001) research on
"levels of transfer" provided the theoretical framework for this study.
Hypotheses and Research Questions
Hypothesis 1:
The experimental group will show statistically significantly higher ability to identify
geospatial technology skill transfer from U.S. History than will the control group.
Hypothesis 2:
The experimental group will show statistically significantly higher mean assignment
score than will the control group.
Hypothesis 3:
The experimental group will show statistically significantly higher content post-test
score than will the control group.
Hypothesis 4:
The experimental group will show statistically significantly higher ability to identify
geospatial technology skill application than will the control group.
Hypothesis 5:
The experimental group will show statistically significantly higher abilities to apply
deeper levels of transfer than will the control group.
The research question of this study is:
What is the relationship between interdisciplinary transfer of geospatial technology
skills from a social sciences context to student achievement in the STEM-related core
courses of Earth Science and Integrated Mathematics among ninth grade students?
33
CHAPTER3
METHODOLOGY
34
The purpose of this study was to investigate the transfer of skills and creation of
geospatial technologies knowledge from social sciences to the other STEM-related, core
areas of science and mathematics among ninth grade students. Specifically this study
sought to describe student use and transfer of acquired geospatial technologies skills and
knowledge to the STEM-related curricula demands of the core area courses of Earth
Science and Integrated Mathematics 1. Haskell's (2001) research on "levels of transfer"
provided the theoretical framework for this study (see Appendix I).
This chapter will start with a description of the subject. Following will be
explanations of the recruitment processes and procedures. Next the chapter will discuss
the contexts of the classes and class projects involved in the study. The chapter will
conclude w:ith a description of the geospatial technologies questionnaire.
Subjects
Participants of this study included 30 of the 36 members of the ninth grade class that
were enrolled in American History, Earth Science, and Integrated Mathematics 1
courses in the spring semester. No other students were eligible for the study. Students
were assigned to class sections at the beginning of the school year by school
administrators and were used as intact study groups. Subjects in the experimental group
of the Earth Science class also comprised the experimental group of the Integrated
Mathematics 1 class. This format was congruent for the control groups of both classes.
35
Recruitment
A ninth grade teacher participating in the study sent an email letter of invitation
to each ninth grade parent's primary email address (see Appendix C). The email invited
the participation of the ninth grader in the study. The email included the parental
permission letter in the body of the email as well as attached to the message. Parents
were instructed in their reply to copy and paste one of the following two responses:
I am fully aware of the nature and extent of my child's participation in this study as stated above and the possible risks arising from it. I have access to a printed copy of this form. I hereby agree to allow my son/daughter to participate in this study.
I am fully aware of the nature and extent of my child's participation in this study as stated above and the possible risks arising from it. I choose not to allow my son/daughter to participate in this study. A.J. Spurr (personal communication, March 20, 2012)
The email also included an internet confidentiality statement (see Appendix C).
The timing of the recruitment process coincided with parent teacher conferences at the
school. This afforded parents who had not responded to the email invitation an extra
opportunity to do so. If a reply was not received after four days a similar letter of
invitation to participate and parental consent was mailed to the ninth grade student's
home and included a self-addressed stamped envelope for return. The participating ninth
grade teacher received the email and letter replies then coded student names with
numbers to protect student anonymity.
Procedures
The procedures of this study included four parts. The first describes the initial
introduction of all ninth grade students to geospatial technologies in U.S. History. The

36
second part describes the organization of the experimental and control groups. The third
part describes the courses of Earth Science and Integrated Mathematics 1. The fourth
part describes the Geospatial Technology Questionnaire. See Appendix D for a
schematic of the procedures.
U.S. History Course
All students in the U.S. History course were introduced to geospatial
technologies through the course content. Specifically students were asked to use ArcGIS
Explorer Online to create a map presentation based on United States Westward
Movement in the 1800's. Students were assigned one of the historical trails of the
Mormon Trail, Donner Party Trail, Oregon Trail, Transcontinental Railroad and Pony
Express. Mapping the assigned trail using ArcGIS Explorer Online was the focus of the
project. The students created an ArcGIS Explorer Online account to build a map using
points, the measure tool and base maps, among other skills, in order to create an
informative map about their assigned trail. Class presentations of the maps culminated
the unit. Following the completion of the unit and before students were asked to use
geospatial technologies in Earth Science or Integrated Mathematics 1, both treatment
and control groups were given a geospatial technologies content assessment to gauge
their geospatial technologies base knowledge of ArcGIS Explorer Online (see Appendix
E).
The school's 1 to 1 computer configuration was integral to the U.S. History
project. The school created two sections of ninth grade students and assigned a computer
platform for each section at the beginning of the school year. One section had the use of
Macintosh MacBook computers and the other section had the use of Macintosh iPad
computers. These school-created groups would be used for the remainder of this study.
Experimental and Control Groups
37
The experimental group in both the Earth Science and Integrated Mathematics 1
courses were instructed with geospatial technologies, and were also instructed to use
geospatial technologies in their project completion. These students had the individual
use of Macintosh MacBook computers. The experimental group was pre- and post-tested
over the content of the curriculum.
The control group, in Earth Science and Integrated Mathematics 1, were
instructed without the use of geospatial technologies. The control group was not asked to
use geospatial technologies in their project completion and had individual use of
Macintosh iPads. The control group was pre- and post-tested over the content of the
curriculum with the same questions as were given to the experimental group.
Earth Science and Integrated Mathematics 1
Subjects in the experimental group Earth Science class plotted earthquake
distribution data. They acquired the data from the U.S. Geological Survey's earthquake
web site and were asked to use data from a one-week window around their last birthday.
Using ArcGIS Explorer Online the experimental group projected the data, about one
thousand points, onto a map to visualize the distribution of earthquakes around the
globe. Subjects compared the location of earthquakes and the location of tectonic plate
boundaries. The maps the subjects created required them to plot points, use the measure

tool and choose an appropriate base map at minimum. Other ArcGIS Explorer Online
tools were also used in the creation of the maps.
38
The Earth Science control group completed the same activity using a traditional
paper map. They plotted points and measured distanced, but did not have the luxury of a
selection of maps for their presentation. Class time limited hand point plotting to one
hundred points.
In Integrated Mathematics 1 both experimental and control groups were given
the same student project. The project asked students to look at five consolidated school
districts in Iowa. Each school district included three Iowa communities. The objective
was to find the optimum placement of a high school in relation to the three communities
using geospatial technologies to find the circum-center of the school district. There
were four focus questions of the student projects:
• Where would the optimum placement of the high school be and how far away is
it from each of the towns?
• Explain how you found the optimum placement of the high school for this
consolidated school district.
• In each case, how far away is the actual high school from the optimum high
school? Which one of the school districts was the closest to the optimum
placement of the their actual high school?
• What other factors might influence the placement of a high school for a newly
consolidated school district (name at least two)? Explain.
39
The experimental group used ArcGIS Explorer Online to complete their project. They
projected points, used the measure tool and choose an appropriate base map for their
project. The control group used traditional paper maps to complete their project. They
plotted points and measured distances with rulers. As was the case with the Earth
Science control group, they did not have the luxury of a digital map selection.
Both experimental and control groups for each class were pre and post tested
with multiple-choice curriculum content assessments. Each was designed, administered
and scored by the classroom teacher. The pre and post assessment content and
administration were identical within Earth Science and Integrated Mathematics 1
courses. Both the experimental and control groups were presented the same curriculum
during instruction. Inclusion of geospatial technologies in the experimental group
represented the sole difference between treatments.
Questionnaire
Following the completion of the target activities, the experimental group
completed an in class questionnaire focused on their use and application of geospatial
technologies in the STEM-related courses of Earth Science and Integrated Mathematics
1. Central to the questionnaire was how study subjects transferred skills from the
ArcGIS Explorer Online skill experiences received in U.S. History to the completion of
their projects in Earth Science and Integrated Mathematics 1. The following items on the
questionnaire specifically compared the use of points, the measure tool and base maps:
3. Explain the similarities of how you used points in the Earth Science I Earth Quake project compared to the U.S. History Westward Expansion project.
5. Explain the similarities of how you used the measure tool to measure distances to complete the Earth Science I Earth Quake project compared to the U.S. History Westward Expansion project.
7. Explain the similarities ofhow you used basemaps to complete the Earth Science I Earth Quake project compared to the U.S. History Westward Expansion project (For complete questionnaire see Appendix F)
Following the completion of the target activity the control group completed a
40
similar in-class questionnaire, which inquired about the potential use and application of
geospatial technologies in the STEM-related courses of Earth Science and Integrated
Mathematics 1. The following questions from the Integrated Mathematics 1 control
group questionnaire exemplify the central theme of the study.
3. Explain the similarities of how you could use points in the Integrated Mathematics 1 I School Consolidation project compared to the U.S. History Westward Expansion project.
5. Explain the similarities of how you could use the measure tool to measure distances to complete the Integrated Mathematics 1 I School Consolidation project compared to the U. S. History Westward Expansion project.
7. Explain the similarities of how you could use base maps to complete the Integrated Mathematics 1 I School Consolidation project compared to the U.S. History Westward Expansion project (For complete questionnaire see Appendix I)
The questionnaire contained eight open-ended questions in which the subjects
were asked to respond to each question in two to five sentences. Question one asked
subjects for their subject identification number. Questions two, four and six were paired
41
with the following question to prepare student thinking. The following paired questions
from the Earth Science Experimental Group Questionnaire exemplify this connection.
2. Explain how you used point or pins in the Earth Science I Earth Quake project.
3. Explain the similarities of how you used points in the Earth Science I Earth Quake project compared to the U.S. History Westward Expansion project.
Questions three, five and seven specifically examined learning transfer from U.S.
History to Earth Science or Integrated Mathematics 1. Rubrics that mirror Haskell's
levels of transfer (see Appendix J through N) were used to assess subject responses.
Analysis
A rating team was formed to assign a transfer score to each subject response to
questions three, five and seven. The rating team consisted of a K-12 teacher with 20
years of teaching experience and no prior teaching experience with geospatial
technologies; a tenured university professor who had taught geospatial technologies
courses and authored professional articles with educational geospatial technologies
themes; and the primary investigator of this study. The rating team had no contact with
the study subjects nor did they have access to the subject's name during the rating of
questionnaire responses. Each member of the rating team was given two three-ringed
binders. The study investigator provided these binders to each rating team member at
independent meetings. During the independent meetings each rater was informed as to
the contents of which questions of the questionnaire to rate. One binder contained
subject responses to each of the questionnaire items and one binder contained blank

42
rubrics as well as a rubric with sample responses for reference. Following their
independent ratings, the rating team convened to discuss their ratings and establish a
consensus score for each subject response. The consensus scores were used in the Chi
square statistical analysis of the questionnaire responses.
CHAPTER4
RESULTS
43
The purpose of this study was to investigate transfer of geospatial technologies
skills and knowledge from social sciences to other STEM-related, core areas of science
and mathematics among ninth grade students. Specifically this study sought to examine
student application and transfer of geospatial technology skills to the core area courses
of Earth Science and Integrated Mathematics 1. Haskell's (2001) research on "levels of
transfer" provided the theoretical framework for this study.
This chapter will discuss the results of each of the assessments as well as the
analysis conducted with the t-test and chi-square statistic. Each of the hypotheses, paired
with the appropriate statistic, will be discussed and analyzed.
The aim of the first analysis was to determine if there was any difference in
baseline knowledge of ArcGIS Explorer Online between the experimental and control
groups. An independent sample t-test was run on the geospatial technology skills
assessment subject scores. A mean score of28.33 from a possible 36 points was
calculated for all participants. When separated into study groups, the experimental group
mean (M = 27.57, SD= 4.36) and control group (M = 29, SD= 4.21) showed a
difference (-1.4286). The independent samples t-test mean score comparison (t = -0.91,
p = 0.19) indicates no statistically significant difference in the transfer of ArcGIS
Explorer Online skill and knowledge between the two groups. It is worth noting that all
participants had the same treatment and that the focus of this assessment was the skills
used of ArcGIS Explorer Online (see Table 2)
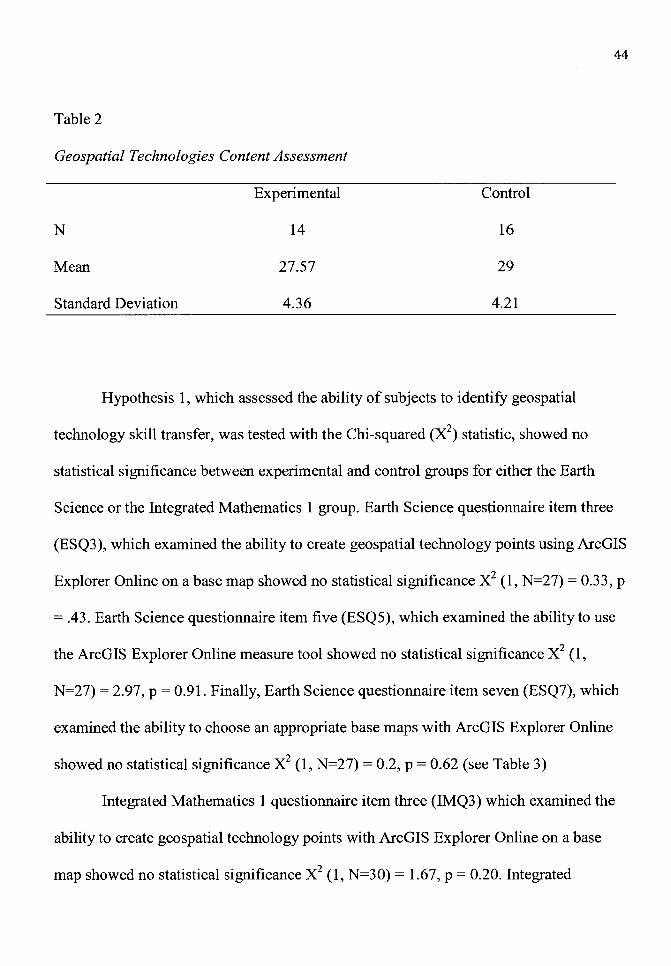
Table 2
Geospatial Technologies Content Assessment
N
Mean
Standard Deviation
Experimental
14
27.57
4.36
Control
16
29
4.21
44
Hypothesis 1, which assessed the ability of subjects to identify geospatial
technology skill transfer, was tested with the Chi-squared (X2) statistic, showed no
statistical significance between experimental and control groups for either the Earth
Science or the Integrated Mathematics 1 group. Earth Science questionnaire item three
(ESQ3), which examined the ability to create geospatial technology points using ArcGIS
Explorer Online on a base map showed no statistical significance X2 (1, N=27) = 0.33, p
= .43. Earth Science questionnaire item five (ESQ5), which examined the ability to use
the ArcGIS Explorer Online measure tool showed no statistical significance X2 (1,
N=27) = 2.97, p = 0.91. Finally, Earth Science questionnaire item seven (ESQ7), which
examined the ability to choose an appropriate base maps with ArcGIS Explorer Online
showed no statistical significance X2 (1, N=27) = 0.2, p = 0.62 (see Table 3)
Integrated Mathematics 1 questionnaire item three (IMQ3) which examined the
ability to create geospatial technology points with ArcGIS Explorer Online on a base
map showed no statistical significance X2 (1, N=30) = 1.67, p = 0.20. Integrated
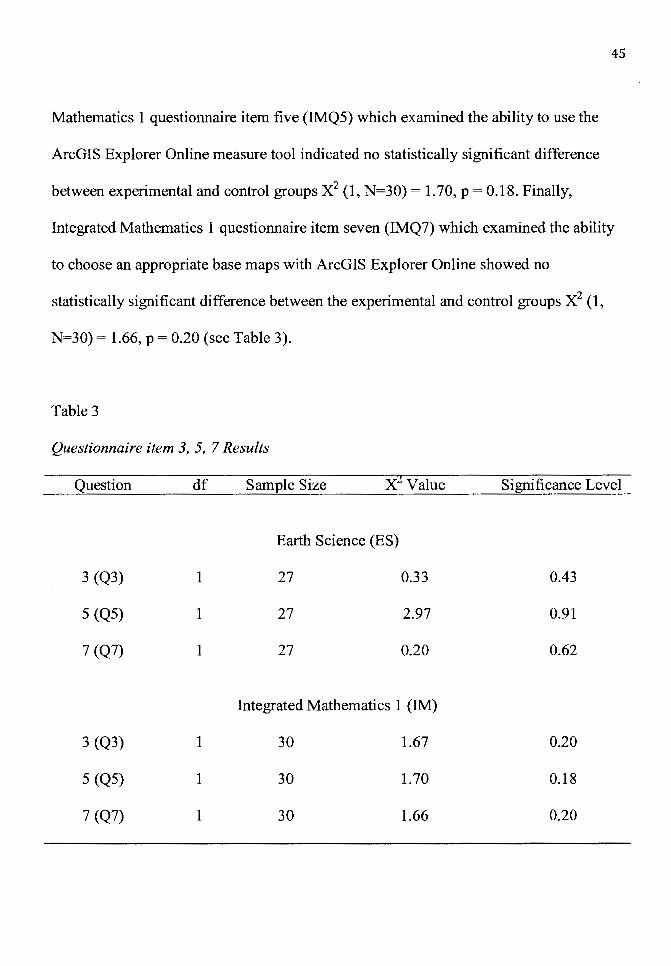
45
Mathematics 1 questionnaire item five (IMQ5) which examined the ability to use the
ArcGIS Explorer Online measure tool indicated no statistically significant difference
between experimental and control groups X2 (1, N=30) = 1.70, p = 0.18. Finally,
Integrated Mathematics 1 questionnaire item seven (IMQ7) which examined the ability
to choose an appropriate base maps with ArcGIS Explorer Online showed no
statistically significant difference between the experimental and control groups X2 (1,
N=30) = 1.66, p = 0.20 (see Table 3).
Table 3
Questionnaire item 3, 5, 7 Results
Question df Sample Size X Value Significance Level
Earth Science (ES)
3 (Q3) 1 27 0.33 0.43
5 (Q5) 1 27 2.97 0.91
7 (Q7) 1 27 0.20 0.62
Integrated Mathematics 1 (IM)
3 (Q3) 1 30 1.67 0.20
5 (Q5) 1 30 1.70 0.18
7 (Q7) 1 30 1.66 0.20
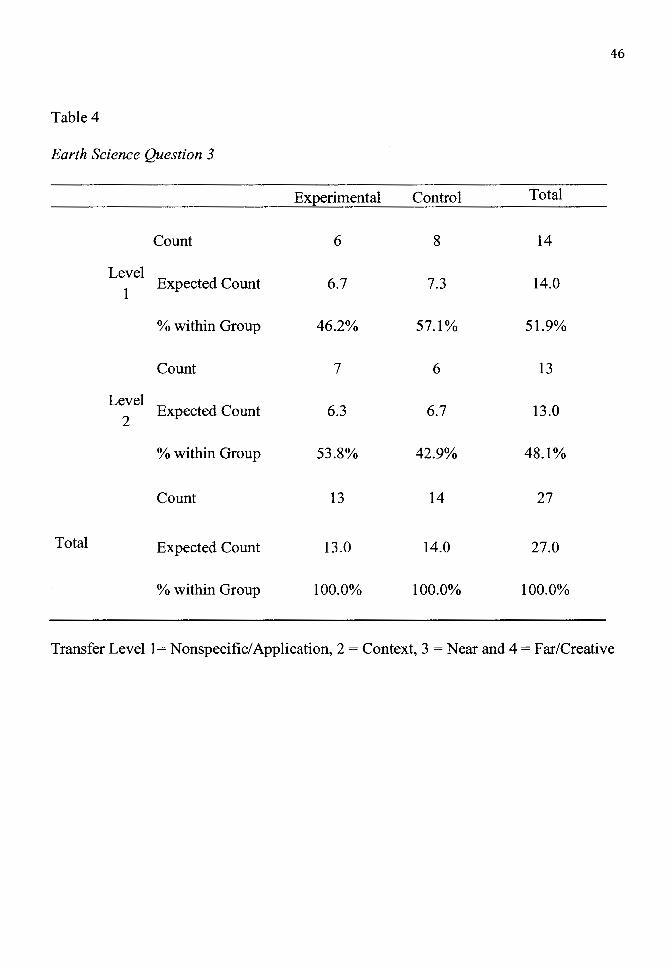
46
Table 4
Earth Science Question 3
Experimental Control Total
Count 6 8 14
Level Expected Count
1 6.7 7.3 14.0
% within Group 46.2% 57.1% 51.9%
Count 7 6 13
Level Expected Count 6.3 6.7 13.0
2
% within Group 53.8% 42.9% 48.1%
Count 13 14 27
Total Expected Count 13.0 14.0 27.0
% within Group 100.0% 100.0% 100.0%
Transfer Level 1 = Nonspecific/ Application, 2 = Context, 3 = Near and 4 = Far/Creative
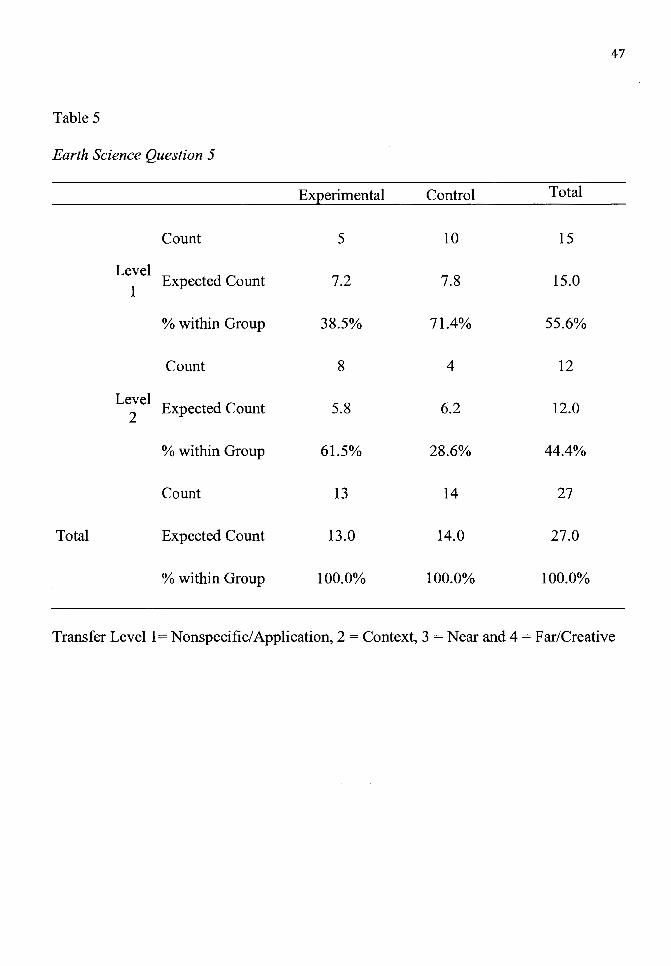
47
Table 5
Earth Science Question 5
Experimental Control Total
Count 5 10 15
Level Expected Count 7.2 7.8 15.0
1
% within Group 38.5% 71.4% 55.6%
Count 8 4 12
Level Expected Count 5.8 6.2 12.0
2
% within Group 61.5% 28.6% 44.4%
Count 13 14 27
Total Expected Count 13.0 14.0 27.0
% within Group 100.0% 100.0% 100.0%
Transfer Level 1 =Nonspecific/Application, 2 = Context, 3 = Near and 4 = Far/Creative

48
Table 6
Earth Science Question 7
Experimental Control Total
Count 9 10 19
Level Expected Count 9.1 9.9 19.0
1
% within Group 69.2% 71.4% 70.4%
Count 4 4 8
Level Expected Count 3.9 4.1 8.0
2
% within Group 30.8% 28.6% 29.6%
Count 13 14 27
Total Expected Count 13.0 14.0 27.0
% within Group 100.0% 100.0% 100.0%
Transfer Level 1 =Nonspecific/Application, 2 = Context, 3 = Near and 4 = Far/Creative
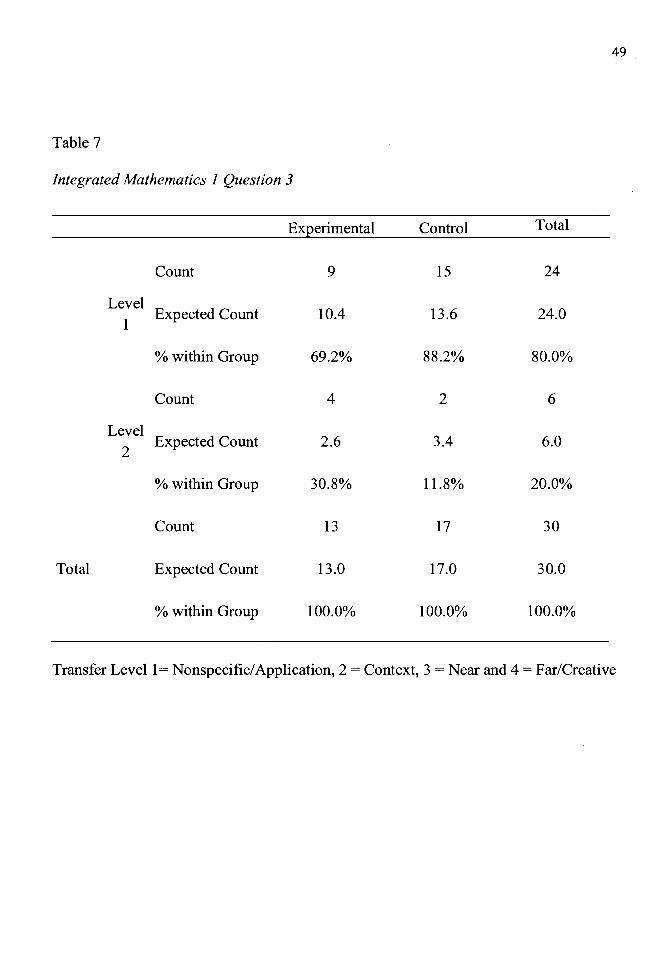
49
Table 7
Integrated Mathematics 1 Question 3
Experimental Control Total
Count 9 15 24
Level Expected Count 10.4 13.6 24.0
1
% within Group 69.2% 88.2% 80.0%
Count 4 2 6
Level Expected Count 2.6 3.4 6.0
2
% within Group 30.8% 11.8% 20.0%
Count 13 17 30
Total Expected Count 13.0 17.0 30.0
% within Group 100.0% 100.0% 100.0%
Transfer Level 1 = Nonspecific/ Application, 2 = Context, 3 = Near and 4 = Far/Creative
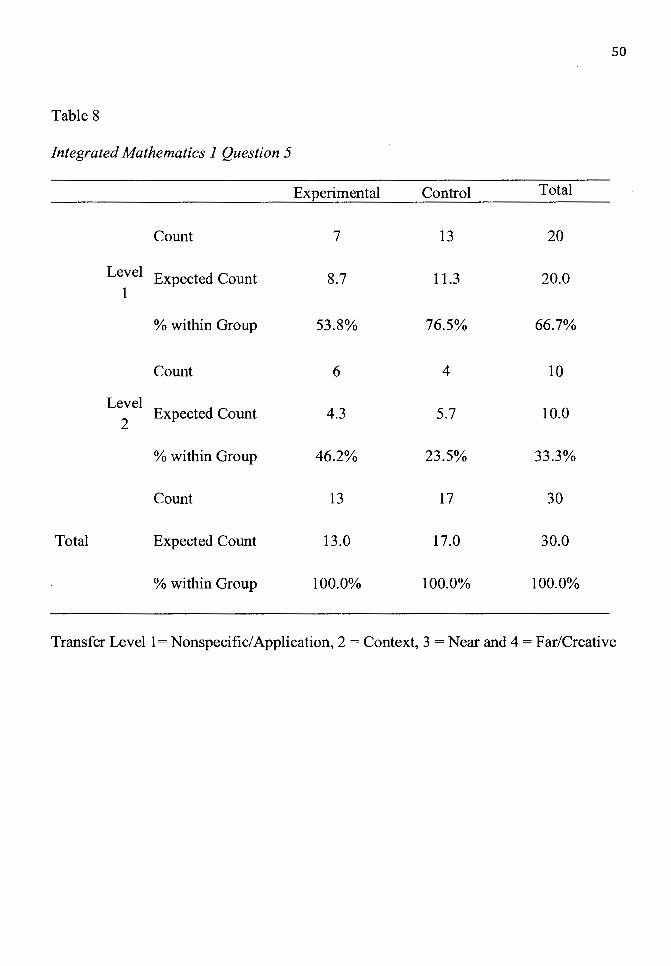
50
Table 8
Integrated Mathematics 1 Question 5
Experimental Control Total
Count 7 13 20
Level 1
Expected Count 8.7 11.3 20.0
% within Group 53.8% 76.5% 66.7%
Count 6 4 10
Level Expected Count 4.3 5.7 10.0
2
% within Group 46.2% 23.5% 33.3%
Count 13 17 30
Total Expected Count 13.0 17.0 30.0
% within Group 100.0% 100.0% 100.0%
Transfer Level 1 = Nonspecific/ Application, 2 = Context, 3 = Near and 4 = Far/Creative

51
Table 9
Integrated Mathematics I Question 7
Experimental Control Total
Count 9 15 24
Level Expected Count
1 10.4 13.6 24.0
% within Group 69.2% 88.2% 80.0%
Count 4 2 6
Level Expected Count
2 2.6 3.4 6.0
% within Group 30.8% 11.8% 20.0%
Count 13 17 30
Total Expected Count 13.0 17.0 30.0
% within Group 100.0% 100.0% 100.0%
Transfer Level I= Nonspecific/ Application, 2 = Context, 3 = Near and 4 = Far/Creative
Hypothesis 2 investigated the mean assignment scores of the experimental and
control groups. This hypothesis could not be assessed. The Earth Science and Integrated
Mathematics 1 classes did not include daily assignment scores for the study project.
Therefore, no data were available to analyze.
Hypothesis 3 examined the pre- and post-test difference scores of both groups.
The pre-test score was subtracted from the post-test score to yield the difference score
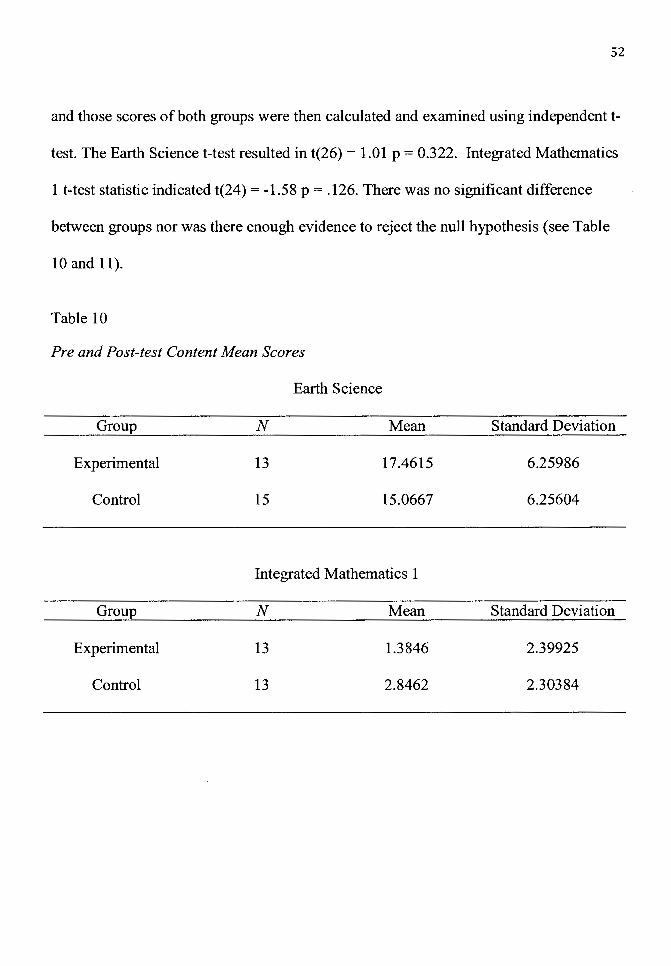
52
and those scores of both groups were then calculated and examined using independent t
test. The Earth Science t-test resulted in t(26) = 1.01 p = 0.322. Integrated Mathematics
1 t-test statistic indicated t(24) = -1.58 p = .126. There was no significant difference
between groups nor was there enough evidence to reject the null hypothesis (see Table
10 and 11).
Table 10
Pre and Post-test Content Mean Scores
Group
Experimental
Control
Group
Experimental
Control
N
13
15
Earth Science
Mean
17.4615
15.0667
Integrated Mathematics 1
N
13
13
Mean
1.3846
2.8462
Standard Deviation
6.25986
6.25604
Standard Deviation
2.39925
2.30384

53
Table 11
Pre and Post-test Content Difference Scores
Earth Science
N df t Significance Mean Difference
27 26 1.010 .322 2.39487
Integrated Mathematics 1
N df t Significance Mean Difference
25 24 -1.584 .126 -1.46154
Hypothesis 4 examined the subject's ability to identify higher levels of
geospatial technology skill application. Using the X2 statistic, Tables 4 through 9
indicate no statistical difference between the experimental and control groups. In
addition, Table 2 indicates p-values in excess of .05 for Q3, Q4 and Q5 of Earth Science
and Integrated Mathematics 1. ESQ5 data displayed the lowest p-value = 0.13 while
IMQ5 data received the highest p-value = 1. 70.
Hypothesis 5 compared the deeper levels of transfer between the two groups. An
examination of Table 4 through 9 reveals that students scored at Level 1, nonspecific
application and Level 2, context transfer levels only. There was no Level 3, near transfer
or Level 4, far/creative transfer identified through the transfer rubrics by the rating team.

The next and final chapter offers a discussion and implications of the findings
reported in this chapter.
54
CHAPTERS
DISCUSSION
55
The primary purpose of this study was to investigate transfer of skills and
creation of geospatial technologies knowledge from social sciences to the other STEM
related core areas of science and mathematics among ninth grade students. Specifically,
this study examined participants' use and transfer of acquired geospatial technologies
skills and knowledge to STEM-related demands of the core area courses of Earth
Science and Integrated Mathematics 1. Haskell's (2001) research on "levels of transfer"
provided the conceptual and theoretical framework for this study (see Appendix J). This
investigation sought to combine Collins and Halverson (2009), Coulter (2007),
Mackaness (2003), Nielsen et al. (2011), Prensky (2001) and Wiske and Beatty (2009)
and with Haskell's (2001) theories of transfer to examine subject transfer ability with
geospatial technology skills from one classroom context to another academic setting.
As was reported in the previous chapter, five hypotheses and one research
question were examined. The first hypothesis, which expected the experimental group to
show significantly higher ability to identify geospatial technology skill transfer than the
control group was not supported. The second hypothesis, which sought to demonstrate
that using geospatial technologies would have a positive impact on mean assignment
scores, was not supported. The third hypothesis investigated the difference in content
post-test scores of the study participant groups and was not supported by the data.
Hypothesis 4 expected experimental participants to demonstrate a higher ability to
identify geospatial technology skill application than the control group was not supported
by the data. Hypothesis 5 which investigated the abilities of the experimental
participants to apply deeper levels of transfer was not supported by the data.
56
The following sections will provide a discussion of these findings. Before
delving into the interpretation of the results, it is helpful to give a brief description of the
context of the study beyond what is described in Chapter 3.
Context
It will be helpful in contextualizing the results reported in Chapter 4 and this
interpretation in Chapter 5 to give a short explanation of the study. First all ninth grade
students were presented with a geospatial technologies project in the United States
History course. The project centered on a Westward Movement trail. The students were
to examine and research the trail and use the GIS tool ArcGIS Explorer Online to
complete the project. Students were to complete the project marking locations with the
points or pins tool, measuring appropriate distances from one point to another using the
measure tool and by choosing an appropriate base map. Following the completion of the
geospatial technologies map and class presentation the students were asked to complete
the Geospatial Technologies Content Assessment online. This multiple-choice
assessment was designed to gauge student's ability to use the ArcGIS Explorer Online
tool as can be seen in Appendix E. The results indicated there was no significant
difference between the experimental and control groups (see Table 2). Following the
completion of the Geospatial Technologies Content Assessment the Earth Science and
Integrated Mathematics 1 instructors began their projects with geospatial technologies
inclusion.

57
The Earth Science and Integrated Mathematics 1 teachers were asked to take a
unit of instruction that they taught in the past without technology and infuse geospatial
technologies into it with one section of students, the experimental group. The other
group of students were instructed exactly the same as in the past without technology and
no geospatial technologies. The only difference between the two groups was the use of
geospatial technologies with the experimental group.
Earth Science Overview
The distribution of Earthquakes in relation to fault lines was the focus of the
geospatial technologies based project in Earth Science. Students in the experimental
group acquired data from the U.S. Geological Survey's earthquake web site and were
asked to use data from a one-week period around their last birthday. The experimental
participants used ArcGIS Explorer online to project the data onto a map giving
visualization to the data. The control group completed the same project using paper map,
pencils and rulers.
Integrated Mathematics 1 Overview
The consolidation of Iowa school districts was the focus of the Integrated
Mathematics 1 course. Students were to study and investigate a current Iowa school
district that previously consolidated at least three Iowa community school districts. The
task was to find the optimal place for a high school that incorporated factors such as the
circum-center of the communities, equal distance from each community, roads and
physical geography of the area. The experimental group used the points or pins, measure
tool and base maps from ArcGIS Explorer Online to complete this project and the
control group used Iowa road maps, rulers and pencils.
58
Experimental Groups were Expected to Identify Geospatial Technology Skill Transfer
Study participants in the experimental groups did not show a statistically higher
ability to identify geospatial technology skill transfer than the control group. Table 3
displays significance levels from 0.02 to 0.91, higher than the norm of 0.05. There are
possible explanations for these results. For one study participants may not have
interpreted a difference between the projects they were asked to complete. They may
have seen the project in U.S. History and the other core areas as requiring essentially the
same skills as previously learned. If this were true, study participants may not have a
reason to explore the use of deeper levels of transfer. Secondly, study participants may
not have realized there were more applications with the ArcGIS Explorer Online
program than the points, measure tool and basemaps. This simplistic view of the
program may not have allowed study participants to learn new skills and transfer these
skills to new situations in new ways. Thus, near and far/creative transfer may have never
been discovered.
Connection Between Use of Geospatial Technologies and Assignment Scores
Hypothesis 2 focused on a connection between the study participants that used
geospatial technologies and increased assignment scores. During the study classroom
teachers were given the latitude to choose what projects they wanted to do and how to
proceed with the projects. The primary investigator met with the classroom teachers four
times prior to the start of the study. During these meetings the classroom teachers were
59
asked to teach a unit of study just as they had in the past, which included pre-tests,
assignments and post-tests. Both of the Earth Science and Integrated Mathematics 1
classroom teachers chose not to have students complete daily assignments. They instead
chose to focus their student's efforts fully toward the geospatial-related project in the
class. Because of this decision by the classroom teacher's data for hypothesis 2 could
not be obtained.
Difference in Content Pre- and Post-Test Between Groups
Hypothesis 3 of this investigation focused on the differences in content pre- and
post-test scores between the experimental and control groups. Each of the study
participants completed content pre- and post-tests for both Earth Science and Integrated
Mathematics 1. The following discussion is a comparison of the experimental and
control groups from Earth Science and Integrated Mathematics 1 classes.
Earth Science Group Comparison
The Earth Science group's pre-test, post-test scores were compared. The data
showed that the experimental group mean difference was 2.39 points higher than the
mean of the control group. This mean difference however is much less than the standard
deviations of 6.26 for the experimental and control groups indicating there is no
significant difference between the two Earth Science groups ( see Table 10 and 11 ).
The small difference in the mean scores of the two groups could reflect the small
number of participants (N). Pagano (2001) points out that the mean of a set of scores is
sensitive to each score in the distribution. In practical terms the small N of this study
may have increased the influence of each study participant's score to the mean of each
60
group. Conversely, with a larger N, each study participant's score may be less influential
on the group's mean ultimately changing the outcome of the study or increasing the
difference between the means of the two groups.
Another postulation for the similar pre-test, post-test scores may include that
correct responses on the pre- and post-tests were not dependent on participants using
geospatial technologies. Simply put, study participants who used the paper and pencil
project format may have gained as much knowledge about the contents of the project as
those who used geospatial technologies. This assumption may have been revealed
through assignment scores at specific points in the unit. The results may also suggest the
ArcGIS Explorer Online user may have been using the program in a simplistic way,
using only the features of point, measure tool and basemaps. Questioning participants
about those skills only may have diminished the known depth of understanding of other
skills students used. If study participants had been queried about the use of other
features of the program such as creating new layers, adding symbols, lines and queries
the results may have shown that study participants did use ArcGIS Explorer Online tools
in new and different ways.
Moreover, it is likely that using ArcGIS Explorer Online may have just been
another way to do the same old thing. The technology itself may not have impacted the
activities to a degree that allowed for a depth of understanding by the experimental
group to stand out. Finally, since all study participants were in the same school this
study had no way to protect against participants talking about their work with this
project.
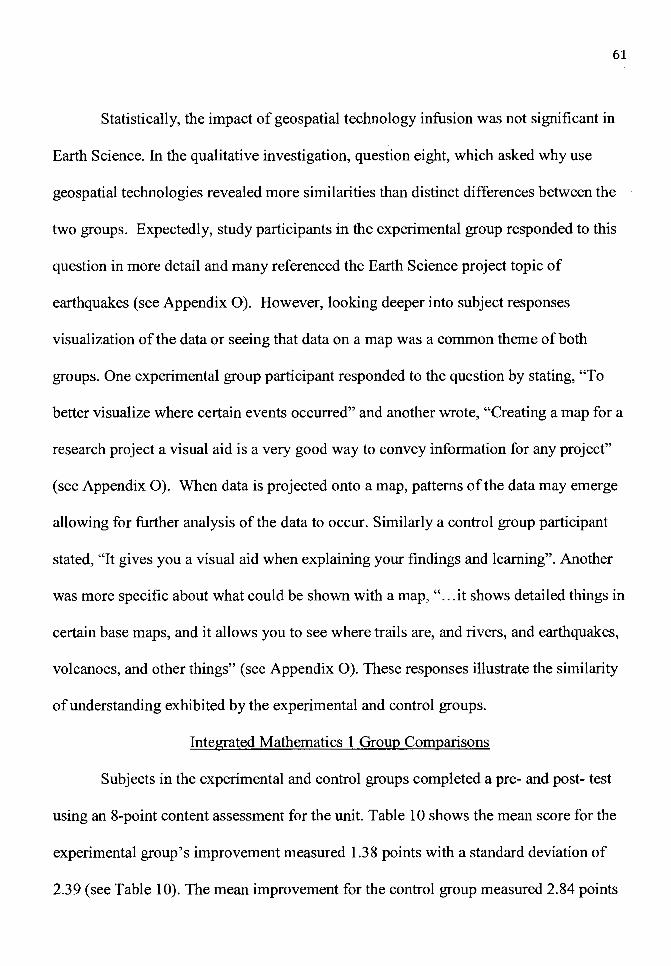
61
Statistically, the impact of geospatial technology infusion was not significant in
Earth Science. In the qualitative investigation, question eight, which asked why use
geospatial technologies revealed more similarities than distinct differences between the
two groups. Expectedly, study participants in the experimental group responded to this
question in more detail and many referenced the Earth Science project topic of
earthquakes (see Appendix 0). However, looking deeper into subject responses
visualization of the data or seeing that data on a map was a common theme of both
groups. One experimental group participant responded to the question by stating, "To
better visualize where certain events occurred" and another wrote, "Creating a map for a
research project a visual aid is a very good way to convey information for any project"
(see Appendix 0). When data is projected onto a map, patterns of the data may emerge
allowing for further analysis of the data to occur. Similarly a control group participant
stated, "It gives you a visual aid when explaining your findings and learning". Another
was more specific about what could be shown with a map, " .. .it shows detailed things in
certain base maps, and it allows you to see where trails are, and rivers, and earthquakes,
volcanoes, and other things" (see Appendix 0). These responses illustrate the similarity
of understanding exhibited by the experimental and control groups.
Integrated Mathematics 1 Group Comparisons
Subjects in the experimental and control groups completed a pre- and post- test
using an 8-point content assessment for the unit. Table 10 shows the mean score for the
experimental group's improvement measured 1.38 points with a standard deviation of
2.39 (see Table 10). The mean improvement for the control group measured 2.84 points
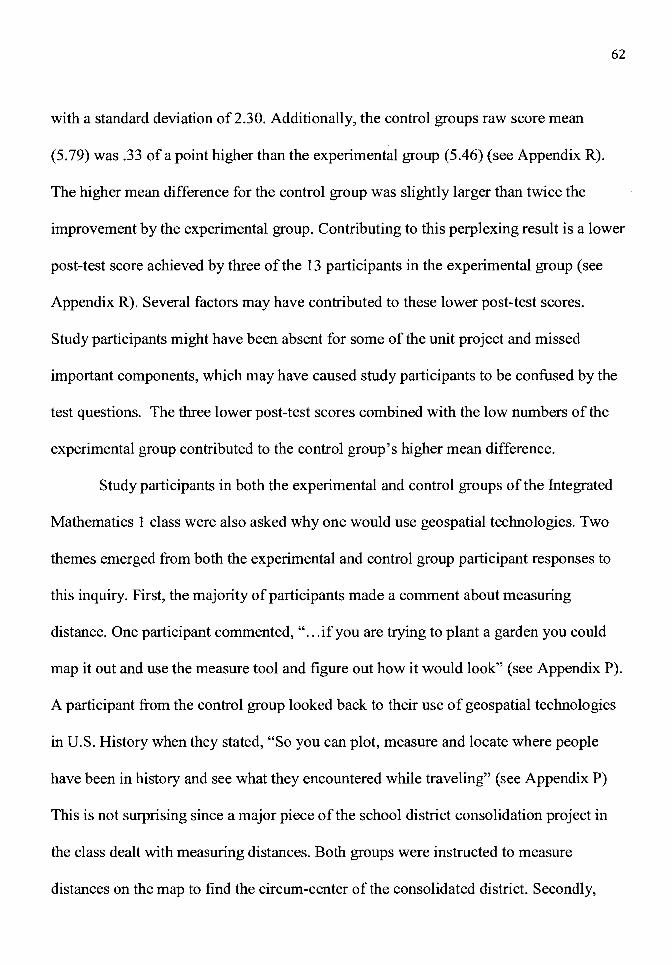
62
with a standard deviation of 2.30. Additionally, the control groups raw score mean
(5.79) was .33 of a point higher than the experimental group (5.46) (see Appendix R).
The higher mean difference for the control group was slightly larger than twice the
improvement by the experimental group. Contributing to this perplexing result is a lower
post-test score achieved by three of the 13 participants in the experimental group (see
Appendix R). Several factors may have contributed to these lower post-test scores.
Study participants might have been absent for some of the unit project and missed
important components, which may have caused study participants to be confused by the
test questions. The three lower post-test scores combined with the low numbers of the
experimental group contributed to the control group's higher mean difference.
Study participants in both the experimental and control groups of the Integrated
Mathematics 1 class were also asked why one would use geospatial technologies. Two
themes emerged from both the experimental and control group participant responses to
this inquiry. First, the majority of participants made a comment about measuring
distance. One participant commented," ... if you are trying to plant a garden you could
map it out and use the measure tool and figure out how it would look" (see Appendix P).
A participant from the control group looked back to their use of geospatial technologies
in U.S. History when they stated, "So you can plot, measure and locate where people
have been in history and see what they encountered while traveling" (see Appendix P)
This is not surprising since a major piece of the school district consolidation project in
the class dealt with measuring distances. Both groups were instructed to measure
distances on the map to find the circum-center of the consolidated district. Secondly,
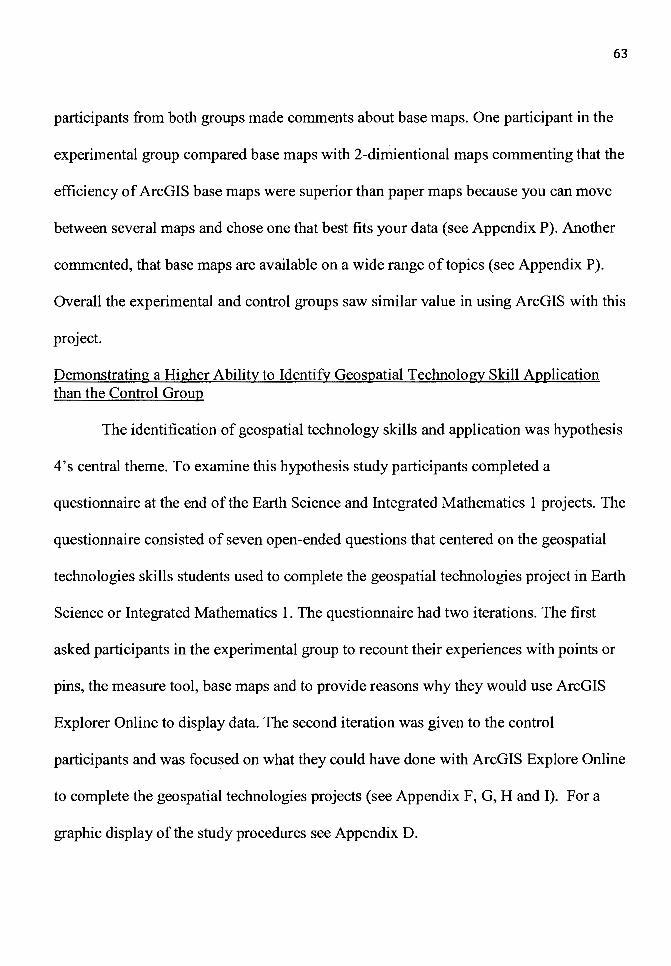
63
participants from both groups made comments about base maps. One participant in the
experimental group compared base maps with 2-dimientional maps commenting that the
efficiency of ArcGIS base maps were superior than paper maps because you can move
between several maps and chose one that best fits your data (see Appendix P). Another
commented, that base maps are available on a wide range of topics (see Appendix P).
Overall the experimental and control groups saw similar value in using ArcGIS with this
project.
Demonstrating a Higher Ability to Identify Geospatial Technology Skill Application than the Control Group
The identification of geospatial technology skills and application was hypothesis
4's central theme. To examine this hypothesis study participants completed a
questionnaire at the end of the Earth Science and Integrated Mathematics 1 projects. The
questionnaire consisted of seven open-ended questions that centered on the geospatial
technologies skills students used to complete the geospatial technologies project in Earth
Science or Integrated Mathematics 1. The questionnaire had two iterations. The first
asked participants in the experimental group to recount their experiences with points or
pins, the measure tool, base maps and to provide reasons why they would use ArcGIS
Explorer Online to display data. The second iteration was given to the control
participants and was focused on what they could have done with ArcGIS Explore Online
to complete the geospatial technologies projects (see Appendix F, G, Hand I). For a
graphic display of the study procedures see Appendix D.
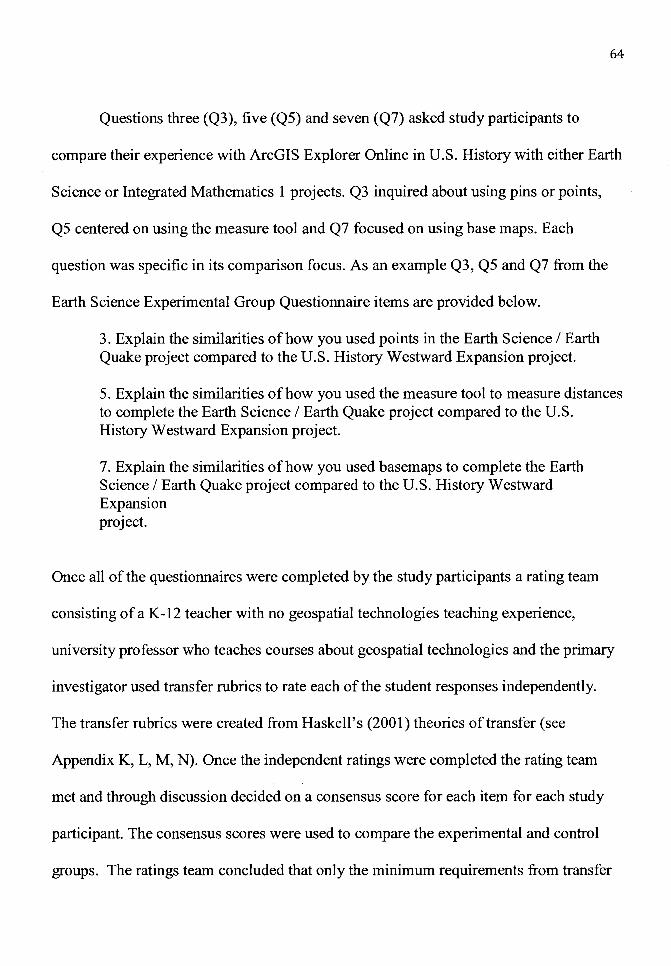
64
Questions three (Q3), five (Q5) and seven (Q7) asked study participants to
compare their experience with ArcGIS Explorer Online in U.S. History with either Earth
Science or Integrated Mathematics 1 projects. Q3 inquired about using pins or points,
Q5 centered on using the measure tool and Q7 focused on using base maps. Each
question was specific in its comparison focus. As an example Q3, Q5 and Q7 from the
Earth Science Experimental Group Questionnaire items are provided below.
3. Explain the similarities of how you used points in the Earth Science I Earth Quake project compared to the U.S. History Westward Expansion project.
5. Explain the similarities of how you used the measure tool to measure distances to complete the Earth Science I Earth Quake project compared to the U.S. History Westward Expansion project.
7. Explain the similarities of how you used basemaps to complete the Earth Science I Earth Quake project compared to the U.S. History Westward Expansion project.
Once all of the questionnaires were completed by the study participants a rating team
consisting of a K-12 teacher with no geospatial technologies teaching experience,
university professor who teaches courses about geospatial technologies and the primary
investigator used transfer rubrics to rate each of the student responses independently.
The transfer rubrics were created from Haskell's (2001) theories of transfer (see
Appendix K, L, M, N). Once the independent ratings were completed the rating team
met and through discussion decided on a consensus score for each item for each study
participant. The consensus scores were used to compare the experimental and control
groups. The ratings team concluded that only the minimum requirements from transfer
levels 1, nonspecific application and 2, context, were met by student responses to
questionnaire inquiries.
65
Higher levels of transfer were not evident in the student responses to
questionnaire items Q3, Q5 and Q7. There could be many reasons for this. In his work
on transfer Haskell (2001) cites content-to-content transfer as learning a skill in one
subject and employing that skill in another (p. 31 ). Participant responses to Q3, Q5 and
Q7 may exemplify content-to- content transfer as described by Haskell (2001). The
participants may not have distinguished any significant geospatial skill requirement
differences between the projects in U.S. History and Earth Science or U.S. History and
Integrated Mathematics 1. Consequently, the participants may simply have used the
same ArcGIS Explorer Online geospatial processes in Earth Science and Integrated
Mathematics 1 as they had previously used in U.S. History. If this were the case the
required geospatial skills needed to complete the projects in Earth Science and
Integrated Mathematics 1 may not have required students to think beyond their current
knowledge limiting transfer levels to nonspecific/application and context.
If the study participant's viewed the U.S. History to Earth Science or U.S.
History to Integrated Mathematics 1 projects as similar or the same the projects may not
have promoted new learning as Haskell (2001) claims to be a requirement for higher
levels of transfer (p. 30). If this were the case study participants may not have explored
other skills and techniques they could have used to complete or enhance the Earth
Science or Integrated Mathematics 1 projects. Additionally, if study participants carried
a narrow view of ArcGIS Explorer Online skills, limited to marking points, measuring
66
distances and changing basemaps, to Earth Science and Integrated Mathematics 1 the
higher levels of near or far and creative transfers could have simply been suppressed or
not explored at all. A next step for this study may be to compare geospatial skill transfer
between two course projects that require the use of different features of ArcGIS Explorer
Online. A study environment that includes vastly different projects between subject
areas may afford more opportunities for higher levels of transfer.
A time element could be another factor in the lack of higher levels of transfer
appearing in this study. Study participants completed all three projects over a six-week
period. Ifthere had been a longer time between the U.S. History and Earth Science and
Integrated Mathematics course projects there may have been a significant difference in
transfer between the experimental and control groups. Moreover, if the study had been
conducted longer than six-weeks with more projects there may have been a significant
difference in transfer revealed.
Applying Deeper Levels of Transfer
Hypothesis 5 of this study investigated the experimental group's ability to apply
deeper levels of transfer than the control group. Like each hypothesis before it,
hypothesis 5 was not supported by this study. Several of the previously stated reasons
could also have impacted the realization of this hypothesis. Student's could have not
realized the depth of the use of ArcGIS Explorer Online, small participant numbers,
completion of the study project may not have been dependent on geospatial
technologies, and students communicating about the study outside of class may all have
played a role in the failure of hypothesis five. Additionally Haskell (2001) points to
67
many theorists who agree that numerous examples of outcomes aid in the transfer of
learning from one subject to another. In the case of this study and the lack of attainment
of the hypotheses it may be any or none of the previously mentioned reasons or it
possibly could simply be the lack of an instructional strategy that influenced the
outcome.
Limitations
As with all studies, this investigation has limitations. The sample for this
exploratory setting was small. It was difficult for the study participants to convey a
geospatial technology skill at Haskell's (2001) higher levels of transfer. A future study
may employ a larger sample given the sample in this study was small.
The construction of the questionnaire may have been limiting. The questionnaire
consisted of eight open response questions taking into account the writing ability and
stamina of the ninth grade study participants. The short answer questionnaire format did
not allow for follow up probing questions to clarify a study participant's written
response. If given a chance to expand on their responses, study participants may have
shown a greater ability to transfer geospatial skills from one core subject to another.
The construction of the Geospatial Technology Questionnaire rating team may
have provided another limitation for this study. The inclusion of the Primary
Investigator on the rating team may have influenced other rater's scores or inhibited
their comments during the discussion phase of the rating. This could have influenced the
rating team's consensus score, which was used in the statistical analysis of this study. In
the future, it may be wise to remove the primary investigator from the rating team and
recruit a K-12 instructor who is familiar with geospatial technologies from another
school to serve as the third rater on the rating team.
68
A final limitation may have been the classroom instructor's lack of experience
using geospatial technology. The classroom instructor's limited experiences with
geospatial technology prior to this investigation may have negated subtle influences of
teaching experience veteran teacher's typically employ. Kerski (2003) pointed out that
one barrier to geospatial technology use is the lack of pre- and in-service training. To
counter this influence in the future providing teachers with more in-service opportunities
on how to use geospatial technologies in the classroom may be beneficial.
Future Directions
This study was conducted with 30 participants in a small high school with a total
of 120 students. If in the future this study was conducted in a larger school with more
study participants the results may be more positive toward the hypotheses. A larger
school may also afford the investigator opportunities to employ multiple classrooms and
multiple student groups. Using multiple schools or multiple student groups within a
school to increase the participant population may provide a researcher with necessary
data to more fully examine transfer of geospatial technologies between core subject
areas.
In addition, future studies could be based on the following questions to more
fully examine the impact and transfer of geospatial technologies in K-12 settings:
• Would follow up interviews show different and richer results in questionnaire
responses of geospatial technology study participants?
• What impact would an elementary level introduction of geospatial technologies
have on student achievement in high school?
69
• How do curricular examples during teaching that include geospatial technologies
impact the transfer of geospatial technology skills for students?
• Do students show a greater interest in classes that incorporate geospatial
technologies in K-12 settings?
• Do problem-based projects that encourage geospatial technology use increase
student achievement among high school students?
• Are students more likely to go into a profession based on geospatial technologies
if they had a geospatial technologies class in their K-12 school experience?
These are just a few questions that could form the basis of future studies to
strengthen the use of geospatial technologies in K-12 institutions. The inclusion of
geospatial technologies in the K-12 setting provide a rich opportunity for future research
and have the potential to play a significant role in enhancing the relevancy of education
in our schools.
REFERENCES
Aerospace (2012). The global positioning system (GPS). Retrieved August 13, 2012, from http://www. aero .org/innovations/GPS.
Anderson, J. R., Reder, L. M. & Simon, H. A. (1996). Situated learning and education. Educational Researcher Vol. 25(4) 5-11.
70
Baker, T. R., Palmer, A. M. & Kerski, J. J. (2009). A national survey to examine teacher professional development and implementation of desktop GIS. Journal of Geography, 108, 174-185.
Baker, T. R., & White, S. H. (2003). The effects of GIS on students' attitudes, selfefficacy, and achievement in middle school science classrooms. Journal of Geography, 102, 243-254.
Barnett, S. M. & Ceci, S. J. (2002). When and where do we apply what we learn? a taxonomy for far transfer. Psychological Bulletin, 128(4), 612-637.
Beatty, B. J. (2009). Fostering integrated learning outcomes across domains. In C. M. Reigeluth & A. A. Carr-Chellman (Eds.), Instructional-design theories and models: Building a common knowledge base (pp. 275-299). New York, NY: Routledge.
Bednarz, R. S., Bednarz, S. W., Filippi, A., Klein, A., Kincaid, J., Martinez, ... Williams, N. (2007). Advancing geospatial skills in science and social science: Connecting university to K-12 to improve spatial thinking. PowerPoint presentation at the Environmental Services Research Institute Educator Users Conference. San Diego, CA. June 17, 2007.
Bednarz, S.W., Acheson, G. & Bednarz, R.S. (2006). Maps and map learning in social studies. Social Education 70(7) 398-404, 432.
Bednarz, S. W. & Audet, R. H. (1999). The status of GIS technology in teacher preparation programs. Journal of Geography, 98, 60-67.
Biederman, I. & Shiffrar, M. M. (1987). Sexing day-old chicks: A case study and expert systems analysis of a difficult perceptual-learning task. Journal of Experimental Psychology: Learning, Memory and Cognition 13(4), 640-645.
Calais, G. J. (2006). Haskell's taxonomies of transfer oflearning: Implications for classroom instruction. National Forum of Applied Educational Research Journal, 20(3), 1-8.
Carraher, T. N., Carraher, D. W. & Schliemann, A. D. (1985). Mathematics in the streets and in schools. British Journal of Developmental Psychology, 3, 21-29.
71
Collins, A. & Halverson, R. (2009). Rethinking education in the age of technology: The digital revolution and the schools. New York, NY: Teachers College Press.
Coulter, R. (2007, June). Cool tools for geoschools. Paper presented at the Seventh Annual Environmental Services Research Institute Education User Conference, San Diego, CA.
Doering, A. & Veletsianos, G. (2007). An investigation of the use ofreal-time, authentic geospatial data in the k-12 classroom. Journal of Geography, 106(6), 217-225.
Dubois, E., Truillet, P. & Bach, C. (2007, September). Evaluating advanced interaction techniques of navigating google earth. Paper presented at meeting of British Computer Society, Lancaster University, United Kingdom.
Engle, R. A. (2006). Framing interactions to foster generative learning: A situative explanation of transfer in a community of learners classroom. The Journal of the Learning Sciences, 15( 4), 451-498.
Environmental Systems Research Institute (1995). Exploring common ground: The educational promise ofGIS. Retrieved November 27, 2009, from http://www.esri.com/industries/k-12/education/educators.html
Fisch, K & McLeod, S. (Producers). (2007). Did you know? (Shift happens). Available from http://www. teachertube. com/video List. php?pg=videomostviewed
GIS.com (2011). What is GIS?. Retrieved September 25, 2011, from http://www.gis.com/content/what-gis
Haskell, R. E. (2001). Transfer of learning: Cognition, instruction and reasoning. San Diego, CA: Academic Press.
Hecker, D. E. (2005, November). Occupational employment outlook to 2014. Monthly Labor Review, 70-101.
Iowa Department of Education (2011). One unshakable vision: World class schools for Iowa. Retrieved October 3, 2011, from http://educateiowa.gov/
Johannson, T. (2003). GIS in teacher education: Facilitating GIS applications in secondary school geography. Retrieved May 15, 2007, from http://www.scangis.org/scangis2003/papers/20.pdf
72
Kerski, J. J. (2003). The implementation and effectiveness of geographic information systems technology and methods in secondary education. Journal of Geography, 102, 128-137.
Lindsey, L., & Berger N. (2009). Experiential approach to instruction. In C. M. Reigeluth & A. A. Carr-Chellman (Eds.), Instructional-design theories and models: Building a common knowledge base (pp. 117-142). New York, NY: Routledge.
Lobato, J. (2006). Alternative perspectives on the transfer ofleaming: History, issues, and challenges for future research. The Journal of the Learning Sciences, 15 ( 4 ), 431-449.
Mackaness, W. A. (1994). Curriculum issues in GIS K-12. Retrieved June 25, 2007, from http://libraries.maine.edu/Spatial/ gisweb/ spatdb/ gis-lis/ gislis-c.htm
Mackaness, W. A. (2003). The implementation and effectiveness of geographic information systems technology and education in secondary education. Journal of Geography, 102, 560-568.
Merrill, M. D. (2002). First principles of instruction. Educational Technology Research and Development, 50(3), 43-59.
Merrill, M. D. (2006). Levels of instructional strategy. Educational Technology, 46, 5-10.
Merrill, M. D. (2009). First principles of instruction. In C. M. Reigeluth & A. A. CarrChellman (Eds.), Instructional-design theories and models: Building a common knowledge base (pp. 3-26). New York, NY: Routledge.
Meyer, J. W., Butterick, J., Olkin, M. & Zack, G. (1999). GIS in the k-12 curriculum: A cautionary note*. Professional Geographer, 51 ( 4 ), 571-578.
Moeller, B. & Reitzes, T. (2011). Integrating technology with student-centered learning. Retrieved from Nellie Mae Education Foundation website: http://www.nmefdn.org/Research/pubs.aspx?a=4e368 l 20-7 d l 3-4ce8-bf8eda2a691 e9f44&l=Research%20and%20Reports&rl=--,/Research/

73
National Research Council (NRC). (2006). Learning to think spatially. Washington, DC: National Academies Press.
Nielsen, C., Oberle, A, & Sugumaran, R. (2011). Implementing a high school level geospatial technologies and spatial thinking course. Journal of Geography, 110(2) 60-69.
Pagano, R.R. (2001 ). Understanding statistics in the behavioral sciences. Belmont, CA: Wadsworth/Thomson Leaming.
Prensky, M. (October, 2001). Digital natives, digital immigrants. MCB University Press, 9(5), 1-6.
Salomon, G. & Perkins, D. N. (1989). Rocky roads to transfer: Rethinking mechanisms of a neglected phenomenon. Educational Psychologist, 24(2), 113-142.
Singley, M. K. & Anderson, J. R. (1989). The transfer of cognitive skill. Cambridge, MA: Harvard University Press.
Sinton, D.S., & Lund, J. J. (2007). Understanding place: GJS mapping across the curriculum. Redlands, CA: ESRI press.
Slavery, J. R. (2009). Problem-based approach to instruction. In C. M. Reigeluth & A. A. Carr-Chellman (Eds.), Instructional-design theories and models: Building a common knowledge base (pp. 143-167). New York, NY: Routledge.
United States Department of Labor. (2005). Identifying and addressing workforce challenges in americas geospatial technology sector. Retrieved November 27, 2009, from http://www.doleta.gov/BRG/Indprof/Geospatial.cfm
United States Department of Labor. (2006). Defining and communicating geospatial industry worliforce demand: Phase I draft for comment. Retrieved April 21, 2008, from http://www.aag.org/giwis/phase-one/phase-one-report-v3-5-31-06.pdf
United States Department of Labor. (2010) Occupational outlook handbook, 2010-11 Edition. Retrieved August 1, 2011 from http://www. bls. gov loco/ ocos040 .htm#outlook
Wigglesworth, J.C. (2003). What is the best route? Route-finding strategies of middle school students using GIS. Journal of Geography, 102, 282-291.

Wiske, M. S., & Beatty, B. J. (2009). Fostering understanding outcomes. In C. M. Reigeluth & A. A. Carr-Chellman (Eds.), Instructional-design theories and models: Building a common knowledge base (pp. 249-273). New York, NY: Routledge.
74
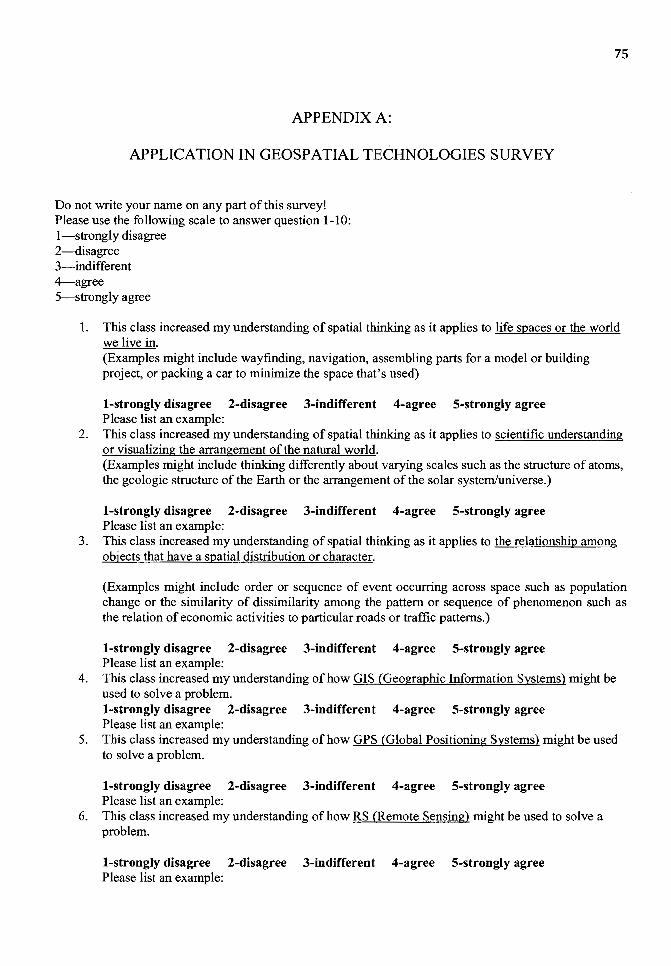
APPENDIX A:
APPLICATION IN GEOSPATIAL TECHNOLOGIES SURVEY
Do not write your name on any part of this survey! Please use the following scale to answer question 1-10: I-strongly disagree 2-disagree 3-indifferent 4-agree 5-strongly agree
75
1. This class increased my understanding of spatial thinking as it applies to life spaces or the world we live in. (Examples might include wayfinding, navigation, assembling parts for a model or building project, or packing a car to minimize the space that's used)
I-strongly disagree 2-disagree 3-indifferent 4-agree 5-strongly agree Please list an example:
2. This class increased my understanding of spatial thinking as it applies to scientific understanding or visualizing the arrangement of the natural world. (Examples might include thinking differently about varying scales such as the structure of atoms, the geologic structure of the Earth or the arrangement of the solar system/universe.)
I-strongly disagree 2-disagree 3-indifferent 4-agree 5-strongly agree Please list an example:
3. This class increased my understanding of spatial thinking as it applies to the relationship among objects that have a spatial distribution or character.
(Examples might include order or sequence of event occurring across space such as population change or the similarity of dissimilarity among the pattern or sequence of phenomenon such as the relation of economic activities to particular roads or traffic patterns.)
I-strongly disagree 2-disagree 3-indifferent 4-agree 5-strongly agree Please list an example:
4. This class increased my understanding of how GIS (Geographic Information Systems) might be used to solve a problem. I-strongly disagree 2-disagree 3-indifferent 4-agree 5-strongly agree Please list an example:
5. This class increased my understanding of how GPS (Global Positioning Systems) might be used to solve a problem.
I-strongly disagree 2-disagree 3-indifferent 4-agree 5-strongly agree Please list an example:
6. This class increased my understanding of how RS (Remote Sensing) might be used to solve a problem.
I-strongly disagree 2-disagree 3-indifferent 4-agree 5-strongly agree Please list an example:
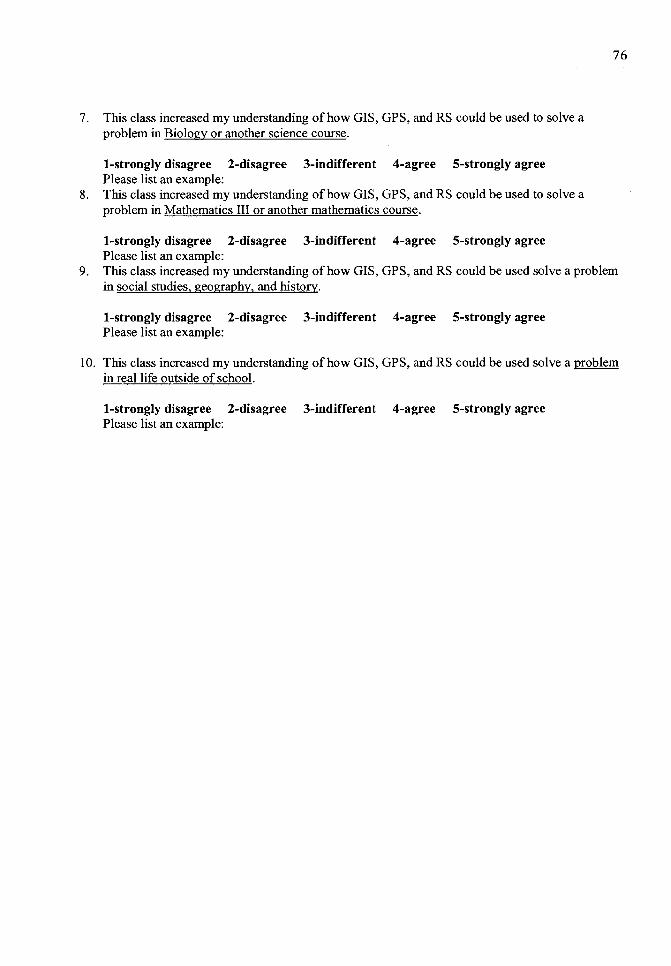
7. This class increased my understanding of how GIS, GPS, and RS could be used to solve a problem in Biology or another science course.
I-strongly disagree 2-disagree 3-indifferent 4-agree 5-strongly agree Please list an example:
8. This class increased my understanding of how GIS, GPS, and RS could be used to solve a problem in Mathematics III or another mathematics course.
I-strongly disagree 2-disagree 3-indifferent 4-agree 5-strongly agree Please list an example:
76
9. This class increased my understanding of how GIS, GPS, and RS could be used solve a problem in social studies. geography. and history.
I-strongly disagree 2-disagree 3-indifferent 4-agree 5-strongly agree Please list an example:
10. This class increased my understanding of how GIS, GPS, and RS could be used solve a problem in real life outside of school.
I-strongly disagree 2-disagree 3-indifferent 4-agree 5-strongly agree Please list an example:
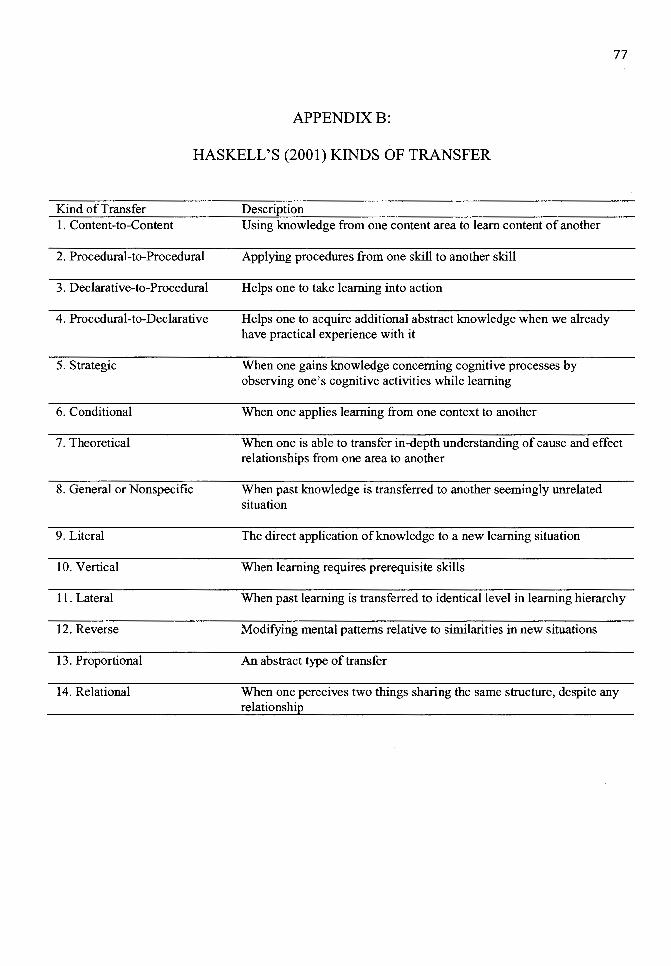
77
APPENDIXB:
HASKELL'S (2001) KINDS OF TRANSFER
Kind of Transfer 1. Content-to-Content
2. Procedural-to-Procedural
3. Declarative-to-Procedural
4. Procedural-to-Declarative
5. Strategic
6. Conditional
7. Theoretical
8. General or Nonspecific
9. Literal
10. Vertical
11. Lateral
12. Reverse
13. Proportional
14. Relational
Description Using knowledge from one content area to learn content of another
Applying procedures from one skill to another skill
Helps one to take learning into action
Helps one to acquire additional abstract knowledge when we already have practical experience with it
When one gains knowledge concerning cognitive processes by observing one's cognitive activities while learning
When one applies learning from one context to another
When one is able to transfer in-depth understanding of cause and effect relationships from one area to another
When past knowledge is transferred to another seemingly unrelated situation
The direct application of knowledge to a new learning situation
When learning requires prerequisite skills
When past learning is transferred to identical level in learning hierarchy
Modifying mental patterns relative to similarities in new situations
An abstract type of transfer
When one perceives two things sharing the same structure, despite any relationship
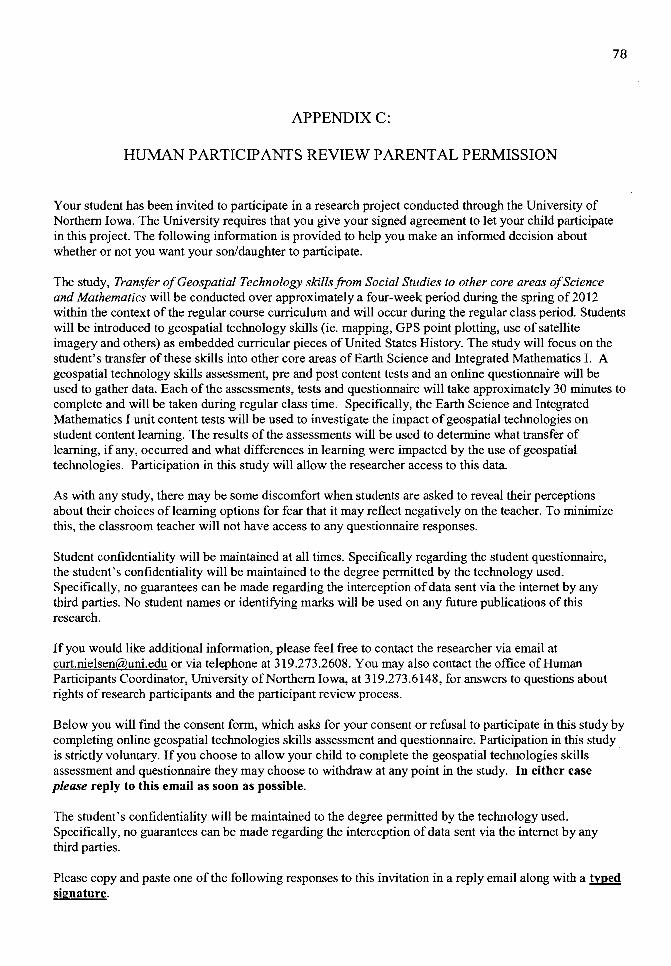
78
APPENDIXC:
HUMAN PARTICIPANTS REVIEW PARENT AL PERMISSION
Your student has been invited to participate in a research project conducted through the University of Northern Iowa. The University requires that you give your signed agreement to let your child participate in this project. The following information is provided to help you make an informed decision about whether or not you want your son/daughter to participate.
The study, Transfer ofGeospatial Technology skills from Social Studies to other core areas of Science and Mathematics will be conducted over approximately a four-week period during the spring of 2012 within the context of the regular course curriculum and will occur during the regular class period. Students will be introduced to geospatial technology skills (ie. mapping, GPS point plotting, use of satellite imagery and others) as embedded curricular pieces of United States History. The study will focus on the student's transfer of these skills into other core areas of Earth Science and Integrated Mathematics I. A geospatial technology skills assessment, pre and post content tests and an online questionnaire will be used to gather data. Each of the assessments, tests and questionnaire will take approximately 30 minutes to complete and will be taken during regular class time. Specifically, the Earth Science and Integrated Mathematics I unit content tests will be used to investigate the impact of geospatial technologies on student content learning. The results of the assessments will be used to determine what transfer of learning, if any, occurred and what differences in learning were impacted by the use of geospatial technologies. Participation in this study will allow the researcher access to this data.
As with any study, there may be some discomfort when students are asked to reveal their perceptions about their choices ofleaming options for fear that it may reflect negatively on the teacher. To minimize this, the classroom teacher will not have access to any questionnaire responses.
Student confidentiality will be maintained at all times. Specifically regarding the student questionnaire, the student's confidentiality will be maintained to the degree permitted by the technology used. Specifically, no guarantees can be made regarding the interception of data sent via the internet by any third parties. No student names or identifying marks will be used on any future publications of this research.
If you would like additional information, please feel free to contact the researcher via email at [email protected] or via telephone at 319 .273.2608. You may also contact the office of Human Participants Coordinator, University of Northern Iowa, at 319.273.6148, for answers to questions about rights of research participants and the participant review process.
Below you will find the consent form, which asks for your consent or refusal to participate in this study by completing online geospatial technologies skills assessment and questionnaire. Participation in this study is strictly voluntary. If you choose to allow your child to complete the geospatial technologies skills assessment and questionnaire they may choose to withdraw at any point in the study. In either case please reply to this email as soon as possible.
The student's confidentiality will be maintained to the degree permitted by the technology used. Specifically, no guarantees can be made regarding the interception of data sent via the internet by any third parties.
Please copy and paste one of the following responses to this invitation in a reply email along with a~ signature.
79
I am fully aware of the nature and extent of my child's participation in this study as stated above and the possible risks arising from it. I have access to a printed a copy of this form. I hereby agree to allow my son/daughter to participate in this study.
I am fully aware of the nature and extent of my child's participation in this study as stated above and the possible risks arising from it. I choose not to allow my son/daughter to participate in this study.
Sincerely,
Curtis P. Nielsen Malcolm Price Laboratory School Instructor Doctoral Student, University of Northern Iowa
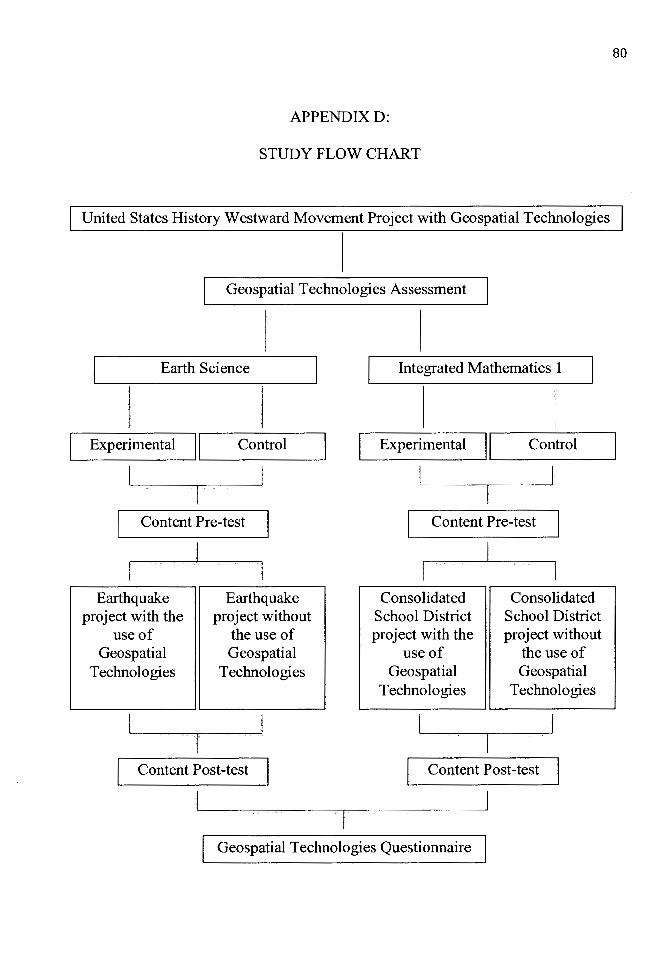
80
APPENDIXD:
STUDY FLOW CHART
United States History Westward Movement Project with Geospatial Technologies
Geospatial Technologies Assessment
Earth Science Integrated Mathematics 1
Experimental ! l._ __ c_o_nt_ro_l _ __, Experimental j .___! __ c_o_n_tr_ol _ __,
Content Pre-test Content Pre-test
Earthquake Earthquake Consolidated Consolidated project with the project without School District School District
use of the use of project with the project without Geospatial Geo spatial use of the use of
Technologies Technologies Geo spatial Geo spatial Technologies Technologies
Content Post-test Content Post-test
Geospatial Technologies Questionnaire
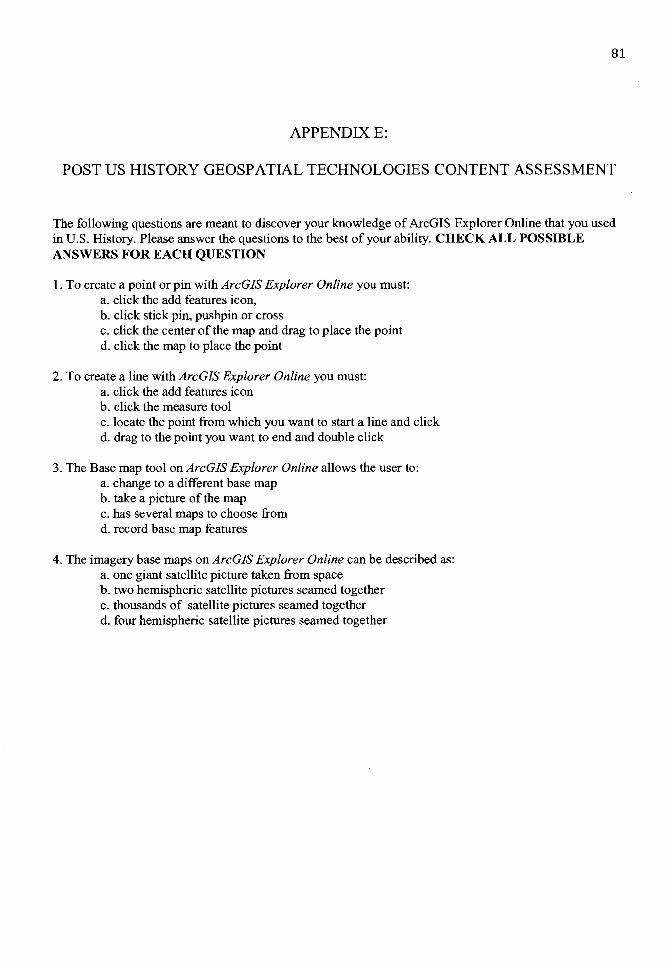
81
APPENDIXE:
POST US HISTORY GEOSPATIAL TECHNOLOGIES CONTENT ASSESSMENT
The following questions are meant to discover your knowledge of ArcGIS Explorer Online that you used in U.S. History. Please answer the questions to the best of your ability. CHECK ALL POSSIBLE ANSWERS FOR EACH QUESTION
1. To create a point or pin with ArcGIS Explorer Online you must: a. click the add features icon, b. click stick pin, pushpin or cross c. click the center of the map and drag to place the point d. click the map to place the point
2. To create a line with ArcGJS Explorer Online you must: a. click the add features icon b. click the measure tool c. locate the point from which you want to start a line and click d. drag to the point you want to end and double click
3. The Base map tool on ArcGIS Explorer Online allows the user to: a. change to a different base map b. take a picture of the map c. has several maps to choose from d. record base map features
4. The imagery base maps on ArcGIS Explorer Online can be described as: a. one giant satellite picture taken from space b. two hemispheric satellite pictures seamed together c. thousands of satellite pictures seamed together d. four hemispheric satellite pictures seamed together
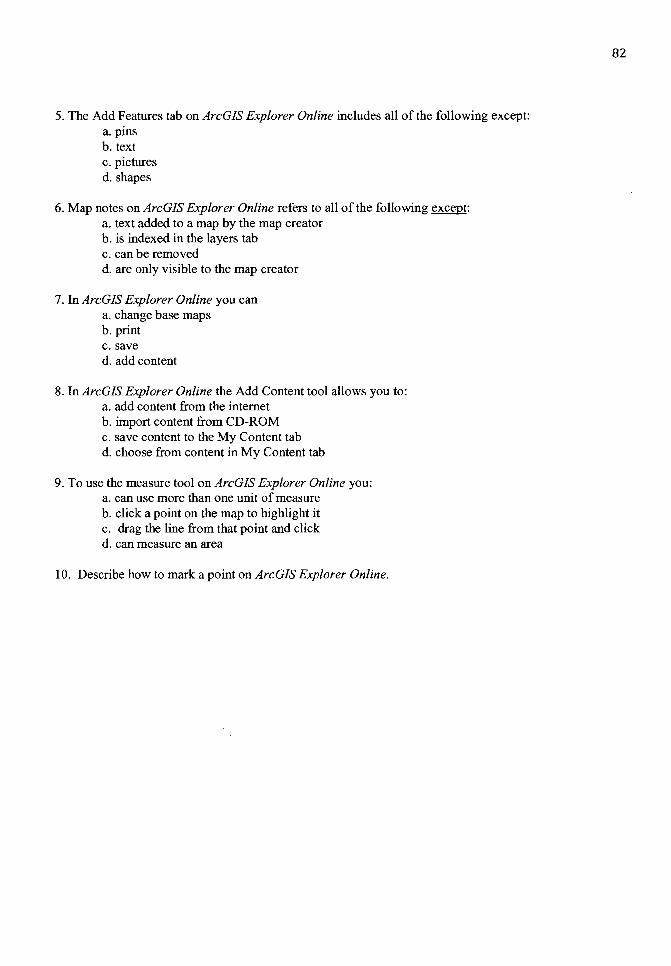
5. The Add Features tab on ArcGIS Explorer Online includes all of the following except: a. pins b. text c. pictures d. shapes
6. Map notes on ArcGJS Explorer Online refers to all of the following except: a. text added to a map by the map creator b. is indexed in the layers tab c. can be removed d. are only visible to the map creator
7. InArcGIS Explorer Online you can a. change base maps b. print c.save d. add content
8. In ArcGIS Explorer Online the Add Content tool allows you to: a. add content from the internet b. import content from CD-ROM c. save content to the My Content tab d. choose from content in My Content tab
9. To use the measure tool on ArcGJS Explorer Online you: a. can use more than one unit of measure b. click a point on the map to highlight it c. drag the line from that point and click d. can measure an area
10. Describe how to mark a point on ArcGIS Explorer Online.
82

83
APPENDIXF:
QUESTIONNAIRE EARTH SCIENCE - EXPERIMENT AL GROUP
In U.S. History you completed a project on Westward Expansion using ArcGIS Explorer Online. Imagine you are introducing a new student to ArcGIS Explorer Online and in 4 or 5 sentences respond to each of the following items. BE SPECIFIC AND DETAILED IN YOUR RESPONSES.
1. Enter your student identification number given to you by your teacher.
2. Explain how you used points or pins in the Earth Quake Distribution Project.
3. Explain the similarities of how you used points in the Earth Quake Distribution project compared to the U.S. History Westward Expansion project.
4. Explain how you used the measure tool to measure distance to complete the Earth Science project.
5. Explain the similarities of how you used the measure tool to measure distances to complete the Earth Science project compared to the U.S. History Westward Expansion project.
6. Explain why you might choose a specific base map to complete the Earth Science project.
7. Explain the similarities of how you used base maps to complete the Earth Science project compared to the U. S. History Westward Expansion project.
8. Explain and provide reasons (more than one) why one would use geospatial technologies, such as ArcGJS Explorer Online to display and analyze data.
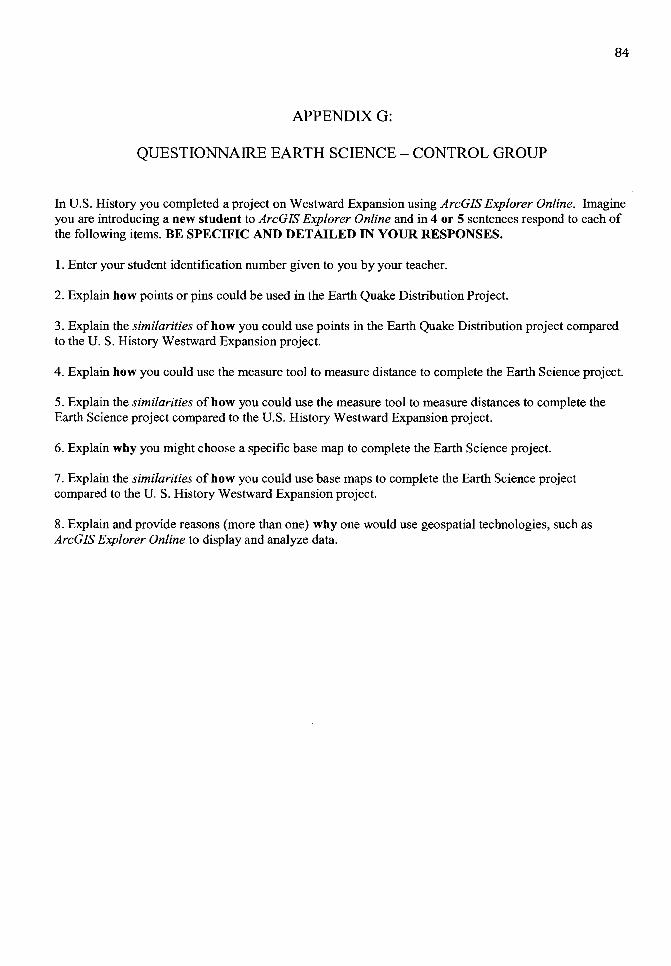
84
APPENDIX 0:
QUESTIONNAIRE EARTH SCIENCE - CONTROL GROUP
In U.S. History you completed a project on Westward Expansion using ArcGIS Explorer Online. Imagine you are introducing a new student to ArcGIS Explorer Online and in 4 or S sentences respond to each of the following items. BE SPECIFIC AND DETAILED IN YOUR RESPONSES.
1. Enter your student identification number given to you by your teacher.
2. Explain how points or pins could be used in the Earth Quake Distribution Project.
3. Explain the similarities of how you could use points in the Earth Quake Distribution project compared to the U.S. History Westward Expansion project.
4. Explain how you could use the measure tool to measure distance to complete the Earth Science project.
5. Explain the similarities of how you could use the measure tool to measure distances to complete the Earth Science project compared to the U.S. History Westward Expansion project.
6. Explain why you might choose a specific base map to complete the Earth Science project.
7. Explain the similarities of how you could use base maps to complete the Earth Science project compared to the U. S. History Westward Expansion project.
8. Explain and provide reasons (more than one) why one would use geospatial technologies, such as ArcGJS Explorer Online to display and analyze data.

85
APPENDIXH:
QUESTIONNAIRE INTEGRATED MATHEMATICS 1 - EXPERIMENTAL GROUP
In U.S. History you completed a project on Westward Expansion using ArcGIS Explorer Online. Imagine you are introducing a new student to ArcGIS Explorer Online and in 4 or 5 sentences respond to each of the following items. BE SPECIFIC AND DETAILED IN YOUR RESPONSES.
1. Enter your student identification number given to you by your teacher.
2. Explain how you used points or pins in the Integrated Mathematics project.
3. Explain the similarities of how you used points in the Integrated Mathematics project compared to the U. S. History Westward Expansion project.
4. Explain how you used the measure tool to measure distance to complete the Integrated Mathematics project.
5. Explain the similarities of how you used the measure tool to measure distances to complete the Integrated Mathematics project compared to the U.S. History Westward Expansion project.
6. Explain why you might choose a specific base map to complete the Integrated Mathematics project.
7. Explain the similarities of how you used base maps to complete the Integrated Mathematics project compared to the U.S. History Westward Expansion project.
8. Explain and provide reasons (more than one) why one would use geospatial technologies, such as ArcGIS Explorer Online to display and analyze data.
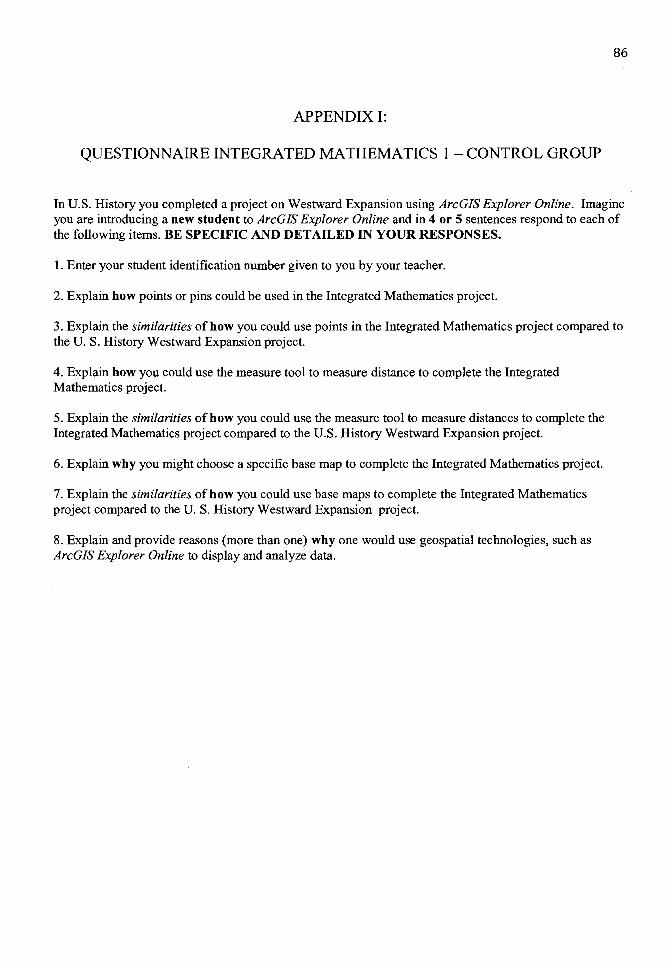
86
APPENDIX I:
QUESTIONNAIRE INTEGRATED MATHEMATICS 1 -CONTROL GROUP
In U.S. History you completed a project on Westward Expansion using ArcGIS Explorer Online. Imagine you are introducing a new student to ArcGIS Explorer Online and in 4 or 5 sentences respond to each of the following items. BE SPECIFIC AND DETAILED IN YOUR RESPONSES.
1. Enter your student identification number given to you by your teacher.
2. Explain how points or pins could be used in the Integrated Mathematics project.
3. Explain the similarities of how you could use points in the Integrated Mathematics project compared to the U. S. History Westward Expansion project.
4. Explain how you could use the measure tool to measure distance to complete the Integrated Mathematics project.
5. Explain the similarities of how you could use the measure tool to measure distances to complete the Integrated Mathematics project compared to the U.S. History Westward Expansion project.
6. Explain why you might choose a specific base map to complete the Integrated Mathematics project.
7. Explain the similarities of how you could use base maps to complete the Integrated Mathematics project compared to the U. S. History Westward Expansion project.
8. Explain and provide reasons (more than one) why one would use geospatial technologies, such as ArcGIS Explorer Online to display and analyze data.
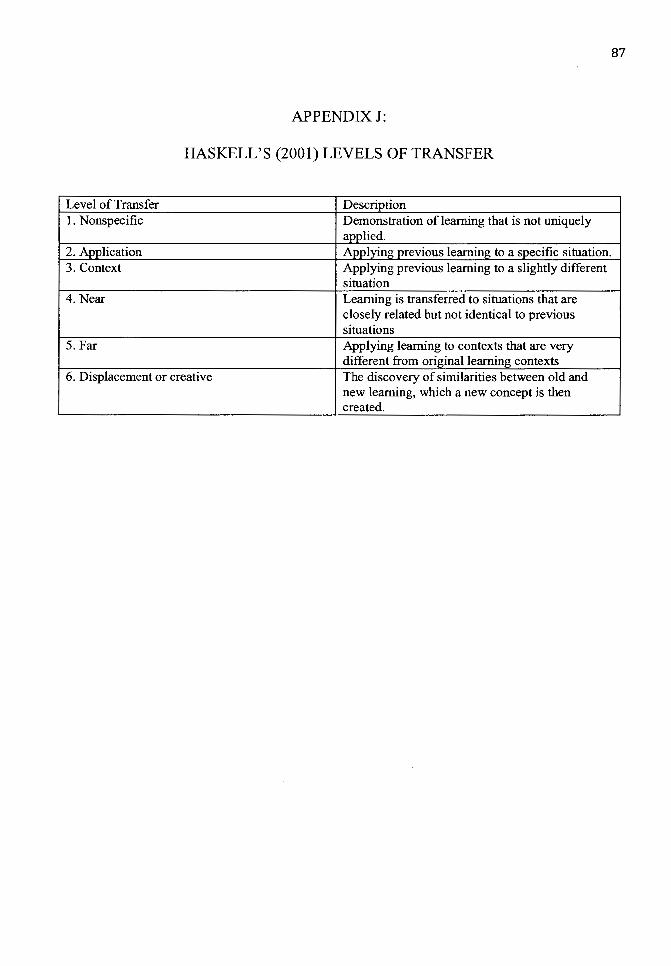
87
APPENDIXJ:
HASKELL'S (2001) LEVELS OF TRANSFER
Level of Transfer Description 1. Nonspecific Demonstration oflearning that is not uniquely
aoolied. 2. Application Aoolving previous learning to a specific situation. 3. Context Applying previous learning to a slightly different
situation 4. Near Leaming is transferred to situations that are
closely related but not identical to previous situations
5. Far Applying learning to contexts that are very different from original learning contexts
6. Displacement or creative The discovery of similarities between old and new learning, which a new concept is then created.
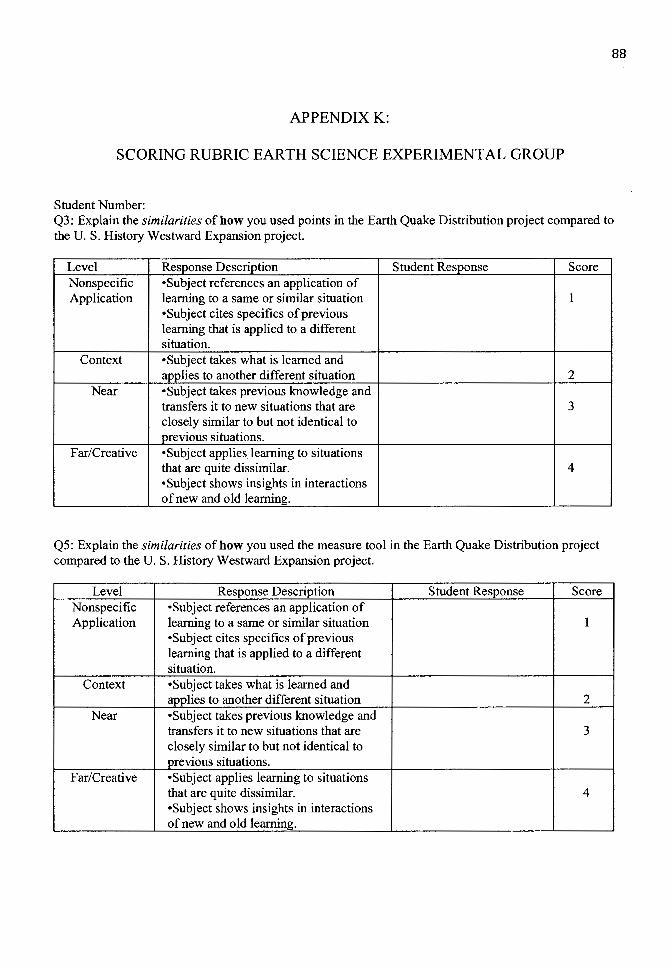
88
APPENDIXK:
SCORING RUBRIC EARTH SCIENCE EXPERIMENTAL GROUP
Student Number: Q3: Explain the similarities of how you used points in the Earth Quake Distribution project compared to the U.S. History Westward Expansion project.
Level Response Description Student Response Score Nonspecific •Subject references an application of Application learning to a same or similar situation 1
•Subject cites specifics of previous learning that is applied to a different situation.
Context •Subject takes what is learned and applies to another different situation 2
Near •Subject takes previous knowledge and transfers it to new situations that are 3 closely similar to but not identical to previous situations.
Far/Creative •Subject applies learning to situations that are quite dissimilar. 4 •Subject shows insights in interactions of new and old learning.
Q5: Explain the similarities of how you used the measure tool in the Earth Quake Distribution project compared to the U.S. History Westward Expansion project.
Level Response Description Student Response Score Nonspecific •Subject references an application of Application learning to a same or similar situation 1
•Subject cites specifics of previous learning that is applied to a different situation.
Context •Subject takes what is learned and applies to another different situation 2
Near •Subject takes previous knowledge and transfers it to new situations that are 3 closely similar to but not identical to previous situations.
Far/Creative •Subject applies learning to situations that are quite dissimilar. 4 •Subject shows insights in interactions of new and old learning.
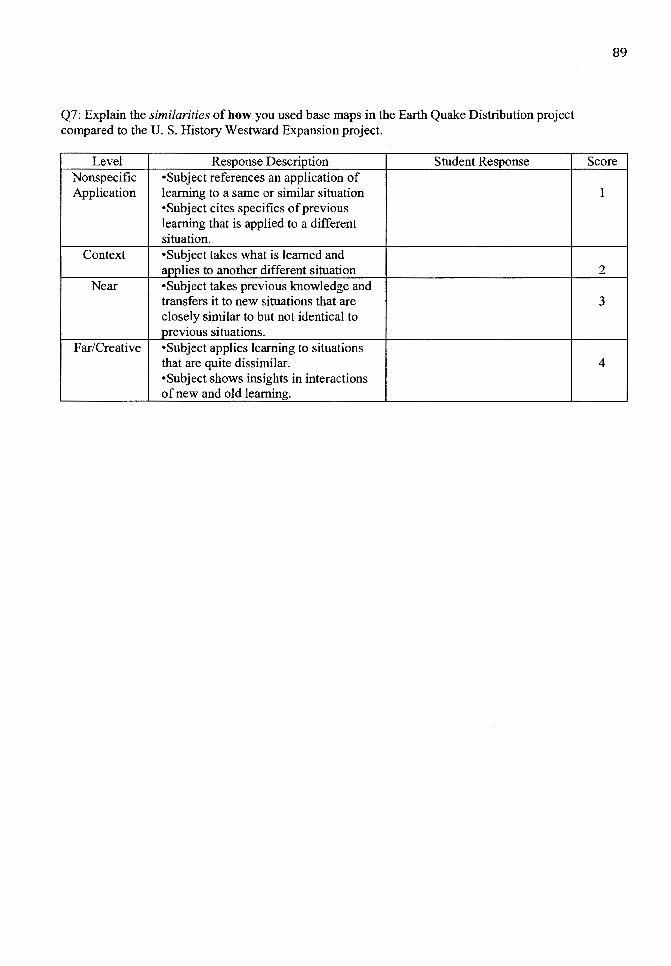
Q7: Explain the similarities of how you used base maps in the Earth Quake Distribution project compared to the U. S. History Westward Expansion project.
Level Response Description Student Response Nonspecific •Subject references an application of Application learning to a same or similar situation
•Subject cites specifics of previous learning that is applied to a different situation.
Context •Subject takes what is learned and applies to another different situation
Near •Subject takes previous knowledge and transfers it to new situations that are closely similar to but not identical to previous situations.
Far/Creative •Subject applies learning to situations that are quite dissimilar. •Subject shows insights in interactions of new and old learning.
89
Score
1
2
3
4
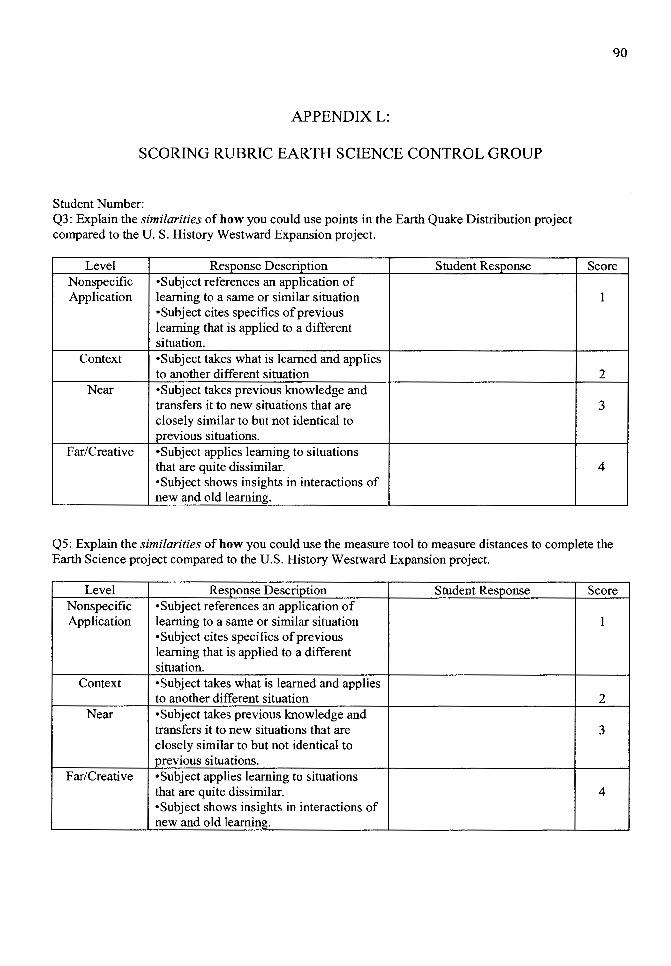
APPENDIXL:
SCORING RUBRIC EARTH SCIENCE CONTROL GROUP
Student Number: Q3: Explain the similarities of how you could use points in the Earth Quake Distribution project compared to the U.S. History Westward Expansion project.
Level Response Description Student Response Nonspecific •Subject references an application of Application learning to a same or similar situation
·Subject cites specifics of previous learning that is applied to a different situation.
Context •Subject takes what is learned and applies to another different situation
Near ·Subject takes previous knowledge and transfers it to new situations that are closely similar to but not identical to previous situations.
Far/Creative •Subject applies learning to situations that are quite dissimilar. •Subject shows insights in interactions of new and old learning.
90
Score
1
2
3
4
QS: Explain the similarities of how you could use the measure tool to measure distances to complete the Earth Science project compared to the U.S. History Westward Expansion project.
Level Response Description Student Response Score Nonspecific •Subject references an application of Application learning to a same or similar situation 1
•Subject cites specifics of previous learning that is applied to a different situation.
Context •Subject takes what is learned and applies to another different situation 2
Near •Subject takes previous knowledge and transfers it to new situations that are 3 closely similar to but not identical to previous situations.
Far/Creative •Subject applies learning to situations that are quite dissimilar. 4 •Subject shows insights in interactions of new and old learning.
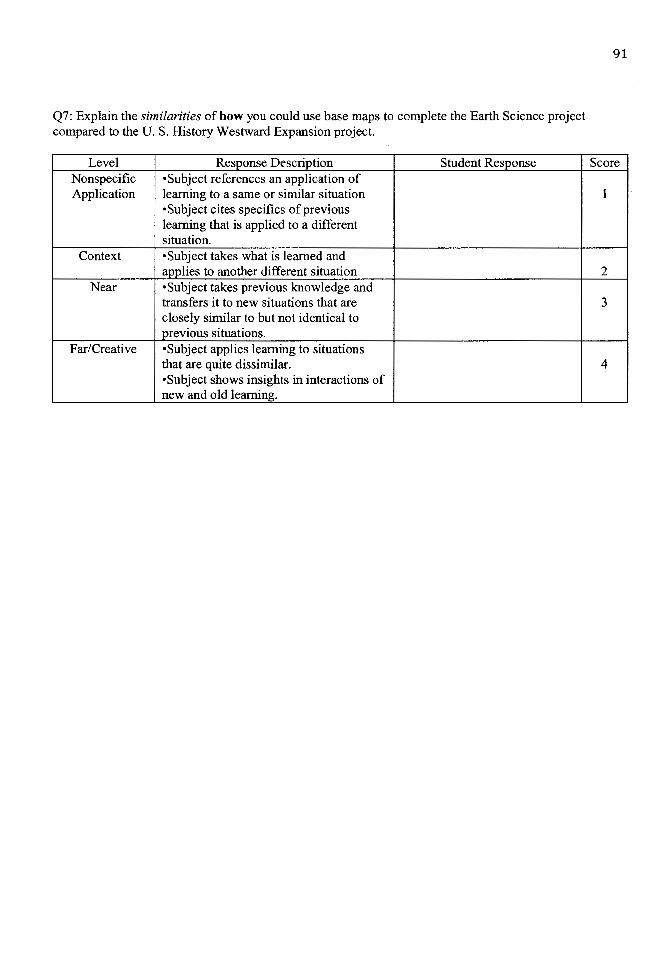
Q7: Explain the similarities of how you could use base maps to complete the Earth Science project compared to the U.S. History Westward Expansion project.
Level Response Description Student Response Nonspecific •Subject references an application of Application learning to a same or similar situation
•Subject cites specifics of previous learning that is applied to a different situation.
Context •Subject takes what is learned and aoolies to another different situation
Near •Subject takes previous knowledge and transfers it to new situations that are closely similar to but not identical to previous situations.
Far/Creative •Subject applies learning to situations that are quite dissimilar. •Subject shows insights in interactions of new and old learning.
91
Score
1
2
3
4

92
APPENDIXM:
SCORING RUBRIC INTEGRATED MATHEMATICS I EXPERIMENTAL GROUP
Student Number: Q3: Explain the similarities of how you used points in the Integrated Mathematics I project compared to the U.S. History Westward Expansion project.
Level Response Description Student Response Nonspecific •Subject references an application of Application learning to a same or similar situation
·Subject cites specifics of previous learning that is applied to a different situation.
Context •Subject takes what is learned and applies to another different situation
Near •Subject takes previous knowledge and transfers it to new situations that are closely similar to but not identical to previous situations.
Far/Creative •Subject applies learning to situations that are quite dissimilar. •Subject shows insights in interactions of new and old learning.
Q5: Explain the similarities of how you used the measure tool to measure distances to complete the Integrated Mathematics I project compared to the U.S. History Westward Expansion project.
Level Response Description Student Response Nonspecific •Subject references an application of Application learning to a same or similar situation
•Subject cites specifics of previous learning that is applied to a different situation.
Context •Subject takes what is learned and applies to another different situation
Near •Subject takes previous knowledge and transfers it to new situations that are closely similar to but not identical to previous situations.
Far/Creative ·Subject applies learning to situations that are quite dissimilar. •Subject shows insights in interactions of new and old learning.
Score
1
2
3
4
Score
1
2
3
4

93
Q7: Explain the similarities of how you used base maps in the Integrated Mathematics I project compared to the U. S. History Westward Expansion project.
Level Response Description Student Response Score Nonspecific •Subject references an application of Application learning to a same or similar situation 1
•Subject cites specifics of previous learning that is applied to a different situation.
Context •Subject takes what is learned and applies to another different situation 2
Near •Subject takes previous knowledge and transfers it to new situations that are 3 closely similar to but not identical to previous situations.
Far/Creative •Subject applies learning to situations that are quite dissimilar. 4 •Subject shows insights in interactions of new and old learning.
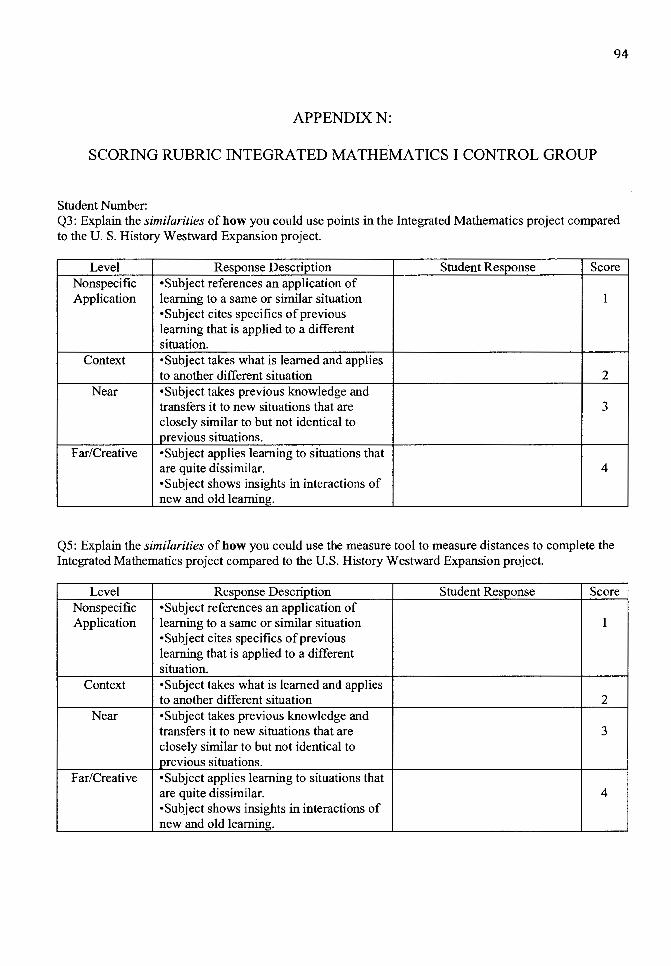
94
APPENDIXN:
SCORING RUBRIC INTEGRATED MATHEMATICS I CONTROL GROUP
Student Number: Q3: Explain the similarities of how you could use points in the Integrated Mathematics project compared to the U. S. History Westward Expansion project.
Level Response Description Student Response Score Nonspecific •Subject references an application of Application learning to a same or similar situation 1
•Subject cites specifics of previous learning that is applied to a different situation.
Context •Subject takes what is learned and applies to another different situation 2
Near •Subject takes previous knowledge and transfers it to new situations that are 3 closely similar to but not identical to previous situations.
Far/Creative •Subject applies learning to situations that are quite dissimilar. 4 •Subject shows insights in interactions of new and old learning.
Q5: Explain the similarities of how you could use the measure tool to measure distances to complete the Integrated Mathematics project compared to the U.S. History Westward Expansion project.
Level Response Description Student Response Score Nonspecific •Subject references an application of Application learning to a same or similar situation 1
•Subject cites specifics of previous learning that is applied to a different situation.
Context •Subject takes what is learned and applies to another different situation 2
Near •Subject takes previous knowledge and transfers it to new situations that are 3 closely similar to but not identical to previous situations.
Far/Creative ·Subject applies learning to situations that are quite dissimilar. 4 ·Subject shows insights in interactions of new and old learning.
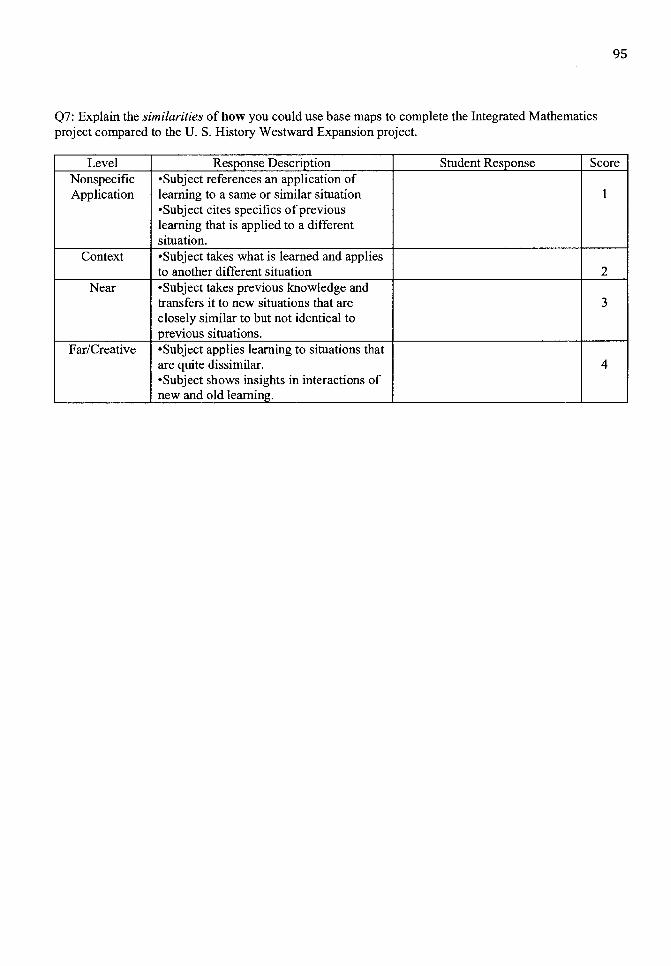
Q7: Explain the similarities of how you could use base maps to complete the Integrated Mathematics project compared to the U. S. History Westward Expansion project.
95
Level Response Description Student Response Score Nonspecific •Subject references an application of Application learning to a same or similar situation 1
•Subject cites specifics of previous learning that is applied to a different situation.
Context •Subject takes what is learned and applies to another different situation 2
Near •Subject takes previous knowledge and transfers it to new situations that are 3 closely similar to but not identical to previous situations.
Far/Creative •Subject applies learning to situations that are quite dissimilar. 4 •Subject shows insights in interactions of new and old learning.
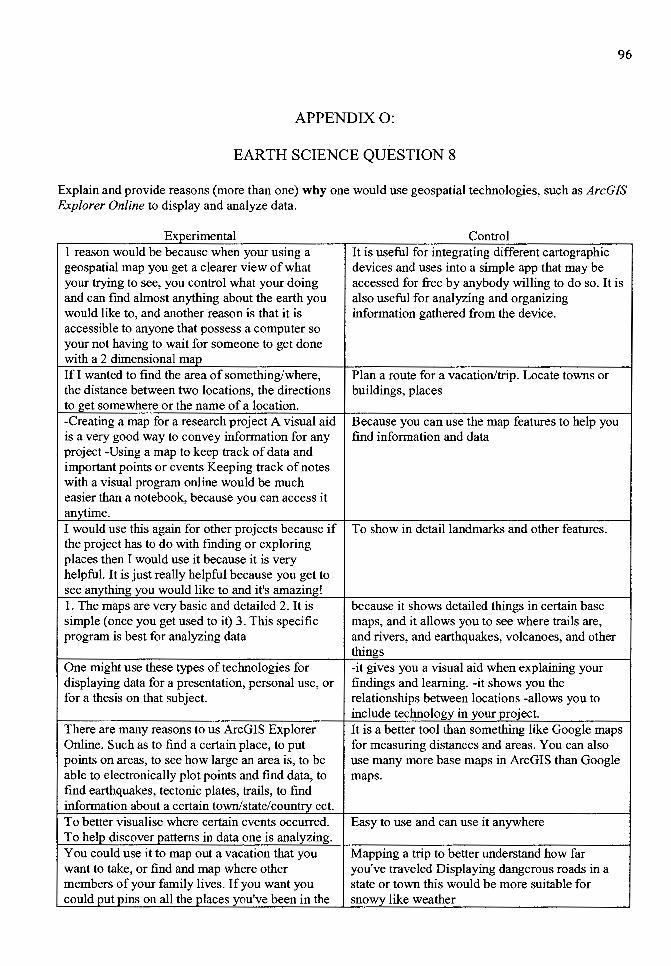
96
APPENDIX 0:
EARTH SCIENCE QUESTION 8
Explain and provide reasons (more than one) why one would use geospatial technologies, such as ArcGJS Explorer Online to display and analyze data.
Experimental Control 1 reason would be because when your using a It is useful for integrating different cartographic geospatial map you get a clearer view of what devices and uses into a simple app that may be your trying to see, you control what your doing accessed for free by anybody willing to do so. It is and can find almost anything about the earth you also useful for analyzing and organizing would like to, and another reason is that it is information gathered from the device. accessible to anyone that possess a computer so your not having to wait for someone to get done with a 2 dimensional map If I wanted to find the area of something/where, Plan a route for a vacation/trip. Locate towns or the distance between two locations, the directions buildings, places to get somewhere or the name of a location. -Creating a map for a research project A visual aid Because you can use the map features to help you is a very good way to convey information for any find information and data project -Using a map to keep track of data and important points or events Keeping track of notes with a visual program online would be much easier than a notebook, because you can access it anytime. I would use this again for other projects because if To show in detail landmarks and other features. the project has to do with finding or exploring places then I would use it because it is very helpful. It is just really helpful because you get to see anything you would like to and it's amazing! 1. The maps are very basic and detailed 2. It is because it shows detailed things in certain base simple (once you get used to it) 3. This specific maps, and it allows you to see where trails are, program is best for analyzing data and rivers, and earthquakes, volcanoes, and other
things One might use these types of technologies for -it gives you a visual aid when explaining your displaying data for a presentation, personal use, or findings and learning. -it shows you the for a thesis on that subject. relationships between locations -allows you to
include technology in your project. There are many reasons to us ArcGIS Explorer It is a better tool than something like Google maps Online. Such as to find a certain place, to put for measuring distances and areas. You can also points on areas, to see how large an area is, to be use many more base maps in ArcGIS than Google able to electronically plot points and find data, to maps. find earthquakes, tectonic plates, trails, to find information about a certain town/state/country ect. To better visualise where certain events occurred. Easy to use and can use it anywhere To help discover patterns in data one is analyzing. You could use it to map out a vacation that you Mapping a trip to better understand how far want to take, or find and map where other you've traveled Displaying dangerous roads in a members of your family lives. If you want you state or town this would be more suitable for could put pins on all the places you've been in the snowy like weather
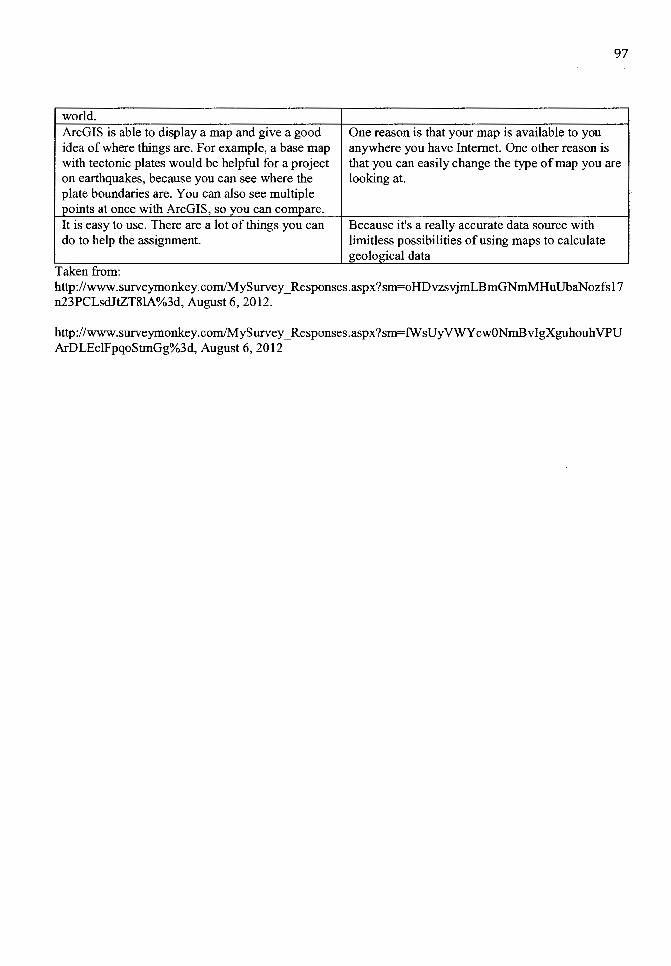
97
world. ArcGIS is able to display a map and give a good One reason is that your map is available to you idea of where things are. For example, a base map anywhere you have Internet. One other reason is with tectonic plates would be helpful for a project that you can easily change the type of map you are on earthquakes, because you can see where the looking at. plate boundaries are. You can also see multiple points at once with ArcGIS, so you can compare. It is easy to use. There are a lot of things you can Because it's a really accurate data source with do to help the assignment. limitless possibilities of using maps to calculate
geological data Taken from: http://www.surveymonkey.com/MySurvey _ Responses.aspx?sm=oHDvzsvjmLBmGNmMHuUbaNozfsl 7 n23PCLsdJtZT81A%3d, August 6, 2012.
http://www.surveymonkey.com/MySurvey _ Responses.aspx?sm=tw sUyVWY cwONmBvlgXguhouh VPU ArDLEclFpqoStmGg%3d, August 6, 2012
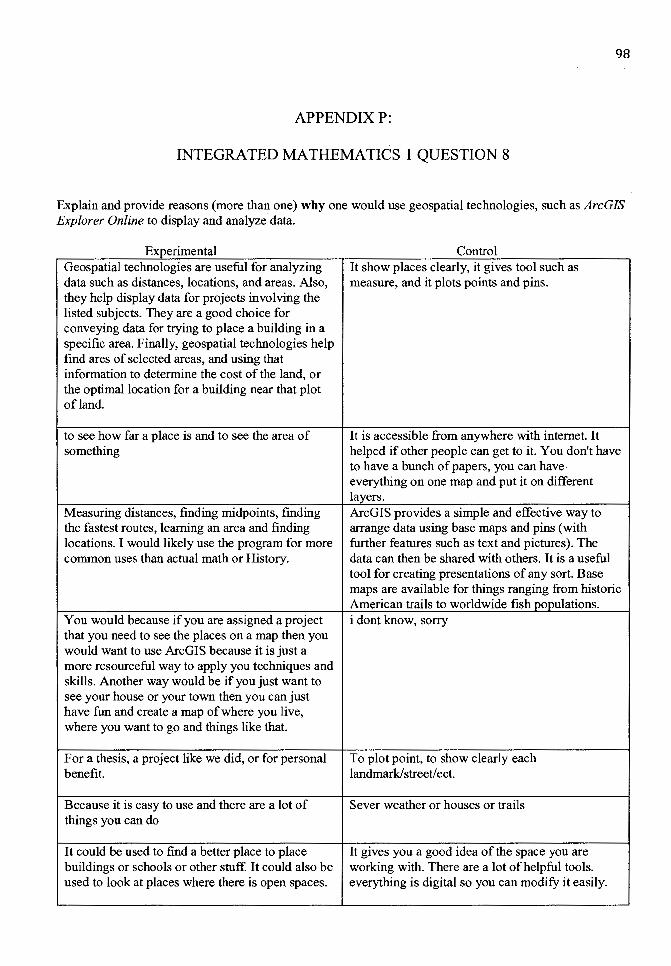
98
APPENDIXP:
INTEGRATED MATHEMATICS 1 QUESTION 8
Explain and provide reasons (more than one) why one would use geospatial technologies, such as ArcGIS Explorer Online to display and analyze data.
E tal xpenmen C tr 1 on o Geospatial technologies are useful for analyzing It show places clearly, it gives tool such as data such as distances, locations, and areas. Also, measure, and it plots points and pins. they help display data for projects involving the listed subjects. They are a good choice for conveying data for trying to place a building in a specific area. Finally, geospatial technologies help find ares of selected areas, and using that information to determine the cost of the land, or the optimal location for a building near that plot of land.
to see how far a place is and to see the area of It is accessible from anywhere with internet. It something helped if other people can get to it. You don't have
to have a bunch of papers, you can have everything on one map and put it on different layers.
Measuring distances, finding midpoints, finding ArcGIS provides a simple and effective way to the fastest routes, learning an area and finding arrange data using base maps and pins ( with locations. I would likely use the program for more further features such as text and pictures). The common uses than actual math or History. data can then be shared with others. It is a useful
tool for creating presentations of any sort. Base maps are available for things ranging from historic American trails to worldwide fish populations.
You would because if you are assigned a project i dont know, sorry that you need to see the places on a map then you would want to use ArcGIS because it is just a more resourceful way to apply you techniques and skills. Another way would be if you just want to see your house or your town then you can just have fun and create a map of where you live, where you want to go and things like that.
For a thesis, a project like we did, or for personal To plot point, to show clearly each benefit. landmark/street/ect.
Because it is easy to use and there are a lot of Sever weather or houses or trails things you can do
It could be used to find a better place to place It gives you a good idea of the space you are buildings or schools or other stuff It could also be working with. There are a lot of helpful tools. used to look at places where there is open spaces. everything is digital so you can modify it easily.
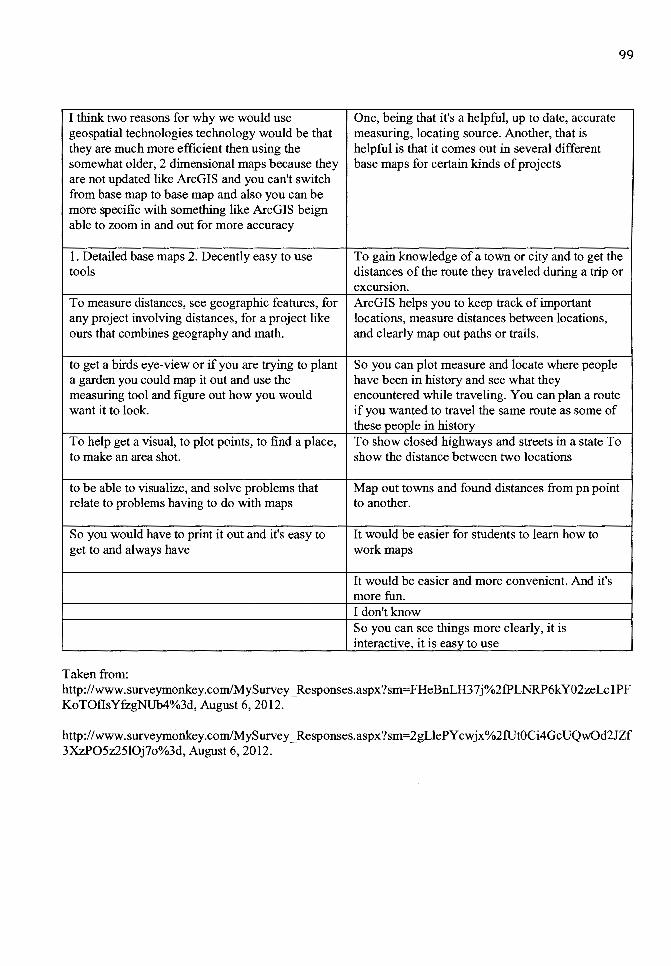
99
I think two reasons for why we would use One, being that it's a helpful, up to date, accurate geospatial technologies technology would be that measuring, locating source. Another, that is they are much more efficient then using the helpful is that it comes out in several different somewhat older, 2 dimensional maps because they base maps for certain kinds of projects are not updated like ArcGIS and you can't switch from base map to base map and also you can be more specific with something like ArcGIS beign able to zoom in and out for more accuracy
1. Detailed base maps 2. Decently easy to use To gain knowledge of a town or city and to get the tools distances of the route they traveled during a trip or
excursion. To measure distances, see geographic features, for ArcGIS helps you to keep track of important any project involving distances, for a project like locations, measure distances between locations, ours that combines geography and math. and clearly map out paths or trails.
to get a birds eye-view or if you are trying to plant So you can plot measure and locate where people a garden you could map it out and use the have been in history and see what they measuring tool and figure out how you would encountered while traveling. You can plan a route want it to look. if you wanted to travel the same route as some of
these people in history To help get a visual, to plot points, to find a place, To show closed highways and streets in a state To to make an area shot. show the distance between two locations
to be able to visualize, and solve problems that Map out towns and found distances from pn point relate to problems having to do with maps to another.
So you would have to print it out and it's easy to It would be easier for students to learn how to get to and always have work maps
It would be easier and more convenient. And it's more fun. I don't know So you can see things more clearly, it is interactive, it is easy to use
Taken from: http://www.surveymonkey.com/MySurvey _Responses.aspx?sm= FHeBnLH3 7j%2fPLNRP6kY02zeLc 1 PF KoTOflsYfzgNUb4%3d, August 6, 2012.
http://www.surveymonkey.com/MySurvey _ Responses.aspx ?sm=2gLlePY cwjx %2fUtOCi4GcUQwOd2JZf 3XzP05z2510j7o%3d, August 6, 2012.
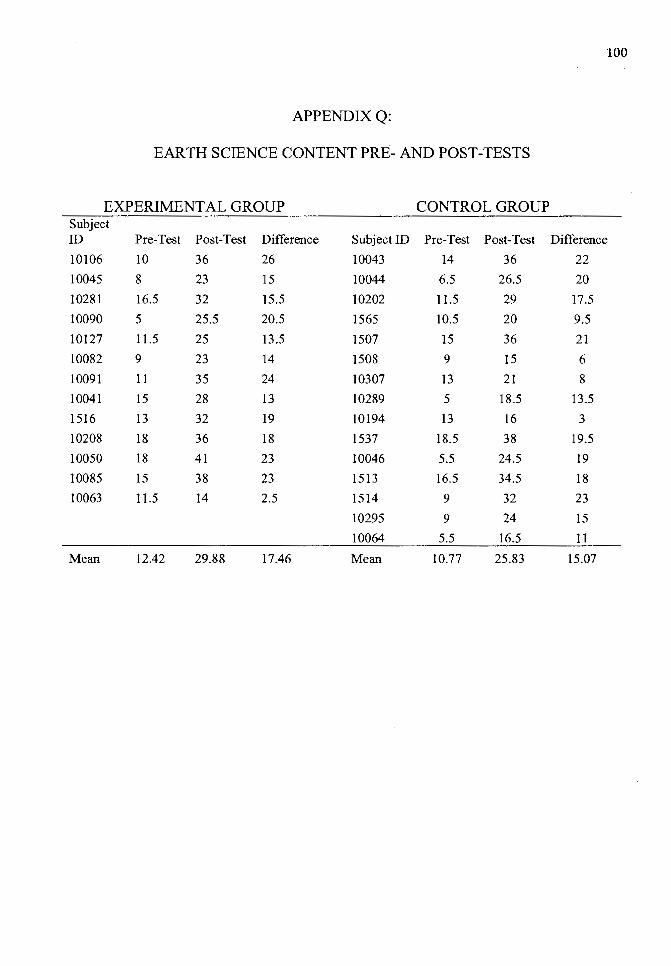
100
APPENDIXQ:
EARTH SCIENCE CONTENT PRE- AND POST-TESTS
EXPERIMENTAL GROUP CONTROL GROUP Subject ID Pre-Test Post-Test Difference Subject ID Pre-Test Post-Test Difference
10106 10 36 26 10043 14 36 22
10045 8 23 15 10044 6.5 26.5 20 10281 16.5 32 15.5 10202 11.5 29 17.5 10090 5 25.5 20.5 1565 10.5 20 9.5 10127 11.5 25 13.5 1507 15 36 21 10082 9 23 14 1508 9 15 6 10091 11 35 24 10307 13 21 8 10041 15 28 13 10289 5 18.5 13.5 1516 13 32 19 10194 13 16 3 10208 18 36 18 1537 18.5 38 19.5
10050 18 41 23 10046 5.5 24.5 19
10085 15 38 23 1513 16.5 34.5 18
10063 11.5 14 2.5 1514 9 32 23
10295 9 24 15
10064 5.5 16.5 11
Mean 12.42 29.88 17.46 Mean 10.77 25.83 15.07
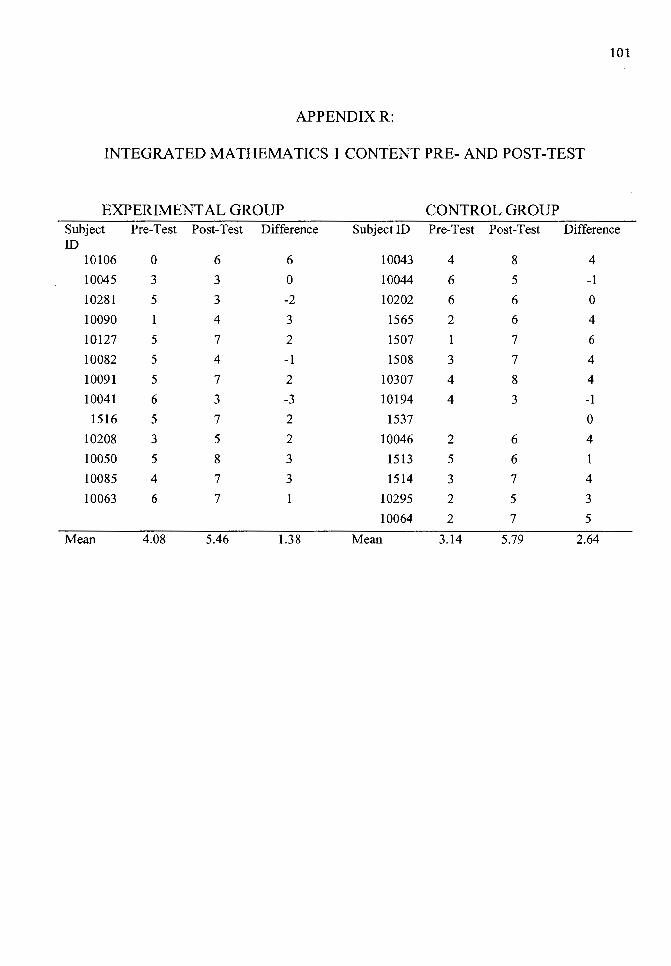
101
APPENDIXR:
INTEGRATED MATHEMATICS I CONTENT PRE- AND POST-TEST
EXPERIMENT AL GROUP CONTROL GROUP Subject Pre-Test Post-Test Difference Subject ID Pre-Test Post-Test Difference ID
10106 0 6 6 10043 4 8 4
10045 3 3 0 10044 6 5 -1
10281 5 3 -2 10202 6 6 0
10090 4 3 1565 2 6 4
10127 5 7 2 1507 1 7 6
10082 5 4 -1 1508 3 7 4
10091 5 7 2 10307 4 8 4
10041 6 3 -3 10194 4 3 -1
1516 5 7 2 1537 0
10208 3 5 2 10046 2 6 4
10050 5 8 3 1513 5 6 1
10085 4 7 3 1514 3 7 4
10063 6 7 10295 2 5 3
10064 2 7 5
Mean 4.08 5.46 1.38 Mean 3.14 5.79 2.64