Embed Size (px)
Citation preview
Learning With People Like Me: The Role of Age-Similar Peers on Online Business Course Engagement Laura R. Huber Jacqueline N. Lane Karim R. Lakhani
Working Paper 21-072
Working Paper 21-072
Copyright © 2020 by Laura R. Huber, Jacqueline N. Lane, and Karim R. Lakhani.
Working papers are in draft form. This working paper is distributed for purposes of comment and discussion only. It may not be reproduced without permission of the copyright holder. Copies of working papers are available from the author.
Funding for this research was provided in part by Harvard Business School.
Learning With People Like Me: The Role of Age-Similar Peers on Online Business Course Engagement
Laura R. Huber Rotterdam School of Management
Jacqueline N. Lane Harvard Business School
Karim R. Lakhani Harvard Business School
1
Learning With People Like Me:
The Role of Age-Similar Peers on Online Business Course Engagement
Laura R. Huber* Jacqueline N. Lane* Karim R. Lakhani Rotterdam School of Management Harvard Business School Harvard Business School [email protected] [email protected] [email protected]
December 8, 2020
Abstract
Over the past decade, online learning has witnessed tremendous growth in popularity due to its ability to reach diverse participants in a scalable manner. However, one primary area of concern is the low course completion rates in digital platform-based learning, compared to face-to-face counterparts. Given that most education tends to be organized by age, we ask: how does the degree of age-similarity among cohort peers affect course engagement and persistence? Using a unique dataset of 17,000 working professionals enrolled in business skills training courses offered by an elite U.S. business school over a three year period, we show that age similarity has a positive effect on individual course completion: an individual’s likelihood of course completion increases by 3% for every 10 same-age cohort peers. Given that the average cohort size is 220 people, this suggests that a small threshold of same-age peers can have a substantial impact on course engagement and persistence. To examine mechanisms, we turn to participants’ motivations for taking the course, and find that similar-age peers are more likely to affiliate with one another because they share a common motivation for taking the course. Our results suggest that there is an implicit trade-off between social engagement and diversity of perspectives in online courses, and that the organization and structure of online courses ought to balance both objectives. Keywords: online courses, social engagement, homophily, business skills training, knowledge sharing
* Denotes co-first authorship
2
1. Introduction
Online communities have become an indispensable part of knowledge creation and knowledge
sharing (Baek and Shore 2020, Faraj et al. 2016, Ren et al. 2007). These communities bring together
individuals with mutual interests via electronic communication to overcome the limitations of being in the
same time and space inherent to face-to-face settings (Faraj and Johnson 2011, Preece 2000, Ren et al.
2007, Wasko and Faraj 2005). The importance of online communities in facilitating communication and
social interaction is reflected in their diverse range of uses, such as social networks or support groups
(Bapna et al. 2016, Bapna and Umyarov 2015, Ren et al. 2007), auctions (Bapna et al. 2003), knowledge
sharing and collaboration (Majchrzak et al. 2007, Ransbotham and Kane 2011, Zammuto et al. 2007),
crowdfunding (Burtch et al. 2013, 2014), market transactions (Forman et al. 2008, Wu and Kleindorfer
2005) and reviews (Burtch et al. 2018), both within and outside firm boundaries (Faraj and Johnson
2011).
A special type of online community that has seen tremendous growth in popularity over the past
decade is online learning platforms that facilitate learning and skills acquisition for learners of all types of
ages (Baek and Shore 2020, Eesley and Wu 2019). In recent years, a number of universities and business
schools have also begun offering online professional degree programs, boot camps, and certificates via
digital platforms (Bettinger et al. 2016, Steffens 2015, Grushka-Cockayne and Lakhani 2019). In addition,
platform-based learning has become an integral part of the various corporate training initiatives by
multinational companies, such as Google, Amazon, and JP Morgan, to upskill their employees in the
latest technologies and business skills (Bidwell et al. 2013, Campbell et al. 2012, Cappelli 2012, 2015,
Deming and Noray 2018). Most recently, the Covid-19 pandemic has brought to light a “new normal” for
online learning – that is likely to have longer lasting implications on the modalities (e.g., face-to-face,
online, hybrid) through which people learn (Li and Lalani 2020).
There are several advantages that online courses offer over their face-to-face counterparts. First,
the ability to access the same course across space and time offers flexibility to anyone with an internet
3
connection (Breslow et al. 2013, DeBoer et al. 2013). This feature is particularly important for the new
class of adult learners who are taking online courses via digital classrooms for skills training and
professional development (Cappelli 2015, Steffens 2015). Second, their relatively lower cost structure
compared to face-to-face instruction facilitates broader reach to diverse populations – leading to greater
democratization of learning (Deming et al. 2015). Third, the global nature of cohort peers often features a
broader range of divergent perspectives that may lead to greater knowledge acquisition (Cummings
2004). However, scholars have noted that paradoxically, these very features of online courses can also be
detrimental to course engagement, leading to low online completion rates (Breslow et al. 2013, DeBoer et
al. 2013).
The difficulty of engaging people that are spread across physical space and various time zones is
one of the key challenges faced by many online communities (Baek and Shore 2020, Ransbotham and
Kane 2011). This challenge is partly due to the anonymity of the users and contributors, and the lower
levels of authority and control over the members compared to the hierarchy and structure imposed by
traditional organizational forms (Ren et al 2007). In most online learning courses, these authority and
control mechanisms tend to be lightly enforced or completely absent, i.e., there are no teachers to check
attendance and no peers to provide direct support and encouragement (Mackness et al. 2010, Nawrot and
Doucet 2014). Moreover, even though course participants all strive towards the same goal, the
engagement with course materials and participation in online discussions very much depends on the
motivation and self-control of individual participants, which often leads to low engagement and retention
rates (Breslow et al. 2013, DeBoer et al. 2013).
The literature on voluntary contributions in online communities indicates that one way to foster
engagement in large online groups is by developing relational social capital or the creation of a common
identity or common bonds (Huang et al. 2017, Ren et al. 2007, Wasko and Faraj 2005). This suggests that
relational factors and identity formation with other online course participants may help improve
engagement and retention rates among learners. However, the demographic and value diversity of
participants in online courses runs counter to how people tend to affiliate with one another (McPherson et
4
al. 2001), and the asynchronous communication and pre-recorded videos of online courses differs from
how interaction and content is delivered in face-to-face education (Bettinger et al. 2015, Bettinger and
Long 2005). Therefore, we seek to better understand whether and how the demographic composition of
cohort peers can potentially increase engagement and learner retention in online courses.
A key question that arises is whether social engagement matters in online courses. The literature
on peer effects in education suggests that the composition and quality of one’s cohort or classroom peers
may have social considerations that affect learning outcomes, even when academic achievement is
independently assessed (Carrell et al. 2009, Hoxby 2000, Jackson and Bruegmann 2009, Lavy and
Schlosser 2011, Zimmerman 2003). Turning to online environments, the literature on online social
networks and influence suggests that peers can have significant effects on each other’s behaviors,
including driving product adoption (Bapna and Umyarov 2015), word-of-mouth social influence (Aral
and Walker 2011), and product ratings (Wang et al. 2018). Closer to our setting, the online learning
literature indicates that peer influence is important to social engagement, even in environments where
peers interact with one another over asynchronous and written communication (Bettinger et al. 2014).
Past studies suggest that the quality of online interactive exchanges may even surpass those of face-to-
face settings (Bettinger et al. 2016). Moreover, social interaction and feedback from peers is a critical
component of online learning among professionals, where knowledge and expertise reside in both the
instructor and the learners (Milligan et al. 2013). Therefore, social processes, such as cohort identification
and relationship formation are important factors that may shape participants’ desire to persist or drop out
(Cramton 2001, Fiol 1994, Rovai and Jordan 2004). What is noticeably absent from the literature on
online learning and online communities, is the extent to which people’s preferences to affiliate with
similar others – i.e., homophily, may shape their course engagement and persistence.
One distinguishing feature of online courses is that they attract participants from all ages and
career stages. While most “traditional” forms of education are structured in a way that similar-age peers
progress through various levels of schooling together, from primary, secondary, to college or undergrad,
online courses intermix cohorts of current college students and mid- to late-career professionals in the
5
same course. In online courses, the motivations for taking the course are also likely to be more diverse
compared to traditional, degree-granting face-to-face programs, i.e., some online course participants
might be looking to prepare for an MBA program, while other participants are looking for a change in
their career. We thereby argue that intermixing people with different ages and motivations contributes to
lower identification with one’s peers, reducing course engagement and persistence as a consequence. Put
differently, because interactions with similar others are more rewarding (McPherson et al. 2001), the
degree to which cohort peers are similar in age and motivation, may shape their desires to persist.
To examine how and why age similarity among cohort peers affects individual course
engagement in online courses, we study the course persistence behaviors of 17,000 working professionals
enrolled in eight online business courses at an elite U.S. business school over a three-year period. Our
strategy identifies the causal effect of peers on course completion by using a natural experiment that
depends on the assumption that there is some variation in cohorts’ peer composition within a course that
is idiosyncratic and beyond easy management by universities, administrators and self-selection. We
identify idiosyncratic variation by comparing exogenous variation in age and motivations across cohorts
for the same course.
Our results indicate that age similarity improves the probability of course completion: an
individual’s likelihood of course completion increases by 3% for every 10 same-age cohort peers, and is
slightly larger for courses with more social interaction. Given that the average cohort size is 220 people,
this suggests that a small threshold of same-age peers can substantially improve course persistence for
online participants. Turning to participants’ motivations, we find that one potential reason why similar-
aged peers are more likely to affiliate with each other is due to their common motivations for taking the
course. Because these common motivations only emerge after initial contact, they can be a critical force
that sustains interactions and makes communication with similar aged peers more rewarding.
Overall, our study is among the first to investigate the implications of how cohort composition via
age similarity impacts online course engagement. These findings yield important insights for the optimal
organization of schools, university courses, and corporate training programs that offer online or hybrid
6
programs. Our results show that age similarity is an important consideration when structuring online
courses. This can be potentially explained by the common motivations that similar-age individuals have
for taking online business courses, which may come at the expense of increased diversity in perspectives,
backgrounds and opinions that are often associated with greater knowledge transfer and learning.
Although online learning platforms offer numerous advantages for employee and managerial business
skills training and development, employers and participants ought to pay closer attention to how age
dispersion and intermixing affects how people learn online. We suggest that one promising path forward
is to design diversity-promoting interventions or team building exercises so that cohort members learn to
value the range of perspectives and backgrounds of their dissimilar peers.
2. Theory and Hypotheses
2.1. Engagement and Retention in Online Communities
Online communities are commonly defined as an internet collective of people who interact over time
around a shared purpose, interest or need (Preece 2000, Ren et al 2007). Many of these communities are
based on voluntary memberships and contributions, leaving limited room for organizers of the platform or
community to enforce participation and retention (e.g., through contracts or other financial incentives)
(Shah 2006, Wasko and Faraj 2005). In online learning platforms, although many of the offerings are free
of charge (i.e., Massive Open Online courses or MOOCS), the option of paid admission does exist, i.e.,
some platforms require the payment of a tuition fee before participants are admitted to the program and
MOOCS offer verified certificates of completion for a relatively small fee (~$100) (Billington and
Fronmueller 2013). While research indicates that paying for course enrolment may help to improve
engagement and persistence (Gong et al. 2018), even for paid online learning formats such as online
MBAs, the average attrition rate is still around 25%.1
The online communities’ literature suggests that common identity and common bonds may
improve commitment and contributions in online communities (Ren et al. 2007). Common identity refers
1 Source: https://www.univstats.com/comparison/online-mba/graduation-rate/
7
to attachments or identification with a group as a whole, whereas common bonds can be attachments to a
group as a whole but also to individual group members (Ren et al., 2007). In the context of online
learning platforms, one way in which participants may initially form a common identity with one another
is by sharing common goals, such as wanting to learn certain skills or supplement their academic
coursework, a feeling of “being in this together”, and for some platforms, perhaps also the feeling of
being part of an elite university community. Even though all members have their individual goals (i.e.,
completing the course), all participants within the cohort will share that goal and will have common
experiences, such as working through new concepts, the need to make deadlines and combining work
with online learning, which can foster a common identity among online learners (Guegan et al. 2017,
Stevens et al. 2019).
Moreover, throughout the course, there are opportunities for social interactions and sharing of
personal information, which can foster individual bond-based attachments within groups. There are
generally two critical elements that lead to interpersonal bonds in online settings. First, the disclosure of
personal information (e.g., a picture, background experience, current location, etc.) will help course
participants learn about each other and will shift the attention from the unfamiliar and potentially large
group to individual members (Postmes et al. 2002, Sassenberg and Postmes 2002). In particular, personal
information can foster interpersonal bonds, even before the interaction takes place (Walther 2002).
Second, opportunities for social interactions (e.g., asking and answering questions, writing reflections,
providing feedback, etc.) in turn facilitate trust and understanding, as well as the development of
interpersonal bonds (Baek and Shore 2020, Zhang et al. 2017).
2.2. Homophily in social interactions
To develop our hypotheses, we build on the notion that social interaction is integral to the success
of all online communities and for online learning platforms in particular. Participants may form a
common identity and establish interpersonal bonds with any of their cohort peers. However, principles of
homophily suggest that people prefer to affiliate with similar others who share a social or demographic
characteristic, such as race, gender, age, or nationality (Lazarsfeld and Merton 1954, McPherson et al.
8
2001), despite the potential benefits of diversity in perspectives and backgrounds for knowledge transfer
and learning (Argote and Miron-Spektor 2011, Cummings 2004, Fiol 1994, Reagans and McEvily 2003).
Sharing a social characteristic is an important predictor of interaction and relationship formation, such
that contact between similar people tends to occur at a higher frequency than between dissimilar people
(McPherson et al. 2001, Smith et al. 2014). In online courses, where there are often many unfamiliar
others, learners may use homophily to reduce the uncertainty in their interactions (Dahlander and
McFarland 2013, Ingram and Morris 2007, Kanter 1977).
Given that “traditional” education institutions tend to be stratified by age, we draw on age as an
organizing principle, and focus specifically on the effects of age similarity with cohort peers as a key
factor predicting course engagement and persistence. Age is also particularly relevant in online courses
due to the common motivations that similar-aged individuals often share in regards to their professional
and personal development goals, from being in a similar life or career stage (North and Fiske 2015).
Lazarsfeld and Merton (1954) draw a distinction between status homophily and value homophily.
Whereas status homophily includes major sociodemographic dimensions that stratify society, such as
race, sex, and age, value homophily includes a variety of internal, more hidden characteristics, such as
attitudes, beliefs and values, that shape our orientation toward future behavior (Lazarsfeld and Merton
1954). Both types of similarity have been shown to lead to attraction and interaction (McPherson et al
2001). In the remainder of this section, we theorize how age influences participants’ likelihood of
engaging with their peers (status homophily) and how their shared values and motivations for taking the
course (value homophily) may encourage greater social interactions and knowledge exchange, as well as
improve course persistence.
2.2.1. Status Homophily: Age Similarity and Course Completion
In online courses, although cohort peers may share social characteristics along different dimensions, age
similarity may be a particularly salient characteristic for several reasons. First, the traditional organization
of primary, secondary and tertiary education tend to group individuals of similar ages together in
classrooms, thereby inducing strong age homogeneity in tie formation and persistence over time

9
(McPherson et al. 2001). As a result, most studies on peer effects in education have looked at different
types of homophily (e.g., gender, race, etc.) among similar aged peers (Carrell et al. 2009, Gaviria and
Raphael 2001, Hasan and Bagde 2013, Hoxby 2000, Zimmerman 2003). These studies have indicated that
age-similar peers can have important influences on individuals’ academic achievement, interests and
behaviors. Even though age similarity declines after high school, there is a general belief that the typical
college student in the U.S. remains between 18 and 22 years old, and the average age for business schools
remains consistently between 27 to 29 years old (Byrne 2019). Given the organization of formal
education establishments, participants in online business courses may expect to take classes with similar-
age peers, and may be less motivated to engage in the course and forms bonds with their peers if they
encounter a greater share of age heterogeneous cohort members.
Second, age-similar ties tend to be closer and longer lived (Fischer 1982, Marsden 1987, Reagans
2011). Age is often one of the most salient dimensions for friendship choice (Verbrugge 1977). For
instance, people who are similar in age are more likely to be at a similar life stage, to share similar
outlooks on important issues, and to have gone through similar experiences and socialization, which
collectively shape their attitudes and perspectives (Kilduff et al. 2000, Tsui et al. 1992). For example,
age-similar peers are more likely to be at a similar point in their life course (e.g., entering the work force,
entering graduate school, becoming a first-time manager) or they may have experienced a similar life
history that subsequently shapes how they interpret the world and those in it (Bianchi 2013, North and
Fiske 2015). Prior research has also theorized that when demographic diversity in a group increases, this
tends to increase the salience of social similarity, which can have a positive effect on relationship
formation and identification (Kanter 1977, Reagans 2011). Consequently, participants in online courses
may be more motivated to communicate and exchange information with age-similar peers, because these
interactions are more mutually rewarding and reinforcing of future interactions.
Third, similar-age individuals are more likely to be role models that exert influences on a focal
individual’s attitudes, behaviors and future decisions (Bettinger et al. 2016, Gaviria and Raphael 2001,
Hasan and Bagde 2013, Marx and Roman 2002). For example, Hasan and Bagde (2013) found that
10
students with more academically abled roommates also achieved greater academic performance because
their roommates became role models that improved a student’s outlook towards good study habits and
work ethic. Hence, we may expect that marginal participants may be more inclined to adopt the model
behaviors of similar-age peers, because they are more likely to identify with them and perceive that these
behaviors are appropriate of their age category. On the other hand, greater age-dissimilarity can result in
tensions in terms of cultural fit as different age groups may have divergent expectations for social
interactions (North and Fiske 2015). For example, recent graduates who are used to lively classroom
interactions may also expect this in an online setting, whereas people who are more advanced in their
career may have limited time and prefer to keep interactions focused and to the point. Such divergences in
normative fit may have a negative impact on individuals’ engagement and persistence in the course.
Finally, given that many online courses cater to working professionals (Breslow et al. 2013,
DeBoer et al. 2013), there is the possibility that hierarchical differences may emerge between the younger
and older cohort members (Harrison and Klein 2007). In work settings, younger employees tend to be
more junior than older employees by way of organizational tenure, promotions, and prior experience
(Kanfer and Ackerman 2004). Such differences are likely to reduce trust and introduce uncertainty in
people’s interactions (Blau 1964, Gibson and Gibbs 2006, Gulati 1995), which could lead people to
gravitate to age-similar peers. Although older peers may serve as mentors by providing advice and
support to their junior peers – which may create mutually rewarding interactions, the communication and
relationships that junior workers typically form with senior organizational members tend to be more
hierarchical and less egalitarian or peer-like. These expectations may also manifest in online learning
platforms, whereby having more age-similar peers can increase trust and psychological safety
(Edmondson 1999), and ultimately people’s desires to persist.
These arguments suggest that shared understanding is more likely to form among age-similar
peers, due to the commonalities in their experiences and socialization. Because age affects people’s career
aspirations (Bidwell and Briscoe 2010, Pogson et al. 2003), as well as their beliefs and motivations (North
and Fiske 2015, Pogson et al. 2003), having similar-aged cohort peers may be even more important in
11
virtual settings where all interactions are reduced to written communications, thereby suppressing verbal
(e.g., tone, emotion) and non-verbal cues (e.g., eye gaze, body movements, gestures, facial expressions)
that help with relationship formation and consensus building among potentially dissimilar individuals in
traditional face-to-face settings (Gibson and Gibbs 2006, Wiesenfeld et al. 1999). Moreover, feelings of
common identity and common bonds are associated with greater contributions and social interaction in
online settings (Baek and Shore 2020, Ren et al. 2007). Based on these reasons, we hypothesize that
participants are more likely to complete online courses when their cohort peers are more similar to them
in age.
Hypothesis 1 (H1). An increasing number of age similar peers has a positive effect on individual
course completion rates in online business courses.
2.2.2. Value Homophily: Motivational Similarity and Age
Another way to form bonds is based on value homophily, i.e., a preferred association with others
who think and see the world in similar ways (Lazarsfeld and Merton, 1954). Online courses tend to attract
participants with diverse motivations (Breslow et al. 2013, DeBoer et al. 2013). This is consistent with the
literature on online communities that has examined why people contribute or lurk in online discussions
(Wasko and Faraj 2005). Often in online communities, people have a desire to be social and interact with
others when they share a common motivation (Pogson et al. 2003, Wasko and Faraj 2005). In online
courses, we argue that age similarity is beneficial for course persistence not only due to the initial
behaviors of status homophily for similar-age ties, but also due to the effects of being the same age in
shaping people’s values, knowledge and beliefs. People’s work-related interests and attitudes change over
time with one’s age and career stage, including their preferences for hard work or leisure, career
advancement and mobility (Bidwell and Briscoe 2010, Pogson et al. 2003). Because same-age peers are
more likely to occupy similar life and/or career stages (McPherson et al. 2001), they are also more likely
to share a common motivation for taking the course. Therefore, we hypothesize:
Hypothesis 2a (H2a). Individuals that are similar in life or career stage are more likely to share
the same motivation for taking the course.
12
In online business courses, these dimensions of motivational similarity among “like-minded”
peers can be educational or professionally oriented. For example, an early career professional who is
preparing for business school is more likely to feel connected to and benefit from another early career
professional’s knowledge and advice if they share a common goal to attend business school, as their
motivational similarity may allow them to develop similar interpretations and understandings of the
course material. In a similar vein, two mid-career professional peers who are preparing for a career
change may be more likely to relate to others who are also going through similar transition points. Unlike
preferences to affiliate explained by status homophily, value homophily is unobserved and can only be
realized after initial interaction (Hogg et al. 1995, Reagans 2011).
In other words, given people’s preferences for age-similar encounters, any positive effect that
being the same age can have on people’s interactions and relationship formation should be even more
positive if they share a common motivation for taking the course or when a greater number of peers share
similar motivations for taking the course. While one channel through which individuals identify with
others is based on status homophily (i.e., age similarity), another channel that may emerge is based on
value homophily (i.e., motivational similarity). Sharing a common characteristic and/or common value
makes interactions more rewarding, and reinforces repeated communication and information exchange
throughout the course. However, unlike status homophily, which can be identified through visible
characteristics and prior to interaction (e.g., profile pictures and language), value homophily is
unobserved and can only emerge after two individuals begin interacting. Based on these reasons, we
hypothesize that the effects of age-similarity among cohort peers on course completion should be even
stronger if there are more similarly motivated peers in the cohort. Thus, we hypothesize:
Hypothesis 2b (H2b). The positive effect of an increasing number of age similar peers on course
persistence is stronger as the number of people with the same motivation increases.
3. Empirical Setting, Course Platform and Cohort Structure
We now turn to empirically testing the hypotheses presented in the previous section. Our context
allows for the rare possibility to rely on a quasi-experimental setting in a natural environment. We focus
13
on the enrollment and completion patterns of business skills training courses offered by an elite U.S.
business school over 40 months, from October 2015 to January 2019, with most course offering once per
quarter. Unlike Massive Open and Online Courses (or MOOCS), these online business courses require
prospective students to apply to the program, be accepted, and pay a non-trivial tuition to enroll alongside
a cohort of virtual peers. Table 1 presents summary demographic information for the sample, and the
means (standard deviations) across all cohorts, and indicates that participants come from diverse
backgrounds and experiences, representing 52 industries (e.g., consulting, education, energy, and
healthcare), 35 fields of study (e.g., accounting, computer science, engineering, psychology, sociology),
and 118 countries (e.g., US, China, India, Australia, Brazil).
[ Table 1 about here ]
Courses are taught by the business school’s faculty. Sample courses include Financial
Accounting, Business Analytics, and Negotiation. A single course ranges from 3-8 weeks long, and
requires about 5-8 hours of engagement per week, depending on the topic(s) of inquiry. The cost of a
course ranges from about $1,000 to $2,000, and approximately one-third of enrollees receive at least some
corporate tuition reimbursement. About 53 percent of the participants have enrolled in the flagship
program of the platform, which is the business fundamentals program comprised of multiple courses
taken simultaneously over 10-12 weeks. Through our interviews with the program administrators, past
participants have indicated that taking the online courses have helped to bolster their resume, perform
their job better, and enabled them to join a community of like-minded peers.
Participants can only enroll in the course if they are admitted into the program, with about 50% of
admitted students choosing to enroll. Upon enrolling, participants are placed in a cohort of peers who start
the course together at the same time. The learning model for each course is designed around three
characteristics, which includes video lectures, cased-based learning where participants discuss and debate
solutions to real-world cases with their cohort peers, as well as social learning, where cohort members
exchange ideas, offer input, seek out different viewpoints, and learn from one another’s experiences and
perspectives. Upon course completion, completers receive an online certificate from the business school.
14
To earn a certificate of completion, participants need to complete each week’s lessons by the weekly
deadlines and earn an average quiz score at the end of each lesson of at least 50%. Figure 1 shows a
screenshot of a sample learning module from the course platform.
[ Insert Figure 1 about here ]
Our study context is an ideal setting to examine peer effects in online learning for three related
reasons. First, our setting avoids problems of selection and common shocks that are two issues that may
create identification problems in peer effects studies (Manski 1993). Video lectures are prerecorded and
course syllabi are publicly posted, which removes heterogeneity in the delivery of course content that may
arise due to instructor changes or rearrangement of modules. More importantly, among the risk set of
participants who have enrolled in the course, individuals apply independently and do not select which
(virtual) classroom to join, as cohort peers are constructed based on the individuals who decided to apply
to the same offering of the course (also called a “course wave”).
Second, the course format and structure create opportunities for social interaction and social
learning with peers. Participants are required to upload a profile picture and select their country of
residence, which can increase the social presence and level of identifiability of cohort members on the
platform, as well as provide clues about their sociodemographic characteristics (Aragon 2003, Kear et al.
2014). In particular, as shown in Figure 2, cohort members are asked to upload a profile picture and upon
logging into the course for the first time, they are shown a map of the locations of the other course
participants. In addition, cohort members progress through the course at a similar pace. Although the
videos and assignments can be completed at an individual’s own time, all participants must complete each
week’s lesson plan by the stated deadline, otherwise they cannot progress to the next week’s lesson or
complete the course.
[ Insert Figure 2 about here ]
Third, there are significant opportunities for peer-to-peer interaction, as the course content is
structured around interactive learning via case studies and weekly discussions, where participants are
encouraged to discuss case and homework prompts with their cohort peers. The opportunities for peer-to-
15
peer interaction are particularly useful for working professionals, due to the knowledge and skills that
experienced learners bring to the course (Littlejohn et al. 2016). Figure 3 shows a screenshot of the peer
help function, used by participants to ask their peers’ help and advice on a particular problem. When
others’ reach the same point in the course, they will see the question and are able to respond.
[ Insert Figure 3 about here ]
As mentioned above, a significant share of participants on the platform are enrolled in the
flagship program. This program provides an interesting setting to test the robustness of our hypotheses for
several reasons. First, this program is much more intense than the other courses offered on the platform.
Because it consists of three courses that have to be taken in parallel over a period of 10-12 weeks, the
time investment per week for the flagship program is approximately 12-15 hours, while for most other
programs it is around 5-7 hours per week and for a shorter period of time (6-8 weeks). To complete the
course, participants have to take a three-hour assessment that has to be delivered in-person at one of the
global partnering testing facilities. Moreover, within this program, active participation and cold calls are
explicitly part of the learning requirements to pass the course. Hence, due to the intensity of the program
and the required active participation during the program, social interactions are an integral part of the
course experience in these courses, and thus the perfect setting to confirm our hypotheses.
Furthermore, in our interviews with the program administrators, we learned that the administrators
wanted to keep the size of course waves around 200-250 people (Mean = 220.83, SD = 72.80, Median =
220). Due to the popularity of the flagship program, some course waves were larger than this designated
size. For these waves, the program administrators block randomized students into multiple cohorts
according to their country of residence, if there were at least five students from the same country.
Otherwise, students from the same country were placed in the same cohort. The random assignment of
course participants to different cohorts within the same course wave, provides us with an additional
identification strategy to test the causal impact of age similarity in cohort composition on course
completion.
4. Variables
16
In this section we describe our outcome variable and then our key explanatory variables.2 Our
empirical analysis focuses on the variation across cohorts for the eight business courses offered on the
platform – with our sample based on 17,057 participants enrolled in 94 cohorts and 8 courses. The
majority of our demographic data comes from the application form, which includes detailed information
on their birth date, age at the start of the course, gender, citizenship, country of residence, city, education
level and institution, and employment level. The application form also includes a question that asks
applicants to indicate their primary reason for taking the course from a dropdown list.
In addition to the data collected from the application, we have platform-level data on the specific
course wave, cohort, year, quarter, whether they received financial aid, whether they have previously
taken a course on the platform, and whether they completed the course they were enrolled in.
4.1. Dependent Variables
Completed course. Our main dependent variable is a dummy variable equal to 1 if the participant
completed the course, and 0 otherwise. The mean course completion rate is 0.823 (SD = 0.381).
Primary motivations. To capture participants’ motivations for taking the course, we turn to data
from the application form where applicants were asked to select their primary reason for applying from a
dropdown menu. There were seven potential reasons that applicants could select, which were related to
career advancement, career change, MBA prep, acquiring new knowledge, performing the job better,
professional training, and other. Informed by interviews with program administrators, we aggregated
these reasons into three primary motivations: 1) professional development (e.g., “To advance my current
career”; “I am hoping to make a career change”, “It is a required part of my professional development
plan”, “I want to feel more confident in my strategic recommendations”) 2) MBA prep ( “I need to
2 Our analysis focuses on the business-to-consumer (B2C) participants, to exclude any idiosyncrasies associated with the business-to-business (B2B) clients and their employees. It also excludes any participants from the European Union (EU) due to GDPR restrictions, as well as participants enrolled in the entrepreneurship and a managerial economics course (~8% of the sample), where the participants were asked to select among a different list of reasons when applying to the course or was a new course with idiosyncratic enrollment.
17
prepare for business school”), and 3) learning or new knowledge acquisition (e.g., “I would like to expand
my knowledge base; “I enjoy taking online courses”).
4.2. Independent Variables
4.2.1. Individual-Level Variables
Age similarity. We measure Age similarity as the number of same-age peers in the cohort. More
specifically, for each individual we calculate the number of peers in his/her cohort that are the same
(similar) age. We also use several alternative measures of age similarity, such as the number of peers that
are within a +/-2 year range, +/-5 year range, and a categorical variable that splits the number of same-age
peers at the median (i.e., low vs. high number of same-age peers). Figure 4 shows the distribution of the
number of same-age peers by course.
[ Insert Figure 4 about here ]
Career stage. To examine how motivations vary by career stage, we split the distribution of
participants’ ages at the start of the course into three equal sized groups by age, corresponding to three
career stages: Recent graduate (17-26 years old), Early career (27-34 years old), and Mid-career (35
years old and above). This approach is consistent with prior literature examining career stage using age
categories (Pogson et al. 2003). Figure 5 shows the distribution of participants’ primary motivations by
career stage.
[ Insert Figure 5 about here ]
Motivation similarity. We measure Motivation similarity as the number of peers in the cohort that selected
the same primary motivation for taking the course (as described in Section 4.1).
4.3. Controls
We control for a number of participant-level categorical variables as controls. These include the
participant’s gender, the participant’s country of residence (a categorical variable with the following
countries: Australia (3.63%), Brazil (3.29%), Canada (5.45%), China (1.04%), India (5.15%), Mexico
(1.20%), Nigeria (1.00%), Saudi Arabia (1.40%), United Arab Emirates (1.76%), United States (64.13%),
Singapore (1.99%), and Other (9.96%), which contained all other countries with less than 1% of
18
representation), highest level of study (high school, bachelor’s or equivalent, masters/PhD), employment
level (junior, mid-management, senior management, executive or not available), prior experience with the
platform (i.e., has previously taken a course on the platform), whether a participant received financial aid,
and industry. In some model specifications, we also control for the log cohort size. Table 3 presents the
correlation table of the main variables.
[ Insert Table 3 about here ]
In addition, we control for other measures of social similarity with # same-gender peers and #
same-nationality peers, as well as propinquity with # same-city peers.
4.4. Estimation Approach
A key part of our identification strategy hinges on the assumption that, within a particular course,
quarter-to-quarter variation in the cohort age composition is quasi-random and not correlated with other
unobservables influencing completion rates for that cohort. Our greatest concern is that the coefficient
estimates for Cohort size and Age similarity (number of same-age cohort peers) might be biased by
spurious correlations associated with other determinants of course completion.3 For example, features of
the course, seasonality, change in marketing campaign for the course, a new course instructor, which may
affect whether an individual completes the course. A telling signal of this type of endogeneity would be
any evidence of time trends in the degree of age similarity or cohort size. Figures 6 and 7 plot the cohort
size and distribution of number of same-age peers by course over time. It is clear that there is variation
across cohorts and courses for both cohort size and age similarity. However, it does not appear that there
are time trends or path-dependence in either cohort age or the number of same aged peers.
[ Insert Figure 6 about here ]
[ Insert Figure 7 about here ]
Moreover, Table 2 presents the balance checks of the randomization of participants into multiple
cohorts, for the 15 course waves described in Section 3 where there were more than the roughly 200-250
3 The terminology used is such that course wave and course cohort can be used interchangeably except for the 15 course waves that were oversubscribed, resulting in multiple cohorts per wave.
19
participants considered suitable by course administrators for a single cohort. Table 2 indicates that the
cohorts were well balanced on the main covariates of interest. There are two significant differences
between the different cohort groups, i.e. participant age (9 months) and the number of same-age peers
(0.5). However, these differences are small in absolute terms and are due to slight imbalance in one
course wave in Q4-2017.
[ Table 2 about here ]
Moreover, Figure 8 shows the distribution of the average number of same-age peers for the 15
course waves with multiple cohorts over time. Importantly, the line of best fit suggests that there are no
time trends or path dependencies (𝜌𝜌 = -0.123, p =0.474).
[Figure 8 about here ]
To understand how variations in age similarity affects the distribution of course completion outcomes in a
cohort (H1), we estimate versions of the following model using linear probability models (LPM):4
𝐶𝐶𝐶𝐶𝐶𝐶𝐶𝐶𝐶𝐶𝐶𝐶𝐶𝐶𝐶𝐶𝐶𝐶 𝑐𝑐𝐶𝐶𝑐𝑐𝑐𝑐𝑐𝑐𝐶𝐶𝑖𝑖𝑖𝑖𝑖𝑖 = 𝛼𝛼 + 𝛽𝛽1(𝐴𝐴𝐴𝐴𝐶𝐶 𝑐𝑐𝑠𝑠𝐶𝐶𝑠𝑠𝐶𝐶𝑠𝑠𝑐𝑐𝑠𝑠𝐶𝐶𝑠𝑠)𝑖𝑖𝑖𝑖 + 𝛾𝛾𝑋𝑋𝑖𝑖 + 𝛿𝛿𝑖𝑖𝑖𝑖 + 𝜀𝜀𝑖𝑖𝑖𝑖𝑖𝑖 . (1)
The dependent variable, 𝐶𝐶𝐶𝐶𝐶𝐶𝐶𝐶𝐶𝐶𝐶𝐶𝐶𝐶𝐶𝐶𝐶𝐶 𝑐𝑐𝐶𝐶𝑐𝑐𝑐𝑐𝑐𝑐𝐶𝐶𝑖𝑖𝑖𝑖𝑖𝑖 is determined by whether participant i enrolled in
course j completes the course at time t. The model includes individual-level covariates, 𝑋𝑋𝑖𝑖, described in
section 4.3, while 𝛿𝛿𝑖𝑖𝑖𝑖 are course wave fixed effects, respectively. We also estimate versions of the same
model for the subsample of 15 course waves that had multiple cohorts within the same wave. Moreover,
to test if course participants that are similar in life age or career stage are also more likely to share the
same motivations for taking the course (H2a), we estimate the following model:
𝑃𝑃𝑐𝑐𝑠𝑠𝐶𝐶𝑠𝑠𝑐𝑐𝑠𝑠 𝐶𝐶𝐶𝐶𝐶𝐶𝑠𝑠𝑚𝑚𝑠𝑠𝐶𝐶𝑠𝑠𝐶𝐶𝑚𝑚𝑖𝑖𝑖𝑖𝑖𝑖 = 𝛼𝛼 + 𝛽𝛽1(𝐶𝐶𝑠𝑠𝑐𝑐𝐶𝐶𝐶𝐶𝑐𝑐 𝑐𝑐𝐶𝐶𝑠𝑠𝐴𝐴𝐶𝐶)𝑖𝑖𝑖𝑖 + 𝛾𝛾𝑋𝑋𝑖𝑖 + 𝛿𝛿𝑖𝑖𝑖𝑖 + 𝜀𝜀𝑖𝑖𝑖𝑖𝑖𝑖 , (2)
where 𝑃𝑃𝑐𝑐𝑠𝑠𝐶𝐶𝑠𝑠𝑐𝑐𝑠𝑠 𝐶𝐶𝐶𝐶𝐶𝐶𝑠𝑠𝑚𝑚𝑠𝑠𝐶𝐶𝑠𝑠𝐶𝐶𝑚𝑚𝑖𝑖𝑖𝑖𝑖𝑖 represents one of the three primary motivations (Professional
development, MBA prep, or New knowledge acquisition).
4 Although non-linear models, such as logit may be used to model dichotomous outcomes, the LPM yields more interpretable coefficients than a logit specification, and this method allows us to correct for heteroskedasticity in the standard errors (Angrist and Pischke 2008). See Brands and Fernandez-Mateo (2017) and Chang et al. (2020) for similar procedures. For robustness, we also model each regression using non-linear logit models. The results are consistent across both OLS (LPM) and logit model specifications.
20
Finally, to test if the impact of having similar age peers on course completion changes with the
number of peers that share the same motivation for taking the course (H2b), we estimate the following
model:
𝐶𝐶𝐶𝐶𝐶𝐶𝐶𝐶𝐶𝐶𝐶𝐶𝐶𝐶𝐶𝐶𝐶𝐶 𝑐𝑐𝐶𝐶𝑐𝑐𝑐𝑐𝑐𝑐𝐶𝐶𝑖𝑖𝑖𝑖𝑖𝑖 = 𝛼𝛼 + 𝛽𝛽1(𝐴𝐴𝐴𝐴𝐶𝐶 𝑐𝑐𝑠𝑠𝐶𝐶𝑠𝑠𝐶𝐶𝑠𝑠𝑐𝑐𝑠𝑠𝐶𝐶𝑠𝑠)𝑖𝑖𝑖𝑖 + 𝛽𝛽2(𝑀𝑀𝐶𝐶𝐶𝐶𝑠𝑠𝑚𝑚𝑠𝑠𝐶𝐶𝑠𝑠𝐶𝐶𝑚𝑚 𝑐𝑐𝑠𝑠𝐶𝐶𝑠𝑠𝐶𝐶𝑠𝑠𝑐𝑐𝑠𝑠𝐶𝐶𝑠𝑠)𝑖𝑖𝑖𝑖 +
𝛽𝛽3(𝐴𝐴𝐴𝐴𝐶𝐶 𝑐𝑐𝑠𝑠𝐶𝐶𝑠𝑠𝐶𝐶𝑠𝑠𝑐𝑐𝑠𝑠𝐶𝐶𝑠𝑠)𝑖𝑖𝑖𝑖 ∗ (𝑀𝑀𝐶𝐶𝐶𝐶𝑠𝑠𝑚𝑚𝑠𝑠𝐶𝐶𝑠𝑠𝐶𝐶𝑚𝑚 𝑐𝑐𝑠𝑠𝐶𝐶𝑠𝑠𝐶𝐶𝑠𝑠𝑐𝑐𝑠𝑠𝐶𝐶𝑠𝑠)𝑖𝑖𝑖𝑖 + 𝛾𝛾𝑋𝑋𝑖𝑖 + 𝛿𝛿𝑖𝑖𝑖𝑖 + 𝜀𝜀𝑖𝑖𝑖𝑖𝑖𝑖 . (3)
5. Results
We report our results in subsections, beginning with the effect of age similarity on individual course
completion in Section 5.1, and then turning to the participants’ motivations in Section 5.2 as a potential
reason why age similarity among cohort peers affects online course engagement and persistence.
5.1. Age Similarity and Course Completion
H1 theorized that age similarity among cohort peers would have a positive relationship with
course completion rates. Table 4 presents the OLS regression results for the probability of course
completion on age similarity. We begin with the simplest model, which includes the main variable of
interest, age similarity, where Model 1 shows that having 10 more same-age cohort peers increases the
probability of course completion by 1.8% (Model 1: 0.00177, p < 0.01). Model 2 adds individual level
controls, including the participant’s age at the start of the course, and controls for log cohort size, and
shows that the coefficient for age similarity remains stable and significant (Model 2: 0.00140, p < 0.01).
Model 3 adds course wave fixed effects and the coefficient for age similarity is also stable and significant
(Model 3: 0.00256, p < 0.01).
In Models 4-6, we use a number of alternative specifications for age similarity, namely the
number of similar-age peers with +/-2 years (Model 4), +/-5 years (Model 5) and the categorical variable
for low vs. high number of same-age peers (Model 6). All alternative specifications for age similarity are
positive and significant. Notably, we observe that the size of the age similarity coefficient becomes
smaller although still significant, in Model 4 (0.000784, p < 0.01) and Model 5 (0.000452, p < 0.01), as
21
the range of similar aged peers increases. Model 6 shows that having a high number of same-age peers in
the cohort increases course completion by about 2.27% (Model 6: 0.0227, p < 0.01).
Moreover, in Model 7 we add a dummy variable indicating if the individual was participating in
the flagship program, where social interaction is more prevalent due to the course intensity and
requirements for course completion. The interaction effect between the Flagship-dummy and the number
of same-age peers indicates that the effects are stronger for courses where participants engage in more
social interaction (Model 7: 0.00328, p < 0.01). Model 8 focuses on the subset of subset of recent college
graduates to mid-career professionals, and once again shows that age similarity is significant if we focus
on the between the ages of 22-50 (Model 8: 0.00222, p < 0.01).
Lastly, we add controls for other measure of social similarity (# same-gender and # same-
nationality peers) and propinquity (# same-city peers) in Model 9. We observe that the coefficient for age
similarity is stable and significant (Model 9: 0.00255, p < 0.01), even after controlling for other forms of
social similarity and propinquity.
[ Table 4 about here ]
To get a better sense of the magnitude and shape of age similarity effects, Figure 9 presents the
margins plot of course completion and age similarity with 95% confidence intervals (CIs), and shows that
the relationship between the number of same-age peers in the cohort and course completion is
approximately linear, suggesting that the effects of age similarity are additive. In particular, an increase
from 0 to 10 same-age cohort peers is associated with a significant increase in probability of course
completion of 2.6%, from 0.796 [0.785, 0.807] to 0.822 [0.821,0.823]. Similarly, an increase of 10 to 20
same-age peers is also associated with a 2.6% increase in in probability of course completion, from 0.822
[0.821,0.823] to 0.848 [0.838, 0.857], respectively.
[ Figure 9 about here ]
As described in Section 3, we use the subset of 15 course waves with multiple cohorts per wave
from the flagship program, where the participants were block randomized into different cohorts according
to their country of residence, as a robustness check to estimate the impact of age similarity on the
22
probability of course completion. In Model 1, the coefficient for age similarity indicates that enrolling
with 10 same age cohort peers increases the probability of course completion by 2.73% (Model 1:
0.00273, p < 0.01). The coefficient remains stable and significant in Model 2, which adds controls (Model
2: 0.00208, p < 0.05) and in Model 3, which adds course wave fixed effects to examine cohort differences
within the same course wave (Model 3: 0.00208, p < 0.05). The results remain consistent in Models 4-6,
using the alternative specifications for age similarity.
[ Table 5 about here ]
Taken altogether, we find evidence that age similarity increases the probability of course
completion. Thus, we find support for H1.
5.2. Age and Motivational Similarity
H2 theorized that peers who are similar in life and career stage are more likely to share similar
motivations (H2a) and that the effect of age similarity on course completion is stronger as the number of
same-motivation peers increases (H2b). To test H2a, Table 6 presents the results showing the relationship
between the self-reported primary motivations and participant age (Models 1-3) and career stage (Models
4-6), where the baseline is mid-career professionals. All models include controls and course wave FE. In
Model 1, we observe that age is positively associated with professional development (Model 1: 0.00215,
p < 0.01), but negatively related to MBA prep (Model 2: -0.00233, p < 0.01), and has no significant
relationship with knowledge acquisition (Model 3: -0.000536, ns). Examining how motivations change
with career stage, in Model 4, we observe that compared to mid-career professionals, recent graduates are
less likely to be motivated by professional development (Model 4: -0.0982, p < 0.01). In Model 5, we
observe that both recent graduates and early career professionals are more likely to be motivated by MBA
prep (recent graduate: 0.0644, p < 0.01; early career: 0.0531, p < 0.01). Lastly, Model 6 indicates that
recent graduates are 3.66% more likely and early career professionals are 5.40% less likely to be
motivated by new skills and knowledge acquisition compared to mid-career professionals (recent
graduates: 0.0366, p < 0.01; early career: -0.0540, p < 0.01). Taken altogether, the results in Table 6
indicate that the motivations for taking online business courses change according to participants’ age and
23
career stage, and that participants of similar age and career stage also share similar motivations for taking
the course. Thus, we find support for H2a.
[ Table 6 about here ]
Next, to test H2b, the results in Table 7 present the OLS regression results of the likelihood of
course completion on the age and motivation similarity. Models 1-4 presents the results for the full
sample, while Models 5-8 presents the results for the sub-sample of course waves with multiple cohorts.
Model 1 is the baseline model which includes the number of same-age and same-motivation cohort peers.
The coefficients in Model 1 show having 10 same-aged peers significantly increases the likelihood of
course completion by 1.4%, whereas having 10 similarly motivated peers significantly increases the
likelihood of course completion by 0.13% (same-age: 0.00143, p < 0.01; same-motivation: 0.000133, p <
0.05). This suggests that while both types of similarity are likely to impact course completion, age
similarity has a 10 fold impact compared to motivational similarity. The interpretation of the results
remain consistent in Model 2, which adds participant controls, as well as in Model 3, which adds the
course wave fixed effects. However, in Model 4, which adds the interaction term between # of same-age x
# of same-motivation peers, the coefficient for motivational similarity is no longer significant, and the
interaction term is not significant. Models 5-8 present similar results for the subsample of multi-cohort
waves, except that we note that while the coefficient for the # of same-age peers remains positive and
significant across Models 5-7, and positive in Model 8, the coefficient for the # of same-motivation peers
is not significant. Taken altogether, the results in Table 7 suggest that age similarity is the dominant
driver of course completion among online course participants, and although we observe that same-aged
peers are more likely to share similar motivations for taking the course (H2a), we do not find an additive
effect of motivational similarity and age similarity in improving course completion rates. Thus, we do not
find support for H2b, and find partial support for H2.
[ Table 7 about here ]
6. Discussion
24
The proliferation of online learning platforms with broad accessibility to participants across the
globe has instigated a shift in how people acquire knowledge and new skills. For a variety of reasons,
such as increased flexibility and cost savings, many large employers and individuals are turning to online
courses to develop new knowledge and improve their managerial and business skills. Demand for online
learning and training has only increased since the Covid-19 pandemic, which has created work from home
mandates and restricted travel between countries that greatly restrict the ability for people to enroll in
residential, face-to-face programs. Even for on-campus programs, many universities and colleges are
implementing hybrid or online learning instruction (Dorn et al. 2020) that are likely to have lasting effects
on how people learn (Taparia 2020).
Despite the greater flexibility and affordability of learning online, one primary challenge is that it
is often met with lower course engagement and larger dropout rates compared face-to-face instruction.
One reason may be due to the increased demographic diversity of online participants, which can diminish
people’s’ ability to identify with one another and form interpersonal bonds; often, both these factors are
essential to the livelihood of online communities (Ren et al. 2007). Given that most face-to-face
education is organized around age, and the common professional motivations that bond similar aged
people together, this paper investigates the implications of age similarity among cohort peers on course
engagement and persistence in online business courses.
Our findings show that age similarity has a positive effect on course completion: an individual’s
likelihood of course completion increases by 3 percent for every 10 same-age cohort peers, with the
magnitude of these effects being slightly larger for courses with more social interaction. We show that
age similar peers are more likely to share similar motivations for taking the course, which may make
interactions more mutually rewarding, thereby increasing the likelihood of repeated interaction, tie
formation and course engagement. However, while age-similar peers share motivational similarity, there
is no additive effect of having more similarly motivated peers together in a cohort. This suggests that
although similarity in values and motivations can make interactions with similar-aged peers more
rewarding, motivational similarities only emerge during interactions and is not the primary way that
25
people affiliate with each other in online courses. Beyond these findings, it is noteworthy that our study
provided a natural setting in which we were able to observe the distribution of ages and outcomes of
participants, across multiple cohorts and courses. The multiple observations per course were critical to our
empirical design to identify the causal effect of age similarity on course completion. In addition, our
findings are robust to the subsample of courses from the flagship program with parallel cohorts, where
participants were randomly assigned into different cohorts of the same course instance. The fact that our
results are robust within this subsample, where social interactions are a more integral part of the course
experience, provides further support for our hypotheses that social interactions are an important part of
peer effects in online learning platforms.
This paper makes several important contributions to the literature. First, our findings have
implications for the design and structure of online courses and online communities. Studies on online
communities have indicated that the ability to form common identities and interpersonal bonds with other
members is critical to their livelihood (Ren et al. 2007, Wasko and Faraj 2005). That said, other studies
have shown that only a small fraction of members typically contribute to online communities and that it
can be difficult to engage members over time (Faraj and Johnson 2011, Ren et al. 2007, Wasko and Faraj
2005). Numerous studies have shown that sustaining participant engagement is a major point of weakness
for online learning platforms, potentially due to the difficulty in establishing interpersonal bonds and
cohort identity among large cohorts of learners with diverse motivations and backgrounds (Baek and
Shore 2020, Breslow et al. 2013, Zhang et al. 2017). Since the NYTimes called 2012 “The Year of the
MOOC”, due to the emergence of online platforms, such as EdX, Udacity, and Coursera, to provide an
open model of learning at scale to anyone online—many skeptics have criticized the low course
completion rates and questioned the learning model and delivery of course content in a digital format to
masses of participants (Pappano 2012). Our study is among the first to investigate how social or
demographic similarity contributes to course engagement and persistence, and provides critical insights
into how online course cohorts can be designed around age to improve participants’ course completion.
To this end, university administrators may want to consider altering the design of online courses so that
26
participants can enroll with age similar peers. Alternatively, administrators may want to consider
introducing team building activities, paralleling the MBA “section” experience, or monetary and non-
monetary incentives (Bapna and Umyarov 2015, Burtch et al. 2018, Gong et al. 2018) at the beginning the
course to promote mutual support, cohort identification and openness to different perspectives among
cohort members.
Second, our study has implications for the workforce training literature (Bidwell and Briscoe
2010, Cappelli 2015) due to our focus on working professionals and executives. These courses are
particularly relevant from a management perspective, as skill accumulation and the development of
managerial talent are key to firm growth and innovation (Dragoni et al. 2009). Moreover, due to the
increasing pace at which technical skills become obsolete (Deming and Noray 2018), firms need to find
ways to upskill and train their workforce to remain productive (Illanes et al. 2018). To this end, our
findings suggest that the cohort composition of working professionals can be an important factor for
employees’ engagement and performance in these courses.
Third, our study contributes to the literature on homophily and the differentiated effects of
surface and deep level diversity (Kleinbaum et al. 2013, Lazarsfeld and Merton 1954, Reagans 2011,
Smith et al. 2014) on initial tie formation and relationship development. Although homophily has been
observed in a range of offline (e.g., classrooms, schools, workplaces) (Ibarra 1993, Kleinbaum et al. 2013,
Reagans 2011) and online settings (e.g., social networks, support forums) (Bapna and Umyarov 2015,
Christakis and Fowler 2009, Leonardi et al. 2013), the majority of these studies have focused on the
positive effects of surface level rather than deep level diversity in forming social and instrumental ties. As
we found no significant interaction effect between age similarity and motivational similarity, this
indicates that although people who are similar in age also share similarities in unobserved attitudes,
behaviors and motivations, the effect of being grouped with socially diverse but similarly motivated
peers, does not meaningfully contribute to increased course persistence. Further, it supports the notion
that people often only see what they expect to see, but not what they do not expect to see (Reagans 2011),
even in online settings where people’s surface-level characteristics are often ambiguous or not easily
27
identifiable. This is perhaps a rather surprising result in our setting, as there is ample research suggesting
that diversity in perspectives and backgrounds can improve learning and knowledge transfer (Argote and
Miron-Spektor 2011, Cummings 2004, Fiol 1994). That being said, if people do not see such differences
as advantages, then this suggests that policies aimed at bridging diverse participants together, such as
diversity-promoting interventions (Flory et al. 2019, Walton and Cohen 2011), may be crucial to foster
both course engagement and learning.
This study opens the door to potential avenues of future work. First, one promising direction
would be to examine how the demographic characteristics of cohort members influence the content and
frequency of their social interactions. For instance, an in-depth investigation of the participants’ social
interaction patterns and content may shed light into how question-asking, advice-seeking and advice-
giving vary between demographically similar and dissimilar peers. This line of inquiry can offer greater
insights into mechanisms and open opportunities for interventions to improve cohort identification and
relationship formation between diverse cohort peers.
Second, another future avenue would be to consider how the degree of social demographic
similarity affects the learning process as well as course completion. Further investigation of the learning
process would help differentiate between cohort members who dropout versus fail out due to poor
performance, which may be driven by different mechanisms. In a similar vein, it is critical to also
examine how people’s motivations are shaped by their online peers. Much research in both offline (Burt
2004, Byrne 1971, Kossinets and Watts 2009) and online settings (Aral and Walker 2011, Bapna and
Umyarov 2015, Wang et al. 2018) suggest that friends tend to adopt each other’s attitudes and behaviors
over time, indicating that how peers shape each other’s course engagement and behaviors over time is
another important consideration for understanding online course persistence. Moreover, there are other
important outcomes to consider, such as the amount of new knowledge acquired, the relationships and
networks formed, or the interviews and job opportunities that resulted from course completion. Certainly,
course completion is an important outcome for course designers and managers, but some practitioners
28
have begun to question whether course completion is the only metric to consider, given that some learners
may never intend to complete their online courses.
Third, we focused primarily on the participants who chose to enroll in online business courses.
These individuals may have different characteristics or motivations than participants that did not enroll or
participants of non-business course offerings. Hence, one line of future work can seek to examine the
generalizability of our findings in other settings, to understand the extent to which social similarity affect
learning and course persistence on other types of online courses.
Overall, our study demonstrates that despite the potential value of demographic diversity on
learning and knowledge acquisition, these same features of online courses can have unintended, but
detrimental consequences for course persistence, stemming from people’s preferences to associate with
similar others. Rather, we suggest that designing online courses to maintain “thresholds” on similar-aged
peers may be more effective in promoting course engagement and persistence.
7. References
Angrist JD, Pischke JS (2008) Mostly harmless econometrics: An empiricist’s companion (Princeton university press).
Aragon SR (2003) Creating social presence in online environments. New directions for adult and continuing education 2003(100):57–68.
Aral S, Walker D (2011) Creating social contagion through viral product design: A randomized trial of peer influence in networks. Management science 57(9):1623–1639.
Argote L, Miron-Spektor E (2011) Organizational learning: From experience to knowledge. Organization science 22(5):1123–1137.
Baek J, Shore J (2020) Forum size and content contribution per person: a field experiment. Management Science.
Bapna R, Goes P, Gupta A (2003) Analysis and design of business-to-consumer online auctions. Management Science 49(1):85–101.
Bapna R, Ramaprasad J, Shmueli G, Umyarov A (2016) One-way mirrors in online dating: A randomized field experiment. Management Science 62(11):3100–3122.
Bapna R, Umyarov A (2015) Do your online friends make you pay? A randomized field experiment on peer influence in online social networks. Management Science 61(8):1902–1920.
Bettinger E, Fox L, Loeb S, Taylor E (2015) Changing distributions: How online college classes alter student and professor performance. American Economic Review.
Bettinger E, Liu J, Loeb S (2016) Connections matter: How interactive peers affect students in online college courses. Journal of Policy Analysis and Management 35(4):932–954.
Bettinger EP, Loeb S, Taylor ES (2014) Remote but influential: Peer effects and reflection in online higher education classrooms.
Bettinger EP, Long BT (2005) Do faculty serve as role models? The impact of instructor gender on female students. American Economic Review 95(2):152–157.
29
Bianchi EC (2013) The bright side of bad times: The affective advantages of entering the workforce in a recession. Administrative Science Quarterly 58(4):587–623.
Bidwell M, Briscoe F (2010) The dynamics of interorganizational careers. Organization Science 21(5):1034–1053.
Billington PJ, Fronmueller MP (2013) MOOCs and the future of higher education. Journal of Higher Education Theory and Practice 13(3/4):36–43.
Blau P (1964) Power and exchange in social life (New York: J Wiley & Sons). Breslow L, Pritchard DE, DeBoer J, Stump GS, Ho AD, Seaton DT (2013) Studying learning in the
worldwide classroom research into edX’s first MOOC. Research & Practice in Assessment 8:13–25.
Burt RS (2004) Structural holes and good ideas. American journal of sociology 110(2):349–399. Burtch G, Ghose A, Wattal S (2013) An empirical examination of the antecedents and consequences of
contribution patterns in crowd-funded markets. Information Systems Research 24(3):499–519. Burtch G, Ghose A, Wattal S (2014) Cultural differences and geography as determinants of online
prosocial lending. Mis Quarterly 38(3):773–794. Burtch G, Hong Y, Bapna R, Griskevicius V (2018) Stimulating online reviews by combining financial
incentives and social norms. Management Science 64(5):2065–2082. Byrne DE (1971) The attraction paradigm (Academic Press). Byrne J (2019) Average Age & Work Experience At Top MBA Programs. (November 27)
https://poetsandquants.com/2019/11/27/average-age-work-experience-at-top-mba-programs/. Cappelli PH (2015) Skill gaps, skill shortages, and skill mismatches: Evidence and arguments for the
United States. ILR review 68(2):251–290. Carrell SE, Fullerton RL, West JE (2009) Does your cohort matter? Measuring peer effects in college
achievement. Journal of Labor Economics 27(3):439–464. Christakis NA, Fowler JH (2009) Connected: The surprising power of our social networks and how they
shape our lives (Little, Brown Spark). Cramton CD (2001) The mutual knowledge problem and its consequences for dispersed collaboration.
Organization science 12(3):346–371. Cummings JN (2004) Work groups, structural diversity, and knowledge sharing in a global organization.
Management science 50(3):352–364. Dahlander L, McFarland DA (2013) Ties that last: Tie formation and persistence in research
collaborations over time. Administrative science quarterly 58(1):69–110. DeBoer J, Stump GS, Seaton D, Breslow L (2013) Diversity in MOOC students’ backgrounds and
behaviors in relationship to performance in 6.002 x. Proceedings of the sixth learning international networks consortium conference. 16–19.
Deming DJ, Goldin C, Katz LF, Yuchtman N (2015) Can online learning bend the higher education cost curve? American Economic Review 105(5):496–501.
Deming DJ, Noray KL (2018) Stem careers and the changing skill requirements of work (National Bureau of Economic Research).
Dorn E, Panier F, Probst N, Sarakatsannis J (2020) Back to school: A framework for remote and hybrid learning amid COVID-19. (August 31) https://www.mckinsey.com/industries/public-and-social-sector/our-insights/back-to-school-a-framework-for-remote-and-hybrid-learning-amid-covid-19#.
Dragoni L, Tesluk PE, Russell JE, Oh IS (2009) Understanding managerial development: Integrating developmental assignments, learning orientation, and access to developmental opportunities in predicting managerial competencies. Academy of Management Journal 52(4):731–743.
Edmondson A (1999) Psychological safety and learning behavior in work teams. Administrative science quarterly 44(2):350–383.
Eesley CE, Wu L (2019) For Startups, Adaptability and Mentor Network Diversity can be Pivotal: Evidence from a Randomized Experiment on a MOOC Platform. MIS Quarterly, Forthcoming.
Faraj S, Johnson SL (2011) Network exchange patterns in online communities. Organization science 22(6):1464–1480.
30
Faraj S, von Krogh G, Monteiro E, Lakhani KR (2016) Special section introduction—Online community as space for knowledge flows. Information systems research 27(4):668–684.
Fiol CM (1994) Consensus, diversity, and learning in organizations. Organization science 5(3):403–420. Fischer CS (1982) To dwell among friends: Personal networks in town and city (University of chicago
Press). Flory JA, Leibbrandt A, Rott C, Stoddard O (2019) Increasing Workplace Diversity: Evidence from a
Recruiting Experiment at a Fortune 500 Company. Journal of Human Resources:0518-9489R1. Forman C, Ghose A, Wiesenfeld B (2008) Examining the relationship between reviews and sales: The
role of reviewer identity disclosure in electronic markets. Information systems research 19(3):291–313.
Gaviria A, Raphael S (2001) School-based peer effects and juvenile behavior. Review of Economics and Statistics 83(2):257–268.
Gibson CB, Gibbs JL (2006) Unpacking the concept of virtuality: The effects of geographic dispersion, electronic dependence, dynamic structure, and national diversity on team innovation. Administrative science quarterly 51(3):451–495.
Gong J, Liu T, Tang J (2018) Incentive design on MOOC: a field experiment (National University of Singapore working paper).
Grushka-Cockayne Y, Lakhani KR (2019) 2U: Higher Education Rewired. Guegan J, Segonds F, Barré J, Maranzana N, Mantelet F, Buisine S (2017) Social identity cues to
improve creativity and identification in face-to-face and virtual groups. Computers in Human behavior 77:140–147.
Gulati R (1995) Does familiarity breed trust? The implications of repeated ties for contractual choice in alliances. Academy of management journal 38(1):85–112.
Harrison DA, Klein KJ (2007) What’s the difference? Diversity constructs as separation, variety, or disparity in organizations. Academy of management review 32(4):1199–1228.
Hasan S, Bagde S (2013) The mechanics of social capital and academic performance in an Indian college. American Sociological Review 78(6):1009–1032.
Hogg MA, Terry DJ, White KM (1995) A tale of two theories: A critical comparison of identity theory with social identity theory. Social psychology quarterly:255–269.
Hoxby C (2000) Peer effects in the classroom: Learning from gender and race variation (National Bureau of Economic Research).
Huang N, Hong Y, Burtch G (2017) Social network integration and user content generation: Evidence from natural experiments. MIS Quarterly 41(4):17–001.
Ibarra H (1993) Network centrality, power, and innovation involvement: Determinants of technical and administrative roles. Academy of Management journal 36(3):471–501.
Illanes P, Lund S, Mourshed M, Rutherford S, Tyreman M (2018) Retraining and reskilling workers in the age of automation. McKinsey Global Institute. Available at https://www. mckinsey. com/featured-insights/future-of-work/retraining-and-reskilling-workers-in-theage-of-automation, accessed 29.
Ingram P, Morris MW (2007) Do people mix at mixers? Structure, homophily, and the “life of the party.” Administrative Science Quarterly 52(4):558–585.
Jackson CK, Bruegmann E (2009) Teaching students and teaching each other: The importance of peer learning for teachers. American Economic Journal: Applied Economics 1(4):85–108.
Kanfer R, Ackerman PL (2004) Aging, adult development, and work motivation. Academy of management review 29(3):440–458.
Kanter RM (1977) Some effects of proportions on group life. The gender gap in psychotherapy. (Springer), 53–78.
Kear K, Chetwynd F, Jefferis H (2014) Social presence in online learning communities: The role of personal profiles. Research in Learning Technology 22.
Kilduff M, Angelmar R, Mehra A (2000) Top management-team diversity and firm performance: Examining the role of cognitions. Organization science 11(1):21–34.
31
Kleinbaum AM, Stuart TE, Tushman ML (2013) Discretion within constraint: Homophily and structure in a formal organization. Organization Science 24(5):1316–1336.
Kossinets G, Watts DJ (2009) Origins of homophily in an evolving social network. American journal of sociology 115(2):405–450.
Lado AA, Wilson MC (1994) Human resource systems and sustained competitive advantage: A competency-based perspective. Academy of management review 19(4):699–727.
Lavy V, Schlosser A (2011) Mechanisms and impacts of gender peer effects at school. American Economic Journal: Applied Economics 3(2):1–33.
Lazarsfeld PF, Merton RK (1954) Friendship as a social process: A substantive and methodological analysis. Freedom and control in modern society 18(1):18–66.
Leonardi PM, Huysman M, Steinfield C (2013) Enterprise social media: Definition, history, and prospects for the study of social technologies in organizations. Journal of Computer-Mediated Communication 19(1):1–19.
Li C, Lalani F (2020) The COVID-19 pandemic has changed education forever. This is how. World Economic Forum (April 29).
Littlejohn A, Hood N, Milligan C, Mustain P (2016) Learning in MOOCs: Motivations and self-regulated learning in MOOCs. The Internet and Higher Education 29:40–48.
Mackness J, Mak S, Williams R (2010) The ideals and reality of participating in a MOOC. Proceedings of the 7th international conference on networked learning 2010. (University of Lancaster), 266–275.
Majchrzak A, Jarvenpaa SL, Hollingshead AB (2007) Coordinating expertise among emergent groups responding to disasters. Organization science 18(1):147–161.
Marsden PV (1987) Core discussion networks of Americans. American sociological review:122–131. Marx DM, Roman JS (2002) Female role models: Protecting women’s math test performance. Personality
and Social Psychology Bulletin 28(9):1183–1193. McPherson M, Smith-Lovin L, Cook JM (2001) Birds of a feather: Homophily in social networks. Annual
review of sociology 27(1):415–444. Milligan C, Littlejohn A, Margaryan A (2013) Patterns of engagement in connectivist MOOCs. Journal
of Online Learning and Teaching 9(2):149–159. Nawrot I, Doucet A (2014) Building engagement for MOOC students: introducing support for time
management on online learning platforms. Proceedings of the 23rd International Conference on world wide web. 1077–1082.
North MS, Fiske ST (2015) Intergenerational resource tensions in the workplace and beyond: Individual, interpersonal, institutional, international. Research in Organizational Behavior 35:159–179.
Pappano L (2012) The Year of the MOOC. The New York Times 2(12):2012. Pogson CE, Cober AB, Doverspike D, Rogers JR (2003) Differences in self-reported work ethic across
three career stages. Journal of Vocational Behavior 62(1):189–201. Postmes T, Spears R, Lea M (2002) Intergroup differentiation in computer-mediated communication:
Effects of depersonalization. Group Dynamics: Theory, Research, and Practice 6(1):3. Preece J (2000) Online communities: Designing usability, supporting sociability. Ransbotham S, Kane GC (2011) Membership turnover and collaboration success in online communities:
Explaining rises and falls from grace in Wikipedia. Mis Quarterly:613–627. Reagans R (2011) Close encounters: Analyzing how social similarity and propinquity contribute to strong
network connections. Organization Science 22(4):835–849. Reagans R, McEvily B (2003) Network structure and knowledge transfer: The effects of cohesion and
range. Administrative science quarterly 48(2):240–267. Ren Y, Kraut R, Kiesler S (2007) Applying common identity and bond theory to design of online
communities. Organization studies 28(3):377–408. Rovai AP, Jordan H (2004) Blended learning and sense of community: A comparative analysis with
traditional and fully online graduate courses. The International Review of Research in Open and Distributed Learning 5(2).
32
Sassenberg K, Postmes T (2002) Cognitive and strategic processes in small groups: Effects of anonymity of the self and anonymity of the group on social influence. British Journal of Social Psychology 41(3):463–480.
Shah SK (2006) Motivation, governance, and the viability of hybrid forms in open source software development. Management science 52(7):1000–1014.
Smith JA, McPherson M, Smith-Lovin L (2014) Social distance in the United States: Sex, race, religion, age, and education homophily among confidants, 1985 to 2004. American Sociological Review 79(3):432–456.
Steffens K (2015) Competences, learning theories and MOOC s: Recent developments in lifelong learning. European Journal of Education 50(1):41–59.
Stevens M, Rees T, Steffens NK, Haslam SA, Coffee P, Polman R (2019) Leaders’ creation of shared identity impacts group members’ effort and performance: Evidence from an exercise task. PloS one 14(7):e0218984.
Taparia H (2020) The Future of College Is Online, and It’s Cheaper. (May 25) https://www.nytimes.com/2020/05/25/opinion/online-college-coronavirus.html.
Tsui AS, Egan TD, O’Reilly III CA (1992) Being different: Relational demography and organizational attachment. Administrative science quarterly:549–579.
Verbrugge LM (1977) The structure of adult friendship choices. Social forces 56(2):576–597. Walther JB (2002) Time effects in computer-mediated groups: Past, present, and future. Distributed
work:235–257. Walton GM, Cohen GL (2011) A brief social-belonging intervention improves academic and health
outcomes of minority students. Science 331(6023):1447–1451. Wang C, Zhang X, Hann IH (2018) Socially nudged: A quasi-experimental study of friends’ social
influence in online product ratings. Information Systems Research 29(3):641–655. Wasko MM, Faraj S (2005) Why should I share? Examining social capital and knowledge contribution in
electronic networks of practice. MIS quarterly:35–57. Wiesenfeld BM, Raghuram S, Garud R (1999) Communication patterns as determinants of organizational
identification in a virtual organization. Organization science 10(6):777–790. Wu DJ, Kleindorfer PR (2005) Competitive options, supply contracting, and electronic markets.
Management Science 51(3):452–466. Zammuto RF, Griffith TL, Majchrzak A, Dougherty DJ, Faraj S (2007) Information technology and the
changing fabric of organization. Organization science 18(5):749–762. Zhang DJ, Allon G, Van Mieghem JA (2017) Does social interaction improve learning outcomes?
Evidence from field experiments on massive open online courses. Manufacturing & Service Operations Management 19(3):347–367.
Zimmerman DJ (2003) Peer effects in academic outcomes: Evidence from a natural experiment. Review of Economics and statistics 85(1):9–23.
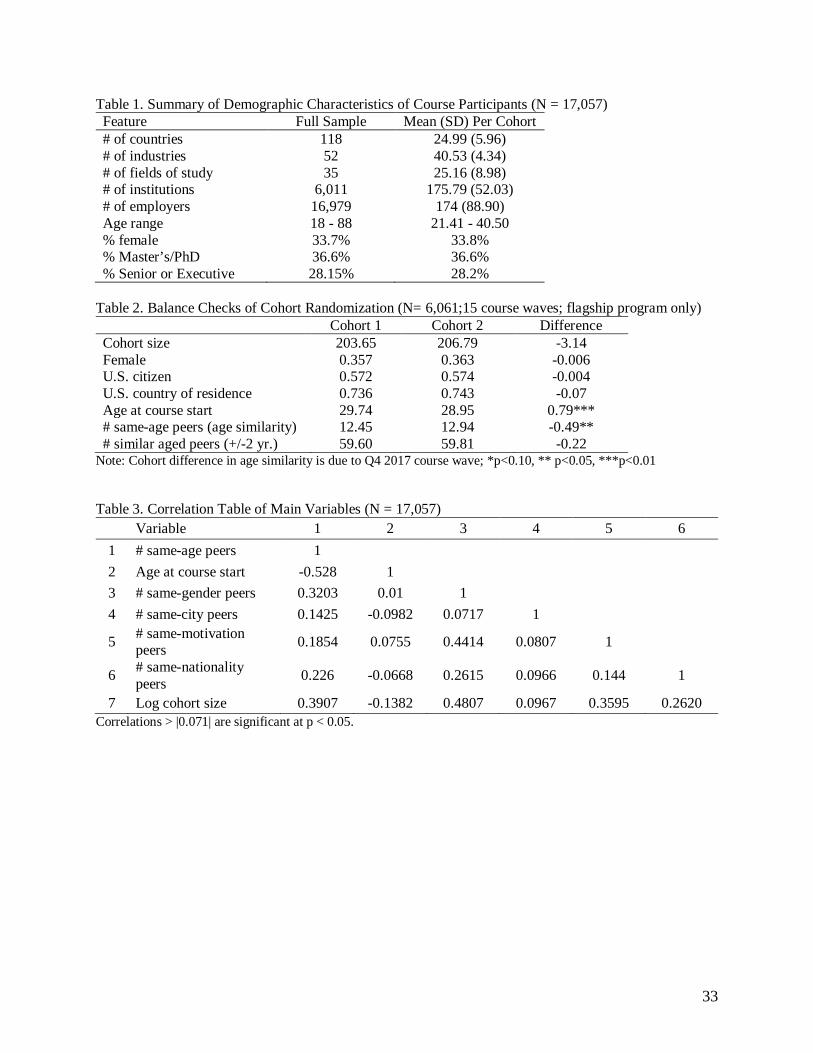
33
Table 1. Summary of Demographic Characteristics of Course Participants (N = 17,057) Feature Full Sample Mean (SD) Per Cohort # of countries 118 24.99 (5.96) # of industries 52 40.53 (4.34) # of fields of study 35 25.16 (8.98) # of institutions 6,011 175.79 (52.03) # of employers 16,979 174 (88.90) Age range 18 - 88 21.41 - 40.50 % female 33.7% 33.8% % Master’s/PhD 36.6% 36.6% % Senior or Executive 28.15% 28.2%
Table 2. Balance Checks of Cohort Randomization (N= 6,061;15 course waves; flagship program only) Cohort 1 Cohort 2 Difference Cohort size 203.65 206.79 -3.14 Female 0.357 0.363 -0.006 U.S. citizen 0.572 0.574 -0.004 U.S. country of residence 0.736 0.743 -0.07 Age at course start 29.74 28.95 0.79*** # same-age peers (age similarity) 12.45 12.94 -0.49** # similar aged peers (+/-2 yr.) 59.60 59.81 -0.22
Note: Cohort difference in age similarity is due to Q4 2017 course wave; *p<0.10, ** p<0.05, ***p<0.01 Table 3. Correlation Table of Main Variables (N = 17,057)
Variable 1 2 3 4 5 6 1 # same-age peers 1 2 Age at course start -0.528 1 3 # same-gender peers 0.3203 0.01 1 4 # same-city peers 0.1425 -0.0982 0.0717 1
5 # same-motivation peers 0.1854 0.0755 0.4414 0.0807 1
6 # same-nationality peers 0.226 -0.0668 0.2615 0.0966 0.144 1
7 Log cohort size 0.3907 -0.1382 0.4807 0.0967 0.3595 0.2620 Correlations > |0.071| are significant at p < 0.05.
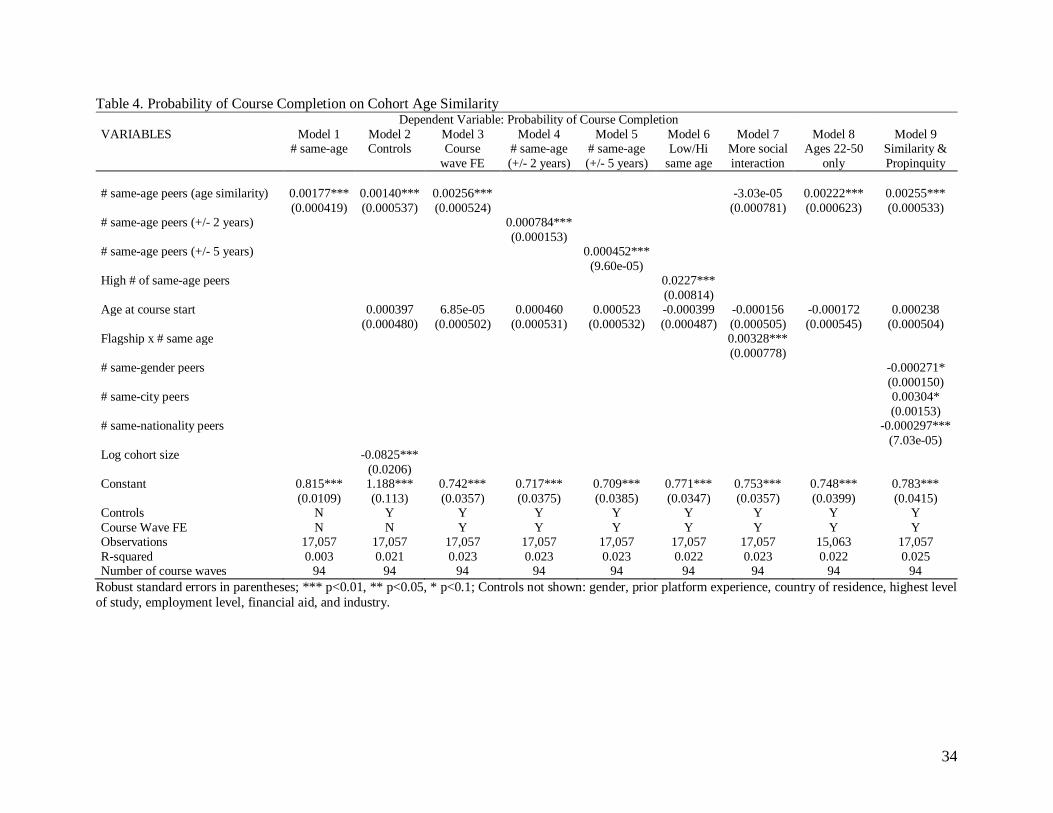
34
Table 4. Probability of Course Completion on Cohort Age Similarity Dependent Variable: Probability of Course Completion VARIABLES Model 1
# same-age Model 2 Controls
Model 3 Course
wave FE
Model 4 # same-age (+/- 2 years)
Model 5 # same-age (+/- 5 years)
Model 6 Low/Hi
same age
Model 7 More social interaction
Model 8 Ages 22-50
only
Model 9 Similarity & Propinquity
# same-age peers (age similarity) 0.00177*** 0.00140*** 0.00256*** -3.03e-05 0.00222*** 0.00255*** (0.000419) (0.000537) (0.000524) (0.000781) (0.000623) (0.000533) # same-age peers (+/- 2 years) 0.000784*** (0.000153) # same-age peers (+/- 5 years) 0.000452*** (9.60e-05) High # of same-age peers 0.0227*** (0.00814) Age at course start 0.000397 6.85e-05 0.000460 0.000523 -0.000399 -0.000156 -0.000172 0.000238 (0.000480) (0.000502) (0.000531) (0.000532) (0.000487) (0.000505) (0.000545) (0.000504) Flagship x # same age 0.00328*** (0.000778) # same-gender peers -0.000271* (0.000150) # same-city peers 0.00304* (0.00153) # same-nationality peers -0.000297*** (7.03e-05) Log cohort size -0.0825*** (0.0206) Constant 0.815*** 1.188*** 0.742*** 0.717*** 0.709*** 0.771*** 0.753*** 0.748*** 0.783*** (0.0109) (0.113) (0.0357) (0.0375) (0.0385) (0.0347) (0.0357) (0.0399) (0.0415) Controls N Y Y Y Y Y Y Y Y Course Wave FE N N Y Y Y Y Y Y Y Observations 17,057 17,057 17,057 17,057 17,057 17,057 17,057 15,063 17,057 R-squared 0.003 0.021 0.023 0.023 0.023 0.022 0.023 0.022 0.025 Number of course waves 94 94 94 94 94 94 94 94 94
Robust standard errors in parentheses; *** p<0.01, ** p<0.05, * p<0.1; Controls not shown: gender, prior platform experience, country of residence, highest level of study, employment level, financial aid, and industry.
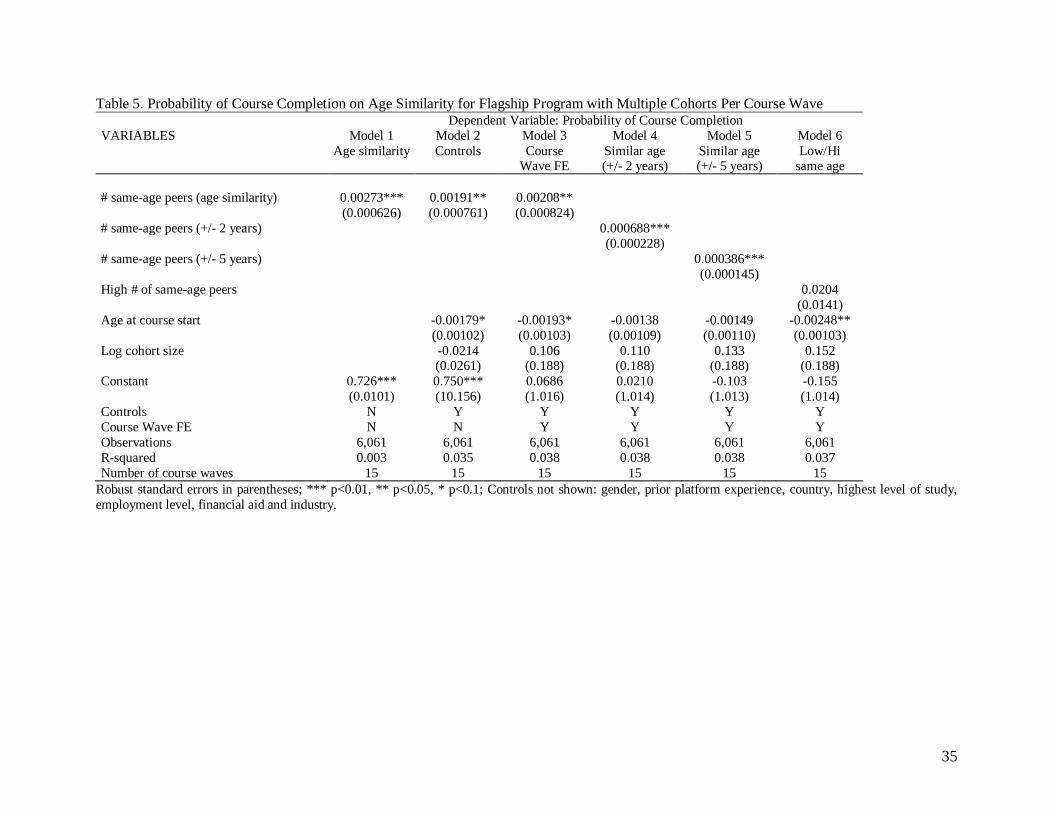
35
Table 5. Probability of Course Completion on Age Similarity for Flagship Program with Multiple Cohorts Per Course Wave Dependent Variable: Probability of Course Completion VARIABLES Model 1
Age similarity Model 2 Controls
Model 3 Course
Wave FE
Model 4 Similar age (+/- 2 years)
Model 5 Similar age (+/- 5 years)
Model 6 Low/Hi
same age # same-age peers (age similarity) 0.00273*** 0.00191** 0.00208** (0.000626) (0.000761) (0.000824) # same-age peers (+/- 2 years) 0.000688*** (0.000228) # same-age peers (+/- 5 years) 0.000386*** (0.000145) High # of same-age peers 0.0204 (0.0141) Age at course start -0.00179* -0.00193* -0.00138 -0.00149 -0.00248** (0.00102) (0.00103) (0.00109) (0.00110) (0.00103) Log cohort size -0.0214 0.106 0.110 0.133 0.152 (0.0261) (0.188) (0.188) (0.188) (0.188) Constant 0.726*** 0.750*** 0.0686 0.0210 -0.103 -0.155 (0.0101) (10.156) (1.016) (1.014) (1.013) (1.014) Controls N Y Y Y Y Y Course Wave FE N N Y Y Y Y Observations 6,061 6,061 6,061 6,061 6,061 6,061 R-squared 0.003 0.035 0.038 0.038 0.038 0.037 Number of course waves 15 15 15 15 15 15
Robust standard errors in parentheses; *** p<0.01, ** p<0.05, * p<0.1; Controls not shown: gender, prior platform experience, country, highest level of study, employment level, financial aid and industry.
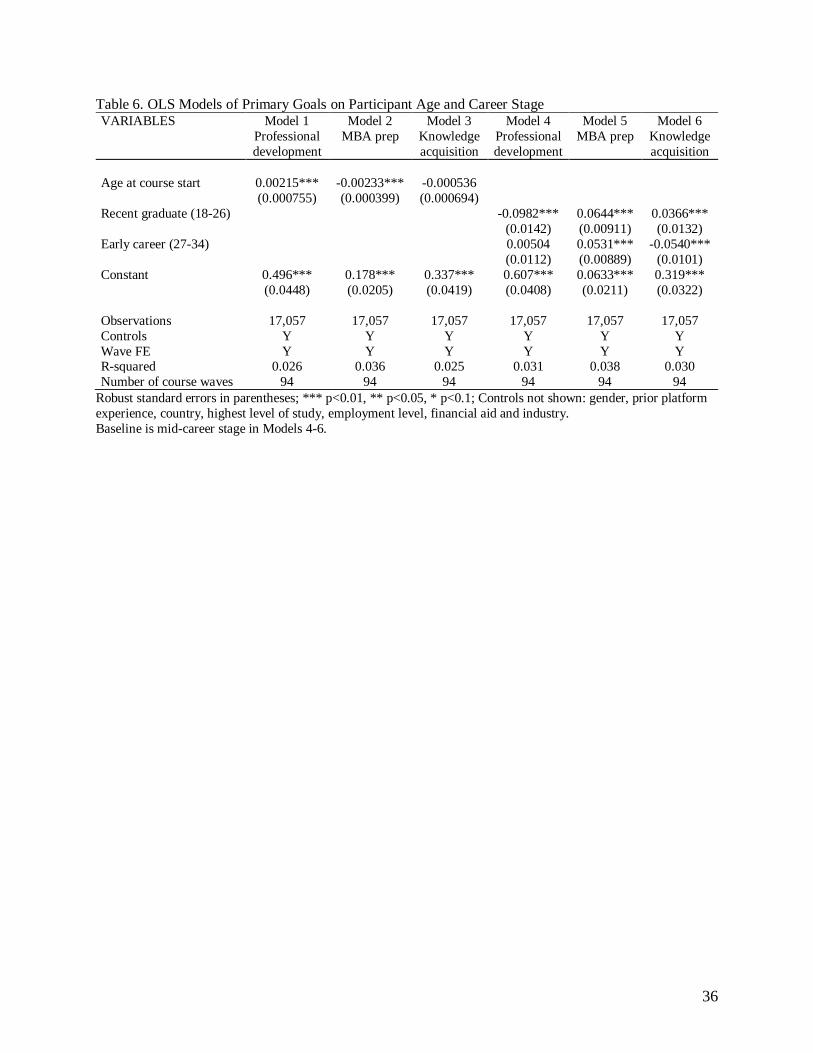
36
Table 6. OLS Models of Primary Goals on Participant Age and Career Stage VARIABLES Model 1
Professional development
Model 2 MBA prep
Model 3 Knowledge acquisition
Model 4 Professional development
Model 5 MBA prep
Model 6 Knowledge acquisition
Age at course start 0.00215*** -0.00233*** -0.000536 (0.000755) (0.000399) (0.000694) Recent graduate (18-26) -0.0982*** 0.0644*** 0.0366*** (0.0142) (0.00911) (0.0132) Early career (27-34) 0.00504 0.0531*** -0.0540*** (0.0112) (0.00889) (0.0101) Constant 0.496*** 0.178*** 0.337*** 0.607*** 0.0633*** 0.319*** (0.0448) (0.0205) (0.0419) (0.0408) (0.0211) (0.0322) Observations 17,057 17,057 17,057 17,057 17,057 17,057 Controls Y Y Y Y Y Y Wave FE Y Y Y Y Y Y R-squared 0.026 0.036 0.025 0.031 0.038 0.030 Number of course waves 94 94 94 94 94 94
Robust standard errors in parentheses; *** p<0.01, ** p<0.05, * p<0.1; Controls not shown: gender, prior platform experience, country, highest level of study, employment level, financial aid and industry. Baseline is mid-career stage in Models 4-6.
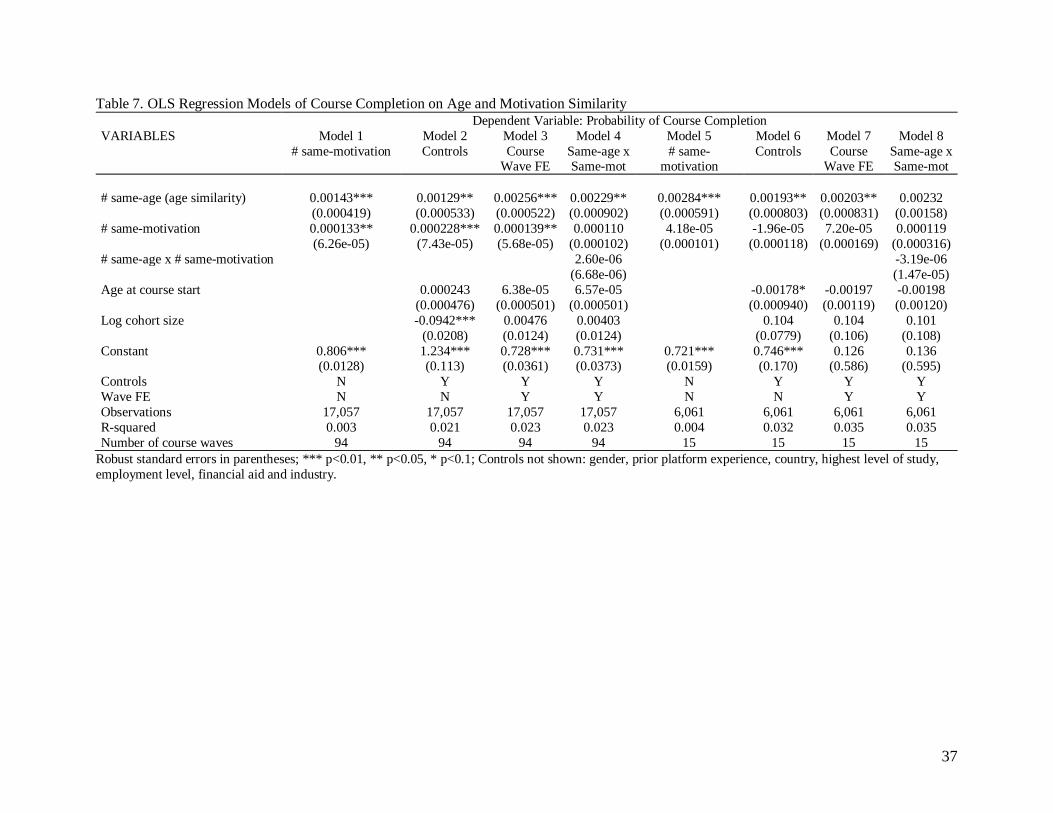
37
Table 7. OLS Regression Models of Course Completion on Age and Motivation Similarity Dependent Variable: Probability of Course Completion VARIABLES Model 1
# same-motivation Model 2 Controls
Model 3 Course
Wave FE
Model 4 Same-age x Same-mot
Model 5 # same-
motivation
Model 6 Controls
Model 7 Course
Wave FE
Model 8 Same-age x Same-mot
# same-age (age similarity) 0.00143*** 0.00129** 0.00256*** 0.00229** 0.00284*** 0.00193** 0.00203** 0.00232 (0.000419) (0.000533) (0.000522) (0.000902) (0.000591) (0.000803) (0.000831) (0.00158) # same-motivation 0.000133** 0.000228*** 0.000139** 0.000110 4.18e-05 -1.96e-05 7.20e-05 0.000119 (6.26e-05) (7.43e-05) (5.68e-05) (0.000102) (0.000101) (0.000118) (0.000169) (0.000316) # same-age x # same-motivation 2.60e-06 -3.19e-06 (6.68e-06) (1.47e-05) Age at course start 0.000243 6.38e-05 6.57e-05 -0.00178* -0.00197 -0.00198 (0.000476) (0.000501) (0.000501) (0.000940) (0.00119) (0.00120) Log cohort size -0.0942*** 0.00476 0.00403 0.104 0.104 0.101 (0.0208) (0.0124) (0.0124) (0.0779) (0.106) (0.108) Constant 0.806*** 1.234*** 0.728*** 0.731*** 0.721*** 0.746*** 0.126 0.136 (0.0128) (0.113) (0.0361) (0.0373) (0.0159) (0.170) (0.586) (0.595) Controls N Y Y Y N Y Y Y Wave FE N N Y Y N N Y Y Observations 17,057 17,057 17,057 17,057 6,061 6,061 6,061 6,061 R-squared 0.003 0.021 0.023 0.023 0.004 0.032 0.035 0.035 Number of course waves 94 94 94 94 15 15 15 15
Robust standard errors in parentheses; *** p<0.01, ** p<0.05, * p<0.1; Controls not shown: gender, prior platform experience, country, highest level of study, employment level, financial aid and industry.
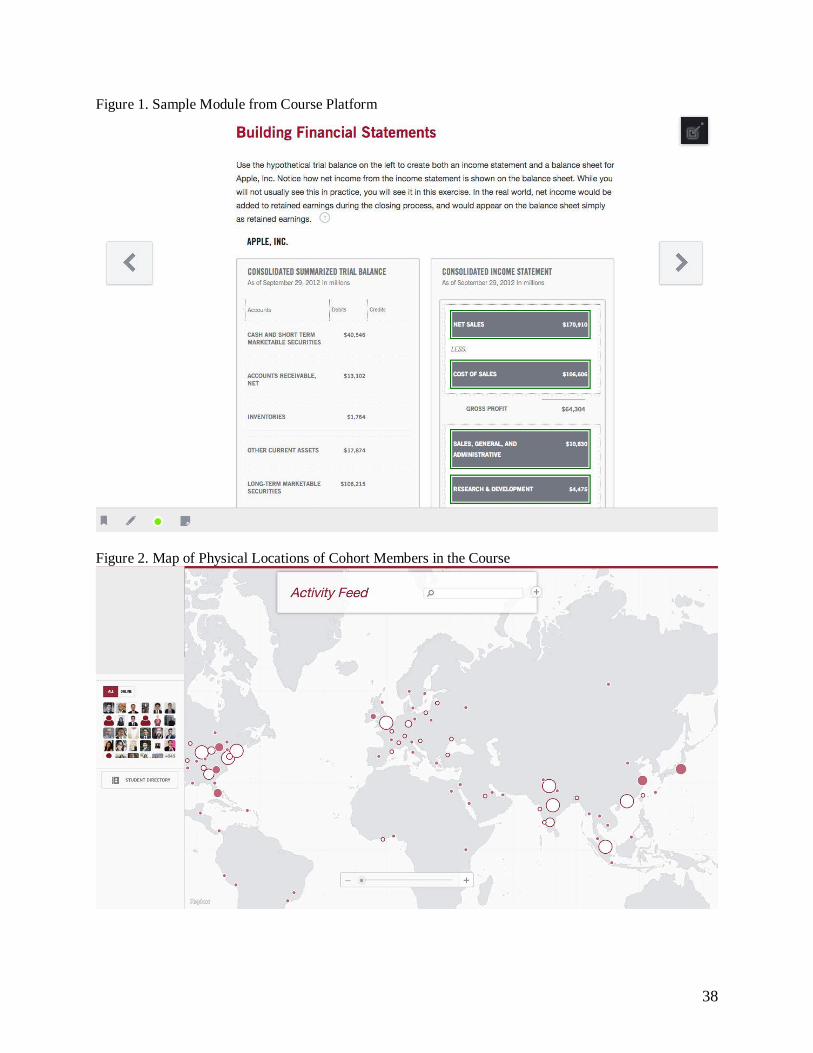
38
Figure 1. Sample Module from Course Platform
Figure 2. Map of Physical Locations of Cohort Members in the Course
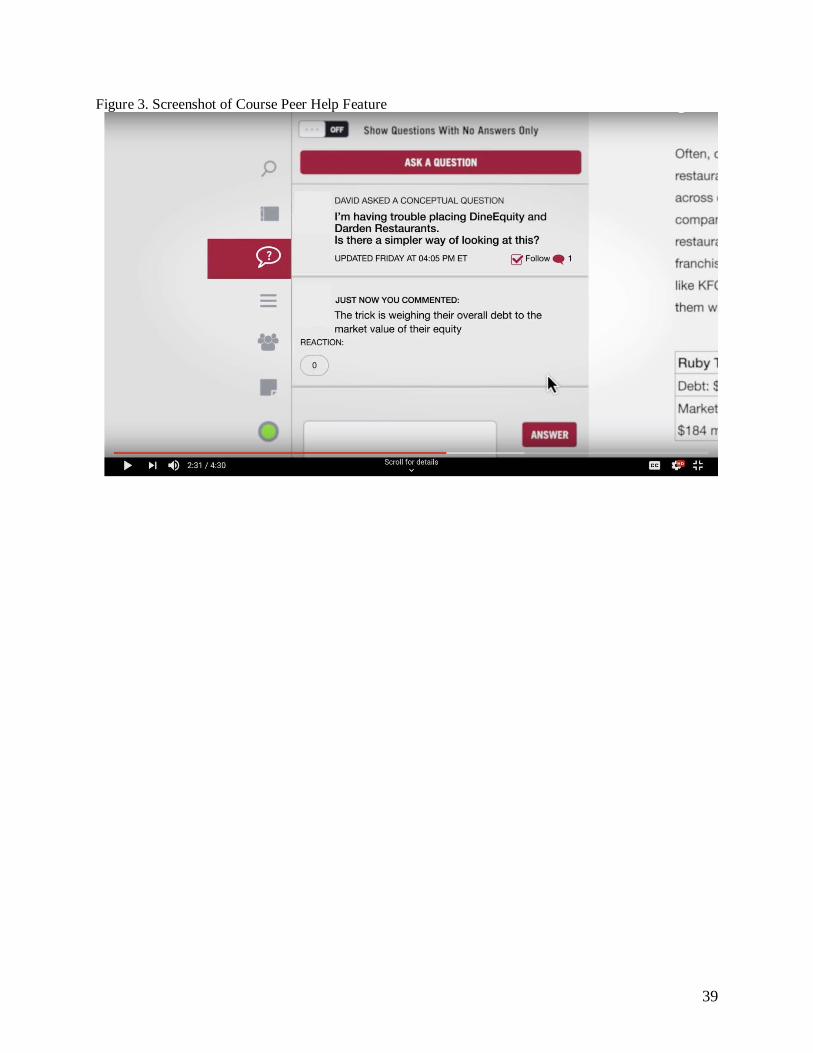
39
Figure 3. Screenshot of Course Peer Help Feature
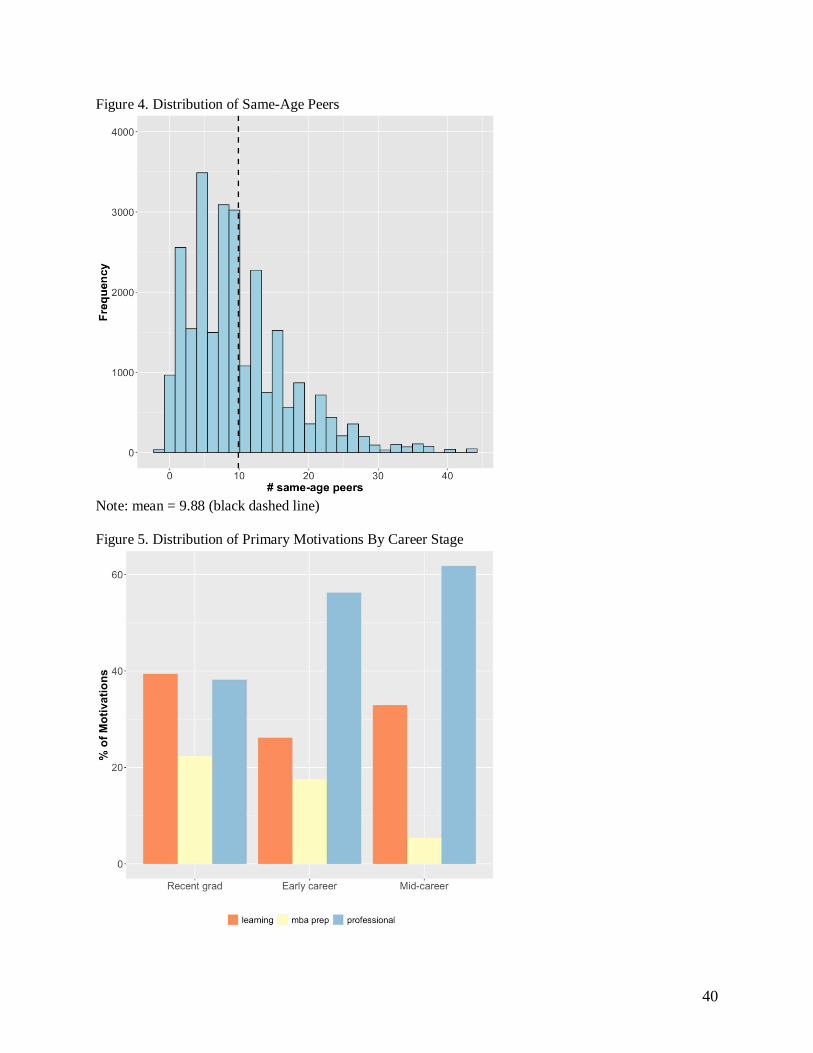
40
Figure 4. Distribution of Same-Age Peers
Note: mean = 9.88 (black dashed line) Figure 5. Distribution of Primary Motivations By Career Stage
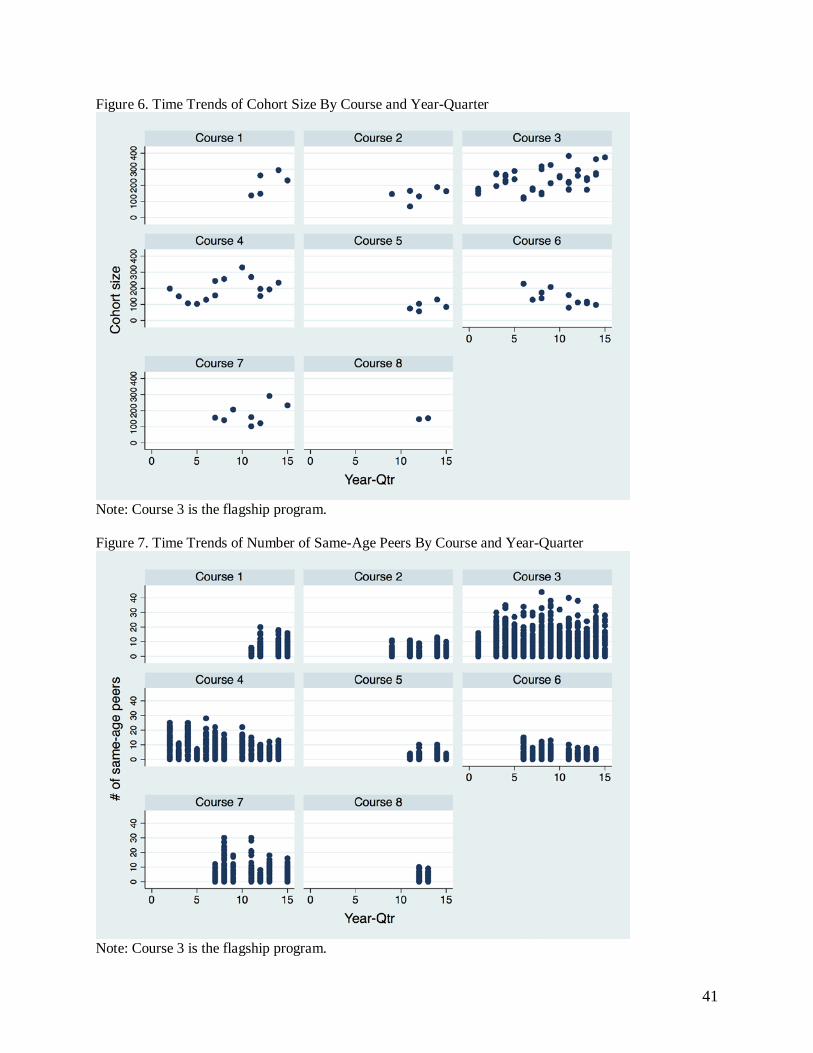
41
Figure 6. Time Trends of Cohort Size By Course and Year-Quarter
Note: Course 3 is the flagship program. Figure 7. Time Trends of Number of Same-Age Peers By Course and Year-Quarter
Note: Course 3 is the flagship program.
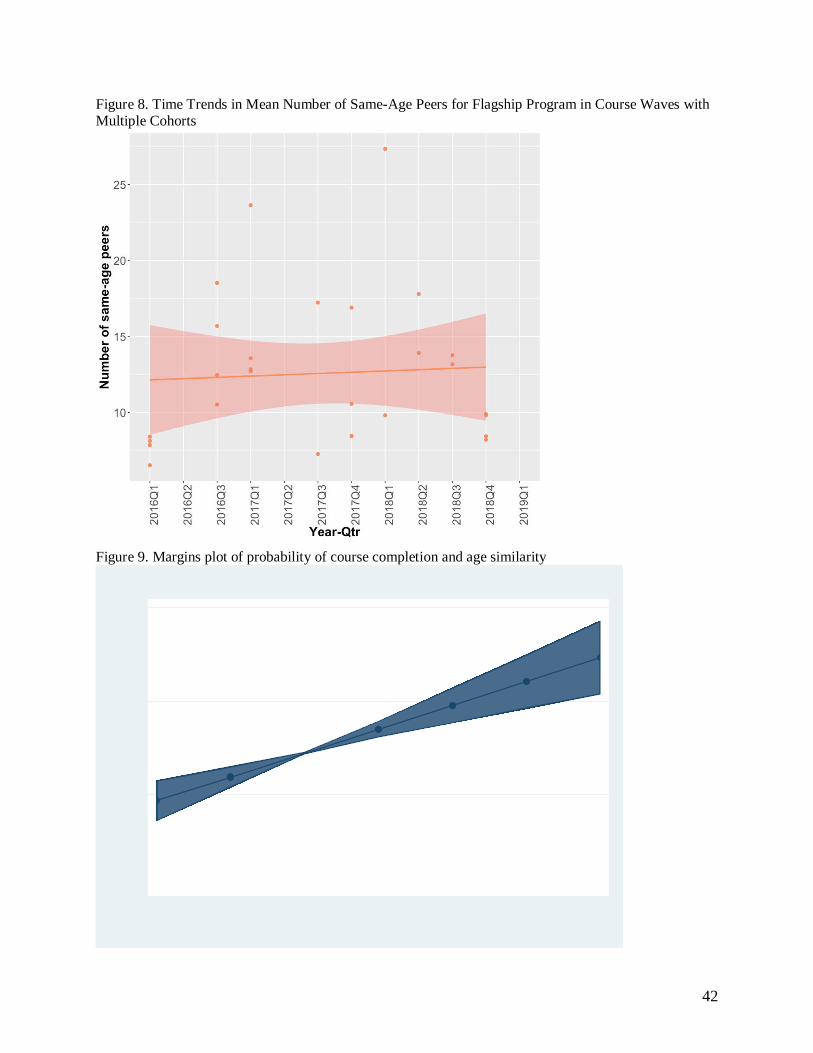
42
Figure 8. Time Trends in Mean Number of Same-Age Peers for Flagship Program in Course Waves with Multiple Cohorts
Figure 9. Margins plot of probability of course completion and age similarity