Embed Size (px)
Citation preview
LEAVING CERTIFICATE EXAMINATION
2000
APPLIED MATHEMATICS
HIGHER AND ORDINARY LEVELS
CHIEF EXAMINER'S REPORT
HIGHER LEVEL
1. INTRODUCTION
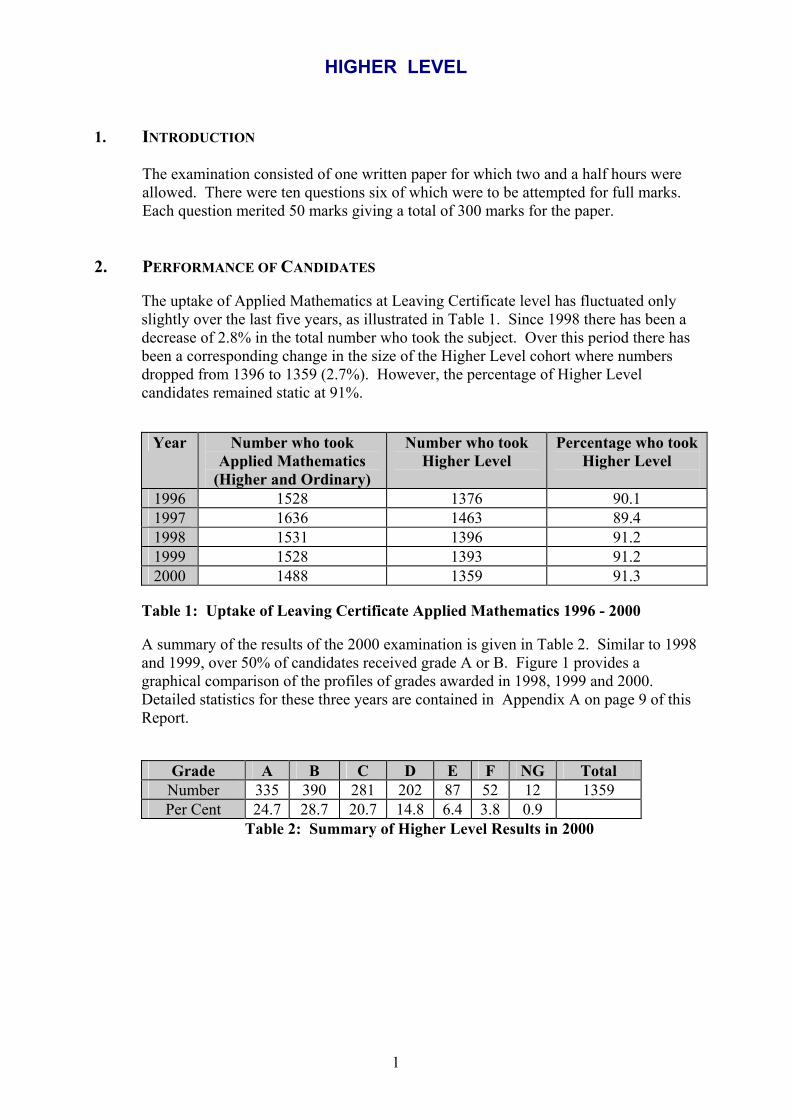
The examination consisted of one written paper for which two and a half hours were allowed. There were ten questions six of which were to be attempted for full marks. Each question merited 50 marks giving a total of 300 marks for the paper.
2. PERFORMANCE OF CANDIDATES
The uptake of Applied Mathematics at Leaving Certificate level has fluctuated only slightly over the last five years, as illustrated in Table 1. Since 1998 there has been a decrease of 2.8% in the total number who took the subject. Over this period there has been a corresponding change in the size of the Higher Level cohort where numbers dropped from 1396 to 1359 (2.7%). However, the percentage of Higher Level candidates remained static at 91%.
Year Number who took
Applied Mathematics (Higher and Ordinary)
Number who took Higher Level
Percentage who took Higher Level
1996 1528 1376 90.1 1997 1636 1463 89.4 1998 1531 1396 91.2 1999 1528 1393 91.2 2000 1488 1359 91.3
Table 1: Uptake of Leaving Certificate Applied Mathematics 1996 - 2000
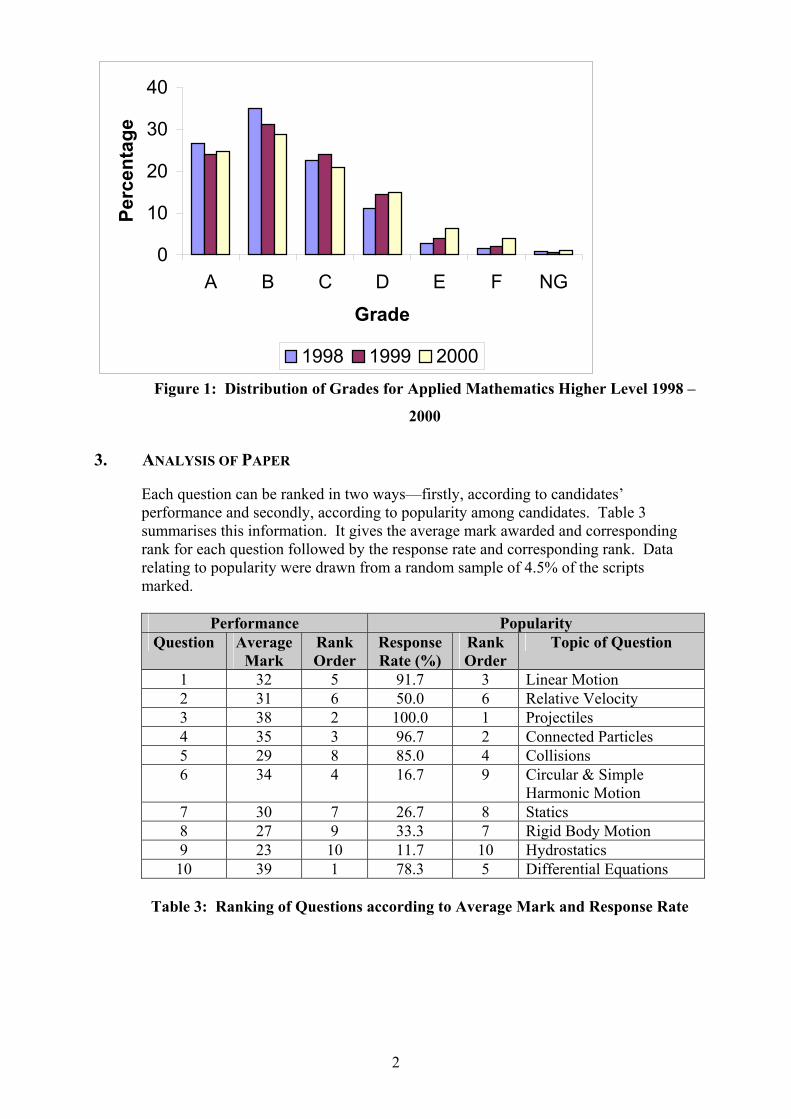
A summary of the results of the 2000 examination is given in Table 2. Similar to 1998 and 1999, over 50% of candidates received grade A or B. Figure 1 provides a graphical comparison of the profiles of grades awarded in 1998, 1999 and 2000. Detailed statistics for these three years are contained in Appendix A on page 9 of this Report.
Grade A B C D E F NG Total Number 335 390 281 202 87 52 12 1359 Per Cent 24.7 28.7 20.7 14.8 6.4 3.8 0.9
Table 2: Summary of Higher Level Results in 2000
1
0
10
20
30
40
A B C D E F NGGrade
Perc
enta
ge
1998 1999 2000
Figure 1: Distribution of Grades for Applied Mathematics Higher Level 1998 –
2000 3. ANALYSIS OF PAPER
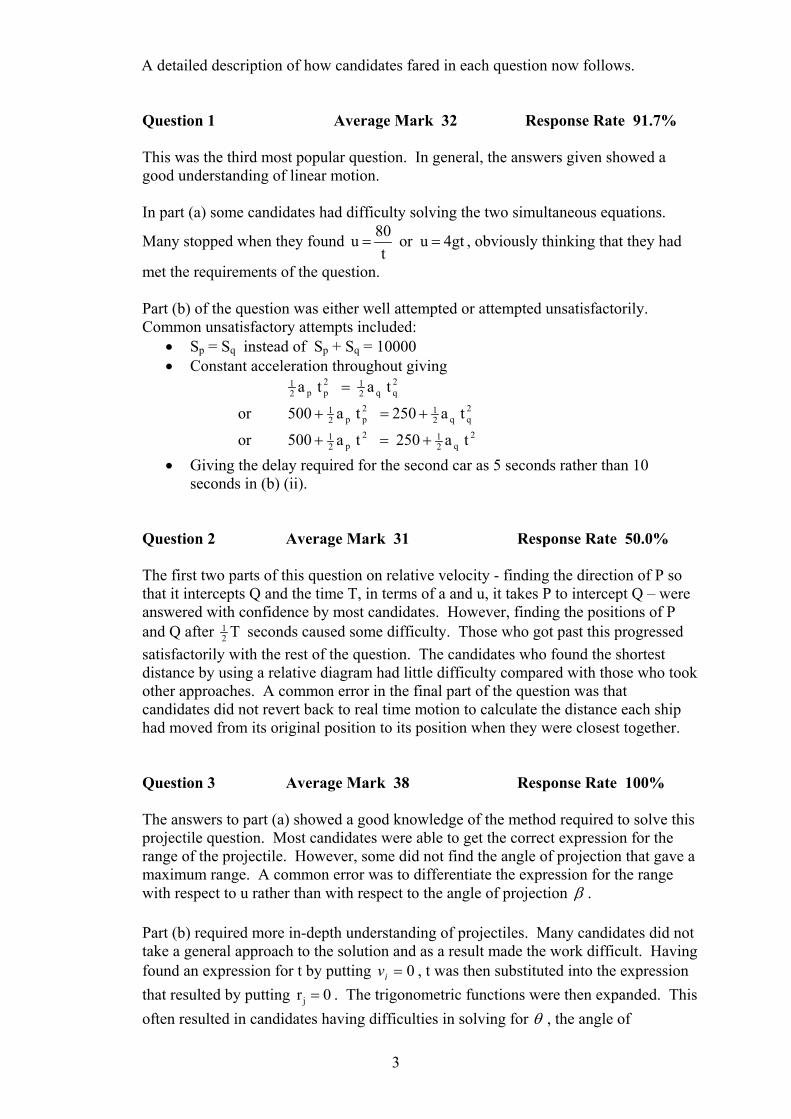
Each question can be ranked in two ways—firstly, according to candidates’ performance and secondly, according to popularity among candidates. Table 3 summarises this information. It gives the average mark awarded and corresponding rank for each question followed by the response rate and corresponding rank. Data relating to popularity were drawn from a random sample of 4.5% of the scripts marked.
Performance Popularity Question Average
Mark Rank Order
Response Rate (%)
Rank Order
Topic of Question
1 32 5 91.7 3 Linear Motion 2 31 6 50.0 6 Relative Velocity 3 38 2 100.0 1 Projectiles 4 35 3 96.7 2 Connected Particles 5 29 8 85.0 4 Collisions 6 34 4 16.7 9 Circular & Simple
Harmonic Motion 7 30 7 26.7 8 Statics 8 27 9 33.3 7 Rigid Body Motion 9 23 10 11.7 10 Hydrostatics 10 39 1 78.3 5 Differential Equations
Table 3: Ranking of Questions according to Average Mark and Response Rate
2
A detailed description of how candidates fared in each question now follows.
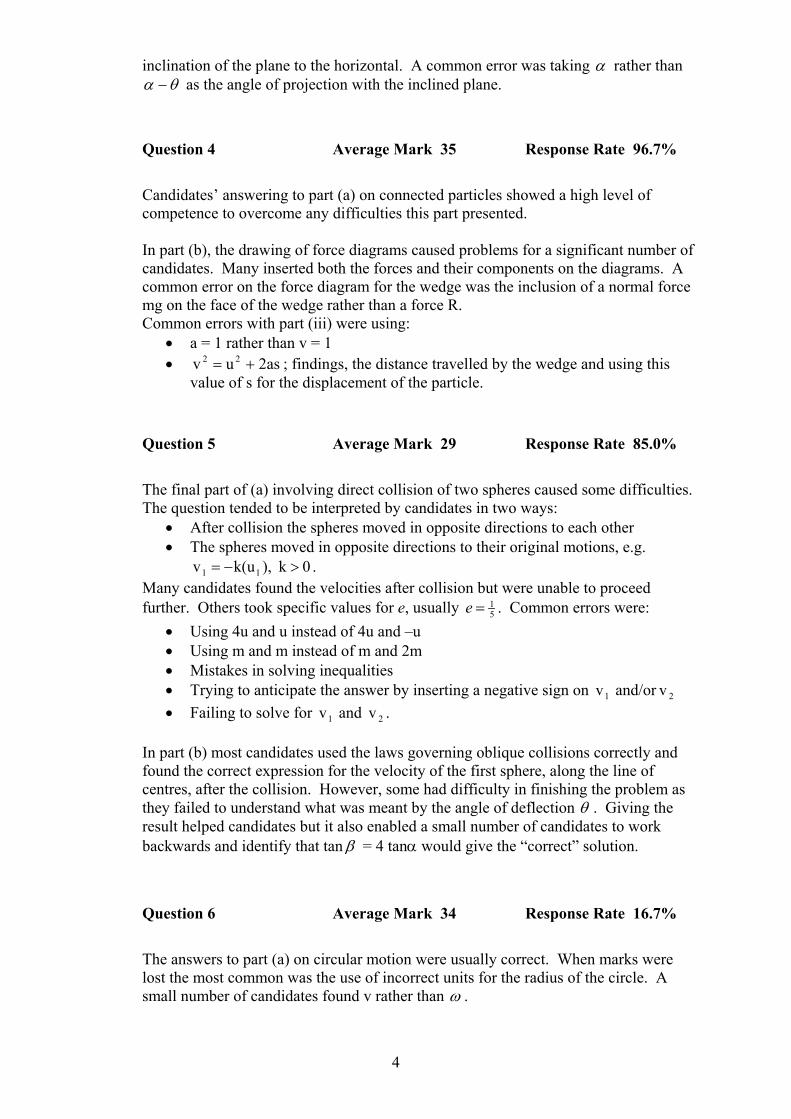
Question 1 Average Mark 32 Response Rate 91.7% This was the third most popular question. In general, the answers given showed a good understanding of linear motion. In part (a) some candidates had difficulty solving the two simultaneous equations.
Many stopped when they found 4gt uor t
80 u == , obviously thinking that they had
met the requirements of the question. Part (b) of the question was either well attempted or attempted unsatisfactorily. Common unsatisfactory attempts included:
• Sp = Sq instead of Sp + Sq = 10000 • Constant acceleration throughout giving
2qq2
12pp2
1 ta ta =
or 2qq2
12pp2
1 ta 250 ta +=+500
or 2q2
12p2
1 ta250 ta +=+500 • Giving the delay required for the second car as 5 seconds rather than 10
seconds in (b) (ii). Question 2 Average Mark 31 Response Rate 50.0%
The first two parts of this question on relative velocity - finding the direction of P so that it intercepts Q and the time T, in terms of a and u, it takes P to intercept Q – were answered with confidence by most candidates. However, finding the positions of P and Q after T2
1 seconds caused some difficulty. Those who got past this progressed satisfactorily with the rest of the question. The candidates who found the shortest distance by using a relative diagram had little difficulty compared with those who took other approaches. A common error in the final part of the question was that candidates did not revert back to real time motion to calculate the distance each ship had moved from its original position to its position when they were closest together.
Question 3 Average Mark 38 Response Rate 100% The answers to part (a) showed a good knowledge of the method required to solve this projectile question. Most candidates were able to get the correct expression for the range of the projectile. However, some did not find the angle of projection that gave a maximum range. A common error was to differentiate the expression for the range with respect to u rather than with respect to the angle of projection β . Part (b) required more in-depth understanding of projectiles. Many candidates did not take a general approach to the solution and as a result made the work difficult. Having found an expression for t by putting 0=iv , t was then substituted into the expression that resulted by putting . The trigonometric functions were then expanded. This often resulted in candidates having difficulties in solving for
0rj =θ , the angle of
3
inclination of the plane to the horizontal. A common error was taking α rather than θα − as the angle of projection with the inclined plane.
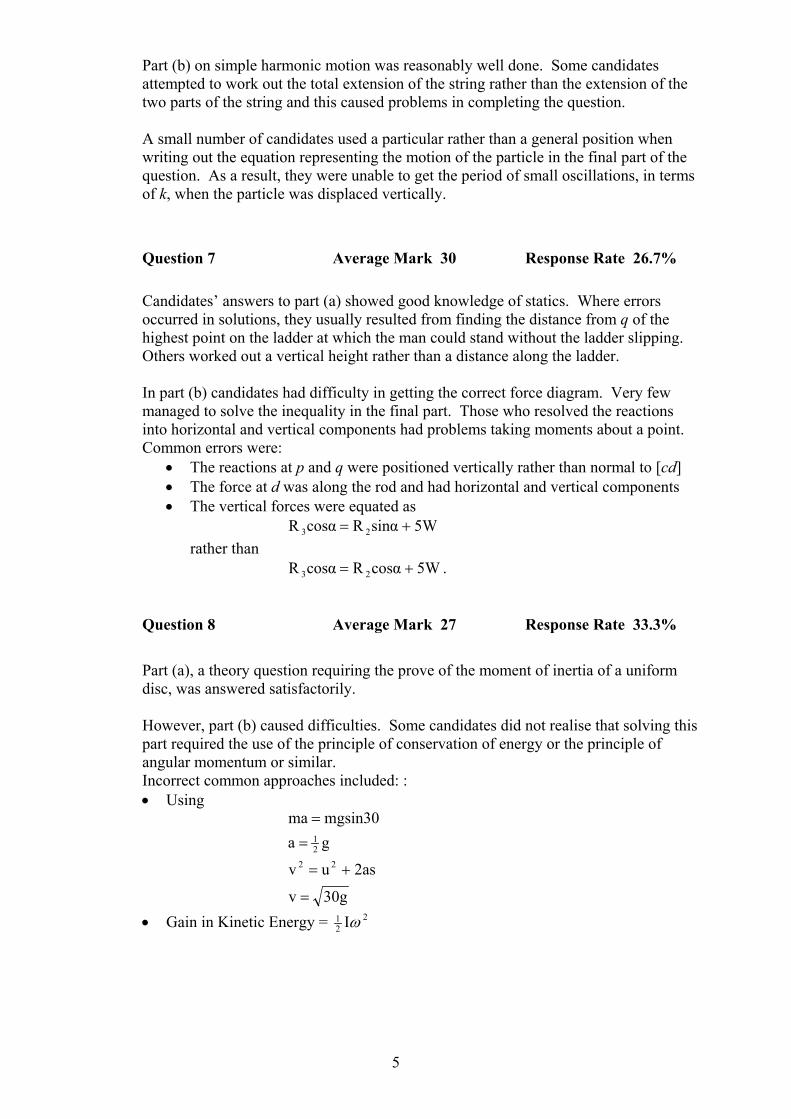
Question 4 Average Mark 35 Response Rate 96.7%
Candidates’ answering to part (a) on connected particles showed a high level of competence to overcome any difficulties this part presented. In part (b), the drawing of force diagrams caused problems for a significant number of candidates. Many inserted both the forces and their components on the diagrams. A common error on the force diagram for the wedge was the inclusion of a normal force mg on the face of the wedge rather than a force R. Common errors with part (iii) were using:
• a = 1 rather than v = 1 • ; findings, the distance travelled by the wedge and using this
value of s for the displacement of the particle. 2asuv 22 +=
Question 5 Average Mark 29 Response Rate 85.0%
The final part of (a) involving direct collision of two spheres caused some difficulties. The question tended to be interpreted by candidates in two ways:
• After collision the spheres moved in opposite directions to each other • The spheres moved in opposite directions to their original motions, e.g.
. 0k ),k(uv 11 >−=Many candidates found the velocities after collision but were unable to proceed further. Others took specific values for e, usually 5
1=e . Common errors were: • Using 4u and u instead of 4u and –u • Using m and m instead of m and 2m • Mistakes in solving inequalities • Trying to anticipate the answer by inserting a negative sign on and/or 1v 2v• Failing to solve for and . 1v 2v
In part (b) most candidates used the laws governing oblique collisions correctly and found the correct expression for the velocity of the first sphere, along the line of centres, after the collision. However, some had difficulty in finishing the problem as they failed to understand what was meant by the angle of deflection θ . Giving the result helped candidates but it also enabled a small number of candidates to work backwards and identify that tan β = 4 tanα would give the “correct” solution.
Question 6 Average Mark 34 Response Rate 16.7%
The answers to part (a) on circular motion were usually correct. When marks were lost the most common was the use of incorrect units for the radius of the circle. A small number of candidates found v rather than ω .
4
Part (b) on simple harmonic motion was reasonably well done. Some candidates attempted to work out the total extension of the string rather than the extension of the two parts of the string and this caused problems in completing the question. A small number of candidates used a particular rather than a general position when writing out the equation representing the motion of the particle in the final part of the question. As a result, they were unable to get the period of small oscillations, in terms of k, when the particle was displaced vertically.
Question 7 Average Mark 30 Response Rate 26.7%
Candidates’ answers to part (a) showed good knowledge of statics. Where errors occurred in solutions, they usually resulted from finding the distance from q of the highest point on the ladder at which the man could stand without the ladder slipping. Others worked out a vertical height rather than a distance along the ladder. In part (b) candidates had difficulty in getting the correct force diagram. Very few managed to solve the inequality in the final part. Those who resolved the reactions into horizontal and vertical components had problems taking moments about a point. Common errors were:
• The reactions at p and q were positioned vertically rather than normal to [cd] • The force at d was along the rod and had horizontal and vertical components • The vertical forces were equated as
5WsinαRcosαR 23 += rather than 5cosαRcosαR 23 W+= .
Question 8 Average Mark 27 Response Rate 33.3%
Part (a), a theory question requiring the prove of the moment of inertia of a uniform disc, was answered satisfactorily. However, part (b) caused difficulties. Some candidates did not realise that solving this part required the use of the principle of conservation of energy or the principle of angular momentum or similar. Incorrect common approaches included: : • Using
30gv
2asuv
gamgsin30ma
2221
=
+=
=
=
• Gain in Kinetic Energy = 221 Iω
5
Question 9 Average Mark 23 Response Rate 11.7%
Hydrostatics was the least popular question. This is consistent with other years. However, the answers to part (a) on the cylinder showed good understanding of basic hydrostatics concepts. Part (b) was poorly attempted. Many candidates found the correct force equation for the block, an expression for the buoyancy force, an incorrect force equation for the bucket and its contents and were then unable to finish the question. Some of those who found
Mgmg
2mg s−
= ,
or similar, were not able to proceed to proving the inequality s > 2.
Question 10 Average Mark 39 Response Rate 78.3%
This differential equation question ranked the best in terms of performance by candidates. Part (a) was generally well answered. Common errors were:
• Not giving the answer to two decimal places • Numerical slips when finding the value of the constant of integration • Separating the expression as
xdx
y1dy
=+
• Numerical slips in solving the quadratic equation.
In part (b) the integration of 6v
e−
caused problems. This was often integrated as
1
6
e or ln1
6-v
6
+
+−
ve
v
Incorrect integration in part (i) sometimes led to “division by zero” errors in part (ii). Most candidates approached part (iii) algebraically. However, some did attempt a numerical solution. In general, candidates tended to encounter difficulties when integration was involved.
4. OVERALL GENERAL COMMENT
Overall, candidates’ answering was satisfactory. In general, candidates showed a good level of ability to extract from the text of the given problems the mathematical equations necessary to lead to successful solutions.
Where the answering was such that the final grade awarded was lower than D there seemed to be two main causes. Firstly, candidates had not attempted the required number of questions. Secondly, their answers did not demonstrate an understanding of what was required.
In general, the drawing of force diagrams posed difficulties. It should be noted that, when force diagrams are asked for, the component parts of forces are not required.
6
It was also observed that when moments about a point were required in order to progress towards a solution, candidates experienced difficulties.
5. RECOMMENDATIONS FOR TEACHERS AND STUDENTS
(i) Students should read questions thoroughly and repeatedly in order to extract the equations necessary to solve the problems posed.
(ii) Practising problems regularly is an essential part of preparation for this
examination.
Complete coverage of the syllabus is strongly recommended in order to ensure that the grade achieved reflects the ability of the student.
7
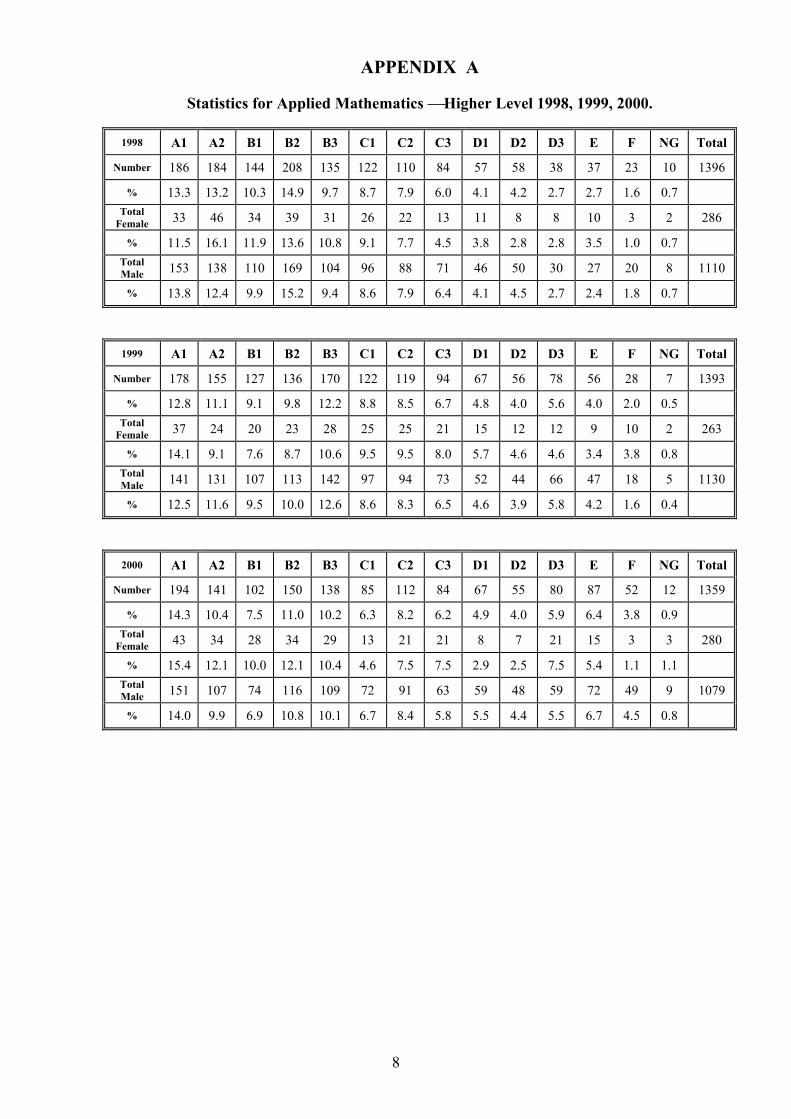
APPENDIX A
Statistics for Applied Mathematics Higher Level 1998, 1999, 2000.
1998 A1 A2 B1 B2 B3 C1 C2 C3 D1 D2 D3 E F NG Total
Number 186 184 144 208 135 122 110 84 57 58 38 37 23 10 1396
% 13.3 13.2 10.3 14.9 9.7 8.7 7.9 6.0 4.1 4.2 2.7 2.7 1.6 0.7 Total
Female 33 46 34 39 31 26 22 13 11 8 8 10 3 2 286
% 11.5 16.1 11.9 13.6 10.8 9.1 7.7 4.5 3.8 2.8 2.8 3.5 1.0 0.7 Total Male 153 138 110 169 104 96 88 71 46 50 30 27 20 8 1110
% 13.8 12.4 9.9 15.2 9.4 8.6 7.9 6.4 4.1 4.5 2.7 2.4 1.8 0.7
1999 A1 A2 B1 B2 B3 C1 C2 C3 D1 D2 D3 E F NG Total
Number 178 155 127 136 170 122 119 94 67 56 78 56 28 7 1393
% 12.8 11.1 9.1 9.8 12.2 8.8 8.5 6.7 4.8 4.0 5.6 4.0 2.0 0.5 Total
Female 37 24 20 23 28 25 25 21 15 12 12 9 10 2 263
% 14.1 9.1 7.6 8.7 10.6 9.5 9.5 8.0 5.7 4.6 4.6 3.4 3.8 0.8 Total Male 141 131 107 113 142 97 94 73 52 44 66 47 18 5 1130
% 12.5 11.6 9.5 10.0 12.6 8.6 8.3 6.5 4.6 3.9 5.8 4.2 1.6 0.4
2000 A1 A2 B1 B2 B3 C1 C2 C3 D1 D2 D3 E F NG Total
Number 194 141 102 150 138 85 112 84 67 55 80 87 52 12 1359
% 14.3 10.4 7.5 11.0 10.2 6.3 8.2 6.2 4.9 4.0 5.9 6.4 3.8 0.9 Total
Female 43 34 28 34 29 13 21 21 8 7 21 15 3 3 280
% 15.4 12.1 10.0 12.1 10.4 4.6 7.5 7.5 2.9 2.5 7.5 5.4 1.1 1.1 Total Male 151 107 74 116 109 72 91 63 59 48 59 72 49 9 1079
% 14.0 9.9 6.9 10.8 10.1 6.7 8.4 5.8 5.5 4.4 5.5 6.7 4.5 0.8
8
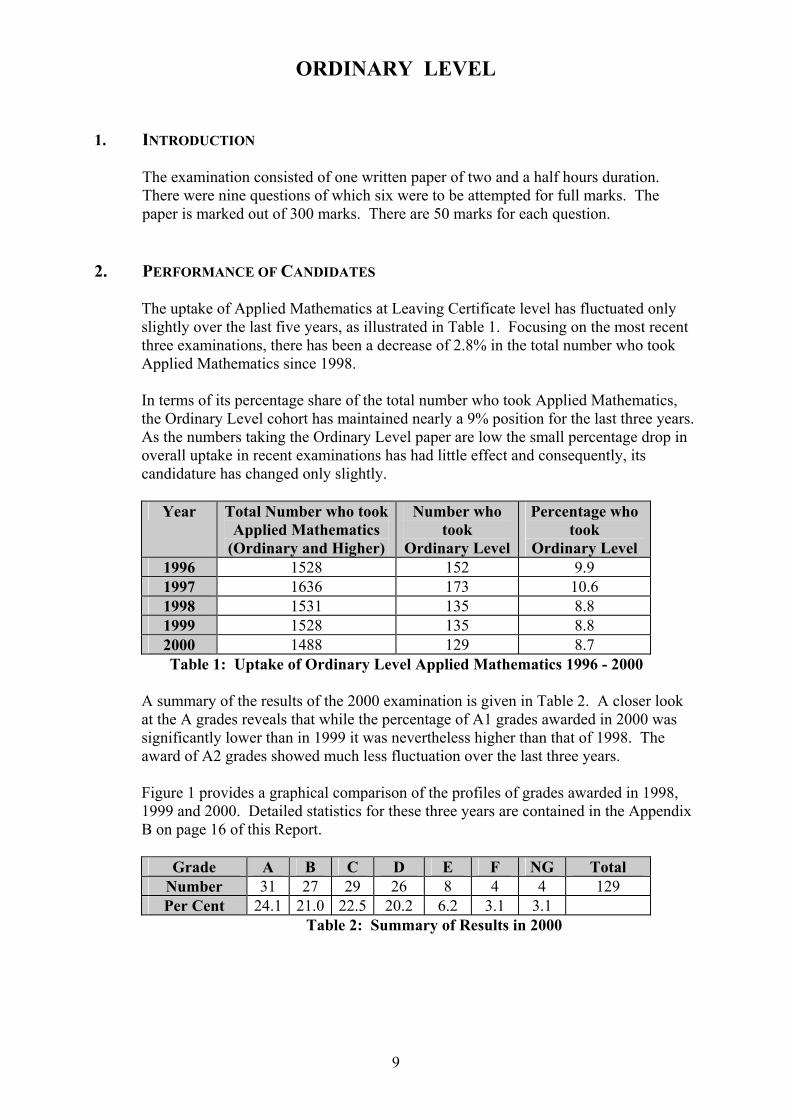
ORDINARY LEVEL
1. INTRODUCTION
The examination consisted of one written paper of two and a half hours duration. There were nine questions of which six were to be attempted for full marks. The paper is marked out of 300 marks. There are 50 marks for each question.
2. PERFORMANCE OF CANDIDATES
The uptake of Applied Mathematics at Leaving Certificate level has fluctuated only slightly over the last five years, as illustrated in Table 1. Focusing on the most recent three examinations, there has been a decrease of 2.8% in the total number who took Applied Mathematics since 1998.
In terms of its percentage share of the total number who took Applied Mathematics, the Ordinary Level cohort has maintained nearly a 9% position for the last three years. As the numbers taking the Ordinary Level paper are low the small percentage drop in overall uptake in recent examinations has had little effect and consequently, its candidature has changed only slightly.
Year Total Number who took
Applied Mathematics (Ordinary and Higher)
Number who took
Ordinary Level
Percentage who took
Ordinary Level 1996 1528 152 9.9 1997 1636 173 10.6 1998 1531 135 8.8 1999 1528 135 8.8 2000 1488 129 8.7 Table 1: Uptake of Ordinary Level Applied Mathematics 1996 - 2000
A summary of the results of the 2000 examination is given in Table 2. A closer look at the A grades reveals that while the percentage of A1 grades awarded in 2000 was significantly lower than in 1999 it was nevertheless higher than that of 1998. The award of A2 grades showed much less fluctuation over the last three years.
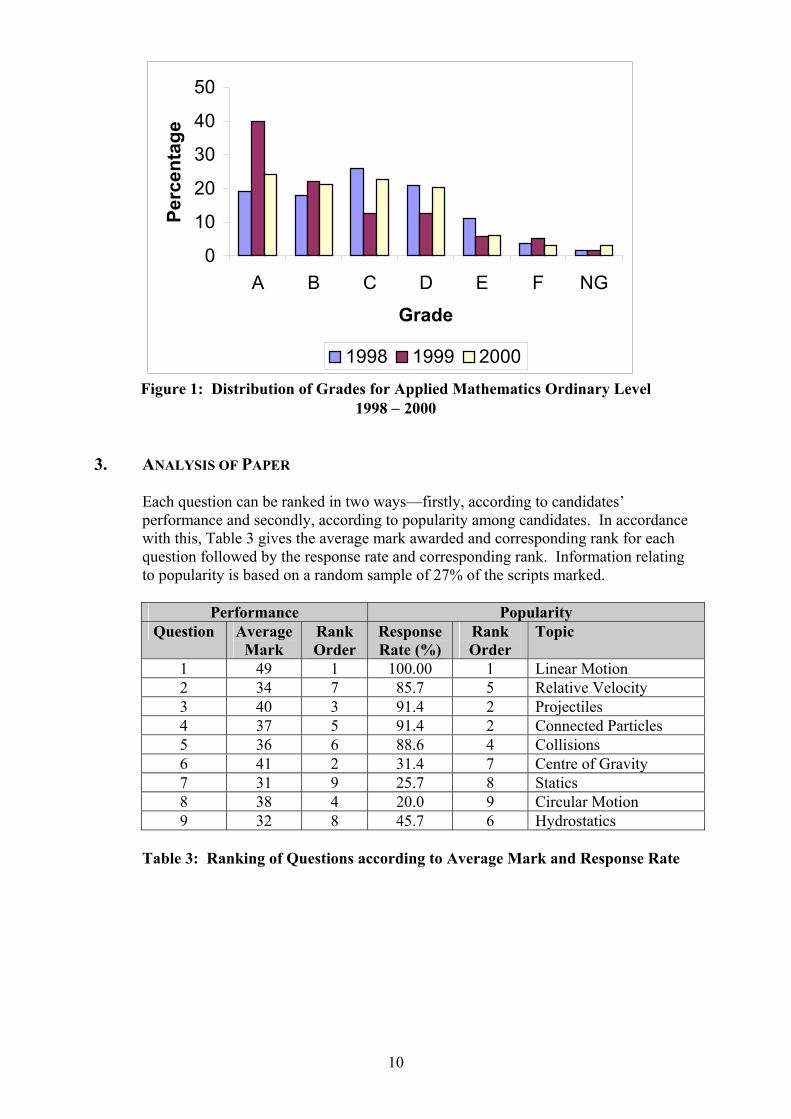
Figure 1 provides a graphical comparison of the profiles of grades awarded in 1998, 1999 and 2000. Detailed statistics for these three years are contained in the Appendix B on page 16 of this Report.
Grade A B C D E F NG Total
Number 31 27 29 26 8 4 4 129 Per Cent 24.1 21.0 22.5 20.2 6.2 3.1 3.1
Table 2: Summary of Results in 2000
9
0
10
20
30
40
50
A B C D E F NG
Grade
Perc
enta
ge
1998 1999 2000
Figure 1: Distribution of Grades for Applied Mathematics Ordinary Level 1998 − 2000
3. ANALYSIS OF PAPER
Each question can be ranked in two ways—firstly, according to candidates’ performance and secondly, according to popularity among candidates. In accordance with this, Table 3 gives the average mark awarded and corresponding rank for each question followed by the response rate and corresponding rank. Information relating to popularity is based on a random sample of 27% of the scripts marked.
Performance Popularity Question Average
Mark Rank Order
Response Rate (%)
Rank Order
Topic
1 49 1 100.00 1 Linear Motion 2 34 7 85.7 5 Relative Velocity 3 40 3 91.4 2 Projectiles 4 37 5 91.4 2 Connected Particles 5 36 6 88.6 4 Collisions 6 41 2 31.4 7 Centre of Gravity 7 31 9 25.7 8 Statics 8 38 4 20.0 9 Circular Motion 9 32 8 45.7 6 Hydrostatics
Table 3: Ranking of Questions according to Average Mark and Response Rate
10
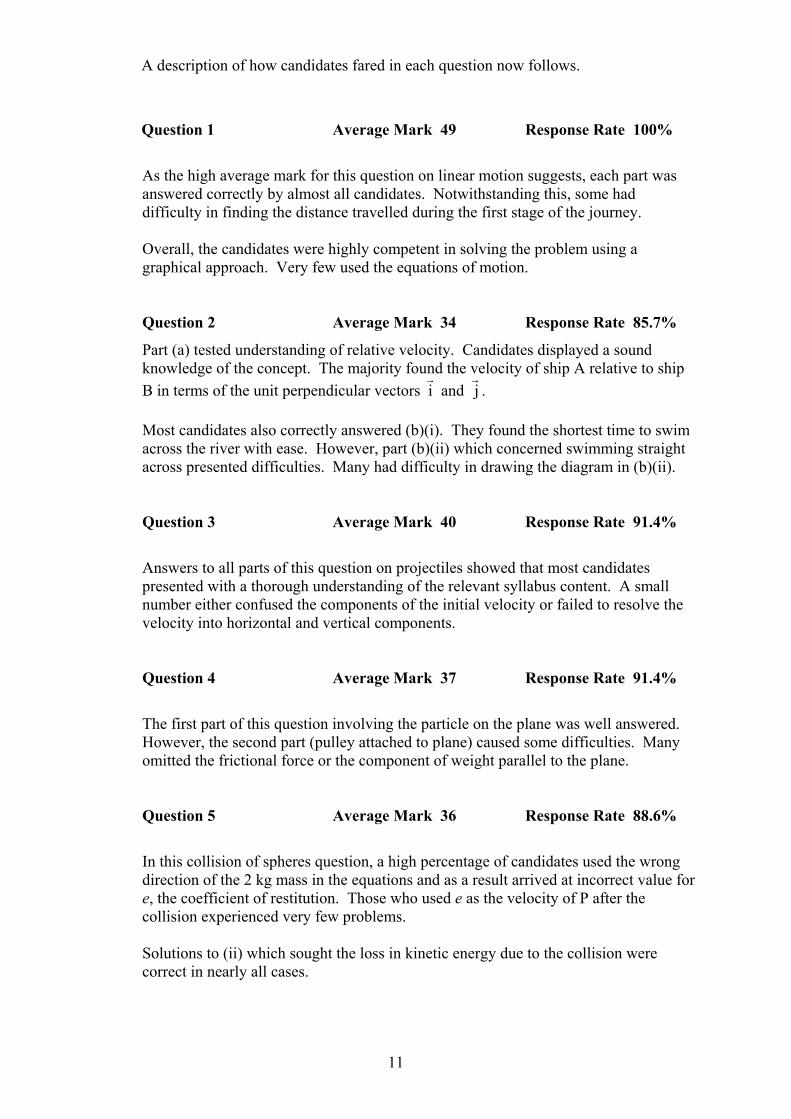
A description of how candidates fared in each question now follows.
Question 1 Average Mark 49 Response Rate 100%
As the high average mark for this question on linear motion suggests, each part was answered correctly by almost all candidates. Notwithstanding this, some had difficulty in finding the distance travelled during the first stage of the journey. Overall, the candidates were highly competent in solving the problem using a graphical approach. Very few used the equations of motion.
Question 2 Average Mark 34 Response Rate 85.7%
Part (a) tested understanding of relative velocity. Candidates displayed a sound knowledge of the concept. The majority found the velocity of ship A relative to ship B in terms of the unit perpendicular vectors j and i
rr.
Most candidates also correctly answered (b)(i). They found the shortest time to swim across the river with ease. However, part (b)(ii) which concerned swimming straight across presented difficulties. Many had difficulty in drawing the diagram in (b)(ii). Question 3 Average Mark 40 Response Rate 91.4%
Answers to all parts of this question on projectiles showed that most candidates presented with a thorough understanding of the relevant syllabus content. A small number either confused the components of the initial velocity or failed to resolve the velocity into horizontal and vertical components. Question 4 Average Mark 37 Response Rate 91.4%
The first part of this question involving the particle on the plane was well answered. However, the second part (pulley attached to plane) caused some difficulties. Many omitted the frictional force or the component of weight parallel to the plane.
Question 5 Average Mark 36 Response Rate 88.6%
In this collision of spheres question, a high percentage of candidates used the wrong direction of the 2 kg mass in the equations and as a result arrived at incorrect value for e, the coefficient of restitution. Those who used e as the velocity of P after the collision experienced very few problems. Solutions to (ii) which sought the loss in kinetic energy due to the collision were correct in nearly all cases.
11
Question 6 Average Mark 41 Response Rate 31.4%
Answers to (a) which required finding the centre of gravity of four particles, displayed a good level of knowledge and understanding. However, part (b) was problematic for many candidates. While most had little difficulty in calculating the areas of the different sections of the diagram and in calculating their centre of gravity coordinates very few were able to form correctly the quadratic equation necessary to calculate the value of d.
Question 7 Average Mark 31 Response Rate 25.7%
Most candidates in this statics question (ladder against wall) were able to draw a diagram showing all the forces acting on the ladder. Many candidates were able to take moments about a suitable point and to solve correctly for µ , the coefficient of friction. However, the second part of the question (wet ground) was not well answered.
Question 8 Average Mark 38 Response Rate 20.0%
As in previous years this circular motion question was not popular. However, the standard of answering was good. A common reason for loss of marks was failure to convert the radius length of the circle from centimetres to metres. A number of candidates had difficulty in resolving the tension into horizontal and vertical components. Question 9 Average Mark 32 Response Rate 45.7%
Part (i) of this hydrostatics question was answered very well. The Principle of Archimedes was well known.
However, answering in part (ii) (diagrams showing forces on sphere and cone) did not display a sound understanding of the forces involved. Very few candidates were able to make a reasonable attempt at part (iii). This seemed to be due to a lack of understanding of the concept of buoyancy.
4. OVERALL GENERAL COMMENT
Overall, answering to questions showed a good command of the knowledge and skills required for the working through of correct solutions. Candidates displayed a thorough understanding of linear motion and projectiles and also a good grasp of the centre of gravity concept. However, difficulties in forming quadratic equations arose frequently during the working of the given centre of gravity problem.
12
Drawing force diagrams also proved to be troublesome for candidates. The underlying reason seemed to be that many did not realise that when a force diagram is specifically requested, there is no need for component parts. However, resolution of
some of the forces into component parts may be required in subsequent work. This was noted as particularly problematic in this year’s examination.
5. RECOMMENDATIONS FOR TEACHERS AND STUDENTS
(i) Students should be aware of the importance of attempting the required number of questions.
(ii) The ability to resolve forces and velocity into their component parts is an
essential skill that should be well practised.
(iii) In order to achieve the highest possible mark, students should make every effort to present the steps in their work clearly and in logical order.
13
14
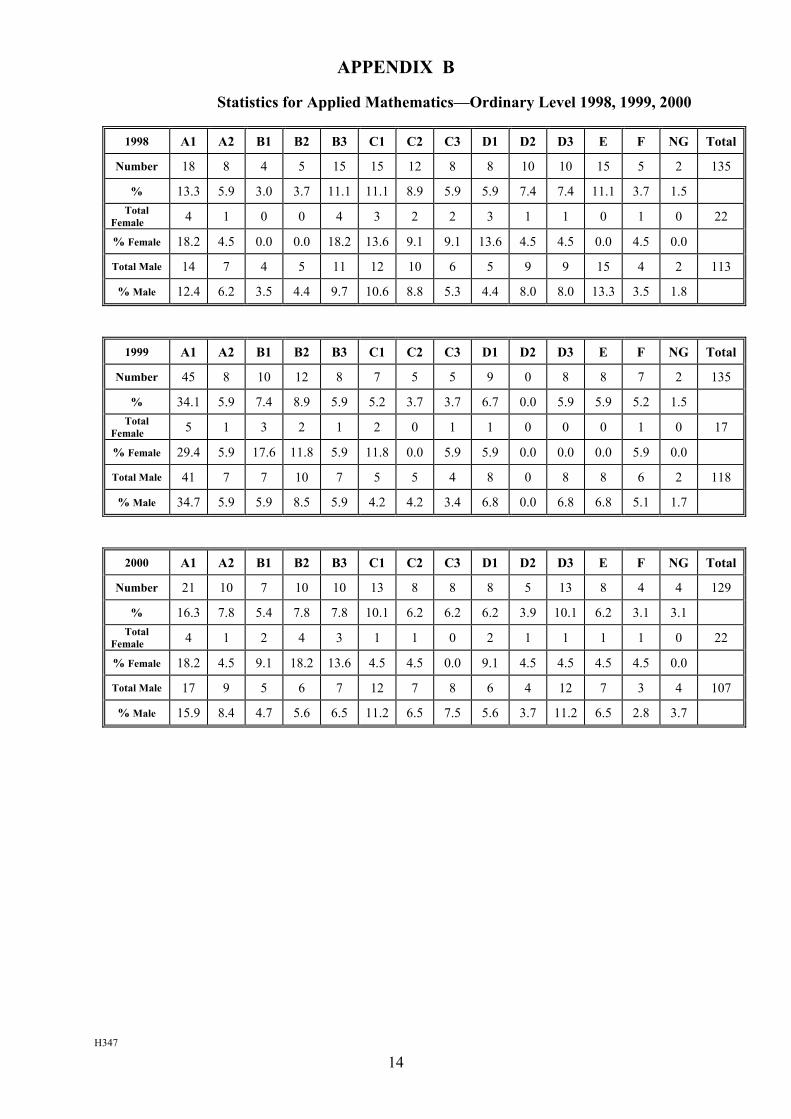
APPENDIX B
Statistics for Applied Mathematics—Ordinary Level 1998, 1999, 2000
1998 A1 A2 B1 B2 B3 C1 C2 C3 D1 D2 D3 E F NG Total
Number 18 8 4 5 15 15 12 8 8 10 10 15 5 2 135
% 13.3 5.9 3.0 3.7 11.1 11.1 8.9 5.9 5.9 7.4 7.4 11.1 3.7 1.5 Total
Female 4 1 0 0 4 3 2 2 3 1 1 0 1 0 22
% Female 18.2 4.5 0.0 0.0 18.2 13.6 9.1 9.1 13.6 4.5 4.5 0.0 4.5 0.0
Total Male 14 7 4 5 11 12 10 6 5 9 9 15 4 2 113
% Male 12.4 6.2 3.5 4.4 9.7 10.6 8.8 5.3 4.4 8.0 8.0 13.3 3.5 1.8
1999 A1 A2 B1 B2 B3 C1 C2 C3 D1 D2 D3 E F NG Total
Number 45 8 10 12 8 7 5 5 9 0 8 8 7 2 135
% 34.1 5.9 7.4 8.9 5.9 5.2 3.7 3.7 6.7 0.0 5.9 5.9 5.2 1.5 Total
Female 5 1 3 2 1 2 0 1 1 0 0 0 1 0 17
% Female 29.4 5.9 17.6 11.8 5.9 11.8 0.0 5.9 5.9 0.0 0.0 0.0 5.9 0.0
Total Male 41 7 7 10 7 5 5 4 8 0 8 8 6 2 118
% Male 34.7 5.9 5.9 8.5 5.9 4.2 4.2 3.4 6.8 0.0 6.8 6.8 5.1 1.7
2000 A1 A2 B1 B2 B3 C1 C2 C3 D1 D2 D3 E F NG Total
Number 21 10 7 10 10 13 8 8 8 5 13 8 4 4 129
% 16.3 7.8 5.4 7.8 7.8 10.1 6.2 6.2 6.2 3.9 10.1 6.2 3.1 3.1 Total
Female 4 1 2 4 3 1 1 0 2 1 1 1 1 0 22
% Female 18.2 4.5 9.1 18.2 13.6 4.5 4.5 0.0 9.1 4.5 4.5 4.5 4.5 0.0
Total Male 17 9 5 6 7 12 7 8 6 4 12 7 3 4 107
% Male 15.9 8.4 4.7 5.6 6.5 11.2 6.5 7.5 5.6 3.7 11.2 6.5 2.8 3.7
H347