Embed Size (px)
DESCRIPTION
business finance
Citation preview

LECTURE 1A :CHAPTER 1 Introduction to Financial Management
Forms of Businesses
1-1

Alternative Forms of Business Organization
Proprietorship
Unincorporated business owned by one individual
Partnership
Unincorporated business owned by two or more persons
Corporation (listed and unlisted)
Incorporated business owned by many shareholders
Legal entity created that is separate and distinct from its owners and managers
1-2

Proprietorships & Partnerships
Advantages
Easy to set up
Subject to few regulations
No corporate income taxes
Disadvantages
Difficult to raise capital
Unlimited liability
Limited life
Recently, Partnership often set up as Limited Liability Company (LLC) or Limited Liability Partnership (LLP): (limited liability like corporation but taxed like a partnership)
1-3

Corporation
Advantages Unlimited life
Easy transfer of ownership
Limited liability
Ease of raising capital
Disadvantages Higher tax rate (typically)
Double taxation: one at corporate level, one on dividends received by individual shareholders
Cost of set-up and report filing
1-4

LECTURE 1B : CHAPTER 7 Interest Rates
Determinants of interest rates
The term structure and yield curves
Using Yield Curve to estimate Future Interest Rates
1-5

What four factors affect the level of interest rates?
Production opportunities
Time preferences for consumption
Risk
Expected inflation
1-6

What four factors affect the level of interest rates?
Production opportunities:
Affects Demand for funds: those with higher rate of return from investment are more prepared to pay higher cost of borrowing.
If economy booms, more attractive projects means more need for capital. Greater competition for funds pushes up interest rates.
Demand for funds declines during recessions. Lesser competition for funds leads to lower interest rates.
Time preferences for consumption
Preference for Current Consumption (Spend Now) vs Future Consumption (Spend Later).
If current consumption is preferred, lower savings means less funds available for investment. Borrowers competing for limited funds lead to higher interest rates and lesser investments.
1-7

What four factors affect the level of interest rates?
Risk
Higher risk means higher required rate of return.
Expected inflation
To maintain real purchasing power, higher expected inflation will lead to higher interest rate.
Higher oil prices tend to lead to higher expected inflation.
1-8

Determinants of interest rates
r = r* + IP + MRP + DRP + LP
r = required return on a debt security
r* = real risk-free rate of interest
IP = Inflation Premium
MRP = Maturity Risk Premium
DRP = Default Risk Premium
LP = Liquidity Premium
1-9
I.O.U. document issued by Borrower
that can be traded

Determinants of interest rates
r* = real risk-free rate of interest, is the rate on a riskless security in
a world without inflation.
IP = Inflation Premium.
It is the average expected inflation rate over the life of the
security.
rRF = r* + IP + MRP, is the nominal or quoted risk-free rate (this overrides textbook definition which excludes the MRP). Further, the default for risk-free rate is nominal risk-free rate and not real risk-free rate, so “risk-free rate” means the nominal risk-free rate.
rRF = represents the interest rate earned on Treasury securities.
1-10
I.O.U. document issued by Government when it borrows.
Can be bought/sold. It is default-free and very liquid
r = r* + IP + MRP + DRP + LP

Determinants of interest rates
r = r* + IP + MRP + DRP + LP
MRP = Maturity Risk Premium : ________ bonds face greater price declines when interest rates or inflation spike, hence higher return is required to compensate for this risk.
DRP = Default Risk Premium : Compensation for risk of non-payment of interest or principal (Credit Risk). Correlated with rating of the bond.
LP = Liquidity Premium : Liquidity measures how easily a security can be converted to cash at short notice at reasonable price. LP is low for U.S. Treasuries, large strong firms (liquid assets) but high for small, privately owned firms (illiquid assets).
1-11

Premiums added to r* for different types of DEBT
IP MRP DRP LP
S-T Treasury
L-T Treasury
S-T Corporate Bond
L-T Corporate Bond
1-12
r = r* + IP + MRP + DRP + LP

Review/Recap & Thinking Questions
What is the “Golden Formula” on interest rates?
What type of securities have significant MRP?
What type of securities have significant DRP?
What type of securities have significant LP?
1-13
Long-Term
r = r* + IP + MRP + DRP + LP
Corporate
Corporate

Yield curve and the term structure of interest rates
Term structure – relationship between interest rates (or yields) and maturities.
The yield curve is a graph of the term structure.
Treasury yield curve on different dates are shown at the right.
0%
2%
4%
6%
8%
10%
12%
14%
0 10 20 30
Interest
Years to Maturity
March 1980
February 2000
October 2008
1-14

Constructing the Treasury yield curve: r = r* + IP + MRP
Assuming r* is given, we first find IP
Step 1 – Find the average expected inflation rate over years 1 to N:
1-15
IPN= INFLNNt=1
N
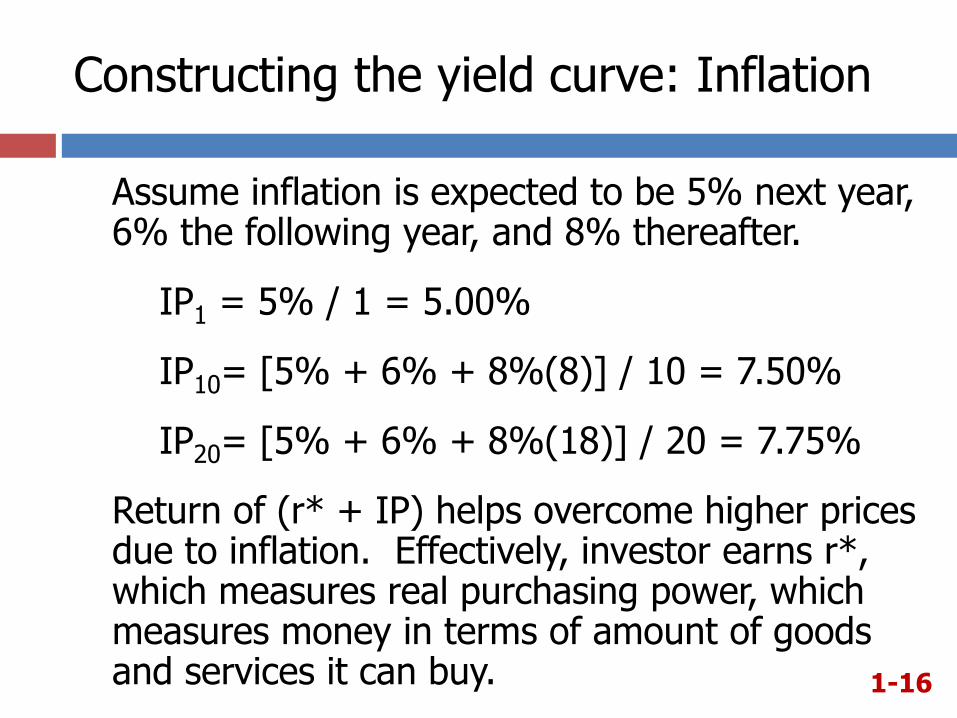
Constructing the yield curve: Inflation
Assume inflation is expected to be 5% next year, 6% the following year, and 8% thereafter.
IP1 = 5% / 1 = 5.00%
IP10= [5% + 6% + 8%(8)] / 10 = 7.50%
IP20= [5% + 6% + 8%(18)] / 20 = 7.75%
Return of (r* + IP) helps overcome higher prices due to inflation. Effectively, investor earns r*, which measures real purchasing power, which measures money in terms of amount of goods and services it can buy. 1-16

Constructing the yield curve: Maturity Risk
) 1 -t ( 0.1% MRPt
Step 2 – Find the appropriate maturity risk premium (MRP).
For this example, the following equation will be used to find a security’s appropriate maturity risk premium.
1-17

Constructing the yield curve: Maturity Risk
Using the given equation:
MRP1 = 0.1% x (1-1) = 0.0%
MRP10 = 0.1% x (10-1) = 0.9%
MRP20 = 0.1% x (20-1) = 1.9%
Equation is linear.
Maturity Risk Premium is increasing as the time to maturity increases, as it should be.
1-18

Add the IPs and MRPs to r* to find the appropriate Treasury yield
Step 3 – Adding the premiums to r*.
rRF, t = r* + IPt + MRPt
(MRP often taken to be zero for Treasury Bill (T-Bill) as it is short-term)
Assume r* = 3%,
rRF, 1 = 3% + 5.0% + 0.0% = 8.0%
rRF, 10 = 3% + 7.5% + 0.9% = 11.4%
rRF, 20 = 3% + 7.75% + 1.9% = 12.65%
1-19

Hypothetical (Treasury) yield curve
An upward sloping yield curve.
Upward slope due to an increase in expected inflation and increasing maturity risk premium.
Years to
Maturity
Real risk-free rate
0
5
10
15
1 10 20
Interest
Rate (%)
Maturity risk premium
Inflation premium
1-20

Relationship between the Treasury yield curve and the yield curves for corporate issues
Corporate yield curves are higher than that of Treasury securities, though not necessarily parallel to the Treasury curve.
Spread (or difference) between corporate and Treasury yield curves increases if the corporate bond has a lower or lousier rating.
Since corporate bond yields include a default risk premium (DRP) and a liquidity premium (LP), the corporate bond yield spread can be calculated as:
1-21 LP DRP
yield bondTreasury yield bond Corporatespread yield
bond Corporate

Relationship between corporate and Treasury yield curves
1-22

Pure Expectations Hypothesis : PEH (Theory to explain Term Structure)
PEH states that the shape of the yield curve depends on investor’s expectations about future interest rates.
If interest rates are expected to increase, Long-Term rates will be higher than Short-Term rates, and vice-versa.
Hence, yield curve can slope up, down, or even humped.
1-23

Assumptions of the PEH
Assumes maturity risk premium for Treasury securities is zero.
Long-term rates are a (geometric) average of current and future short-term rates.
If PEH is correct, can use the yield curve to calculate/infer expected future interest rates.
1-24
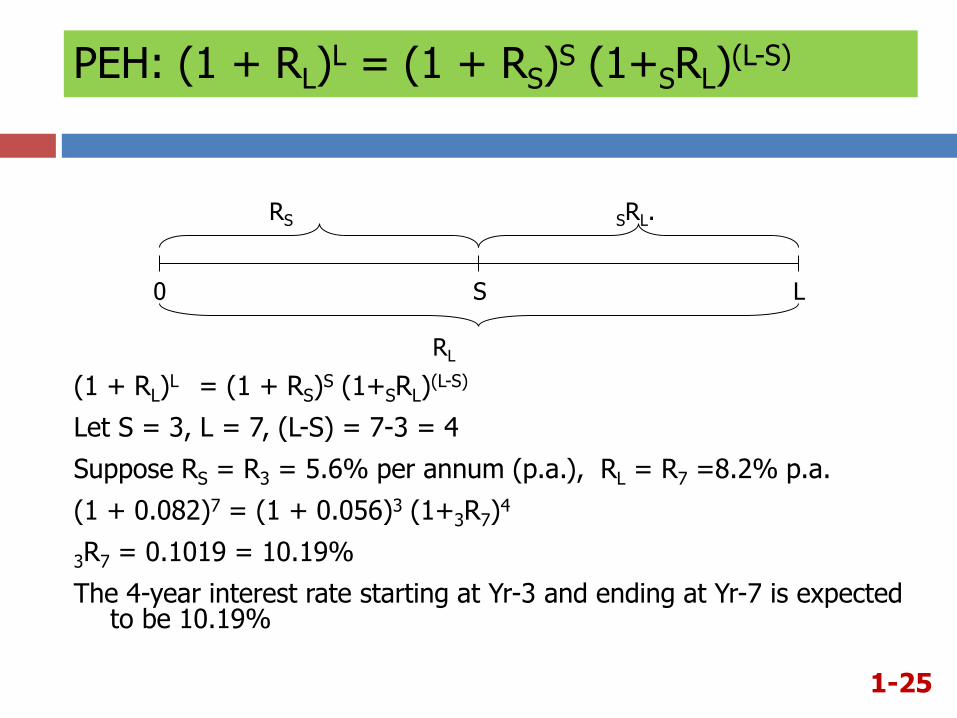
PEH: (1 + RL)L = (1 + RS)
S (1+SRL)(L-S)
(1 + RL)L = (1 + RS)
S (1+SRL)(L-S)
Let S = 3, L = 7, (L-S) = 7-3 = 4
Suppose RS = R3 = 5.6% per annum (p.a.), RL = R7 =8.2% p.a.
(1 + 0.082)7 = (1 + 0.056)3 (1+3R7)4
3R7 = 0.1019 = 10.19%
The 4-year interest rate starting at Yr-3 and ending at Yr-7 is expected to be 10.19%
0 S L
RS SRL.
RL
1-25

Pure Expectations Theory
(1 + 0.05) (1 + 0.07) = (1.06)2
(1 + 0.05) (1 + ____) = (1.05)2
(1 + 0.05) (1 + ____) = (1.0796)2 ≈ (1.08)2
(1 + 0.05) (1 + ____) = (1.03995)2 ≈ (1.04)2
1-26
Short
Rate
Long
Rate
Future
Rate

Observed Treasury rates and the PEH
Maturity Yield
1 year 6.0%
2 years 6.2%
3 years 6.4%
4 years 6.45%
5 years 6.5%
If PEH holds, what does the market expect will be the interest rate on one-year securities, one year from now? Three-year securities, two years from now?
1-27

One-year forward rate
(1.062)2 = (1.060) (1+x)
1.12784/1.060 = (1+x)
6.4004% = x
PEH implies that one-year securities will yield 6.4004%, one year from now.
If an arithmetic average is used, the answer is still very close. Solve: 6.2% = ½ (6.0% + x), solving x = 6.4%.
0 1 2
6.0% p.a. x% p.a.
6.2% p.a.
1-28
⇒ 2-year rate of 6.2% is geometric
average of 6% and x%

What is the yield of three-year security, two years from now?
1-29
You just need to write the starting equation
0 1 2 3 4 5
x% p.a.
6.5% p.a.
6.2% p.a.
Conclusions about PEH
Some argue that MRP ≠ 0, and hence the PEH is incorrect.
Most evidence supports the general view that lenders prefer Short-Term securities, and view Long-Term securities as riskier.
Thus, investors demand a premium to persuade them to hold Long-Term securities :
MRP > 0
1-31

LECTURE 1C: Types of Financial Mkts
Chapter 2
2-32

What is a Market?
Market: Venue where goods and/or services are traded.
Financial Market: a place where individuals and organizations wanting to borrow/raise funds are brought together with those having a surplus of funds.
2-33

Different Types of Markets
Physical assets vs. Financial assets Markets
Physical Assets: tangible or real assets e.g. Wheat, computer, house.
Financial Assets: stocks, bonds, mortgages and other claims on real assets as well as derivative securities whose values are derived from price changes of other assets.
Money vs. Capital Markets
Money Mkt: short-term, highly liquid debt securities.
Capital Mkt: intermediate- or long-term debt and corporate stocks.
Primary vs. Secondary Markets
Primary Mkt: where corporations raise new capital.
Secondary Mkt: where existing securities are traded among investors.
2-34

Types of financial markets
Spot vs. Futures
Spot Mkt: assets are bought/sold “on-the-spot” delivery: within a few days.
Futures Mkt: participants agree today to buy/sell an asset at some future date at a price agreed today.
Public vs. Private
Public Mkt: standardized contracts are traded on organized exchanges, more liquid. Example: stock market.
Private Mkt: transactions are negotiated directly between 2 parties, less liquid. Example: mkt for bank loans.
2-35

Primary vs Secondary Markets
If Microsoft issues additional shares and an investor purchases some of the newly issued shares at the time of issue, would this be a primary market transaction or a secondary market transaction?
If instead an investor buys existing shares of Microsoft stock in the open market – is this a primary or secondary market transaction?
2-36
Primary Market Transaction: new shares are issued
Secondary Market Transaction:
no new shares created

Review
Forms of Business:
Proprietorship
Partnership
Corporation
1-37

Review
Determinants of Interest Rate
r = r* + IP + MRP + DRP + LP
Pure Expectations Hypothesis:
Yield Curve that slopes Up: interest rate expected to go
Yield Curve that slopes Down: interest rate expected to go
1-38
Up
Down