Embed Size (px)
Citation preview

1
Lecture 1: Cost Behaviour
Introduction
This topic focuses on the analysis of costs and how they behave in relation to
changes in a particular organisational activity (such as production volume).
Knowing how costs vary by identifying the drivers of costs and being able to
distinguish fixed from variable costs are essential to good management decision
making.
Many managerial functions in the planning and control areas require and rely on
knowing how costs behave in relation to activities (e.g. production
output/volume).
Analysis of cost behaviour patterns allows managers to prepare standard costs,
formulate budgets and to predict and control costs.
What is a Cost?

2
Basic Cost Terminology
Cost pools: Groups of a particular type of cost (e.g. material costs, labour costs,
electricity costs, depreciation costs). Cost pools vary by the type of costs included
and the level of aggregation.
Cost objects: Factors or items in an organisation that are separated for
measurement of their costs (e.g. products, departments, jobs, events). Costs are
assigned from cost pools to these items.
Cost drivers: Activities or factors that drive (cause) costs to be incurred. Drivers
allow cost pools to be allocated to cost objects.
Cost Behaviour: The relationship between a cost and the level of activity that
causes this cost (i.e. cost driver).
Volume-based driver: A cost driver that assumes that costs are driven by
production or a factor related to production (e.g. machine hours)
Non-volume-based driver: A cost driver not directly related to production volume
(e.g. number of deliveries)
The basic (linear) cost function can be represented in the following manner:
Activity Based Costing: A system where costs are assigned to activities that
represent the main tasks or work performed in a business.
Consider the activities involved in manufacturing cakes:
Costs (e.g. materials, labour, overheads) are assigned to each of these activity cost
pools. Costs within each activity are assumed to be driven by the same driver.

3
Activities
Activities can be classified into four distinct levels:
Unit: Relate to activities that are performed for each unit produced. These costs
require volume-based drivers.
Batch: Relate to activities that are performed for a group of units. These require non-
volume based drivers.
Product: Relate to activities that are performed for specific products or product
families. These require product-related cost drivers.
Facility: Costs incurred to run the business but are not caused by specific products.
No cost driver in the short-term.
Variable Costs
Costs that change in total in direct proportion to a change in activity.
Fixed Costs
Costs that remain unchanged in total as the level of activity varies.
Discretionary cost: Based on a managerial decision that can be changed relatively
easily.
Committed cost: Results from the basic organisation structure and difficult to adjust
in the short term.

4
Semi- Variable (Mixed Costs)
Costs that contain both fixed and variable components.

5
Step- Fixed Costs
Costs that remain fixed within a certain range of activity, but change to a different
amount outside that range.
Curvilinear Costs
Costs that exhibit cost behaviour that can be described by a curved line. Convex
costs have increasing marginal costs. Concave costs have decreasing marginal
costs.

6
Relevant Range
Refers to the range of activity (i.e. the upper and lower limits of an activity) for which
assumptions about cost behaviour hold.
Assumptions made within one relevant range may not be valid in another range
VC per unit may change
Fixed costs are not constant
Prediction of costs can only be done accurately within a known range
Cost Estimation
Cost estimation is the process of determining the cost behaviour pattern of a
particular cost item. Cost prediction is using knowledge of cost behaviour to
forecast the level of cost at a particular level of activity.
The most important issue in estimating a cost function is to determine whether a
cause-and-effect relationship exists between the activity or cost driver (X) and the
resulting costs (Y). This may arise in several ways:
o Physical relationship with the cost driver (engineered cost)
o Contractual arrangement
o Logic and knowledge of operations

7
There are three methods to identify cause and effect relationships
1-Engineering Method
Identifies the relationship that should exist between input and outputs. Relationships
are determined through “time and motion” studies which observe the steps required
and time taken to perform particular activities.
2- Managerial Judgment
A) Conference method: Estimates cost functions on the basis of opinion about costs
and their drivers gathered from various departments of an organisation – purchasing,
human resources, engineering, manufacturing, etc. This method relies on the expert
knowledge and judgement of managers.
B) Account classification (account analysis): The account analysis method
estimates cost functions by classifying cost accounts in the ledger as variable, fixed
or mixed with respect to the identified cost driver. Typically managers’ use qualitative
rather than quantitative analysis when making these cost classification decisions.
3- Quantitative Analysis
These are formal analyses of cost relationships to fit mathematical equations
(functions) to past data. There are six steps involved:
o Step 1: Choose the dependent variable (the cost variable you want to
estimate). Example: Electricity cost in the manufacturing plant
o Step 2: Identify the independent variable(s) (the activity or activities that
cause the cost). Example: Machine hours
o Step 3: Collect data on the dependent variable and the cost driver(s).
Example: Monthly electricity cost for the last 12 months
8
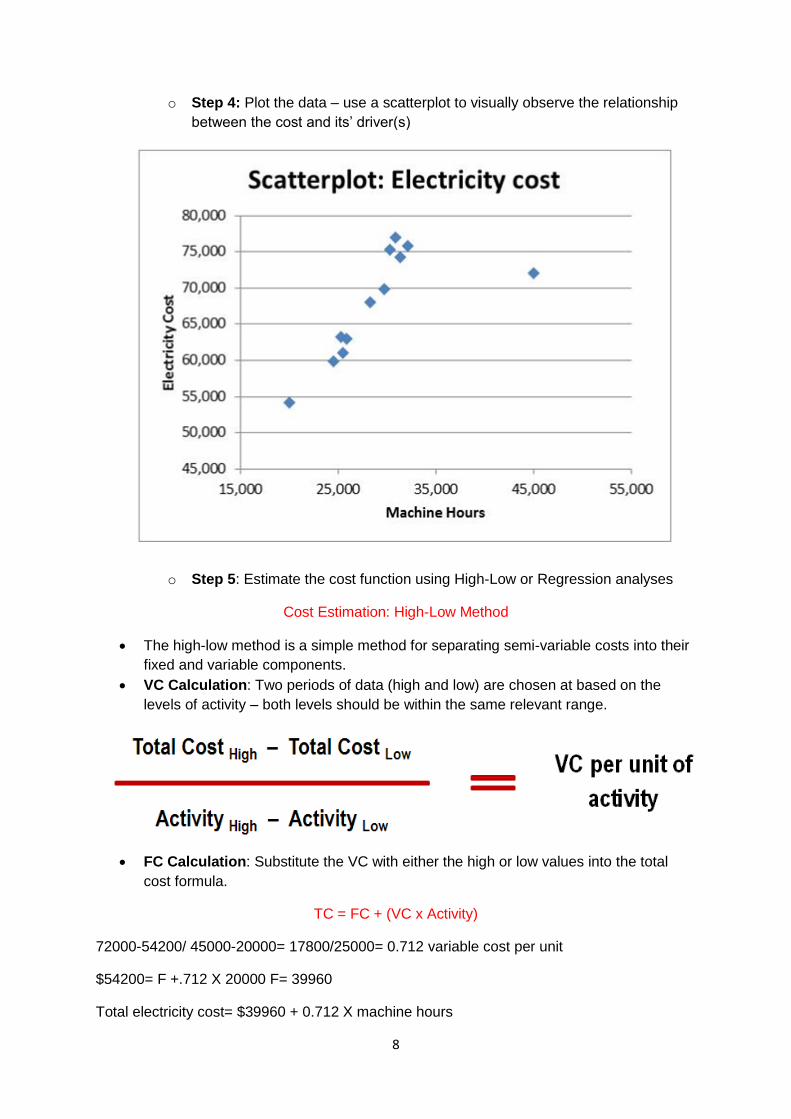
o Step 4: Plot the data – use a scatterplot to visually observe the relationship
between the cost and its’ driver(s)
o Step 5: Estimate the cost function using High-Low or Regression analyses
Cost Estimation: High-Low Method
The high-low method is a simple method for separating semi-variable costs into their
fixed and variable components.
VC Calculation: Two periods of data (high and low) are chosen at based on the
levels of activity – both levels should be within the same relevant range.
FC Calculation: Substitute the VC with either the high or low values into the total
cost formula.
TC = FC + (VC x Activity)
72000-54200/ 45000-20000= 17800/25000= 0.712 variable cost per unit
$54200= F +.712 X 20000 F= 39960
Total electricity cost= $39960 + 0.712 X machine hours

9
The dependent variable (Y) is electricity. This is predicted or explained by the
independent variable (X) of machine hours.
There are two simplifying assumptions in the High-Low method:
1. Changes in the total costs of a cost object are explained by variations of a single cost
driver.
2. Cost behaviour is adequately approximated by a linear cost function of the cost driver
within the relevant range.
More advanced statistical methods can overcome these limitations. They are still limited to a
single relevant range.
Regression Analysis
Regression analysis is a statistical method that measures the average amount of
change in the dependent variable that is associated with a unit change in one or
more independent variables. It has two advantages over high-low:
o All available data points are used (high-low uses just two data points). The
difference can be seen in the scatterplot below.
o Multiple cost drivers can be used to estimate costs

10
Regression analysis for the previous example would give the following output:
Cost Function (Regression):
Electricity= 43,293.4148 + (0.8430 x Machine Hours)
Cost Function (High Low):
Electricity= 27,576.2781 + (0.988 x Machine Hours) + (3.2431 * Batches)

11
Cost Estimation Techniques
Regression analysis can also include multiple cost drivers:
Cost Function (Multiple Regression):
Electricity=
Step 6: Evaluate the estimated cost function
The four most important criteria in evaluating the cost function are:
Economic plausibility – Does the cost function make sense?
Goodness of fit – How well does the line fit the data points?
Slope of line – A relatively flat line indicates a weak or non-existent relationship
between the activity and the cost. A steep line would indicate a stronger relationship.
Cost v benefit – A subjective estimate might be good enough!
Incorrectly estimating the cost function has repercussions for cost management and cost
control. Managers will have a reduced ability to make accurate plans and budgets and have
less understanding of organisational processes.
12
Lecture 2: Product Costing
Lecture Outline
Introduction – What is cost?
Measures of cost
Organisation value chain and cost incurrence
Conventional product costing systems
o Manufacturing
o Service
Cost flows in general ledger
Accounting for overheads
Product costing and pricing
Summary of cost classifications
Lecture demonstration problem
Introduction- What is Cost?
Cost is usually defined by accountants as a resource foregone in order to achieve a
particular objective (a beneficial sacrifice). If the benefits arising from this cost extend over a
period of time, then it is an asset (recorded in the balance sheet). If the benefits are short
lived, then it is an expense (recorded in the profit and loss).
Last week we learnt about cost pools, cost objects and cost drivers, and one way of
classifying costs according to their pattern of cost behaviour (fixed, variable and mixed).
This week we learn about another way to classify costs depending on how they are assigned
to the cost object.
Measures of Cost
A “cost” can be defined and measured in a number of ways:
Variable cost
o Includes DM, DL and VOH (excludes all fixed costs)
Absorption cost (or full product cost)
o Includes all product-related costs (includes DM, DL, VOH and FOH)
Full cost
o Includes all costs in the value chain related to the product (including
upstream/downstream and corporate support costs)
How a management accounting system assigns costs to cost objects also may vary:
Actual costing
o Reports only the actual costs of production (accurate but not timely)
Normal costing
o Reports actual DM and actual DL, but uses a predetermined rate to report OH
(timely but not necessarily accurate)
Standard costing
o Uses a predetermined rate for all production costs (DM, DL and OH are all
budgeted)

13
Organisation Value Chain
One way of understanding how costs are incurred in an organisation is to analyse them as
part of the organisation value chain. This is a set of linked activities and processes that
create value in a service or product.
Cost Incurrence
Cost incurrence occurs when a resource is sacrificed or used up. Costing systems
emphasise this, recording costs only when incurred. Locked-in or committed costs
are costs that have yet to be incurred, but will be incurred because of decisions that
have been made in the planning and development stages of a product.

14
Conventional Product Costing Systems
A cost system estimates the cost of a cost object, which for example, could be
activities, products, services, a department, or a customer. The cost system does this
in two basic stages.
o Stage 1: Cost accumulation – the process of collecting cost data in some
organised way through an accounting system. This is often through self-
descriptive classifications (cost pools), such as materials, labour, advertising,
etc.
o Stage 2: Cost assignment – the process of assigning costs to cost objects:
Tracing accumulated direct costs to a cost object
Allocating accumulated indirect costs to a cost object
Conventional Product Costing Systems
A major consideration is whether the cost has a direct or indirect relationship to a particular
cost object (e.g. a unit of production).
Direct costs are those that are related and can be traced easily/economically to the
cost object. They often have a physical or observable relationship with the cost object
(e.g. the product). These costs are assigned to the cost object directly, based on the
measured quantity of the resources consumed.
Indirect costs (also called overheads) are those that are related to a particular cost
object that cannot be traced easily/economically to the cost object. These costs do
not have an observable relationship with the cost object. Indirect costs are allocated
to the cost object using an overhead allocation method.

15
Costing system types can be placed on a continuum. Each type determines the cost of a
product or service using different costing techniques.
Another costing process is “Joint & By-Product Costing”. This is used when two or more
products emerge from a single raw material or process.

16
Conventional Product Costing Systems- Continued

17
Cost Flows in the General Ledger

18
Accounting for Overheads
Two types of manufacturing overhead are recorded in an accounting system:
Actual manufacturing overheads
o Accumulated as they are incurred throughout the accounting period.
Applied manufacturing overhead
o Estimated costs applied to the work in process (WIP) inventory account using
a predetermined overhead rate
Why do firms use applied overhead?
Some overheads are incurred infrequently
Actual costs not always known during the period
In conventional costing systems, indirect costs are allocated using a single predetermined
overhead rate. This is used for applying overhead to units of production.