Embed Size (px)
Citation preview
Lecture 10: Atmospheric pressure and wind (Ch 4)
• map discussion
• wrap up Ch 4
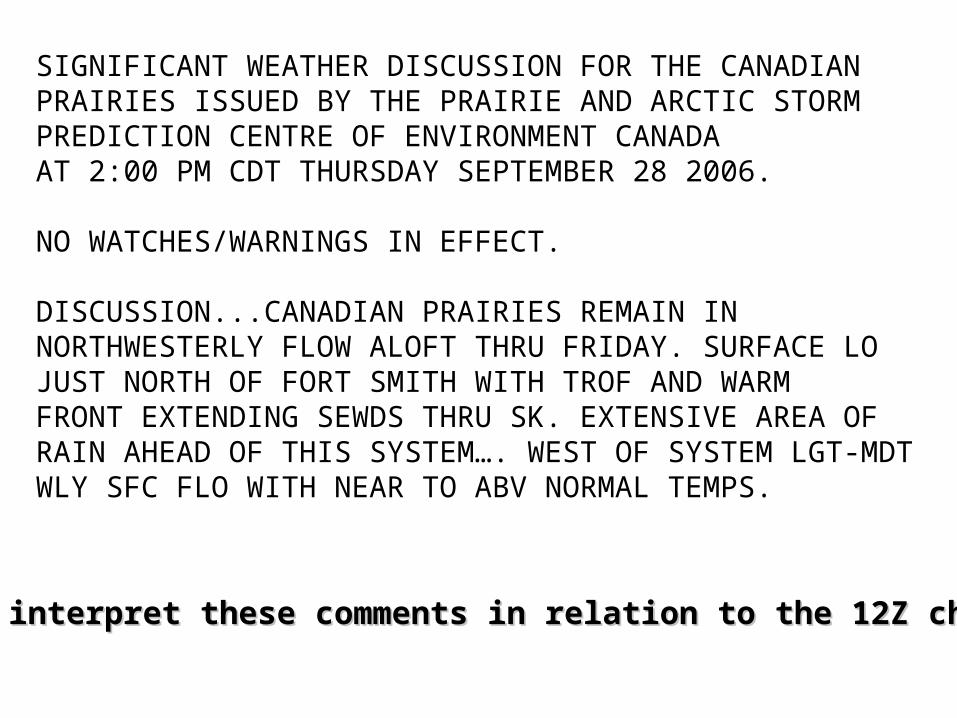
SIGNIFICANT WEATHER DISCUSSION FOR THE CANADIAN PRAIRIES ISSUED BY THE PRAIRIE AND ARCTIC STORM PREDICTION CENTRE OF ENVIRONMENT CANADAAT 2:00 PM CDT THURSDAY SEPTEMBER 28 2006.
NO WATCHES/WARNINGS IN EFFECT.
DISCUSSION...CANADIAN PRAIRIES REMAIN IN NORTHWESTERLY FLOW ALOFT THRU FRIDAY. SURFACE LO JUST NORTH OF FORT SMITH WITH TROF AND WARMFRONT EXTENDING SEWDS THRU SK. EXTENSIVE AREA OF RAIN AHEAD OF THIS SYSTEM…. WEST OF SYSTEM LGT-MDT WLY SFC FLO WITH NEAR TO ABV NORMAL TEMPS.
• Let’s interpret these comments in relation to the 12Z chartsLet’s interpret these comments in relation to the 12Z charts
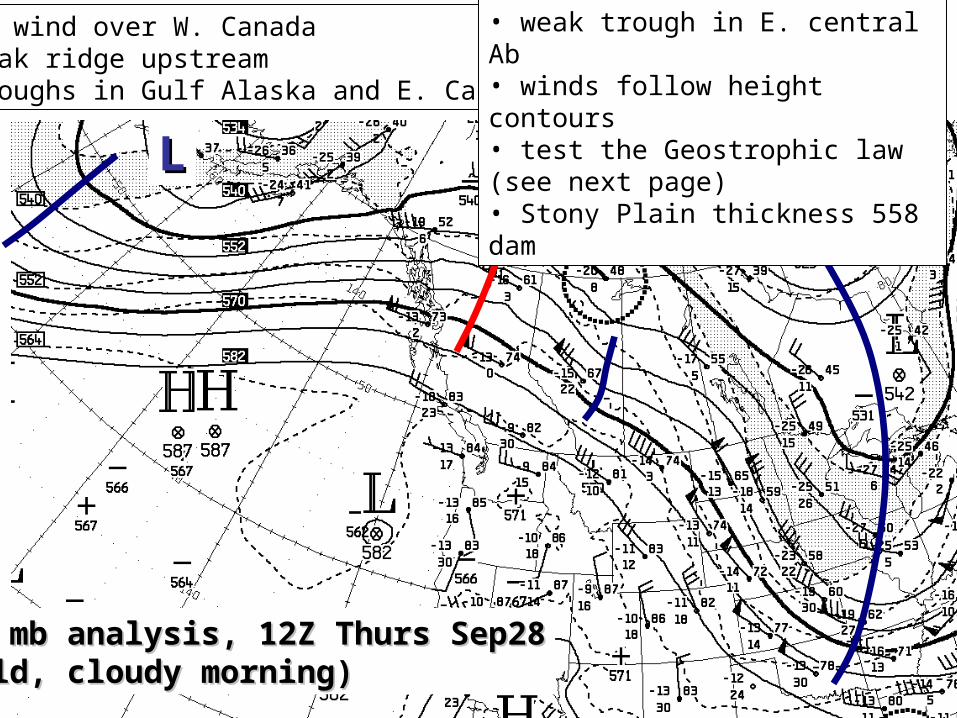
500 mb analysis, 12Z Thurs Sep28500 mb analysis, 12Z Thurs Sep28(mild, cloudy morning)(mild, cloudy morning)
• NW wind over W. Canada• weak ridge upstream• troughs in Gulf Alaska and E. Canada
• weak trough in E. central Ab• winds follow height contours• test the Geostrophic law (see next page)• Stony Plain thickness 558 dam
LL
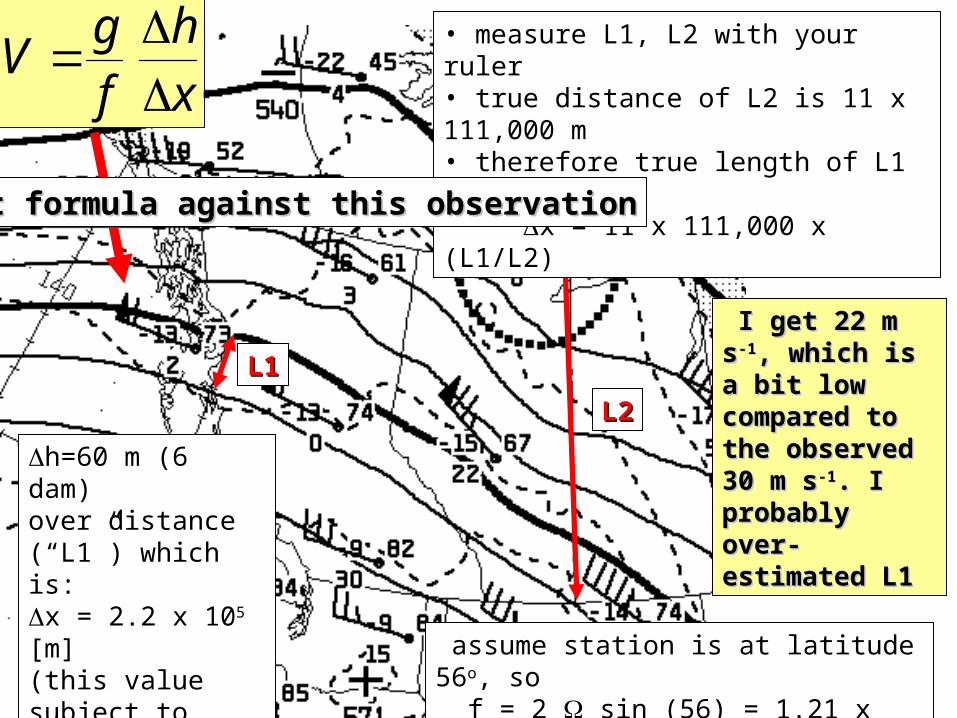
h=60 m (6 dam)over distance (“L1”) which is: x = 2.2 x 10⁵ [m] (this value subject to about 10% measurement error with your ruler)
L1L1
L2L2
• measure L1, L2 with your ruler• true distance of L2 is 11 x 111,000 m• therefore true length of L1 is x = 11 x 111,000 x (L1/L2)
assume station is at latitude 56o, so f = 2 sin (56) = 1.21 x 10⁻⁴ [sec]
x
h
f
gV
Test formula against this observationTest formula against this observation
I get 22 m sI get 22 m s-1-1, , which is a bit low which is a bit low compared to the compared to the observed 30 m sobserved 30 m s-1-1. . I probably over-I probably over-estimated L1estimated L1
Thickness of the layer 1000 mb - 500 mb
The height interval between that height where p = 1000 mb and that height where p = 500 mb is called the
(1000 mb - 500 mb) thickness(1000 mb - 500 mb) thickness
and is related to the average temperature of that atmospheric layer. Thickness is quoted in [dam].
An increase (decrease) in thickness of 2 dam2 dam corresponds to warming (cooling) by 11oo C C
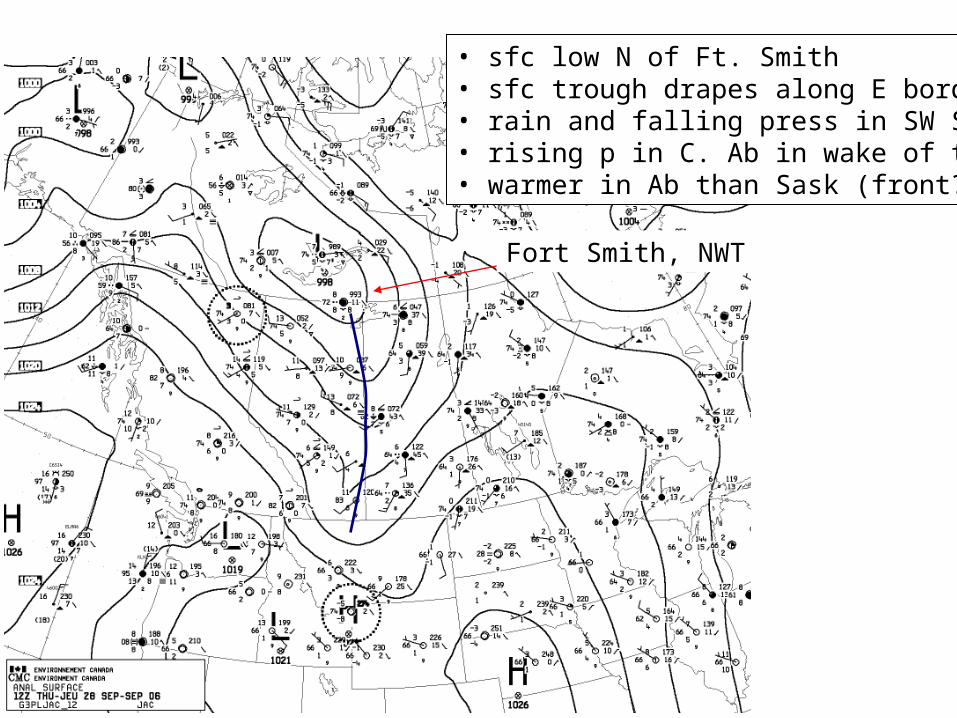
• sfc low N of Ft. Smith• sfc trough drapes along E border• rain and falling press in SW Sask• rising p in C. Ab in wake of trough• warmer in Ab than Sask (front?)
Fort Smith, NWT
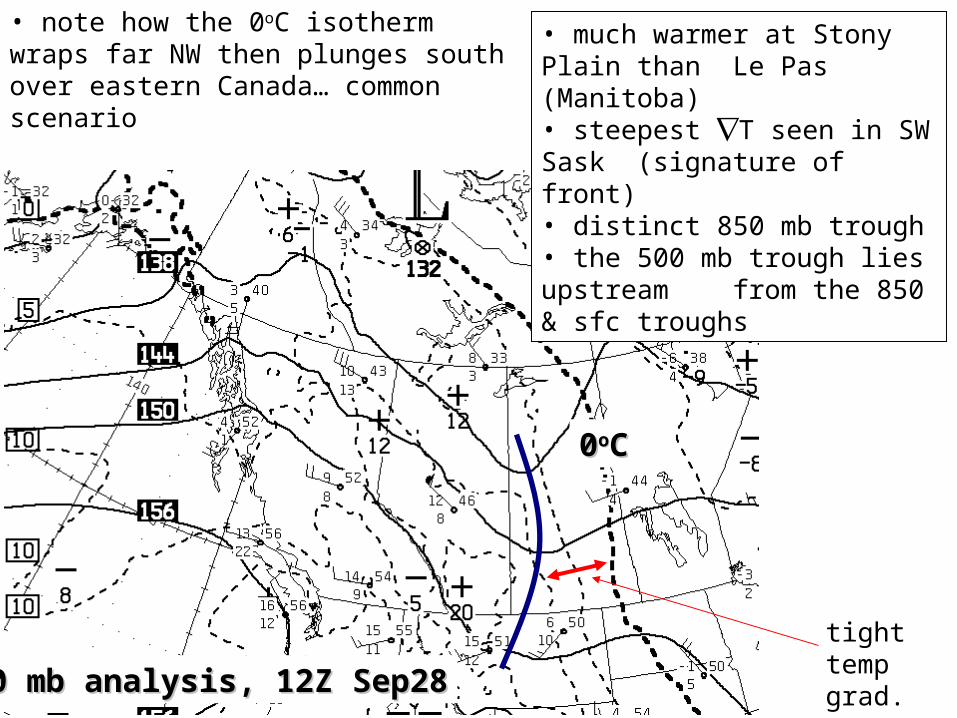
• much warmer at Stony Plain than Le Pas (Manitoba)• steepest T seen in SW Sask (signature of front)• distinct 850 mb trough• the 500 mb trough lies upstream from the 850 & sfc troughs
850 mb analysis, 12Z Sep28850 mb analysis, 12Z Sep28
00ooCC
tight temp grad.
• note how the 0oC isotherm wraps far NW then plunges south over eastern Canada… common scenario
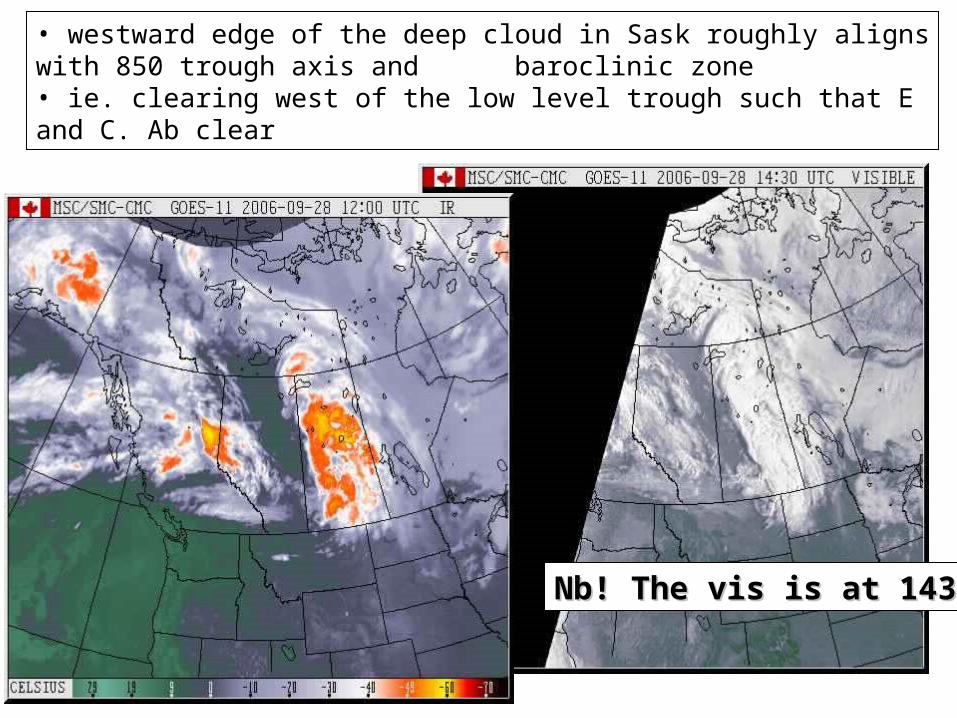
• westward edge of the deep cloud in Sask roughly aligns with 850 trough axis and baroclinic zone
• ie. clearing west of the low level trough such that E and C. Ab clear
Nb! The vis is at 1430ZNb! The vis is at 1430Z
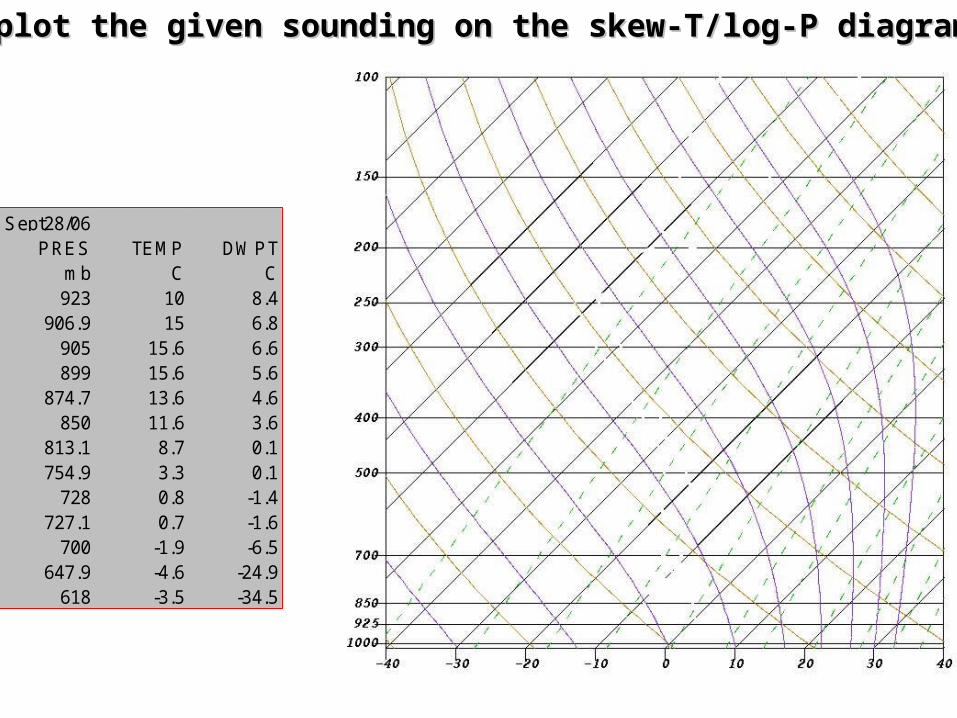
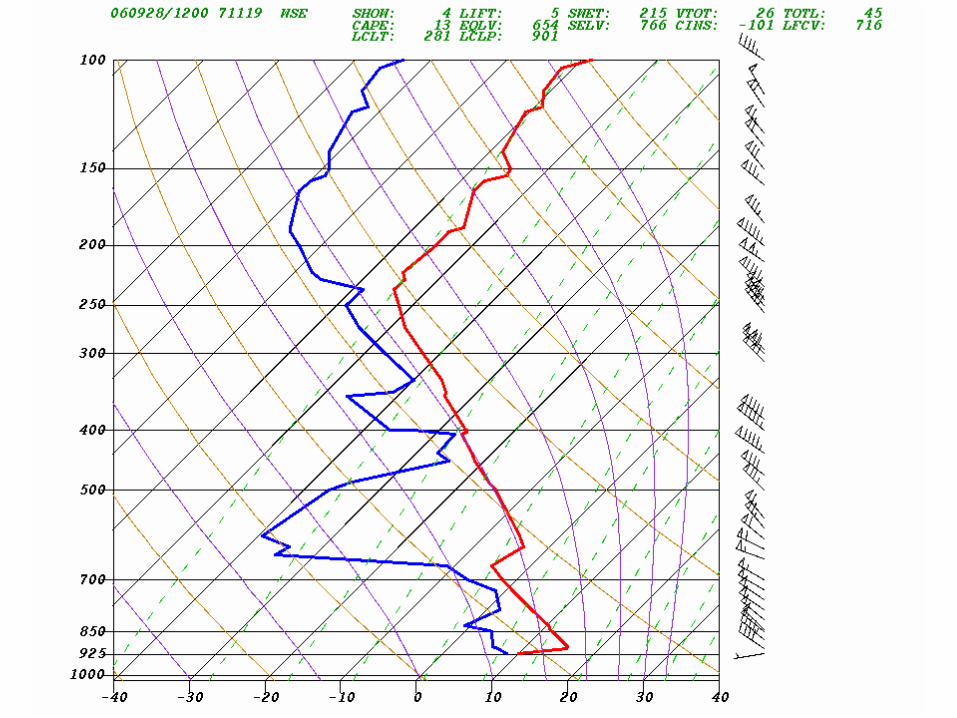
Stony Plain, 12Z Sept28/06PRES TEMP DWPT
mb C C923 10 8.4
906.9 15 6.8905 15.6 6.6899 15.6 5.6
874.7 13.6 4.6850 11.6 3.6
813.1 8.7 0.1754.9 3.3 0.1
728 0.8 -1.4727.1 0.7 -1.6
700 -1.9 -6.5647.9 -4.6 -24.9
618 -3.5 -34.5
Please plot the given sounding on the skew-T/log-P diagramPlease plot the given sounding on the skew-T/log-P diagram
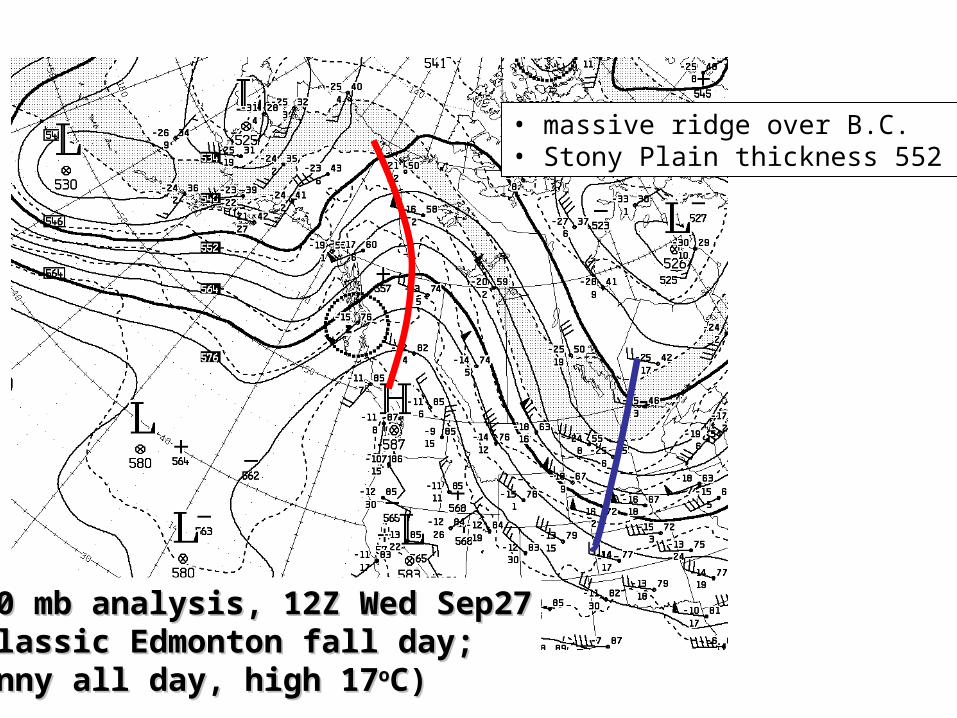
500 mb analysis, 12Z Wed Sep27500 mb analysis, 12Z Wed Sep27(classic Edmonton fall day; (classic Edmonton fall day; sunny all day, high 17sunny all day, high 17ooC)C)
• massive ridge over B.C.• Stony Plain thickness 552 dam


![Ch. 21 Notes: Atmospheric Pollution - Kwanga.net Ch. 21 Notes: Atmospheric Pollution [NOTE: The abbreviations NO x and SO x are often used, but they usually refer to NO 2 and SO 2.]](https://img.pdfslide.net/doc/110x75/5abc05fa7f8b9a76038d69c0/ch-21-notes-atmospheric-pollution-ch-21-notes-atmospheric-pollution-note.jpg)