Embed Size (px)
Citation preview
Radioactivity
Lecture 10 The radioactive Universe

Universe, Galaxy, Solar System, Earth
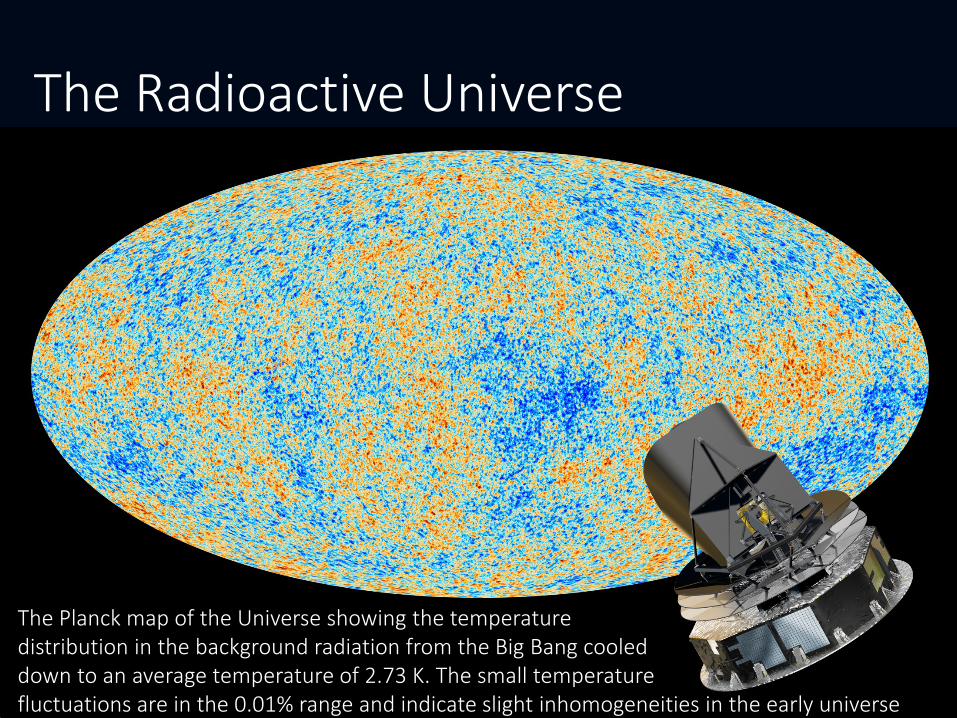
The Radioactive Universe
The Planck map of the Universe showing the temperature distribution in the background radiation from the Big Bang cooled down to an average temperature of 2.73 K. The small temperature fluctuations are in the 0.01% range and indicate slight inhomogeneities in the early universe
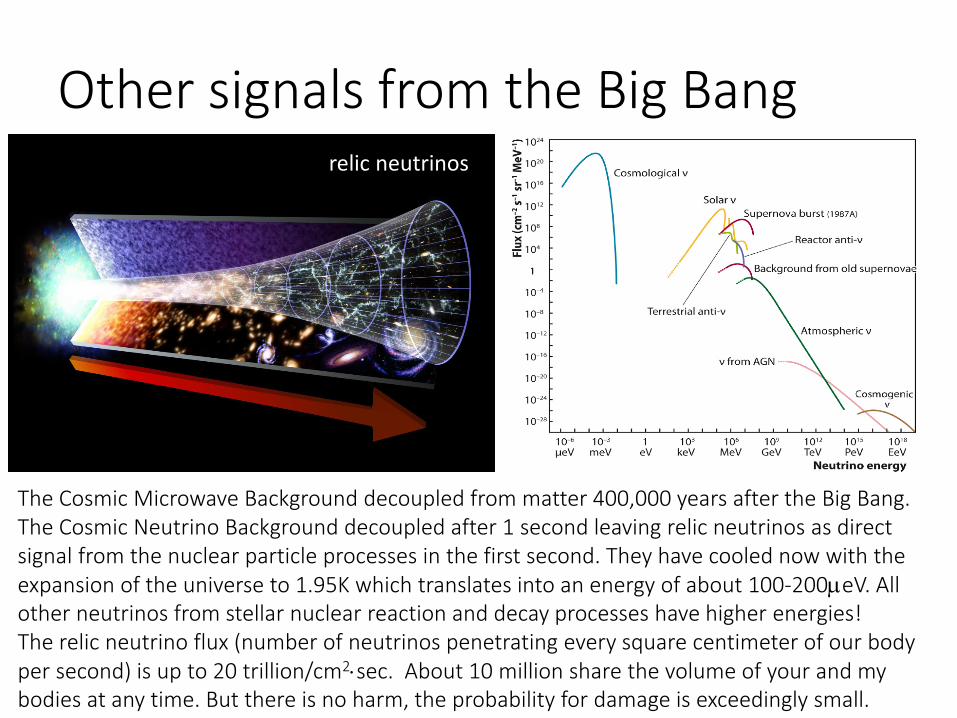
Other signals from the Big Bang relic neutrinos
The Cosmic Microwave Background decoupled from matter 400,000 years after the Big Bang. The Cosmic Neutrino Background decoupled after 1 second leaving relic neutrinos as direct signal from the nuclear particle processes in the first second. They have cooled now with the expansion of the universe to 1.95K which translates into an energy of about 100-200µeV. All other neutrinos from stellar nuclear reaction and decay processes have higher energies! The relic neutrino flux (number of neutrinos penetrating every square centimeter of our body per second) is up to 20 trillion/cm2⋅sec. About 10 million share the volume of your and my bodies at any time. But there is no harm, the probability for damage is exceedingly small.
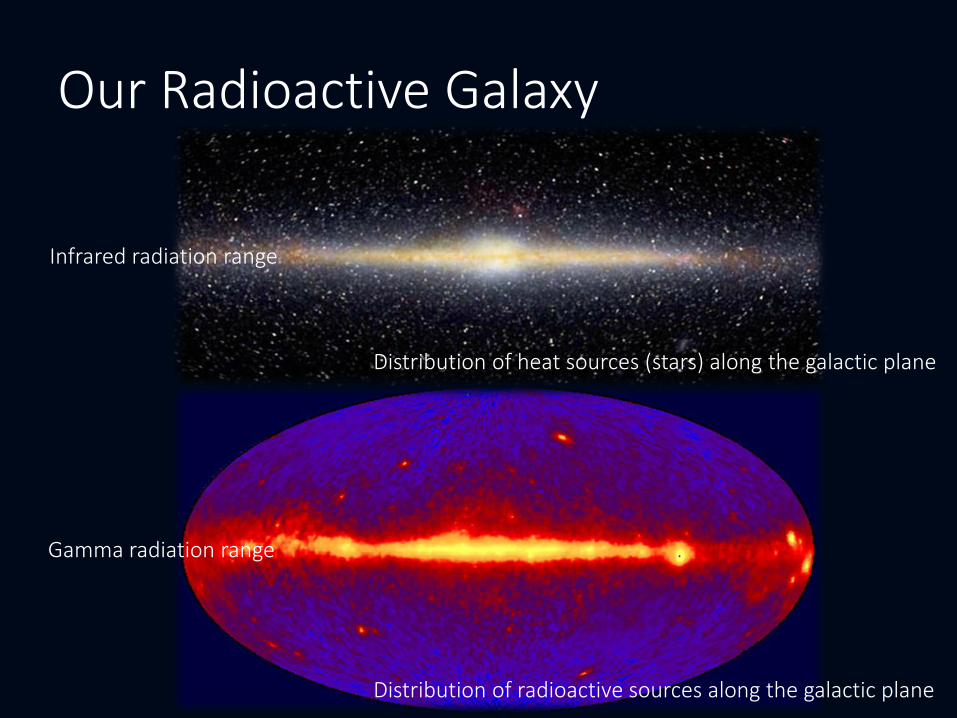
Infrared radiation range
Gamma radiation range
Distribution of heat sources (stars) along the galactic plane
Distribution of radioactive sources along the galactic plane
Our Radioactive Galaxy
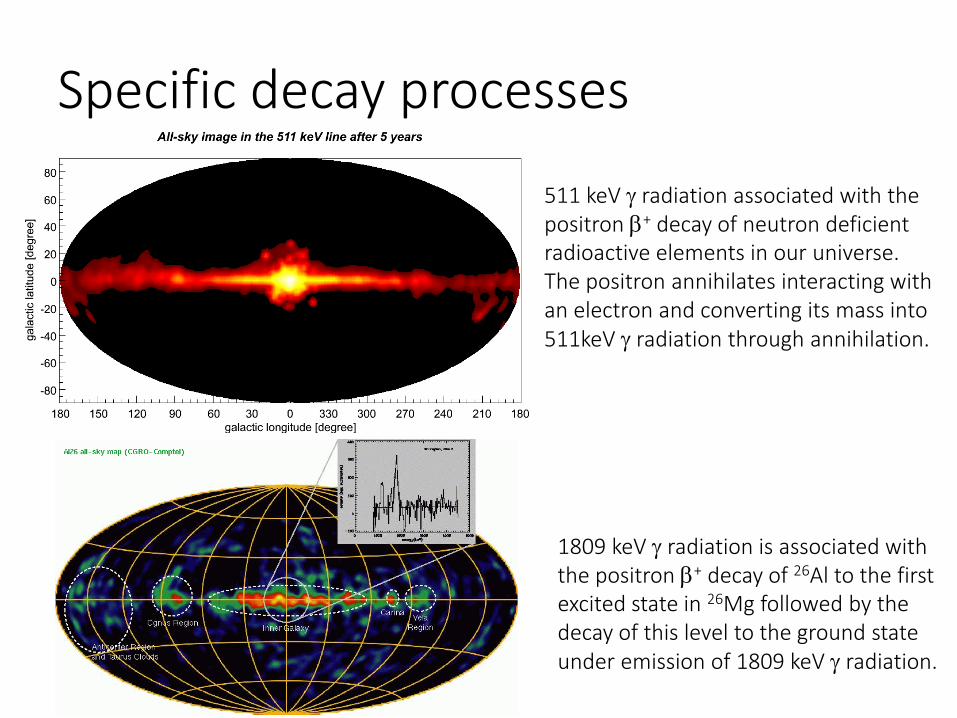
Specific decay processes
511 keV γ radiation associated with the positron β+ decay of neutron deficient radioactive elements in our universe. The positron annihilates interacting with an electron and converting its mass into 511keV γ radiation through annihilation.
1809 keV γ radiation is associated with the positron β+ decay of 26Al to the first excited state in 26Mg followed by the decay of this level to the ground state under emission of 1809 keV γ radiation.
Inter=
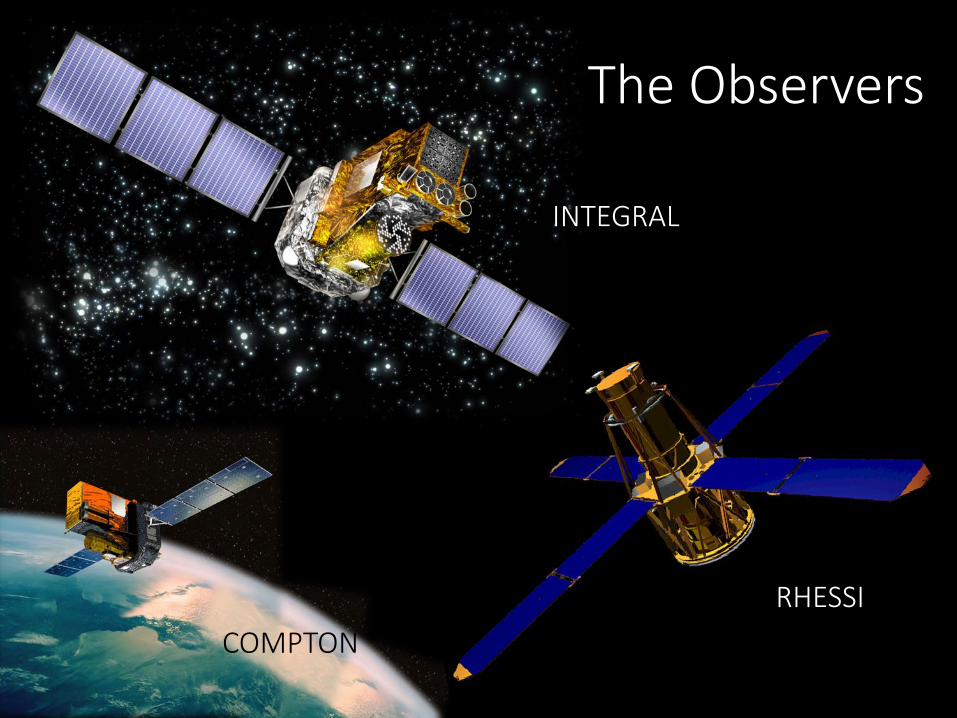
The Observers
INTEGRAL
COMPTON RHESSI
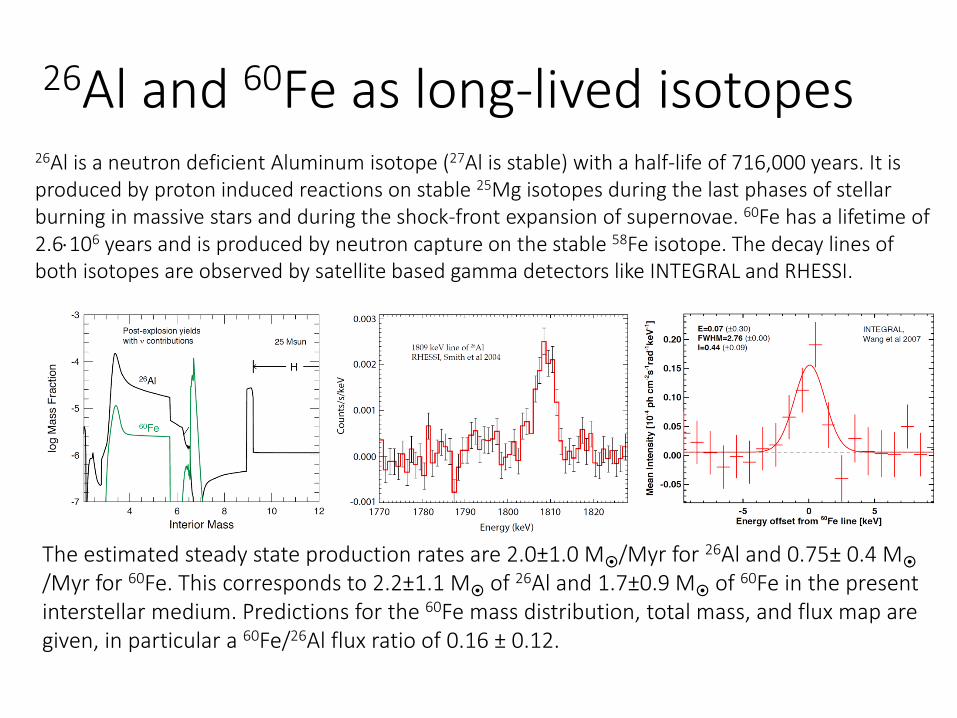
26Al and 60Fe as long-lived isotopes 26Al is a neutron deficient Aluminum isotope (27Al is stable) with a half-life of 716,000 years. It is produced by proton induced reactions on stable 25Mg isotopes during the last phases of stellar burning in massive stars and during the shock-front expansion of supernovae. 60Fe has a lifetime of 2.6⋅106 years and is produced by neutron capture on the stable 58Fe isotope. The decay lines of both isotopes are observed by satellite based gamma detectors like INTEGRAL and RHESSI.
The estimated steady state production rates are 2.0±1.0 M/Myr for 26Al and 0.75± 0.4 M /Myr for 60Fe. This corresponds to 2.2±1.1 M of 26Al and 1.7±0.9 M of 60Fe in the present interstellar medium. Predictions for the 60Fe mass distribution, total mass, and flux map are given, in particular a 60Fe/26Al flux ratio of 0.16 ± 0.12.
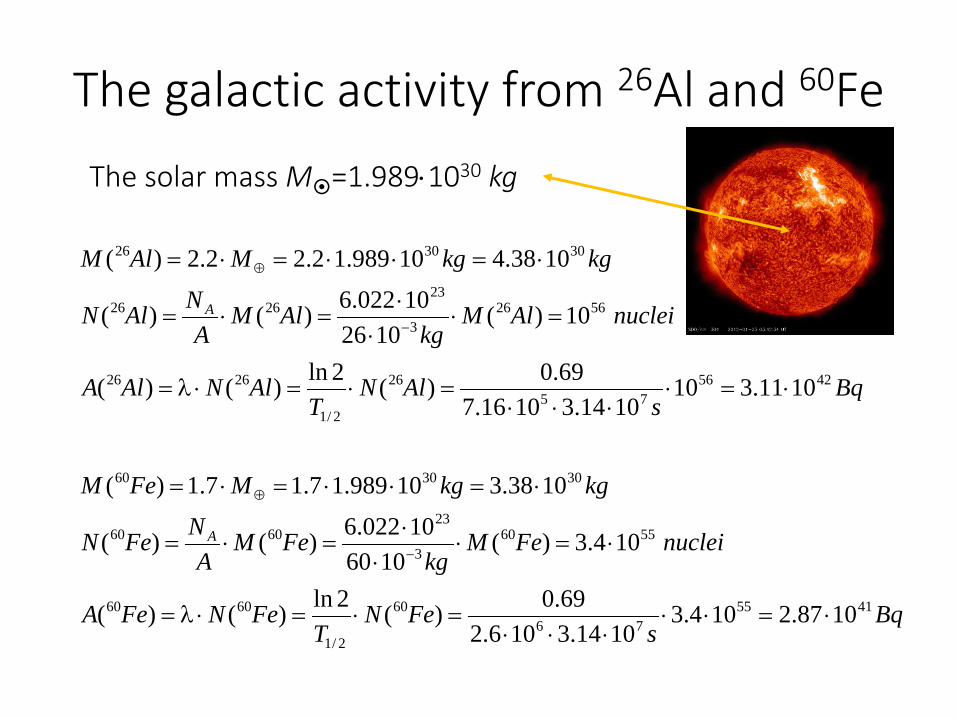
The galactic activity from 26Al and 60Fe
Bqs
FeNT
FeNFeA
nucleiFeMkg
FeMA
NFeN
kgkgMFeM
Bqs
AlNT
AlNAlA
nucleiAlMkg
AlMA
NAlN
kgkgMAlM
A
A
415576
60
2/1
6060
55603
236060
303060
425675
26
2/1
2626
56263
232626
303026
1087.2104.31014.3106.2
69.0)(2ln)()(
104.3)(1060
10022.6)()(
1038.310989.17.17.1)(
1011.3101014.31016.7
69.0)(2ln)()(
10)(1026
10022.6)()(
1038.410989.12.22.2)(
⋅=⋅⋅⋅⋅⋅
=⋅=⋅λ=
⋅=⋅⋅
⋅=⋅=
⋅=⋅⋅=⋅=
⋅=⋅⋅⋅⋅
=⋅=⋅λ=
=⋅⋅
⋅=⋅=
⋅=⋅⋅=⋅=
−
⊕
−
⊕
The solar mass M=1.989⋅1030 kg
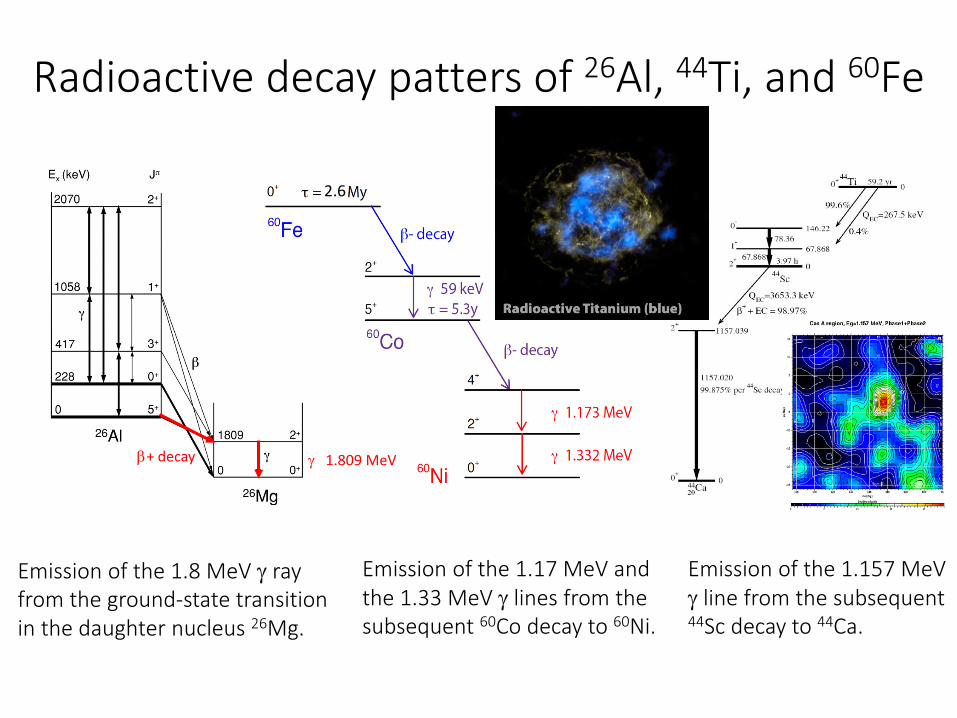
Radioactive decay patters of 26Al, 44Ti, and 60Fe
2.6
Emission of the 1.8 MeV γ ray from the ground-state transition in the daughter nucleus 26Mg.
Emission of the 1.17 MeV and the 1.33 MeV γ lines from the subsequent 60Co decay to 60Ni.
β+ decay γ 1.809 MeV
Emission of the 1.157 MeV γ line from the subsequent 44Sc decay to 44Ca.
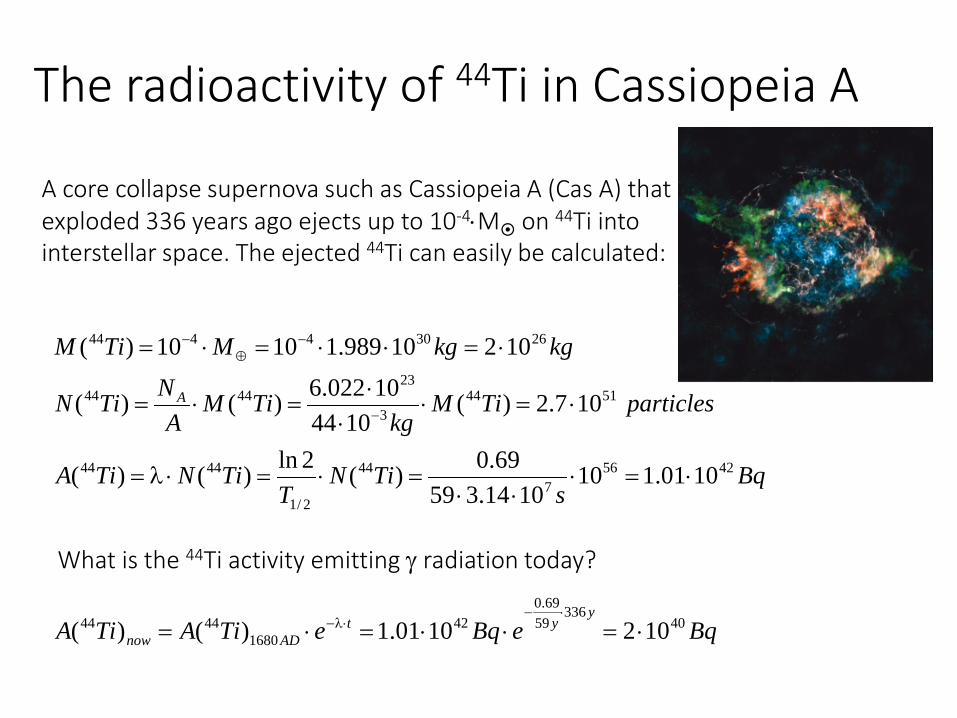
The radioactivity of 44Ti in Cassiopeia A
A core collapse supernova such as Cassiopeia A (Cas A) that exploded 336 years ago ejects up to 10-4⋅M on 44Ti into interstellar space. The ejected 44Ti can easily be calculated:
BqeBqeTiATiA
Bqs
TiNT
TiNTiA
particlesTiMkg
TiMA
NTiN
kgkgMTiM
yyt
ADnow
A
40336
5969.0
421680
4444
42567
44
2/1
4444
51443
234444
26304444
1021001.1)()(
1001.1101014.359
69.0)(2ln)()(
107.2)(1044
10022.6)()(
10210989.11010)(
⋅=⋅⋅=⋅=
⋅=⋅⋅⋅
=⋅=⋅λ=
⋅=⋅⋅
⋅=⋅=
⋅=⋅⋅=⋅=
⋅−⋅λ−
−
−⊕
−
What is the 44Ti activity emitting γ radiation today?
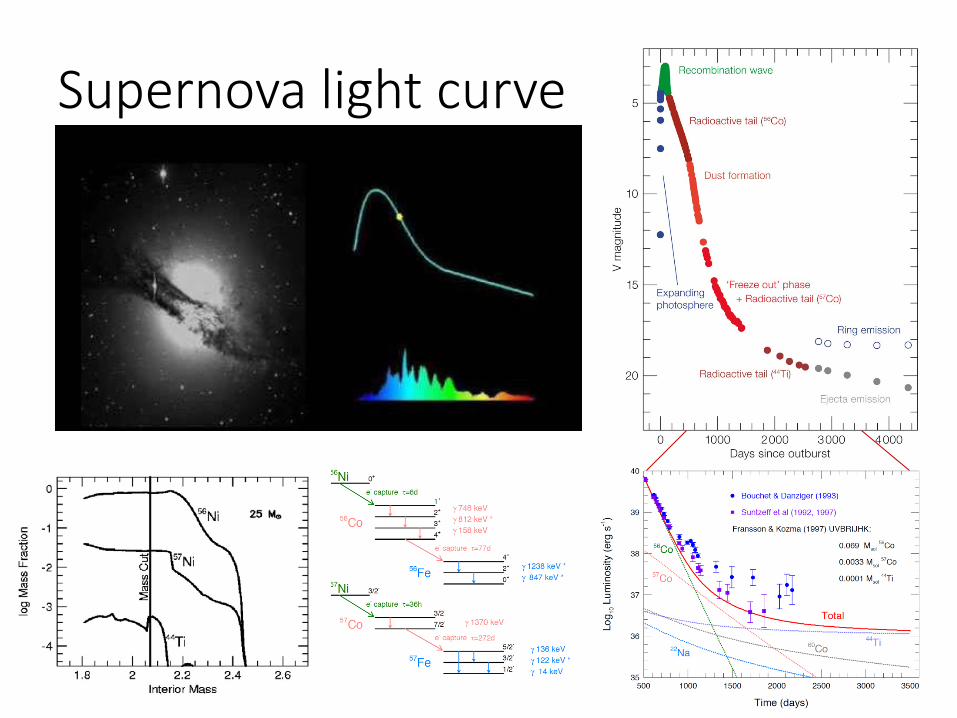
Supernova light curve
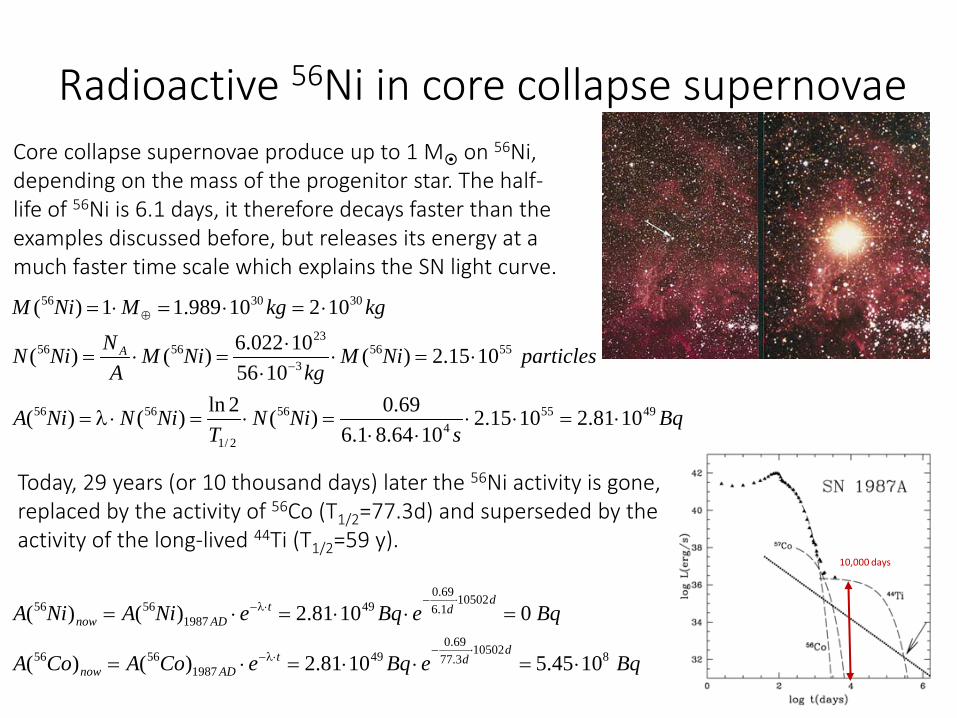
Radioactive 56Ni in core collapse supernovae Core collapse supernovae produce up to 1 M on 56Ni, depending on the mass of the progenitor star. The half-life of 56Ni is 6.1 days, it therefore decays faster than the examples discussed before, but releases its energy at a much faster time scale which explains the SN light curve.
BqeBqeCoACoA
BqeBqeNiANiA
Bqs
NiNT
NiNNiA
particlesNiMkg
NiMA
NNiN
kgkgMNiM
ddt
ADnow
ddt
ADnow
A
8105023.7769.0
491987
5656
105021.669.0
491987
5656
49554
56
2/1
5656
55563
235656
303056
1045.51081.2)()(
01081.2)()(
1081.21015.21064.81.6
69.0)(2ln)()(
1015.2)(1056
10022.6)()(
10210989.11)(
⋅=⋅⋅=⋅=
=⋅⋅=⋅=
⋅=⋅⋅⋅⋅
=⋅=⋅λ=
⋅=⋅⋅
⋅=⋅=
⋅=⋅=⋅=
⋅−⋅λ−
⋅−⋅λ−
−
⊕
Today, 29 years (or 10 thousand days) later the 56Ni activity is gone, replaced by the activity of 56Co (T1/2=77.3d) and superseded by the activity of the long-lived 44Ti (T1/2=59 y).
10,000 days
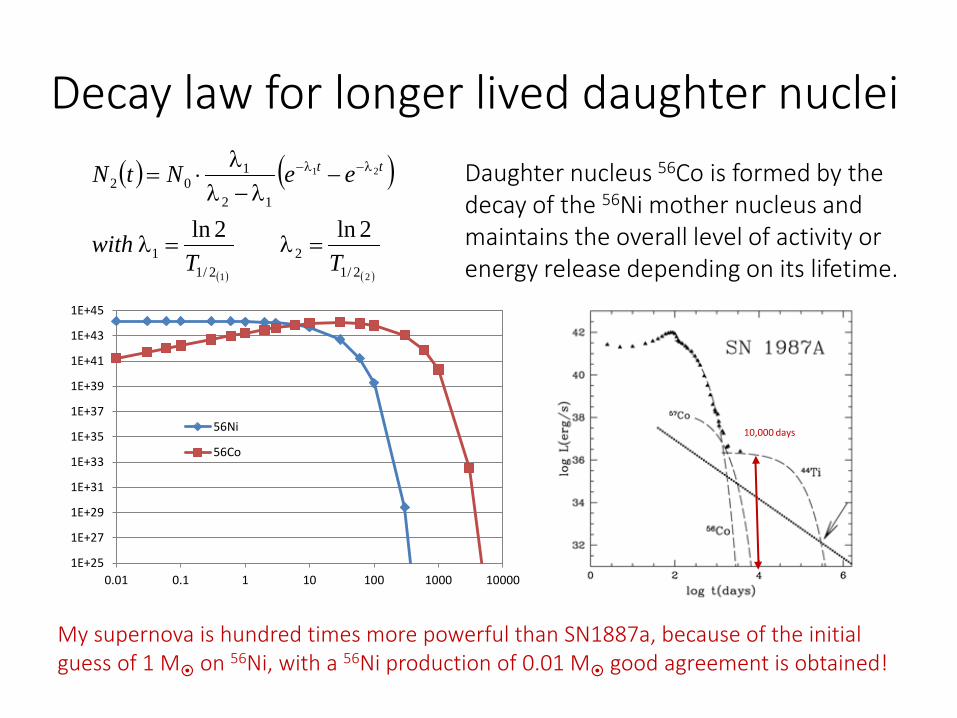
Decay law for longer lived daughter nuclei
10,000 days
1E+25
1E+27
1E+29
1E+31
1E+33
1E+35
1E+37
1E+39
1E+41
1E+43
1E+45
0.01 0.1 1 10 100 1000 10000
56Ni
56Co
( ) ( )
( ) ( )21
21
2/12
2/11
12
102
2ln2lnTT
with
eeNtN tt
=λ=λ
−λ−λ
λ⋅= λ−λ− Daughter nucleus 56Co is formed by the
decay of the 56Ni mother nucleus and maintains the overall level of activity or energy release depending on its lifetime.
My supernova is hundred times more powerful than SN1887a, because of the initial guess of 1 M on 56Ni, with a 56Ni production of 0.01 M good agreement is obtained!
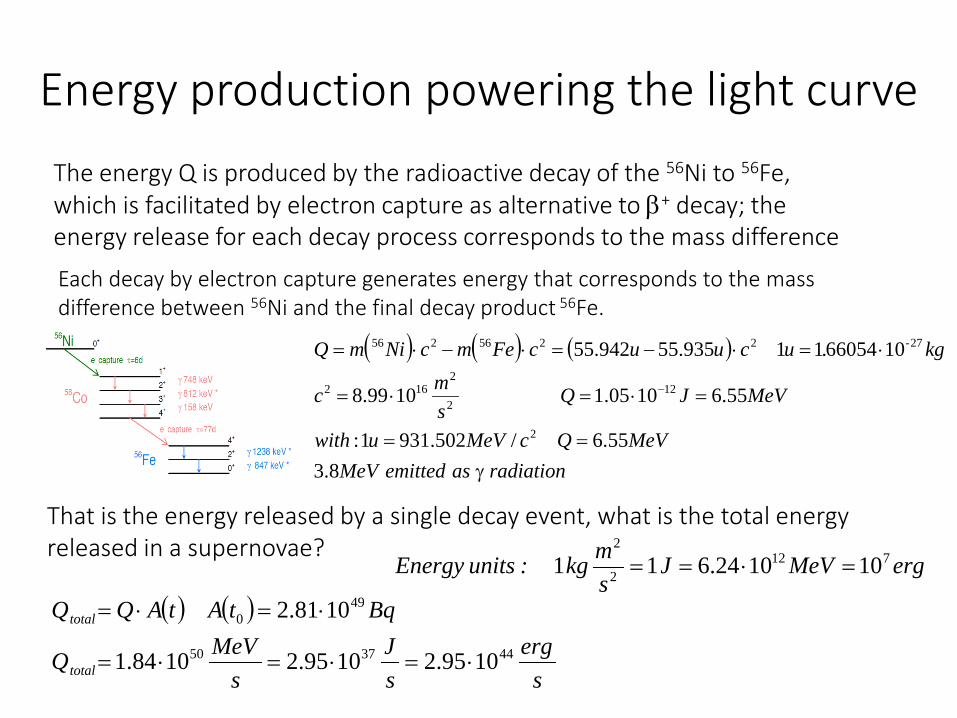
Energy production powering the light curve
Each decay by electron capture generates energy that corresponds to the mass difference between 56Ni and the final decay product 56Fe.
The energy Q is produced by the radioactive decay of the 56Ni to 56Fe, which is facilitated by electron capture as alternative to β+ decay; the energy release for each decay process corresponds to the mass difference
( ) ( ) ( )
radiationasemittedMeVMeVQcMeVuwith
MeVJQsmc
kg.ucuucFemcNimQ -
γ==
=⋅=⋅=
⋅=⋅−=⋅−⋅=
−
8.355.6/502.9311:
55.61005.11099.8
106605411935.55942.55
2
122
2162
272256256
That is the energy released by a single decay event, what is the total energy released in a supernovae?
( ) ( )
serg
sJ
sMeVQ
BqtAtAQQ
total
total
443750
490
1095.21095.21084.1
1081.2
⋅=⋅=⋅=
⋅=⋅=
ergMeVJsmkg :unitsEnergy 712
2
2
101024.611 =⋅==
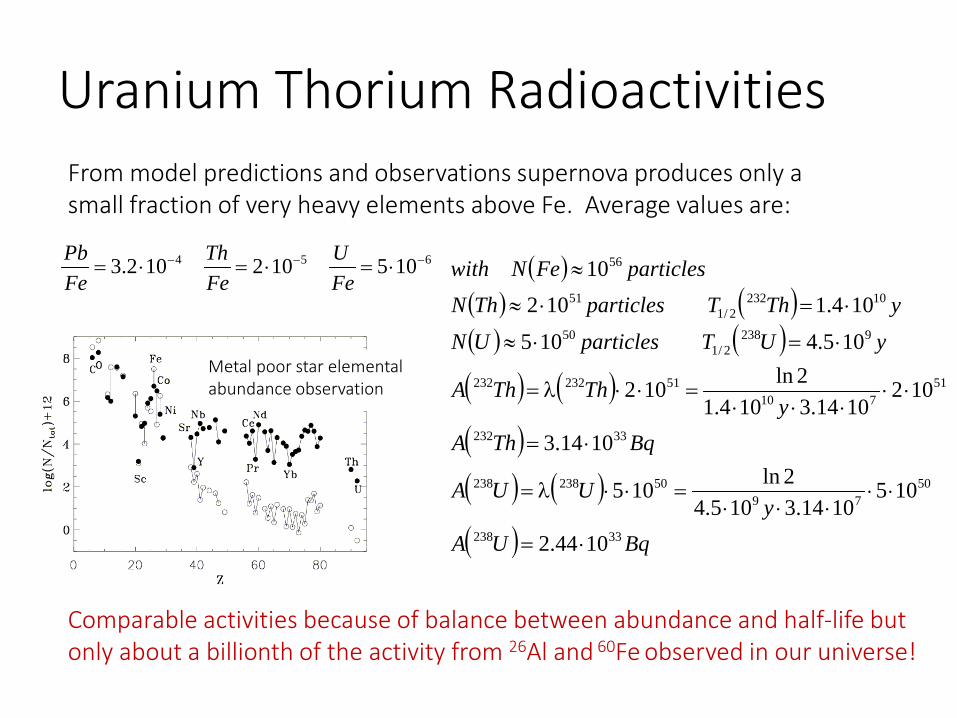
Uranium Thorium Radioactivities From model predictions and observations supernova produces only a small fraction of very heavy elements above Fe. Average values are:
654 105102102.3 −−− ⋅=⋅=⋅=FeU
FeTh
FePb
Metal poor star elemental abundance observation
( )( ) ( )( ) ( )( ) ( )( )( ) ( )( ) BqUA
yUUA
BqThAy
ThThA
yUTparticlesUNyThTparticlesThN
particlesFeNwith
33238
5079
50238238
33232
51710
51232232
92382/1
50
102322/1
51
56
1044.2
1051014.3105.4
2ln105
1014.3
1021014.3104.1
2ln102
105.4105
104.110210
⋅=
⋅⋅⋅⋅⋅
=⋅⋅λ=
⋅=
⋅⋅⋅⋅⋅
=⋅⋅λ=
⋅=⋅≈
⋅=⋅≈
≈
Comparable activities because of balance between abundance and half-life but only about a billionth of the activity from 26Al and 60Fe observed in our universe!