Embed Size (px)
Citation preview

Radioactivity
Lecture 11 The radioactive Earth

The Violent Beginning Most of the planet’s radioactivity was generated in neutron driven nucleosynthesis processes in previous star generations and implemented on earth during the early phases of the formation of the solar system and the subsequent Hadean phase of asteroid bombardment.

Formation of the solar system Gravitational contraction of pre-solar cloud Possible inducement by near-by supernova shock Rotation induced orbital momentum forms disk Forming of dust particles and planitesimals by accretion Collision and accretion probability increases with contraction Inner planets were formed by less volatile heavy elements. Outer planets accumulated gases and ices at lower temperature With increasing masses planets changed orbits sweeping space Outer regions of solar system contains belt of original material Asteroid analysis gives information about initial composition
Sedimentation of Material in Early Earth
Heavy materials sink to the bottom due to gravitation, sedimentation, and centrifugation and form Fe-Ni core, a chemical incompatible layer of actinide elements forms around it!

The earth radius is 6370 km, the surface area is 5.1⋅108 km2. The average density of earth material is ρ=5.5 g/cm3. The average density of the surface material is 2.5 g/cm3. The crust thickness ranges between 30 km to 50 km only. That means that that core density must be substantially higher and can be estimated to ρ≈12-14 g/cm3 . This is four times the density of granite and twice as dense as iron.
Earth from Space and Earth Parameters

The inner Earth Structure
Temperature within Earth increases with depth. Highly viscous or molten rock at temperatures between 650 to 1,200 °C (1,202 to 2,192 °F) is expected at depths of 50 to 60 miles. The temperature at the Earth's inner core/outer core boundary, around 2,200 miles deep, is estimated to be 5650 ± 600 K. The heat content of the earth is 1031 J.
1 mile

Reminder - Decay Chains Enrichment of Uranium and Thorium exists in specific geological stone or mineral configurations, such as granite or shale. This causes a sequence of decays with the timescale dictated by the slowest decay, in these cases 232Th and 238U.
Thorium series: n=10 decays Uranium series: n=14 decays Average energy release: 3.5 MeV
Earth Surface 1 Mile deep

Radioactive elements near Earth core
Isotope Heat release [W/kg isotope]
Half-life [years]
Mean mantle concentration [kg isotope/kg]
Heat release [W/kg]
238U 9.75 × 10⁻⁵ 4.47 × 10⁹ 30.8 × 10⁻⁹ 3.00 × 10⁻¹² 235U 5.69 × 10⁻⁴ 7.04 × 10⁸ 0.22 × 10⁻⁹ 1.25 × 10⁻¹³
232Th 2.64 × 10⁻⁵ 1.40 × 10¹⁰ 124 × 10-9 3.27 × 10⁻¹² 40K 2.92 × 10⁻⁵ 1.25 × 10⁹ 36.9 × 10⁻⁹ 1.08 × 10⁻¹²
Radioactive potassium, uranium and thorium are thought to be the three main sources of heat in the Earth's interior, aside from that generated by the formation of the planet. Together, the heat keeps the mantle actively churning and the core generating a protective magnetic field as we will see in the next lecture.
( )( )
( )
isotopekgW
kgWQWQ
isotopekgparticlesUNJMeV
WsJ
sMeV
yMeVMeV
yUQ
14)(n chaindecay in decays of numbernUQnQQNQAQ
totaldecay
decaydecaydecaytotal
5292429
242323813
303017109
238
238
1075.91085.31053.21085.3
1053.210022.6238
1000106.11
1075.21075.2107.1104.55.3105.42ln
−−−
−
−−−−
⋅=⋅⋅⋅=⋅=⋅λ
⋅=⋅⋅=⋅=
⋅=⋅=⋅=⋅=⋅⋅
=⋅λ
=≡⋅=⋅⋅λ=⋅=

Neutrino Signal
Neutrino production associated with β-decay of radioactive elements e.g. 234Th⇒234Pa+β-+ν⇒234U+β+ν Neutrinos/anti-neutrinos are measured in underground detector arrays such as Kamland (Kamioka, Japan and Borexino (Gran Sasso, Italy)
_ _
to check the radioactivity conditions inside earth
KAMLAND
BOREXINO
Reminder: Neutrinos are weak interacting neutral particles associated with β decay!

Geologically significant anti-neutrino sources
Terrestrial Neutrinos are measured with underground detectors in Units TNU:
The chondritic Th/U mass ratio is 3.9
Geo-neutrinos
Reactor-neutrinos
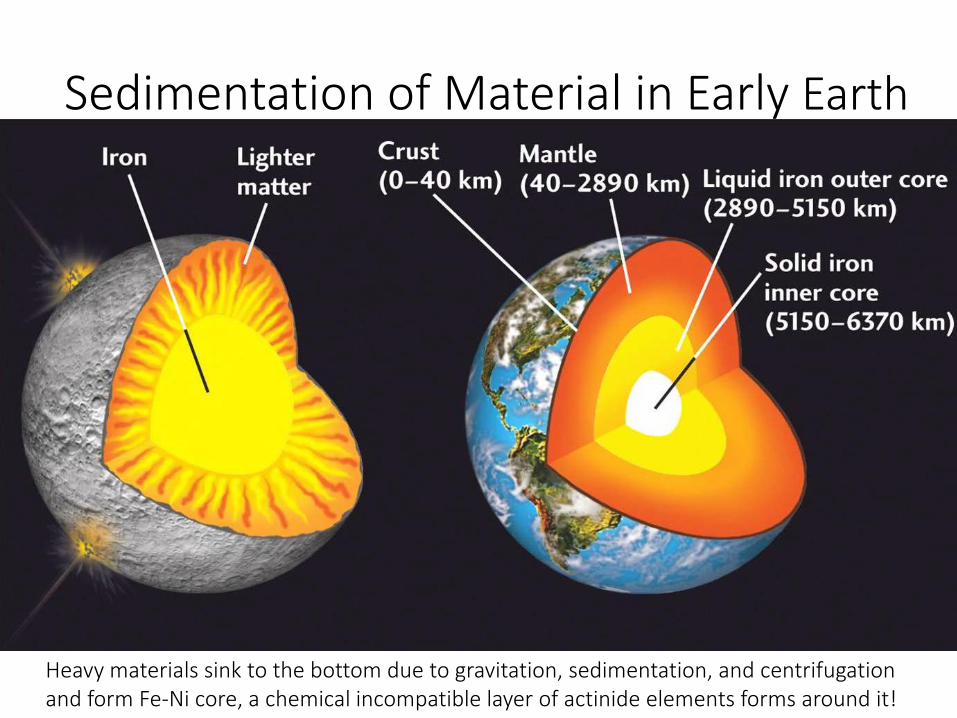
A world-wide flux map combining geoneutrinos from natural 238U and 232Th decay in the Earth’s crust and mantle as well as
manmade reactor- emitted by power reactors worldwide.

A world-wide flux map of neutrinos emitted by power reactors worldwide

The distribution of radioactivity in Earth Aktivity [1024 Bq] Heat [1012 W] Isotope 40K 232Th 238U 40K 232Th 238U Earth Core 2 - - 0,5 - - Earth Mantle 27 10 10 6 5 6 Asthenosphere 0.5 1 1 0.5 1 1 Total 30 11 11 7 6 7
What determines the radioactivity at the surface and in the crust?
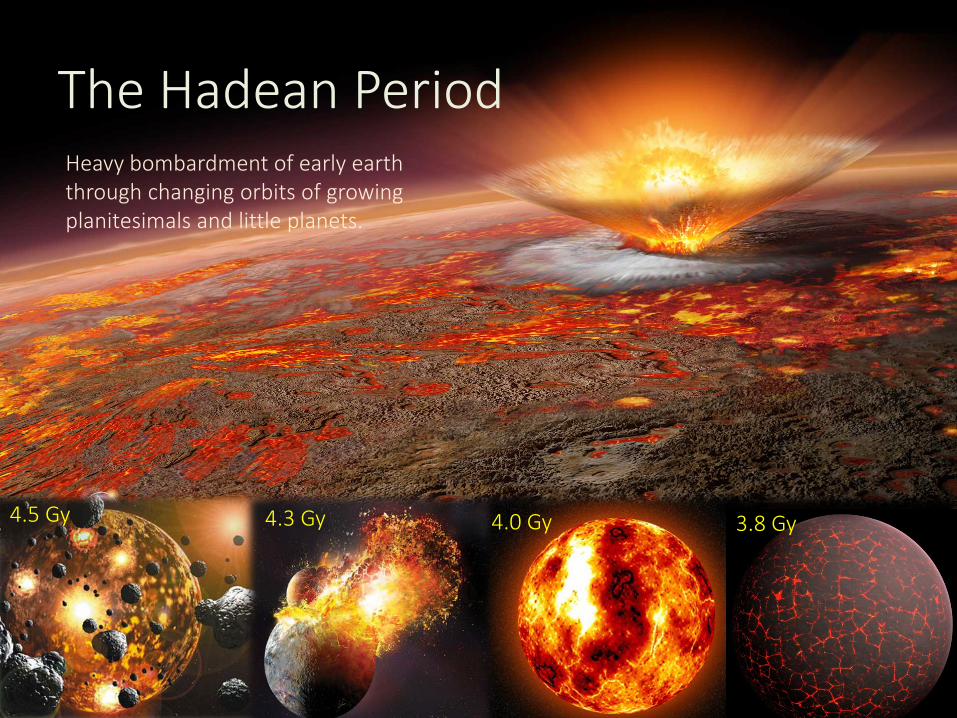
The Hadean Period
4.5 Gy 3.8 Gy 4.0 Gy 4.3 Gy
Heavy bombardment of early earth through changing orbits of growing planitesimals and little planets.

The Hadean Age Determinations S Marchi et al. Nature 511, 578-582 (2014) doi:10.1038/nature13539
Mass accreted by the Earth during the late accretion phase.
Decline of accretion rate and size of accreted bodies with time
Crater impact on earth surface
Zircon ages (coloured curves correspond to different data sets: orange, 207Pb–206Pb ages; blue, U–Pb ages; green, 207Pb–206Pb ages; red, U–Pb ages) show a distinct peak at 4.0–4.2 Gyr ago. In agreement with simulations.
Planet wide melting and mixing of surface and asteroid materials the earlier composition vanished
Oldest known mineral Zircon 4.4 Gy crystalized after cooling contains

-235 0.018
Thorium and Uranium Abundant in the Earth’s Crust

Elemental Abundance Distribution on Earth Surface
40K The naturally occurring radioactive elements have an abundance of 10/106 atoms of Si or 0.001%, this is comparable with the abundance of rare earth and substantially higher than precious metals!

Earth Crust Activity By combining the volume of the earth crust with the density one can derive the average mass of the crust (depending on assumptions on crust thickness and density.
( ) ( )( )( )( )
kgtonsgVMcm
g
cmkmV
drrrrVVV
shell
eeieeinnerspherearthshell
2219253
32531033
3333
1051051055.2
102100.2406370637034
34
34
⋅=⋅=⋅=⋅ρ=⇒=ρ
⋅=⋅=−−⋅π=
−−⋅π=−⋅π=−=
One can calculate the average radiation load distributed over the earth crust M(232Th)=10 g/ton M(238U)=2.5 g/ton M(40K)=16800⋅0.00021 g/ton= 3.53 g/ton
( ) ( ) ( )
( ) ( ) ( ) ( ) particlesKNUNThMThN
gKMgUMgtonstons
gThM
4240412384223
232232
2040202382019232
107.2102.3103.1232
10022.6
1077.11025.110510510
⋅=⋅=⋅=⋅
⋅=
⋅=⋅=⋅=⋅⋅=
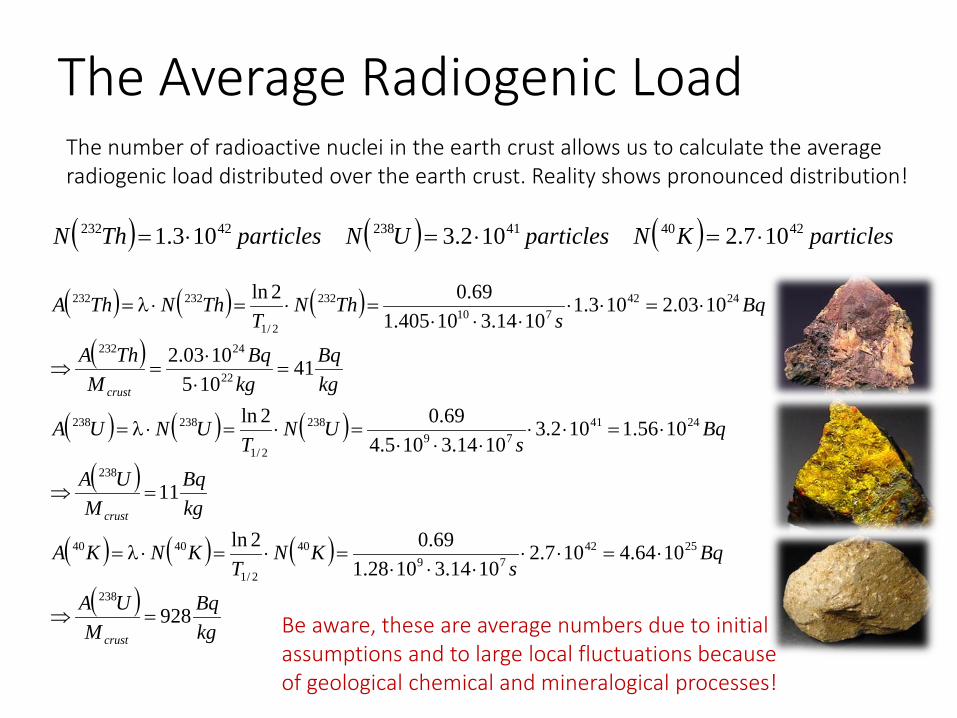
The Average Radiogenic Load The number of radioactive nuclei in the earth crust allows us to calculate the average radiogenic load distributed over the earth crust. Reality shows pronounced distribution!
( ) ( ) ( )( )
( ) ( ) ( )( )
( ) ( ) ( )( )
kgBq
MUA
Bqs
KNT
KNKA
kgBq
MUA
Bqs
UNT
UNUA
kgBq
kgBq
MThA
Bqs
ThNT
ThNThA
crust
crust
crust
928
1064.4107.21014.31028.1
69.02ln
11
1056.1102.31014.3105.4
69.02ln
41105
1003.2
1003.2103.11014.310405.1
69.02ln
238
254279
40
2/1
4040
238
244179
238
2/1
238238
22
24232
2442710
232
2/1
232232
=⇒
⋅=⋅⋅⋅⋅⋅
=⋅=⋅λ=
=⇒
⋅=⋅⋅⋅⋅⋅
=⋅=⋅λ=
=⋅⋅
=⇒
⋅=⋅⋅⋅⋅⋅
=⋅=⋅λ=
( ) ( ) ( ) particlesKNparticlesUNparticlesThN 42404123842232 107.2102.3103.1 ⋅=⋅=⋅=
Be aware, these are average numbers due to initial assumptions and to large local fluctuations because of geological chemical and mineralogical processes!

What is the impact of the radioactive Earth? Mantle Convection
Tectonic Drift
Volcanic Activity
Natural Reactors
High Dose Areas
Radon exposure
Ramsar
Guarapari


![arXiv:1908.11458v1 [nucl-ex] 29 Aug 2019P. Belli et al.: Experimental searches for rare alpha and beta decays 3 MeV for 212Po in the 232Th chain).The released energy is shared between](https://img.pdfslide.net/doc/110x75/60a6ea3b8f8361752972be50/arxiv190811458v1-nucl-ex-29-aug-2019-p-belli-et-al-experimental-searches.jpg)