Embed Size (px)
Citation preview

Lecture 12: Corporate taxation
Antoine Bozio
Paris School of Economics (PSE)
Ecole des hautes etudes en sciences sociales (EHESS)
Master APE and PPDParis – December 2018
1 / 142

Firms in tax policy
� Firms are ubiquitous in tax debate� e.g., “taxes harm business”� e.g., “corporations should pay their fair share”
� Firms are largely absent of tax theory� Firms are just mechanical vehicles to combine inputs into
outputs (Diamond and Mirrlees, 1971)
� Firms remit most taxes� 90% of taxes are remitted by firms in OECD countries
(OECD, 2017)� Optimal taxation should depend on enforcement structure
(Kopczuk and Slemrod, AER 2006)
� Extreme equity-efficiency trade-off� Equities highly concentrated in top incomes� Investment decisions matter highly for growth
2 / 142

Opposite views in the debate
1 Corporate taxes as tax on top incomes� Equities highly concentrated in top incomes/top wealth� CIT to reduce tax avoidance on income tax� Dramatic increase in inequality fueled by untaxed corporate
profit
2 Corporate taxes as inefficient tax on labour� CIT largely shifted to workers� CIT hinders investment hence growth� Cutting CIT is efficient and benefit large shares of the
population
3 / 142

Firm taxation
1 Taxes on individual payout� Income tax on dividends, interest income� Capital gains tax
2 Taxes on firms’ profits� Corporate income tax (CIT)� Income tax on non-incorporated firms
3 International tax provisions� Transfer pricing� Tax havens
4 / 142

Outline of the lecture
I. Institutions
1 What are corporations ?2 Why corporate taxes ?3 Typology of corporation taxes4 Fiscal facts
II. Incidence
1 Shareholder approach2 Closed economy : Harberger model3 Open economy case4 Empirical evidence
5 / 142

Outline of the lecture
III. Efficiency costs
1 Investment decisions2 Payouts decisions3 Elasticity of corporate taxable income
IV. Policies
1 Research tax credits2 Tax base reforms3 How to avoid race to the bottom ?
6 / 142

I. Institutions
1 What are corporations ?
2 Why tax firms ?
3 Typology of corporate taxation
4 Trends in firm taxation
7 / 142

What are corporations ?
� Definition� A corporation is a legal entity separate from the persons
that form it� Owners of a corporation are called shareholders
� Corporate firms : limited liability� Shareholders are not required to use their personal assets
to pay the debt of a failed company� They can only lose the amount they have invested
⇒ Corporate firms subjected to corporate tax
� Non corporate firms� Liability for non corporated firms is linked to firm’s owners
i.e., liable for any outstanding debt on their personal wealth
⇒ Non-corporate firms subjected to personal income tax
8 / 142

Why have corporation tax ?
1 Corporation tax as a benefit tax� Limited liability status as major benefit� State insurance for ‘too big to fail’� Other benefits (infrastructure, education, etc.)
2 Backstop for personal income taxation� In order to escape income taxation, individuals could
accumulate earnings tax-free within the corporation� Similar problem with capital gains� Corporate taxation is a way to limit income tax avoidance
3 Taxation of pure profit or rents� Returns that exceed the return to both labour and capital
e.g., rent from extracting oil� Pure profit taxation does not distort investment decisions� Hence low efficiency cost of taxing rents
9 / 142

Corporate income tax (CIT)
� CIT schedule� Statutory corporation tax rate τcit� Corporate tax base Y = [Revenues - Expenses]
CIT = τcitY − ITC − RTC
� Revenues are sales of goods and services
� Investment tax credit (ITC)� A tax credit amounting to a percentage of the firm’s
qualified investment expenditures� Equivalent to accelerated depreciation
� Research tax credit (RTC)� RTC is based on R&D spending, and can lead to negative
CIT (i.e., subsidy to R&D)
10 / 142

CIT tax base : expenses
1 Current costs C� compensation to employees� intermediate inputs
2 Depreciation costs, Dep� Economic depreciation : capital investments lose value over
time� Depreciation allowances are legally specified in CIT
e.g., 5 years depreciation for computerse.g., 30 years for building
3 Financing costs (return on capital)� Interest payments, I� Opportunity cost of equity, OCE
11 / 142

Corporate income tax systems
� Three dimensions of corporation taxes
1 Income included in the tax base2 Location of the tax base3 Relationship with personal income taxation
12 / 142

Corporate income tax systemsIncome included in the tax base
1 Full return to equity� Tax base includes equity finance
Y = R − (C + Dep + I )
2 Full return to capital� Debt is treated like equity finance and not deducted
Y = R − (C + Dep)
3 Economic rent� Both debt and equity finance are deducted
Y = R − (C + Dep + I + OCE )
13 / 142

Corporate income tax systemsLocation of the tax base
1 Source-based taxation� Tax base = corporate income earned in the country where
productive activity takes place� ‘Tax on investment’
2 Residence-based taxation (corporate shareholders)� Tax base = corporate income earned in the residence
country of the corporate headquarters or the residence ofshareowners
� ‘Tax on savings’
3 Destination-based taxation� Tax base = corporate income earned in the country where
the goods and services are consumed
14 / 142

Corporate income tax systemsRelationship with personal income
1 Classical system� Tax liability of companies completely separated from tax
liabilities of individual shareholders� No relief for distributed profits (dividends)� “Double taxation” of dividends : once through the
corporation tax, once as income of the shareholders
2 Imputation system� Shareholders receive credits for the corporation tax paid on
distributed profit.� “Full imputation” means all the domestic corporation tax
paid on distributed profits is credited to shareholders
15 / 142

Corporate income tax systems
Table 1: Classical vs imputation system
Classical Imputation
CorporationProfits before tax e1000 e1000CIT 30% e300 e300Profits after tax e700 e700
ShareholderDividend income e700 e700Imputed CIT - e300Taxable income e700 e1000
Income tax 40% e280 e400Tax credit for CIT - e300Net income e420 e600
Total tax paid e580 e400
16 / 142

Table 2: Characterizing corporate income tax systems
Type of income subject to business tax
Location of Full return Full return Renttax base to equity to capital
Source country 1. Conventional CIT 4. Dual income tax 6. CIT with Allowancewith exemption of for corporate equity
foreign source income 5. Comprehensive 7. Source-based cashBusiness income tax flow tax
Residence country 2. Residence-based CITof corporate head office with credit for
foreign tax
Residence country 3. Residence-basedof personal shareholder shareholder tax
Destination country 8. Full destination-of final consumption based cash flow tax
9. VAT-typedestination-based
cash flow tax
Source : Devereux and Sørensen (2006), Tab. 1, p. 24.
17 / 142

Trends in corporate taxationTrend 1 : Decrease in statutory corporate tax rates
� Large cuts in the 1980s
Ireland from 45% to 10% in 1981U.K. from 50% to 35% in 1983-86U.S. from 50% to 38% in 1986
Sweden from 57% to 30% in 1989-91
� Recent cut in statutory CIT
U.K. cut from 30% to 19% and planed cut to 17% (by 2020)U.S. cut from 38.9% to 25.7% (Tax Cuts and Jobs Act, TCJA)
France planed cut from 33.3% to 25% by 2022Sweden announced cut from 22% to 20%
Belgium announced cut from 29.6% to 25%
18 / 142

Trends in corporate taxation
Figure 1: Statutory rates in corporate tax
0%
10%
20%
30%
40%
50%
60%
70%
1980 1985 1990 1995 2000 2005 2010 2015 2020
France U.K.
Germany Ireland
Netherlands Sweden
U.S. OECD (unweighted)
Source : Devereux, Griffith and Klemm (2002) ; OECD.stat from 2005 to 2018 ; planned changes up to 2020. 19 / 142

Trends in corporate taxationTrend 2 : Decrease in depreciation allowances
� Broadening of the tax base while reduction in rates� Present discounted value (PDV) of allowances for
investment reduced from 90-100% to 60-70%� In particular in the U.K. in the 1980s
� Increase in R&D allowances� Introduction of research tax credit (RTC)
20 / 142

Trends in corporate taxation
Figure 2: PDV of depreciation allowances
60%
65%
70%
75%
80%
85%
90%
95%
100%
105%
1979 1984 1989 1994 1999 2004
France
UK
Germany
US
Source : Devereux, Griffith and Klemm (2002), updated 2005. 21 / 142

Trends in corporate taxationTrend 3 : Little evidence of decrease in tax revenues
� High volatility� CIT represents between 1.5% to 3% of GDP� Corporation tax revenues have high volatility� Decrease during recession and increases during boom
� Little decrease in tax revenues (except in the U.S.)� Decrease in the U.S. during the 1960s and 1970s due to
declined in profitability (Auerbach and Poterba, 1987)� No decrease in the U.K. with increased profitability
(financial sector)� Little decrease in the E.U. (Devereux and Sørensen, 2006)
22 / 142

Trends in corporate taxation
Figure 3: CIT revenues as a share of GDP (OECD unweightedaverage)
0
0,5
1
1,5
2
2,5
3
3,5
4
4,5
5
1965 1970 1975 1980 1985 1990 1995 2000 2005 2010
Source : OECD Revenue Statistics
23 / 142

Trends in corporate taxation
Figure 4: Corporate taxation as a share of GDP
0
0,5
1
1,5
2
2,5
3
3,5
4
4,5
5
1965 1970 1975 1980 1985 1990 1995 2000 2005 2010
France
Germany
United Kingdom
United States
Source : OECD Revenue Statistics
24 / 142

Effective tax rates
� Statutory corporate tax rates do not reflect the likely impactof the tax on investment
� Effective tax rates (ETR) try to account for all thedeductions and credits
ETR =r g − rn
r g
with r g and rn the rate of return gross and net of taxes
� Investment credit or high rate of depreciation reduce thedifference between the gross and net rate of return
� ETR can even be negative
25 / 142

Effective tax rates
Figure 5: Effective tax rates
0%
5%
10%
15%
20%
25%
30%
35%
40%
45%
50%
1979 1984 1989 1994 1999 2004
France
UK
Germany
US
Source : Devereux, Griffith and Klemm (2002), updated.
26 / 142

Trends in corporate taxationTrend 4 : Increase in tax avoidance and evasion
Figure 6: Share of Tax Havens in U.S. Corporate Profits MadeAbroad
Source : Zucman (2014), Fig. 2.
27 / 142

II. Incidence of corporate taxation
� Remittance vs. incidence� Firms remit large amount of taxes
e.g., CIT, SSCs, VAT, income tax, etc.� Economic incidence is about change in individual welfare� Corporations don’t pay taxes !
� Individuals potentially “paying” CIT
1 Capital owners (through lower profits)2 Workers (through lower wage)3 Consumers (through higher prices)
� One of the most contentious debate of tax policy !
28 / 142

II. Incidence of corporate taxation
1 Initial approach : assignment of ownership
2 Closed economy : Harberger model
3 Open economy case
4 Empirical approaches
29 / 142

Shareholder incidence theory
� Simplest and oldest theory� CIT falls on corporate shareholders in proportion of their
ownership� With this theory, CIT is very progressive� Individual share ownership highly concentrated
e.g., U.S. top 0.01% wealth, equity = 45%e.g., U.S. bottom 90% wealth, equity = 1%
� Assignment not so simply applied� Different class of shares, with different rights to firms’
income� Indirect holding of equity (through other corporations,
retirement funds, etc.)
30 / 142

Closed economy : Harberger model
� Harberger (JPE, 1962)� A static GE model in a closed economy� Two sectors : corporate X and non-corporate Y� Two factors : labour L and capital K� Pioneering work in GE incidence
� Main assumptions
1 Fixed supply of factors (short-run, closed economy)2 Free factor mobility across sectors3 Full employment of factors4 Constant returns to scale in both production sectors5 Perfect competition
� See Atkinson and Stiglitz (1980, chap. 6) or Kotlikoff andSummers (1987, 2.2)
31 / 142

Closed economy : Harberger model� Full employment condition
cLXX + cLYY = L0 (1)
cKXX + cKYY = K0 (2)
� Perfect competition (prices equals to marginal cost)
pX = cX (r ,w) (3)
pY = cY (r ,w) (4)
� Demand functions
X = X (pX , pY ,M) (5)
Y = Y (pX , pY ,M) (6)
� 6 unknowns, 6 equations32 / 142

Closed economy : Harberger model
1 Changes in demand relates to changes in price ratio
X − Y = −σD(pX − pY ) (7)
� σD is the aggregate elasticity of substitution in demands
2 Changes in relative product prices to changes in factor prices
pX − pY = θ∗(w − r) (8)
� θLX is the share of labour in sector X� θ∗ = θLX − θLY is a measure of factor intensity in terms of
factor shares� If X is labour intensive (θ∗ > 0) then a rise in the relative
factor prices (wr ) causes a rise in its relative price ( pXpY )
33 / 142

Closed economy : Harberger model
3 Changes in quantities to changes in relative factor prices
λ∗(X − Y ) = (w − r)(αXσX + αYσY ) (9)
� σX is the elasticity of substitution in sector X� λLX is the share of labour force L0 in sector X� λ∗ = λLX − λKX is a measure of factor intensity in terms
of physical inputs� If X is labour intensive (λ∗ > 0) then a rise in output of X
relative to Y is associated with a rise in the wage relativeto the rate of profit
34 / 142

Closed economy : Harberger model
� Increase in CIT� Assume small tax dτ on capital in sector X� Harberger assumes that CIT is an additional tax on capital
income from corporate sector on top of income tax
1 Factor substitution effect : capital bears the tax� Depending on elasticity of substitution between capital and
labour (σX > 0)� Tax shifts production in sector X away from K� Aggregate demand for K decreases� As K is fixed, r decreases⇒ capital bears the burden of the tax
35 / 142

Closed economy : Harberger model2 Output effect : capital may not bear the tax
� Shift of demands towards other sector Y� Consequences for factor demands depend on relative factor
intensities
(a) If X capital intensive� it reduces demand for capital� capital bears more of the tax
(b) If X labour intensive� it increases demand for capital� labour may bear some or all the tax
3 Substitution + output effects : overshifting effects� If corporate sector capital intensive, could lead to more
than 100% incidence (overshifting)� If corporate sector labour intensive, could lead to all
incidence on labour⇒ Taxed factor may bear less than 0 or more than 100%of tax
36 / 142

Closed economy : Harberger model
37 / 142

Closed economy : Harberger model
� A deceptive theoretical results� In the Harberger model “anything goes”� Ultimate incidence depends on all the set of elasticities
� Harberger’s estimations� Application in the case of two sectors (housing and
corporate)� Estimates with plausible parameters for the U.S.– “plausible alternative sets of assumptions about the
relevant elasticities all yield results in which capital bearsvery close to 100 per cent of the tax burden” (Harberger,1962, p.234)
38 / 142
Closed economy : Harberger model
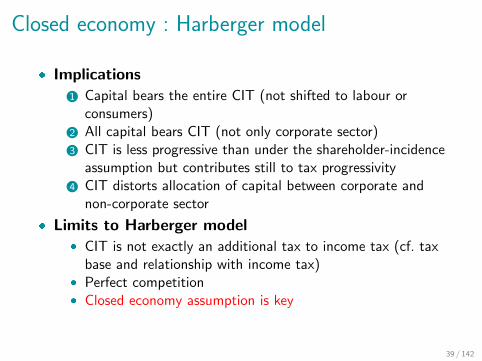
� Implications
1 Capital bears the entire CIT (not shifted to labour orconsumers)
2 All capital bears CIT (not only corporate sector)3 CIT is less progressive than under the shareholder-incidence
assumption but contributes still to tax progressivity4 CIT distorts allocation of capital between corporate and
non-corporate sector
� Limits to Harberger model� CIT is not exactly an additional tax to income tax (cf. tax
base and relationship with income tax)� Perfect competition� Closed economy assumption is key
39 / 142

Open economy case
� Small open economy� Survey by Kotlikoff and Summers (HPE, 1987, section 3.1)� Assume that capital is mobile internationally and labour
immobile� Sector 1 (small open economy), L1 fixed, and K1 mobile� Sector 2 (rest of the world), L2 fixed, and K2 mobile� Total capital K = K1 + K2 is fixed
� Introduction of tax on capital K1
� After-tax returns must be equal
r∗ = F2K = (1− τ)F1K
� Capital moves until after-tax returns are equal⇒ Labour bears all the tax burden
40 / 142

Incidence of corporate tax : empirical evidence
� Limited evidence� Few variations : cross-country or local variations� Hard to identify direct effects and GE effects
� Some recent evidence� Arulampalam et al. (EER 2012) : cross-country� Suarez Serrato and Sidar (AER, 2016) : U.S. local
variations� Fuest et al. (AER, 2018) : German local variations
41 / 142

Arulampalam, Devereux and Maffini (EER, 2012)
� Empirical strategy� Look at incidence of CIT in bargaining framework� Focus on direct effect of CIT (conditional on output) on
rent bargaining� Baseline result : 50% of CIT incident on wages
� Data� Firm data from 9 countries over 1996-2005� 55,082 firms with accounting data (balance sheets, profits,
loss)
42 / 142
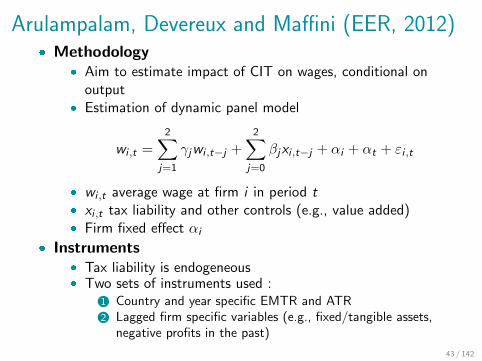
Arulampalam, Devereux and Maffini (EER, 2012)� Methodology
� Aim to estimate impact of CIT on wages, conditional onoutput
� Estimation of dynamic panel model
wi ,t =2∑
j=1
γjwi ,t−j +2∑
j=0
βjxi ,t−j + αi + αt + εi ,t
� wi ,t average wage at firm i in period t� xi ,t tax liability and other controls (e.g., value added)� Firm fixed effect αi
� Instruments� Tax liability is endogeneous� Two sets of instruments used :
1 Country and year specific EMTR and ATR2 Lagged firm specific variables (e.g., fixed/tangible assets,
negative profits in the past)
43 / 142

Arulampalam, Devereux and Maffini (EER, 2012)
� Estimation� FE estimator with firm dummies is inconsistent� First difference removes FE� Estimate first diff. equation with generalized method of
moment (GMM) and system estimator� Very demanding in terms of data structure
� Results� Headline elasticity are -0.120 in the short run and -0.093 in
the long run� In terms of incidence : 64% and 49% of CIT on wages
44 / 142

Arulampalam, Devereux and Maffini (EER, 2012)
Figure 7: Basic specification with bargaining variables
Source : Arulampalam, Devereux and Maffini (2012), Tab. 6.
45 / 142

Arulampalam, Devereux and Maffini (EER, 2012)
Figure 8: Estimated incidence and elasticities
Source : Arulampalam, Devereux and Maffini (2012), Tab. 7.
46 / 142

Arulampalam, Devereux and Maffini (EER, 2012)
� Take-aways� About 50% of direct CIT effects (conditional on output) in
firms with wage bargaining on workers� Indirect effects of CIT should be added to direct effects� Robustness of results not obvious given identification
techniques
47 / 142

Suares Serrato and Zidar (AER, 2016)
� Overview� Open economy framework (local U.S. market)� Allow for monopolistically competitive and heterogeneously
productive firms� Spatial equilibrium with firms
� Main results� Workers bear 30-35% (compared to 100% in benchmark
case)� Firm owners bear 40%
48 / 142

Fuest, Peichl and Siegloch (AER, 2018)
� Overview� Use German local business tax (Gewerbesteuer) to
estimate incidence of corporate taxes on wages� Each year, 8% of the 11,441 municipalities change tax rate� Event study using administrative linked employer-employee
panel data
� Results� Incidence of corporate tax on wages depends on wage
setting institutions� For 1 euro increase in tax bill, wage bill grows 30 – 70
cents less� Much higher effect under wage bargaining� No wage bargaining : wage effect much smaller and close
to zero
49 / 142

Fuest, Peichl and Siegloch (AER, 2018)
� Local Business Tax (Gewerbesteuer)� Most important tax instrument for municipalities� Applies to corporate and non-corporate firms, certain
exemptions� Tax base : operating profits (federal level), same as for CIT� Basic tax rate set at the federal level (3.5 ; 5.0%)� City councils decide every year (only) on specific collection
rate (cr ; multiplier to basic tax rate, 200-500%) for nextyear
� Corporate tax (Korperschaftsteuer)� Additional tax for corporate firms� Today at 15% (so that total CIT at 30%)
� Personal Income Tax (Einkommensteuer)� Additional tax for un-incorporated firms
50 / 142

Fuest, Peichl and Siegloch (AER, 2018)
Figure 9: Cross-sectional and time variation in local tax rates
Source : Fuest, Peichl and Siegloch (2015), Fig. 1.
51 / 142

Event-study method� Principle
� Exploit multiple events (e.g., firm announcements, taxchanges)
� Include lags and leads with respect to reference year� Check endogeneity/reverse causality : no pre-trend
� Econometric specification
lnwf ,m,t =γ−b
B−t∑i=b
∆τm, t + i +a−t∑
j=−b+1
γj∆τm, t + j
+ γa
t−A∑k=a
∆τm, t − k + µm + ψm,t + εm,t
� A first data year, B is last data year� b is start of event window, a is end of event window� µ municipal FE, ψ time trends FE
52 / 142

Figure 10: Effects on firm wages
Source : Fuest, Peichl and Siegloch (2015), Fig. 2.
53 / 142
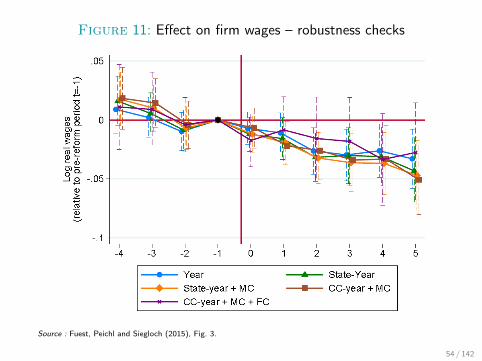
Figure 11: Effect on firm wages – robustness checks
Source : Fuest, Peichl and Siegloch (2015), Fig. 3.
54 / 142

Figure 12: Effects on wages by collective bargaining
Source : Fuest, Peichl and Siegloch (2015), Fig. 5.
55 / 142

Figure 13: Effects on wages by firm size
Source : Fuest, Peichl and Siegloch (2015), Fig. 6.B
56 / 142

Table 3: DiD estimates : baseline wage effects
(1) (2) (3) (4) (5) (6)
Log net-of-LBT rate 0.388 0.229 0.386 0.396 0.343 0.399(0.127) (0.110) (0.127) (0.128) (0.164) (0.118)
Incidence (Iw ) 0.505 0.288 0.502 0.516 0.442 0.520(0.170) (0.140) (0.170) (0.172) (0.217) (0.159)
State × year FE X X X XYear FE XCZ × year FE XMunicipal controls t-2 XFirm controls t-2 XWorker shares XObservations 44,654 44,654 44,654 44,654 25,241 44,654
Source : LBT : local business tax, CZ : commuting zone.Source : Fuest, Peichl and Siegloch (2017), Tab. 1.
57 / 142

Fuest, Peichl and Siegloch (AER, 2018)
� Take-aways� CIT partially incident on wages� Estimates of 50% shifted to workers� Lower than in GE estimates of small open economy but
larger than traditional Harberger closed economy results� It implies lower redistributivity of most tax systems
� Further results� Labour market institutions matter for incidence on wages� Effects on wages bigger for firms with firm-level bargaining
(in line with rent bargaining theory)
58 / 142

III. Efficiency costs
1 Investment decisions� Theory of user cost of capital� Cross-country evidence (Djankov et al., 2010)� Natural experiment (House and Shapiro, 2008)
2 Payouts decisions� Theory : old vs new view� Chetty and Saez (2005)� Yagan (2015)
3 Elasticity of corporate taxable income� Devereux et al. (2014)
59 / 142

Investment matters
Figure 14: Growth vs. equipment investment
Source : De Long and Summers (1992), Fig. 1.60 / 142

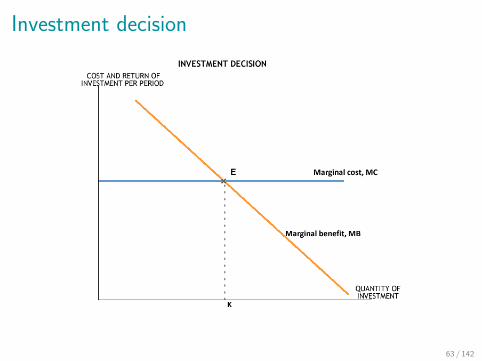
Theory of investment
� Investment decision� Determined by setting marginal benefits and costs of
investment equal on a per-period basis
� Model of firm behaviour� Firm decides how much capital Kt to accumulate� Profit function F (Kt) concave� Price of capital goods qt� Depreciation rate δ� Required rate of return ρ
� References� Hassett and Hubbard (2002), Auerbach (2002)
61 / 142
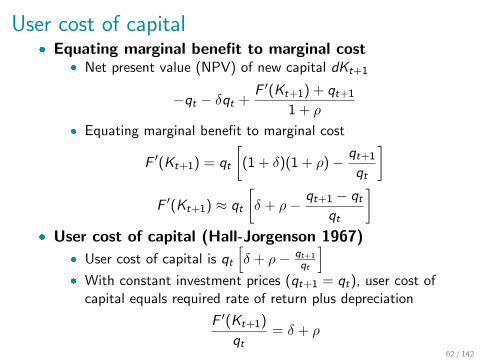
User cost of capital� Equating marginal benefit to marginal cost
� Net present value (NPV) of new capital dKt+1
−qt − δqt +F ′(Kt+1) + qt+1
1 + ρ
� Equating marginal benefit to marginal cost
F ′(Kt+1) = qt
[(1 + δ)(1 + ρ)− qt+1
qt
]F ′(Kt+1) ≈ qt
[δ + ρ− qt+1 − qt
qt
]� User cost of capital (Hall-Jorgenson 1967)
� User cost of capital is qt[δ + ρ− qt+1
qt
]� With constant investment prices (qt+1 = qt), user cost of
capital equals required rate of return plus depreciation
F ′(Kt+1)
qt= δ + ρ
62 / 142
Investment decision
63 / 142

User cost of capital
� Introducing a corporate income tax τcit� NPV of depreciation deductions Dt
Γt =∞∑z=t
(1 + r)−(z−t)τdivDz−t
� User cost of capital with CIT� Euler equation : F ′(Kt+1)
≈ qt1− Γt
1− τcit
[δ + ρ− qt+1(1− Γt+1)− qt(1− Γt)
qt(1− Γt)
]
64 / 142

User cost of capital
� Common CIT� Only partial expensing D0 < 1� Not full deductibility of financing cost
ρ′(τcit) > 0
� Required rate of return needs to be higher to justifyinvestment ⇒ Investment will be reduced by CIT
65 / 142

User cost of capital
� Case of cash flow tax� Immediate and full expensing : D0 = 1� Then we have Γt+1 = τcit� Optimal investment does not depend on CIT
F ′(Kt+1) ≈ qt
[δ + ρ− qt+1 − qt
qt
]⇒ When all costs are deductible, CIT is a tax on pure profit⇒ Case for cash-flow tax reform (Auerbach, 2010)
66 / 142

Impact on investment
67 / 142

Impact on investment
68 / 142

Cross-country evidence
� Djankov et al. (AEJ-M, 2010)� Measure of effective corporate tax rate for an identical
mid-sized firm using survey from PwC� Data from 85 countries for 2005-06� OLS regressions of investment and entrepreneurial activity
on CIT rates� Identification : only controls for observables
� Results� Substantial impact of CIT on investment� 10 p.p. increase in CIT leads to 2 p.p. decrease in
investment as a share of GDP
69 / 142

Figure 15: Effective Tax Rate and Investment
Source : Djankov, et al. (2010), Fig. 1.
70 / 142

Figure 16: Effective Tax Rate and Foreign Direct Investment
Source : Djankov, et al. (2010), Fig. 2.
71 / 142

Figure 17: Effective Tax Rate and Business Density
Source : Djankov, et al. (2010), Fig. 3.
72 / 142

Figure 18: Basic results
Source : Djankov, et al. (2010), Tab. 5.A.
73 / 142

Figure 19: Basic results
Source : Djankov, et al. (2010), Tab. 5.B.
74 / 142

House and Shapiro (AER, 2008)� Accelerated depreciation
� Depreciation rules are changed for higher expensinge.g., from 10 years to 5 years depreciation length
� Common policy to stimulate investment (often used inrecession)
� Increasing expensing reduces user cost of capital andincreases incentives to invest
� How big is the effect ?
� Temporary accelerated depreciation� Exploit accelerated depreciation in U.S. in 2002 and 2003� 30%-50% bonus depreciation for assets with recovery
periods less than 20 years
� DiD methodology� Controls : assets depreciated over more than 20 years, not
granted accelerated depreciation� Treated : assets granted accelerated depreciation
75 / 142

House and Shapiro (AER, 2008)
Figure 20: Recovery period and depreciation methods
Source : House and Shapiro (2008), Tab. 2.
76 / 142

Figure 21: Simulated responses to bonus depreciation
Source : House and Shapiro (2008), Fig. 2. 77 / 142

Figure 22: Investment quantities
Source : House and Shapiro (2008), Fig. 3.
78 / 142

House and Shapiro (AER, 2008)
� Results� Cost-of-capital elasticity of investment between -6 and -14� Interpret results as intertemporal substitution elasticity
� Discussion : liquidity constraints� Literature in corporate finance on investment cash-flow
sensitivity� Would imply that accelerated depreciation could raise
investment through an income effect� Accelerated depreciation generates large effective subsidy if
firm is liquidity constrained� See for instance Zwick and Mahon (AER 2015)
79 / 142

Payout policies
� How to distribute profits ?
1 Dividends2 Share repurchase3 Retained earnings
� Dividend puzzle� With a classical system, dividends are likely to be taxed at
higher rate� In the U.S. 20% of firms paid dividends� Why pay dividend when tax disadvantage ?
80 / 142

Why pay dividends ?
1 Agency problem� Shareholders are afraid that managers misuse large cash
stockpiles� Equity holders prefer tax inefficiencies to reduce manager’s
control over the firms’ assets
2 Signaling theory� Investors have imperfect information about the firm� By paying dividends, managers show that the firm has cash
to burn...
81 / 142

Modeling firm behaviour� Source of financing
� Following Chetty and Saez (2010)� Firm has cash holding X in t = 0 (profits from past
operations)� Issuing equity E� Chooses investment I with payoff of net profits f (I ) int = 1
� Distribute dividends D
D = E + X − I
� Introduce taxes� Dividend tax τdiv , net payout is (1− τdiv )D� CIT τcit on corporate profits, (1− τcit f (I ))� Net of tax payout in period 1 is
(1− τdiv )[(1− τcit)f (I ) + X − D] + E
82 / 142
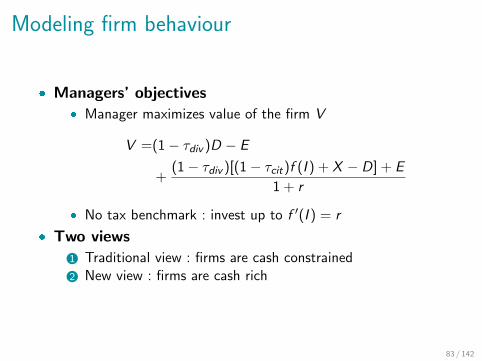
Modeling firm behaviour
� Managers’ objectives� Manager maximizes value of the firm V
V =(1− τdiv )D − E
+(1− τdiv )[(1− τcit)f (I ) + X − D] + E
1 + r
� No tax benchmark : invest up to f ′(I ) = r
� Two views
1 Traditional view : firms are cash constrained2 New view : firms are cash rich
83 / 142

Modeling firm behaviour
� Cash constrained firms� Marginal value of paying dividends is negative� More likely to characterize young firm
e.g., Twitter� Pre-tax return on investment is above interest rate r� Firms should not pay dividends (D = 0) and fund
investment by equity I = X + E
(1− τdiv )(1− τcit)f ′(x + E ) = r
� Traditional view� Marginal investments are funded out of equity� Dividend tax is similar to corporate income tax� Dividend tax cuts stimulate equity issues and investment
84 / 142

Modeling firm behaviour
� Cash rich firms� Marginal investments are funded out of retained earnings
or riskless debt� Marginal value of issuing equity is negative
e.g., Microsoft, with abondant past profits� Firms should not emit equity E = 0 and split cash betweenD and I according to :
(1− τcit)f ′(X − D) = r
� Invest to point where after-tax marginal product equalsbond return r
� New view� Higher corporate tax rate lowers investment� Change in dividend tax rate has no effect on dividend or
investment
85 / 142

Impact of dividend tax cuts
� Empirical evidence� Scarce literature for lack of proper identification� Idea to test between old and new view
� Poterba and Summers (JoF, 1984)� U.K. data for 1955-1981� Exploit differentiated treatment of capital gains and
dividend payments� Policy changes : (1965, capital gains tax ; 1973 integrated
corporate tax)� Inspect goodness of structural investment models (e.g.,
CAPM)� Evidence that taxes on dividends impact substantially
dividend payouts⇒ argument in favour of old view
86 / 142

Impact of dividend tax cuts
� Chetty and Saez (QJE, 2005)� Exploit the U.S. 2003 dividend tax cut� Jobs and Growth Tax Relief Reconciliation Act
implemented by the Bush administration in 2003� Sunset clause : tax cut planed to end in 2009� τDIV reduced from 38.6% to 15%
� Methodology� Simple diff : before/after in time series (dividend initiations
are high frequency events)� Test for confounding trend using firms owned primarily by
nontaxable institutions as a “control group”e.g., dividend income earned by government agencies,nonprofit organizations, and corporations are not affectedby the tax change
87 / 142

Impact of dividend tax cuts
� Data� Data on dividend payments up to the second quarter of
2004 from the Center for Research in Security Prices(CRSP)
� Results� Large increase in dividend payouts : + 20% (+$20 bn p.a)� It implies an elasticity of regular dividend payments with
respect to the marginal tax rate on dividend income of -0.5.� Largest response from firms with strong principals whose
tax incentives changed (CEO with large dividends payout,large taxable shareholder, etc.)
� Suggestive of agency issues matter for dividend behaviours
88 / 142

Figure 23: Dividend payments : summary statistics
Source : Chetty and Saez (2005), Tab. 1.
89 / 142

Figure 24: Dividend payments : aggregate time series
Source : Chetty and Saez (2005), Fig. 1, slides from Chetty 2012.
90 / 142

Figure 25: Regular dividend initiation time series
Source : Chetty and Saez (2005), Fig. 2, slides from Chetty 2012.
91 / 142
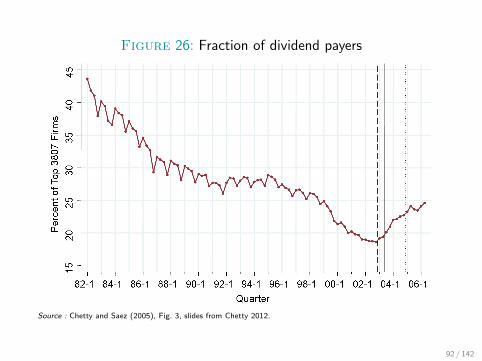
Figure 26: Fraction of dividend payers
Source : Chetty and Saez (2005), Fig. 3, slides from Chetty 2012.
92 / 142

Figure 27: Effect of tax cut on initiations by executiveshareholding
Source : Chetty and Saez (2005), Fig. 7, slides from Chetty 2012.
93 / 142
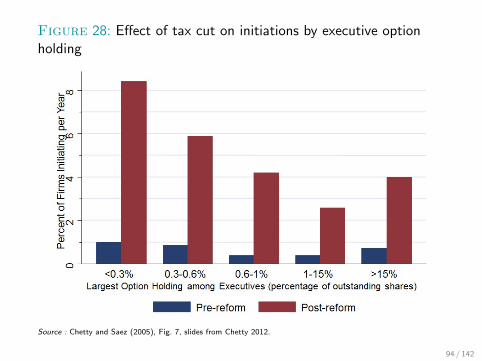
Figure 28: Effect of tax cut on initiations by executive optionholding
Source : Chetty and Saez (2005), Fig. 7, slides from Chetty 2012.
94 / 142

Figure 29: Effect of tax cut on initiations by institutionalownership
Source : Chetty and Saez (2005), Fig. 8, slides from Chetty 2012.
95 / 142

Impact of dividend tax cuts
� Chetty and Saez (2005) : take-away� Significant impact of dividend tax cut on dividends� In line with the “old view”� But the dividend response appears too fast to be consistent
with the old view mechanismi.e., savings supply side response ⇒ more business activityand higher dividend payments
� Temporary dividend tax cut could also be in line with newview
� Chetty-Saez results consistent with positive, negative, orzero effect on investment
96 / 142

Yagan (AER, 2015)
� Main idea� Look at the effect of U.S. dividend tax cut in 2003 on
investments� Impact on investment would confirm the “old view”
� Results� Zero effect on investment : reject traditional view� Zero effect on wages� Challenges leading estimates of user cost-of-capital
elasticities w.r.t. to investments
97 / 142

Yagan (AER, 2015)
� Methodology : DiD� DiD using C-corporations vs. S-corporations� C-corps : pay CIT, shareholders pay dividend taxes, capital
gains taxes on qualified share buybacks� S-corps : same legal structure but taxable income flows
through shareholders individual tax returns (independenton whether it is retained or distributed)
� Identification assumption� C- and S-corps are different : C-corps are much larger� For identification : only necessary that both firm types
would have followed the same trend absent the reform� Check whether proper control groups
98 / 142
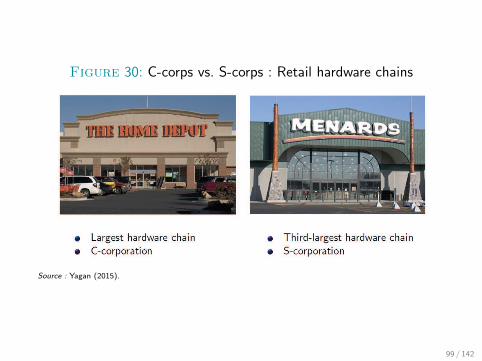
Figure 30: C-corps vs. S-corps : Retail hardware chains
Source : Yagan (2015).
99 / 142

Figure 31: C-corps vs. S-corps : Retail hardware chains
Source : Yagan (2015).
100 / 142

Figure 32: U.S. corporate investment in national accounts
Source : Yagan (2013).
101 / 142

Figure 33: Control vs. treated : industry
Source : Yagan (2015), Fig. 1.A
102 / 142

Figure 34: Control vs. treated : size
Source : Yagan (2015), Fig. 1.B 103 / 142

Figure 35: Investment
Source : Yagan (2015), Fig. 2.A 104 / 142

Figure 36: Net investment
Source : Yagan (2015), Fig. 2.B 105 / 142

Figure 37: Employee compensation
Source : Yagan (2015), Fig. 2.C 106 / 142

Figure 38: Effect of dividend tax cut on investment
Source : Yagan (2015), Tab. 2.A
107 / 142

Figure 39: Effect on net investment and employee compensation
Source : Yagan (2015), Tab. 2.B
108 / 142
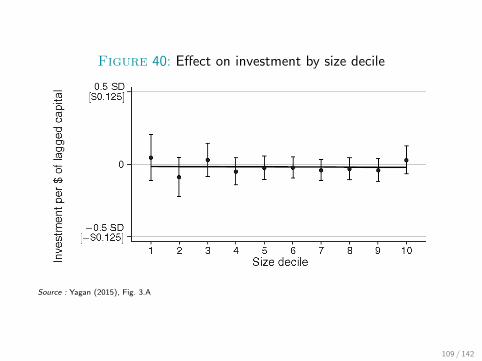
Figure 40: Effect on investment by size decile
Source : Yagan (2015), Fig. 3.A
109 / 142

Yagan (AER, 2015)
� Results� Net-of-dividend tax elasticity of investment : 0.00, with
0.08 95% confidence upper bound� Traditional view prediction : [0.21 ; 0.41] depending on
cost-of-capital elasticity of investment (based onHassett-Hubbard consensus range)
� Possible interpretations
1 New view is correct and most firms fund marginalinvestments out of retained earnings (e.g., median U.S.firm is 22 years old)
2 Traditional view is technically correct, but tax codefeatures blocked effects
� Low expected permanence (originally set to expire in 2009)
110 / 142

Elasticity of corporate taxable income
� Devereux, Liu and Loretz (AEJ-EP 2014)� Estimate the elasticity of corporate taxable income (ECTI)
with respect to the statutory tax rate in the U.K.� Bunching in the distribution of taxable income at kinks in
the marginal rate schedule� Using U.K. tax return data provided by HMRC for
2001-2008
� Results� Fairly low elasticities� 0.15 for small firms� 0.50 for very small firms (e.g., tax drivers, etc.)
111 / 142

Elasticity of corporate taxable income
� ECTI� Similar measure to ETI for personal income tax� ECTI measures the response of corporate taxable income
to a 1% change in the statutory CIT rate� Various behavioral adjustments : location, investments,
profit shifting, finance structure
� Methodology� Kinks in U.K. tax rate schedule at £300K and at £10K� Variation over time in the kinks at £10K� Bunching estimation method (Saez, 2010)
112 / 142

Elasticity of corporate taxable income� Firms’ problem
� Firms maximise net of tax profit π
π = y − c(y)− T
� c(y) is cost of producing y� Total tax T = tc(Bc − Ac) + E� tax rate tc� tax base Bc = y − αc(y), with α share of deductible costs� Ac lowest point of relevant bracket� E taxes paid in lower brackets
π = y − c(y)− tc(y − αc(y)− Ac)− E
� FOC
c ′(y) =1− tc
1− αtc113 / 142

Elasticity of corporate taxable income
� Social welfare� Welfare W = π + T
� Impact of CIT on total welfare� Increase in net of tax rate 1− tc� Apply the envelope theorem to ignore any indirect effects
of the change in 1− tc on π through y� Direct effects of tax change cancel out
dW =
(∂π
∂y
∂y
∂(1− tc)− tc(1− αc ′)
)d(1− tc)
dW =tcBc
1− tced(1− tc)
� With e the elasticity of corporate taxable income
114 / 142

Elasticity of corporate taxable income
� Excess burden of CIT� Mechanical change in tax burden for given y
dM = −(Bc − Ac)d(1− tc)
� Compare the change in welfare to the mechanical changein tax revenue in the absence of any behavioral response
dW
dM= − Bc
BcAc
tc1− tc
e
� ECTI as sufficient statistics�
dWdM gives the marginal deadweight loss of tax increase
� ECTI e is a measure of the efficiency loss due to corporatetaxation
115 / 142

Figure 41: U.K. corporate income tax schedule
Source : Devereux, Liu and Loretz (2014), Fig. 1.
116 / 142

Figure 42: Bunching at £300K
Source : Devereux, Liu and Loretz (2014), Fig. 2.
117 / 142

Figure 43: ECIT at £300K
Source : Devereux, Liu and Loretz (2014), Tab. 2.
118 / 142

Figure 44: Bunching at £10K
Source : Devereux, Liu and Loretz (2014), Fig. 4.
119 / 142

Figure 45: De-Bunching at £10K
Source : Devereux, Liu and Loretz (2014), Fig. 4.
120 / 142

Figure 46: ECIT at £10K
Source : Devereux, Liu and Loretz (2014), Tab. 4.
121 / 142

IV. Policies
1 Research tax credits
2 Cash-flow vs broad base
3 Facing tax competition
122 / 142

Research tax credit
� Innovation and growth� TFP main factor of growth over time� Technological innovation critical factor for TFP growth,
especially in countries at technological frontier
� Supporting R&D� Endogenous growth theory gives room for policy makers� Two main policies
1 Direct subsidies : grant for R&D2 Indirect subsidies : tax incentives
123 / 142

Research tax credit
� Research tax credit (RTC)� Tool allowing higher deduction of corporate tax base for
R&D expenses� Government does not have to choose which project to
subsidy� Mitigate risk of political capture
� Potential issues� Very blunt tool : not well targeted at high externality ideas� Re-labelling Problem� R&D is hard to define� Costly scheme in terms of revenues
124 / 142

Research tax credit
� User cost of capital� Reminder� Euler equation : F ′(Kt+1)
≈ qt1− Γt
1− τcit
[δ + ρ− qt+1(1− Γt+1)− qt(1− Γt)
qt(1− Γt)
]� RTC reduce user cost of capital Γt = τcit
� RTC should boost R&D investment� Depending on elasticity of investment to user cost of
capital� Empirical question
125 / 142

Research tax credit
� What effects of RTC ?� Earlier literature showed limited effects� More recent papers suggested high elasticity, and relatively
efficient RTC schemes� Cross-country : Bloom, Griffith and Van Reenen (2002)� Hall and Van Reenen (2000)� Large effects on R&D spending, but few evidence on
innovation (e.g., patents)
� Change in the generosity of RTC� Change from incremental to volume-based systems : more
costlye.g., French RTC reform in 2008 (credit d’impot recherche)
126 / 142

Research tax credit
� U.K. research tax credit� Introduction in 2000 of an R&D Tax Relief Scheme for
SME� Volume-based scheme� Additional deduction of 50% of qualified R&D expenditures� Tax credit of 24% of R&D expenditures
� Dechezlepretre et al. (2016, R&R AER)� Exploit change in the U.K. to asset threshold to qualify to
Tax Relief Scheme� In 2008, SME assets threshold was increased from e43m
to e86m� Use admin tax data + patent data� Apply RDD strategy
127 / 142

Figure 47: Discontinuity in average R&D expenditure over2009-11
Source : Dechezlepretre, et al. (2016), Fig. 2. 128 / 142

Figure 48: Discontinuity in average number of patents over2009-11
Source : Dechezlepretre, et al. (2016), Fig. 3. 129 / 142

Research tax credit
� Results� Increase of 100% in R&D spending� Increase of 60% in patenting� Large elasticity of R&D spending relative to its user cost at
2.6 (usual estimate between 1 and 2)
130 / 142

Facing tax competition
� The capital flight problem� Most countries use a source-based corporation tax� A source-based tax system is vulnerable to tax competition
(through profit shifting)
� Different aspects of the tax matter for eachdecision :
� Average tax rate explains investment location decision� Marginal tax rate explains how much to invest� Statutory tax rate determines profit location
131 / 142

Profit-shifting to low-tax jurisdictions
� Transfer pricing� Develop property in foreign subsidiary, which then leases it
at high price to domestic parent� Domestic parent enjoys cost deductions while foreign
subsidiary pays little tax on lease earnings
� Earnings stripping� Domestic parent borrows heavily from foreign subsidiary in
Caymans� Domestic parent enjoys interest deductions while foreign
subsidiary pays little tax on interest earnings
132 / 142

Profit-shifting to low-tax jurisdictions
Figure 49: The Share of Profits Made Abroad in US CorporateProfits
Source : Zucman (2014), Fig. 1.
133 / 142

Profit-shifting to low-tax jurisdictions
Figure 50: The Share of Tax Havens in US Corporate Profits
Source : Zucman (2014), Fig. 3.
134 / 142

Facing tax competition
� Two options
1 Cut CIT statutory rates to attract profits2 Reform CIT tax base towards less mobile base
e.g., final consumption (sales)
� Race to the bottom� Cut in statutory CIT to compete for profits from
multinationalse.g., French president Macron announced cut to 25%e.g., U.S. President Trump promised a cut to 20%e.g., Former U.K. Chancellor Osborne announced planedcut to 15%
135 / 142

Tax base reformsThe cash-flow tax
� Cash-flow corporation tax� Tax base = revenues - expenses� Need to carry forward tax losses
� A tax on pure profit� Investment decisions are not altered by the tax� No need to define depreciation allowances� Deduct equity cost as well as interest cost� Tax on economic rent but not full return to capital
� Issues� No tax advantage to investments� Tax base smaller, i.e. rates have to be higher
136 / 142
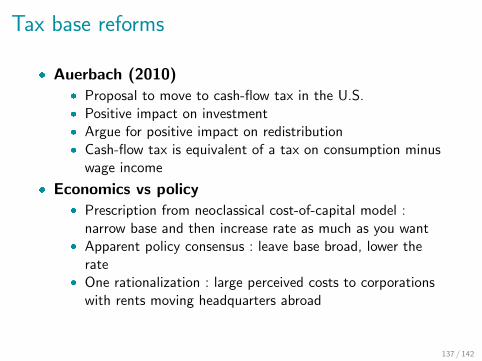
Tax base reforms
� Auerbach (2010)� Proposal to move to cash-flow tax in the U.S.� Positive impact on investment� Argue for positive impact on redistribution� Cash-flow tax is equivalent of a tax on consumption minus
wage income
� Economics vs policy� Prescription from neoclassical cost-of-capital model :
narrow base and then increase rate as much as you want� Apparent policy consensus : leave base broad, lower the
rate� One rationalization : large perceived costs to corporations
with rents moving headquarters abroad
137 / 142

Table 4: Characterizing corporate income tax systems
Type of income subject to business tax
Location of Full return Full return Renttax base to equity to capital
Source country 1. Conventional CIT 4. Dual income tax 6. CIT with Allowancewith exemption of for corporate equity
foreign source income 5. Comprehensive 7. Source-based cashBusiness income tax flow tax
Residence country 2. Residence-based CITof corporate head office with credit for
foreign tax
Residence country 3. Residence-basedof personal shareholder shareholder tax
Destination country 8. Full destination-of final consumption based cash flow tax
9. VAT-typedestination-based
cash flow tax
Source : Devereux and Sørensen (2006), Tab. 1, p. 24.
138 / 142

Alternative options
� Other options� Harmonization of treaty rules (cf. OECD)� EU initiative for harmonization of CI tax base (ACISS)� Shifting from source-based to destination-based taxation
(Auerbach 2010)
� Zucman (NYT, 2017)� Proposal to move to sales’ apportionment of global profit� Idea to drastically reduce profit shifting, hence tax
competition� Integrate personal and corporate income tax systems with
the help of a world financial registry (Zucman, 2014)
139 / 142
References– Atkinson, A. and Stiglitz, J. (1980), Lectures on Public Economics, McGraw-Hill ; reprinted by Princeton
University Press (2015).
– Arulampalam, W., M. Devereux and G. Maffini (2012) “The Direct Incidence of Corporate Income Tax onWages”. European Economic Review 56 (6) : 1038–54.
– Auerbach, A. (1987) “The Tax Reform Act of 1986 and the Cost of Capital”. The Journal of EconomicPerspectives 1 (1) : 73–86.
– Auerbach, A. (2002) “Taxation and Corporate Financial Policy”. Handbook of Public Economics 3 :1251–1292.
– Auerbach, A. (2006) “Who Bears the Corporate Tax ? A Review of What We Know”. Tax Policy and theEconomy 20 : 1–40.
– Auerbach, A. and James M. Poterba. 1987. “Why Have Corporate Tax Revenues Declined ?” Tax Policy andthe Economy 1 : 1–28.
– Auerbach, A., Devereux, M. and Simpson, H. (2010) “Taxing Corporate Income”, in Mirrlees et al. (eds),Dimensions of Tax Design : the Mirrlees Review, Oxford University Press, chap. 9.
– Auerbach, A. (2002) “Taxation and Corporate Financial Policy”, in Auerbach, A. and Feldstein, M. (eds),Handbook of Public Economics, vol. 3, chap. 19, Elsevier.
– Bernheim, D. (1991) “Tax Policy and the Dividend Puzzle”. The RAND Journal of Economics 22 (4) : 455–76.
– Bernheim, D. and Adam Wantz (1995) “A Tax-Based Test of the Dividend Signaling Hypothesis”. TheAmerican Economic Review 85 (3) : 532–51.
– Bird, R. (1996) “Why Tax Corporations ?” Department of Finance Canada, Technical Committee on BusinessTaxation Working Papers : No. 1996-02.
– Bloom, N., Griffith, R. and Van Reenen, J. (2002) “Do R&D Tax Credits Work ? Evidence from a Panel ofCountries 1979–1997’, Journal of Public Economics, 85(1), pp. 1–31.
– Clausing, K. (2012) “In Search of Corporate Tax Incidence”, Tax Law Review, 65(3), pp. 433–472.
– Chetty, R. and Saez, E. (2005) “Dividend Taxes and Corporate Behavior : Evidence from the 2003 DividendTax Cut”. The Quarterly Journal of Economics 120 (3) : 791–833.
140 / 142

References– Chetty, R. and Saez, E. (2006) “The Effects of the 2003 Dividend Tax cut on Corporate Behavior :
Interpreting the Evidence”, American Economic Review, 96, pp. 124–129.
– Chetty, R. and Saez, E. (2010) “Dividend and Corporate Taxation in an Agency Model of the Firm”. AmericanEconomic Journal : Economic Policy 2 (3) : 1–31.
– Cragg, J., A. Harberger, and P. Mieszkowski (1967) “Empirical Evidence on the Incidence of the CorporationIncome Tax”. Journal of Political Economy 75 (6) : 811–21.
– DeLong, B. and L. Summers (1992) “Equipment Investment and Economic Growth : How Strong Is theNexus ?” Brookings Papers on Economic Activity 1992 (2) : 157–211.
– Devereux, M. and Sørensen, P. B. (2006) “The Corporate Income Tax : International Trends and Options forFundamental Reform”, European Economy Economic Papers 264. Brussels : Europ. Comm.,Directorate-General for Economic and Financial Affairs.
– Devereux, M., Liu, L. and Loretz, S. (2014) “The Elasticity of Corporate Taxable Income : New Evidence fromUK Tax Records”, American Economic Journal : Economic Policy, 6(2), pp. 19–53.
– Devereux, M., R. Griffith, and A. Klemm (2004) “Why Has the UK Corporation Tax Raised so MuchRevenue ?” Fiscal Studies 25 (4) : 367–388.
– Dharmapala, D., F. Foley, and K. Forbes (2011) “Watch What I Do, Not What I Say : The UnintendedConsequences of the Homeland Investment Act”. The Journal of Finance 66 (3) : 753–87.
– Djankov, S., T. Ganser, C. McLiesh, R. Ramalho, and A. Shleifer (2010) “The Effect of Corporate Taxes onInvestment and Entrepreneurship”, American Economic Journal : Macroeconomics 2 (3) : 31–64.
– Fuest, C., A. Peichl, and S. Siegloch (2015), “Do Higher Corporate Taxes Reduce Wages ? Micro Evidencefrom Germany”. IZA Discussion Paper, no. 9606.
– Hall, R. and Jorgenson, D. (1967) “Tax Policy and Investment Behavior”, The American Economic Review 57(3) : 391–414.
– Hall, B. and Van Reenen, J. (2000) “How Effective are Fiscal Incentives for R&D ? A Review of the Evidence”,Research Policy, 29(4–5), pp. 449–469.
– Harberger, A. (1962) “The Incidence of the Corporation Income Tax”, Journal of Political Economy, 70,pp. 215–240.
– Gordon, R. and Hines, J. (2002) “International Taxation”, in Auerbach, A. and Feldstein, M. (eds), Handbookof Public Economics, vol. 4, chap. 28, Elsevier.
141 / 142

References– Gordon, R., and J. MacKie-Mason (1995) “Why Is There Corporate Taxation in a Small Open Economy ? The
Role of Transfer Pricing and Income Shifting”. NBER, January, 67–94.
– Griffith, R., Hines, J. and Sørensen, P. (2010) “International Capital Taxation”, in Mirrlees et al. (eds),Dimensions of Tax Design : the Mirrlees Review, Oxford University Press, chap. 10.
– Hassett, K., and G. Hubbard (2002) “Tax Policy and Business Investment”. Handbook of Public Economics3 : 1293–1343.
– Hines, James R., and Eric M. Rice (1994) “Fiscal Paradise : Foreign Tax Havens and American Business”. TheQuarterly Journal of Economics 109 (1) : 149–82.
– House, C. and M. Shapiro (2008) “Temporary Investment Tax Incentives : Theory with Evidence from BonusDepreciation”. The American Economic Review 98 (3) : 737–68.
– Kotlikoff, L. and L. Summers (1987) “Tax Incidence” in Handbook of Public Economics, edited by Alan J.Auerbach and Martin Feldstein, 2 :1043–92. Elsevier.
– Mintz, J. (1995) “The Corporation Tax : A Survey”. Fiscal Studies 16 (4) : 23–68.
– OECD (2017) “Legal Tax Liability, Legal Remittance Responsibility and Tax Incidence : Three Dimensions ofBusiness Taxation” OECD Taxation Working Paper Series.
– Poterba, J. and L. Summers (1984) “New Evidence That Taxes Affect the Valuation of Dividends”, TheJournal of Finance 39 (5) : 1397–1415.
– Suarez Serrato, J. C., and O. Zidar (2016) “Who Benefits from State Corporate Tax Cuts ? A Local LaborMarkets Approach with Heterogeneous Firms”, American Economic Review 106 (9) : 2582–2624.
– Summers, L. (1981) “Taxation and Corporate Investment : A Q-Theory Approach”. Brookings Papers onEconomic Activity 1981 (1) : 67–140.
– Yagan, D. (2015) “Capital Tax Reform and the Real Economy : The Effects of the 2003 Dividend Tax Cut”.American Economic Review 105 (12) : 3531–63.
– Zucman, G. (2014) “Taxing across Borders : Tracking Personal Wealth and Corporate Profits”, Journal ofEconomic Perspectives 28 (4) : 121–48.
– Zwick, E. and Mahon, J. (2016), “Tax Policy and Heterogeneous Investment Behavior”, American EconomicReview, forthcoming.
142 / 142


![[Bernard Salanie] the Economics of Taxation(Bookos.org)](https://img.pdfslide.net/doc/110x75/552d790455034629178b4719/bernard-salanie-the-economics-of-taxationbookosorg.jpg)