Embed Size (px)
Citation preview

Lab 4 Demo due Report due May 27
Quiz June 3
PhD Positions in HK PolyUhttp://www.cc98.org/dispbbs.asp?boardid=68&id=4373185&star=1#1

Appendix D.4–D.5

Outline
• I/O Performance• Queuing Theory

Outline
• I/O Performance• Queuing Theory

I/O Performance
Unique measures• Diversity
which I/O devices can connect to the computer system?
• Capacityhow many I/O devices can connect to a computer system?

I/O Performance
• Producer-server model
producer creates tasks to be performed and places them in a buffer;server takes tasks from the FIFO buffer and performs them;

I/O Performance
• Response time / Latencythe time a task from the moment it is placed in the buffer until the server finishes the task
• Throughput / Bandwidththe average number of tasks completed by the server over a time period
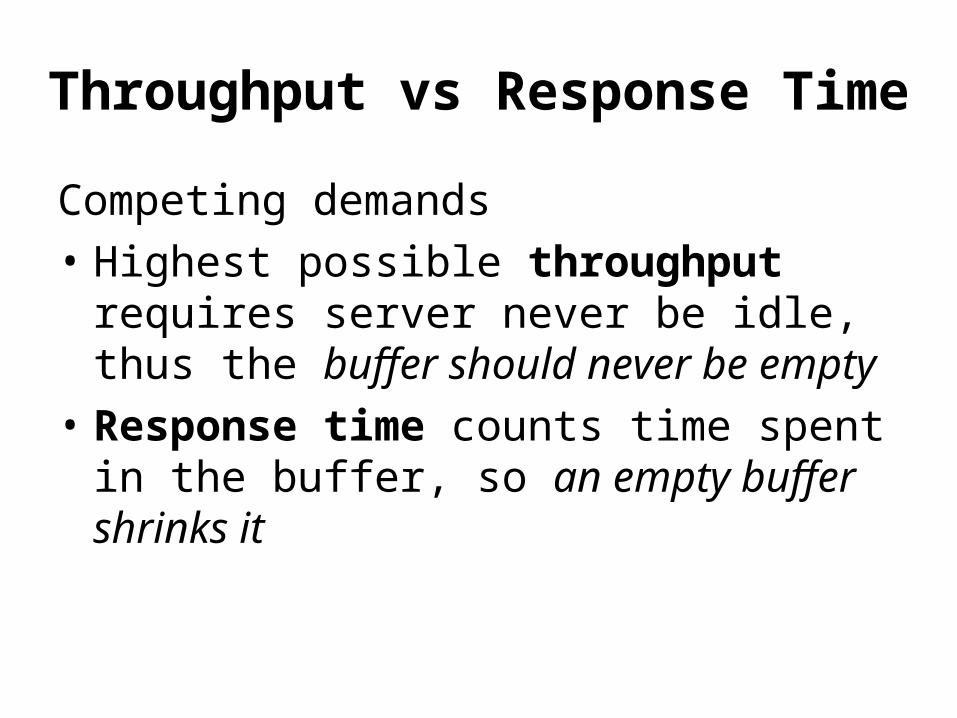
Throughput vs Response Time
Competing demands• Highest possible throughput requires
server never be idle, thus the buffer should never be empty
• Response time counts time spent in the buffer, so an empty buffer shrinks it

Throughput vs Response Time

Choosing Response Time
• Transactionan interaction between user and comp
• Transaction Time consists ofEntry time: the time for the user to enter the commandSystem response time: the time between command entered and complete response displayedThink time: the time from response reception to user entering next cmd

Choosing Response Time
reduce response time from 1 s to 0.3 s

Choosing Response Time
More transaction time reduction than just the response time reduction

Choosing Response Time
People need less time to think when given a faster response

I/O Benchmarks
Response time restrictions for I/O benchmarks

TPC
• Conducted by Transaction-Processing CouncilOLTP for online transaction processing
• I/O rate: the number of disk accesses per second;instead of data rate (bytes of data per second)

TPC

TPC-C
Configuration• use a database to simulate an order-entry
environment of a wholesale supplier• Include entering and delivering orders,
recording payments, checking the status of orders, and monitoring the level of stock at the warehouses
• Run five concurrent transactions of varying complexity
• Includes nine tables with a scalable range of records and customers

TPC-C
Metrics• tmpC
transactions per minute• System price
hardwaresoftwarethree years of maintenance support

TPC: Initiative/Unique Characteristics
• Price is included with the benchmark results
• The dataset generally must scale in size as the throughput increases
• The benchmark results are audited• Throughput is performance metric, but
response times are limited• An independent organization maintains
the benchmarks

SPEC Benchmarks
• Best known for its characterization of processor performances
• Has created benchmarks for also file servers, mail servers, and Web servers
SFS, SPECMail, SPECWeb
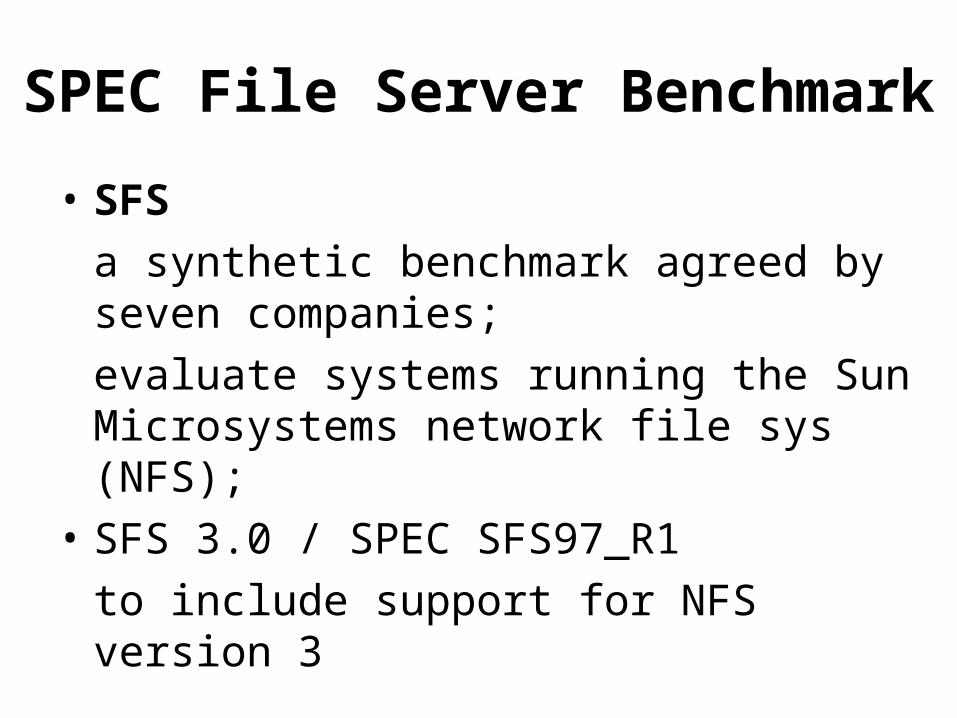
SPEC File Server Benchmark
• SFSa synthetic benchmark agreed by seven companies;evaluate systems running the Sun Microsystems network file sys (NFS);
• SFS 3.0 / SPEC SFS97_R1to include support for NFS version 3

SFS
• Scale the amount of data stored according to the reported throughput
• Also limits the average response time

SPECMail• Evaluate performance of mail servers at an
Internet service provider• SPECMail 2001
based on standard Internet protocols SMTP and POP3;measures throughput and user response time while scaling the number of users from 10,000 to 1,000,000
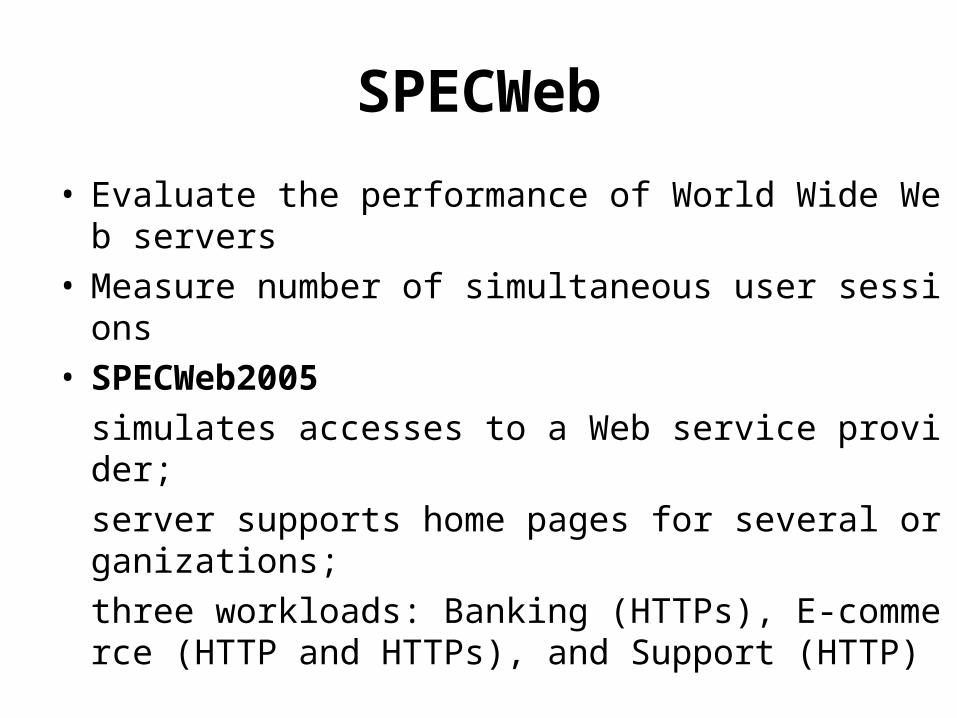
SPECWeb• Evaluate the performance of World Wide Web ser
vers• Measure number of simultaneous user sessions• SPECWeb2005
simulates accesses to a Web service provider;server supports home pages for several organizations;three workloads: Banking (HTTPs), E-commerce (HTTP and HTTPs), and Support (HTTP)

Dependability BenchmarkExamples
• TPC-C• The benchmarked system must be able
to handle a single disk failure• Measures submitters run some RAID
organization in their storage system
Dependability BenchmarkExamples
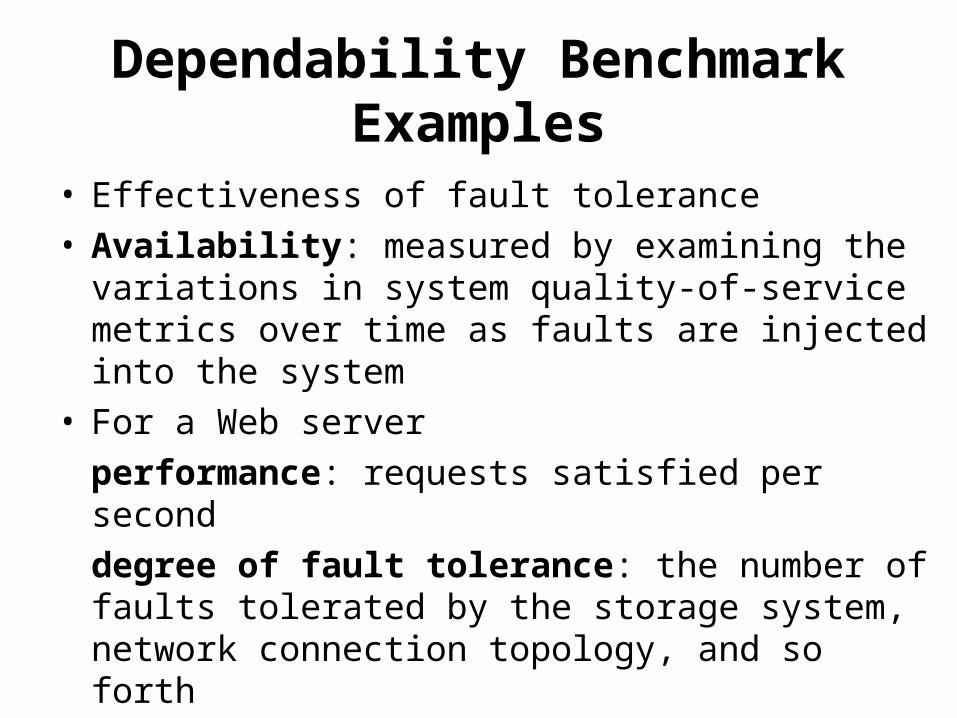
• Effectiveness of fault tolerance• Availability: measured by examining the
variations in system quality-of-service metrics over time as faults are injected into the system
• For a Web serverperformance: requests satisfied per seconddegree of fault tolerance: the number of faults tolerated by the storage system, network connection topology, and so forth

Dependability BenchmarkExamples
• Effectiveness of fault tolerance• SPECWeb99• Single fault injection
e.g., write error in disk sector• Compares software RAID
implementations provided by Linux, Solaris, and Windows 2000 Server

SPECWeb99
fast reconstruction
decreases app performance
reconstruction steals I/O resources from running apps

SPECWeb99
• Linux and Solaris initiate automatic reconstruction of the RAID volume onto a hot spare when an active disk is taken out of service due to a failure
• Windows’s RAID reconstruction must be initiated manually

SPECWeb99
Managing transient faults• Linux: paranoid
shut down a disk in controlled manner at the first error,rather than wait to see if the error is transient;
• Windows and Solaris: forgivingignore most transient faults with the expectation that they will not recur

Outline
• I/O Performance• Queuing Theory

Queuing Theory
• Give a set of simple theorems that will help calculate response time and throughput of an entire I/O system
• Because of the probabilistic nature of I/O events and because of sharing of I/O devices
• A little more work and much more accurate than best-case analysis,but much less work than full-scale simulation

Black Box Model
• Processor makes I/O requests that arrive at the I/O device,requests depart when the I/O device fulfills them
I/O Device

Black Box Model
• If the system is in steady state, then the number of tasks entering the system must equal the number of tasks leaving the system
• This flow-balanced state is necessary but not sufficient for steady state
I/O Device

Black Box Model
• The system has reached steady stateif the system has been observed for a sufficiently long time and mean waiting times stabilize
I/O Device

Little’s Law• Assumptions
multiple independent I/O requests in equilibrium:input rate = output rate;
a steady supply of tasks independent for how long they wait for service;

Little’s Law
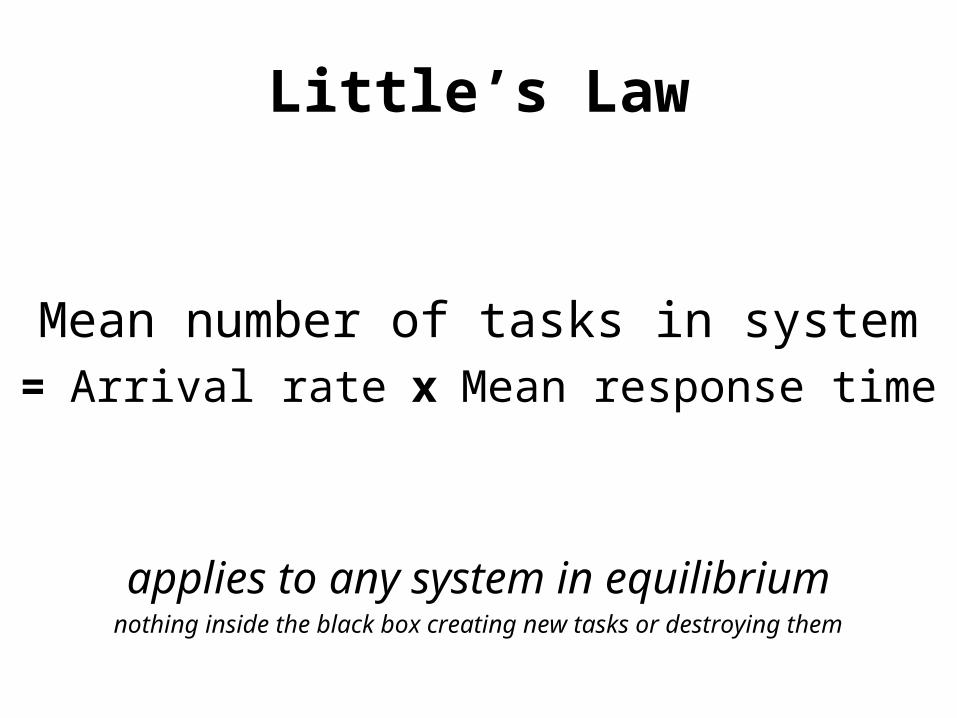
Mean number of tasks in system= Arrival rate x Mean response time
Little’s Law
Mean number of tasks in system= Arrival rate x Mean response time
applies to any system in equilibriumnothing inside the black box creating new tasks or destroying them

Little’s Law• Observe a sys for Timeobserve mins• Sum the times for each task to be serviced
Timeaccumulated
• Numbertask completed during Timeobserve
• Timeaccumulated≥Timeobserve
because tasks can overlap in time

Little’s Law

Single-Server Model
• Queue / Waiting linethe area where the tasks accumulate, waiting to be serviced
• Serverthe device performing the requested service is called the server

Single-Server Model
• Timeserver
average time to service a taskaverage service rate: 1/Timeserver
• Timequeue
average time per task in the queue• Timesystem
average time/task in the system, or the response time;the sum of Timequeue and Timeserver

Single-Server Model
• Arrival rateaverage # of arriving tasks per second
• Lengthserver
average # of tasks in service• Lengthqueue
average length of queue• Lengthsystem
average # of tasks in system,the sum of Lengthserver and Lengthqueue

Server Utilization / traffic intensity
• Server utilizationthe mean number of tasks being serviced divided by the service rate
• Service rate = 1/Timeserver
• Server utilization=Arrival rate x Timeserver
(little’s law again)
Server Utilization
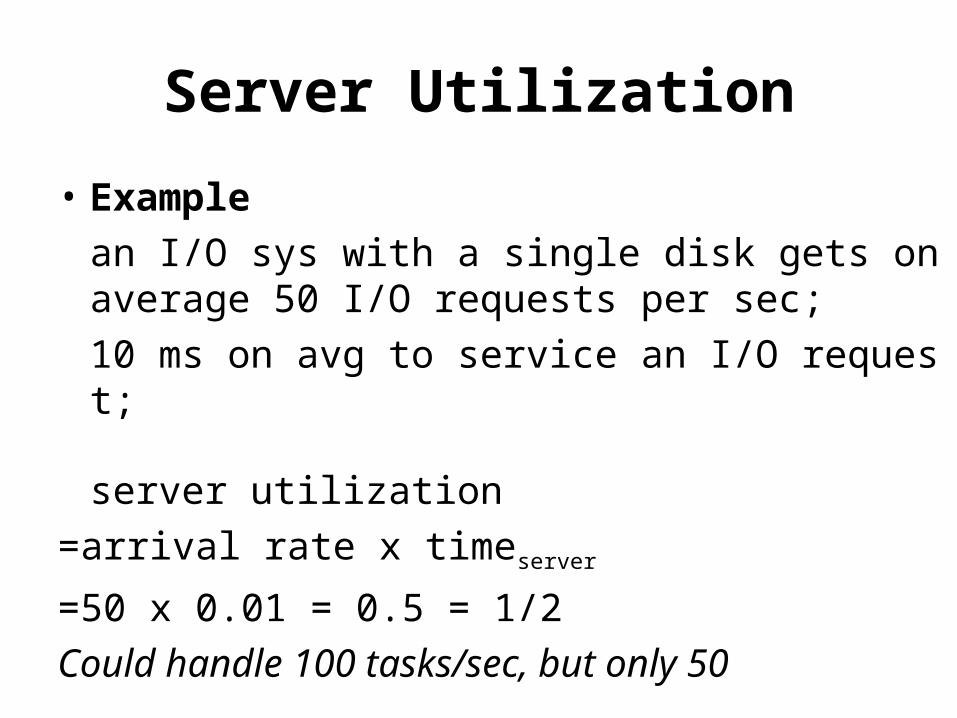
• Examplean I/O sys with a single disk gets on average 50 I/O requests per sec;10 ms on avg to service an I/O request;
server utilization =arrival rate x timeserver
=50 x 0.01 = 0.5 = 1/2Could handle 100 tasks/sec, but only 50

Queue Discipline
• How the queue delivers tasks to server• FIFO: first in, first out
Timequeue
=Lengthqueue x Timeserver
+ Mean time to complete service of task when new task arrives if server is busy
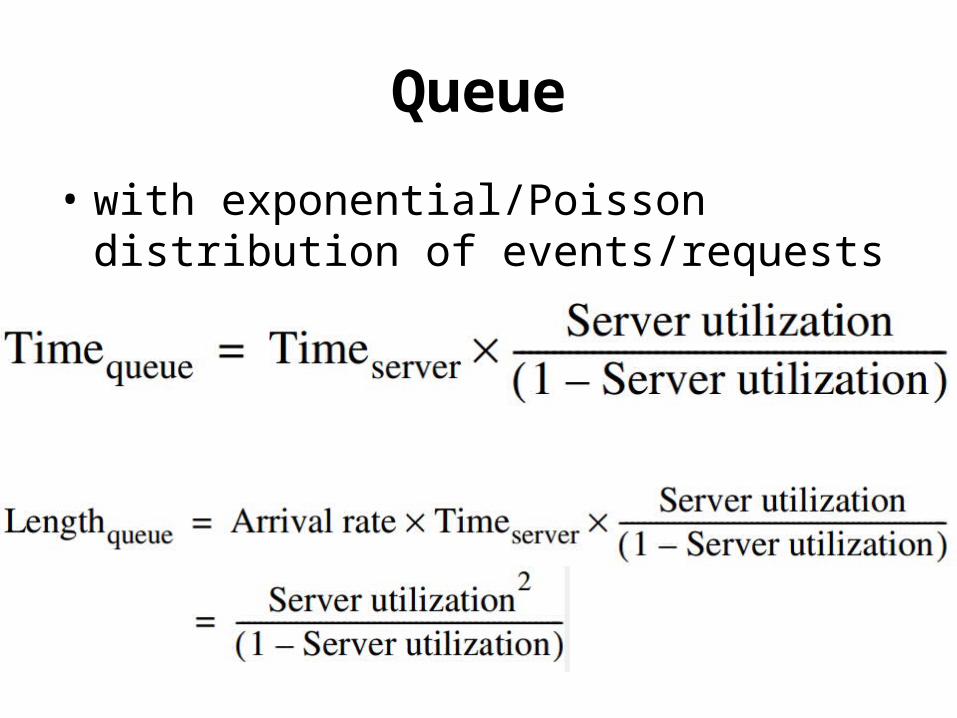
Queue
• with exponential/Poisson distribution of events/requests

Lengthqueue
• Examplean I/O sys with a single disk gets on average 50 I/O requests per sec;10 ms on avg to service an I/O request;
Lengthqueue
=
=

M/M/1 Queue
assumptions• The system is in equilibrium• Interarrival times (times between two successive
requests arriving) are exponentionally distributed
• Infinite population model: unlimited number of sources of requests
• Server starts on the next job immediately after finishing prior one
• FIFO queue with unlimited length• One server only

M/M/1 Queue
• M: Markovexponentially random request arrival;
• M: Markovexponentially random service time
• 1single server

M/M/1 Queue
• Examplea processor sends 40 disk I/Os per sec;exponentially distributed requests;avg service time of an older disk is 20ms;
Q: 1. avg dis utilization? 2. avg time spent in the queue?3. avg response time (queuing+serv)?

M/M/1 Queue
• Examplea processor sends 40 disk I/Os per sec;exponentially distributed requests;avg service time of an older disk is 20ms;
Q: 1. avg dis utilization? server utilization
=Arrival rate x Timeserver
=40 x 0.02 = 0.8

M/M/1 Queue
• Examplea processor sends 40 disk I/Os per sec;exponentially distributed requests;avg service time of an older disk is 20ms;
Q: 2. avg time spent in the queue?

M/M/1 Queue
• Examplea processor sends 40 disk I/Os per sec;exponentially distributed requests;avg service time of an older disk is 20ms;
Q:3. avg response time (queuing+serv)?Timesystem
=Timequeue + Timeserver
=80 + 20 = 100 ms
M/M/1 Queue
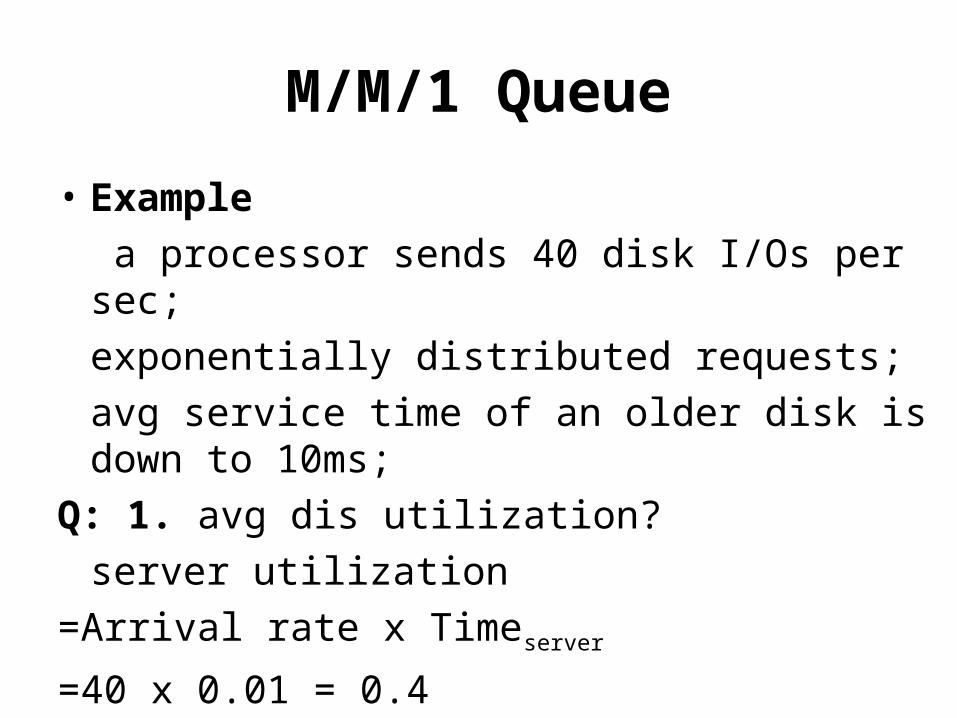
• Example a processor sends 40 disk I/Os per sec;exponentially distributed requests;avg service time of an older disk is down to 10ms;
Q: 1. avg dis utilization? server utilization
=Arrival rate x Timeserver
=40 x 0.01 = 0.4

M/M/1 Queue
• Example a processor sends 40 disk I/Os per sec;exponentially distributed requests;avg service time of an older disk is down to 10ms;
Q: 2. avg time spent in the queue?

M/M/1 Queue
• Example a processor sends 40 disk I/Os per sec;exponentially distributed requests;avg service time of an older disk is down to 10ms;
Q:3. avg response time (queuing+serv)?Timesystem
=Timequeue + Timeserver
=10 + 6.7 = 16.7 ms

M/M/m Queue
• multiple servers

M/M/m Queue
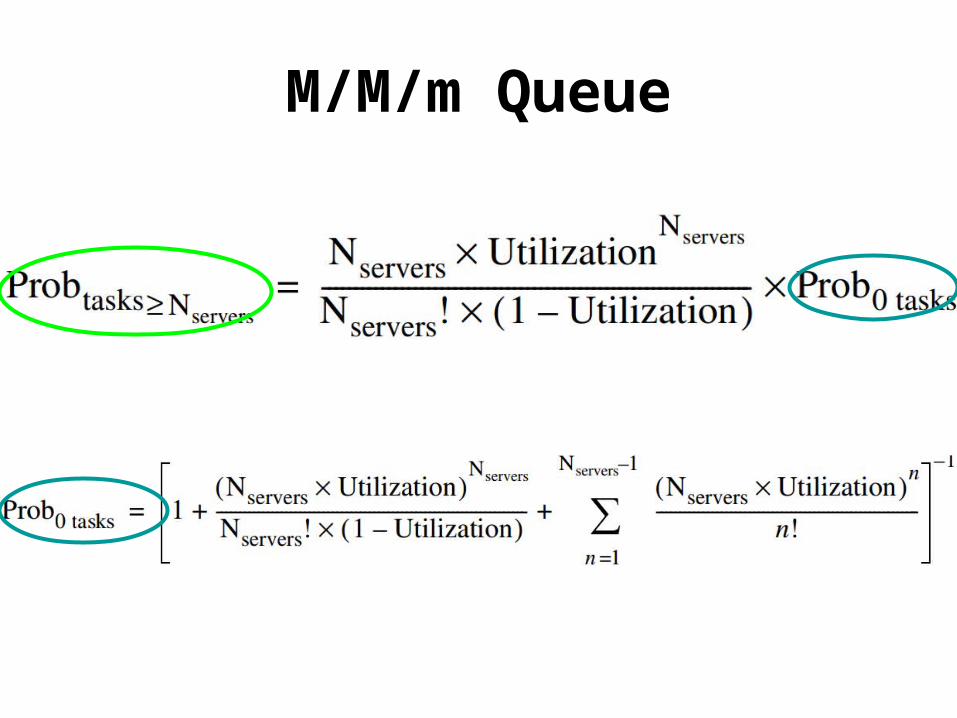
M/M/m Queue

M/M/m Queue
• Example a processor sends 40 disk I/Os per sec;exponentially distributed requests;avg service time for read is 20ms;two disks duplicate the data;all requests are reads;

M/M/m Queue
• Example

M/M/m Queue
• Example

M/M/m Queue
• Exampleavg response time
=20 + 3.8=23.8 ms

?