Embed Size (px)
Citation preview
Lecture 14. Phases of Pure Substances (Ch.5)
T
P
The generic phase diagram of a substance in the P-T coordinates is shown above. Every point of this diagram is an equilibrium state; different states of the system in equilibrium are called phases. The lines dividing different phases are called the coexistence curves. Along these curves, the phases coexist in equilibrium, and thesystem is macroscopically inhomogeneous. All three coexistence curves can meet at the triple point – in this case, all three phases coexist at (Ttr , Ptr).
Up to now we have dealt almost exclusively with systems consisting of a single phase. In this lecture, we will learn how more complicated, multi-phase systems can be treated by the methods of thermodynamics. The guiding principle will be the minimization of the Gibbs free energy in equilibrium for all systems, including the multi-phase ones.

The Coexistence Curves
Any system in contact with the thermal bath is governed by the minimum free energy principle. The shape of coexistence curves on the P-T phase diagram is determined by the condition:
( ) ( )TPGTPG ,, 21 =
- otherwise, the system would be able to decrease its Gibbs free energy by transforming the phase with a higher μ into the phase with lower μ. Two phases are in a state of diffusive equilibrium: there are as many molecules migrating from 1 to 2 as the molecules migrating from 2 to 1.
( ) ( )TPTP ,, 21 μμ =μNG =and, since
Also for equilibrium between the phases:
21 TT = - as for any two sub-systems in equilibrium
21 PP = - the phase boundary does not move
Along the coexistence curves, two different phases 1and 2 coexist in equilibrium (e.g., ice and water coexist at T = 00C and P = 1bar). The system undergoes phase separation each time we cross the equilibrium curve (the system is spatially inhomogeneous along the equilibrium curves).
Though G is continuous across the transition, H demonstrates a step-like behavior:
TSHTSPVUNG −=−+== μ STH Δ=Δ (different phases have different values of the entropy)
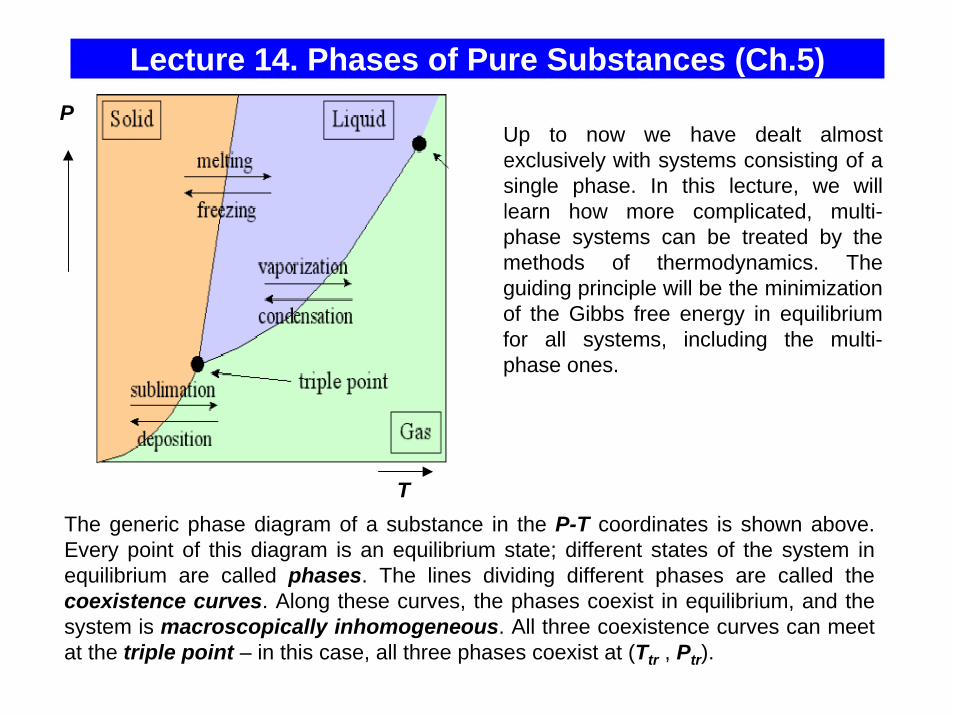
Example: the Gas-Liquid Transformation
[ ]VTVTVTPT N
STNUTSUF
NF
NG
,,,,⎟⎠⎞
⎜⎝⎛∂∂
−⎟⎠⎞
⎜⎝⎛∂∂
=−≡=⎟⎠⎞
⎜⎝⎛∂∂
=⎟⎠⎞
⎜⎝⎛∂∂
=μ
Gas: ∂U/∂N term is small and positive (kin. energy of a single molecule), T(∂S/∂N) term is large and positive ⇒ μ is negative, and rapidly decreases with increasing T.
Liquid: ∂U/∂N term is negative (attraction between molecules), T(∂S/∂N) term is smaller than that in gas and positive ⇒ μ is also negative, and slowly increases with decreasing T .
μ
T
gas
liquid0
phasetransformationS
TG
NP
−=⎟⎠⎞
⎜⎝⎛∂∂
,
( ) ( ) ( )STTGG TNPTNP 0,,,, 0−−≈
S(water) = 70 J/KS(vapor) = 189 J/K
Table on page 404 (a very useful source of information) provides the values of H and G for different phases of many substances. The data are provided per mole, at T=298 K and P=1 bar. For example, let’s check that at the boiling point, the values of G for liquid water and water vapor are equal to each other:
( ) molJmolKJKmolJGKTliq /10242)/(7075/10237 33
373×≈⋅×−×−≈
=
( ) molJmolKJKmolJGKTvap /10242)/(18975/106.228 33
373×≈⋅×−×−≈
=
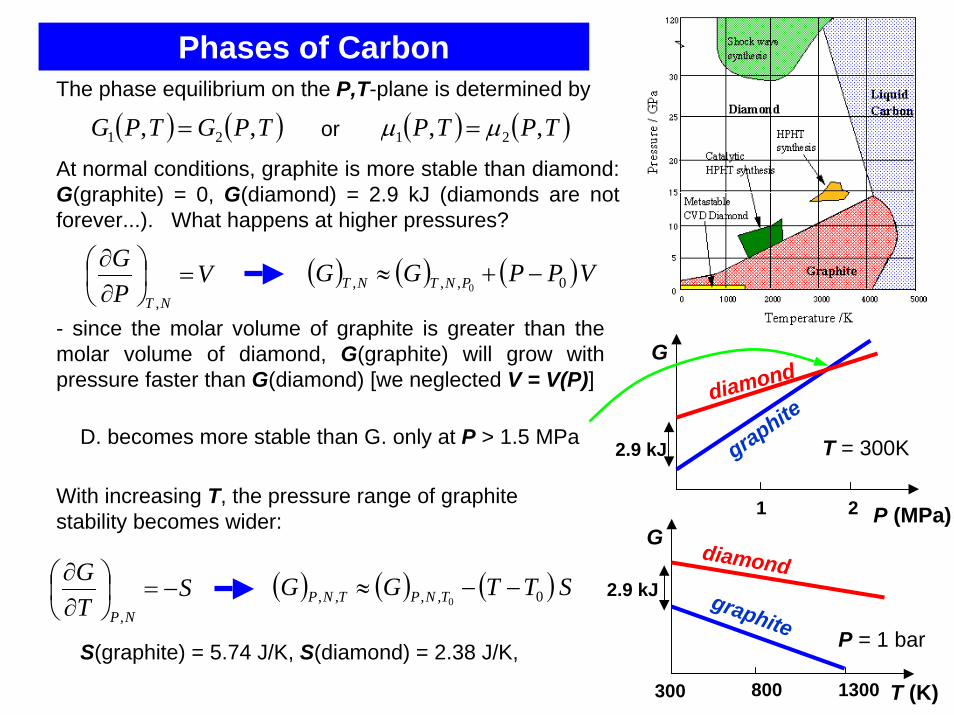
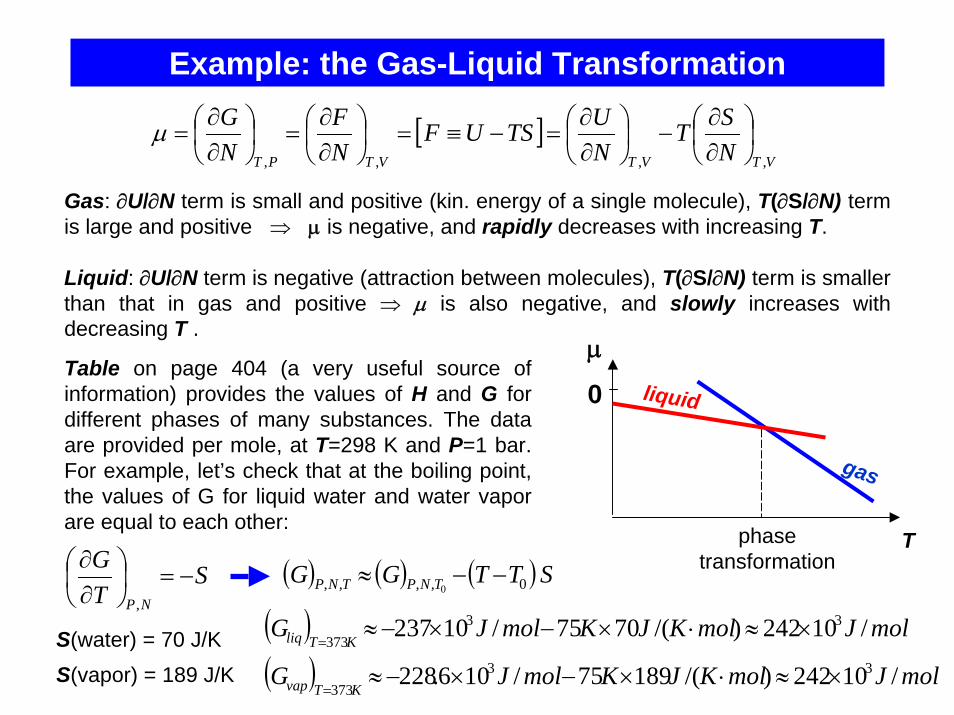
Phases of Carbon
G
P (MPa)1 2
graphitediamond
2.9 kJ
The phase equilibrium on the P,T-plane is determined by
( ) ( ) ( ) ( )TPTPTPGTPG ,,,, 2121 μμ == or
At normal conditions, graphite is more stable than diamond: G(graphite) = 0, G(diamond) = 2.9 kJ (diamonds are not forever...). What happens at higher pressures?
VPG
NT
=⎟⎠⎞
⎜⎝⎛∂∂
,
- since the molar volume of graphite is greater than the molar volume of diamond, G(graphite) will grow with pressure faster than G(diamond) [we neglected V = V(P)]
D. becomes more stable than G. only at P > 1.5 MPa
STG
NP
−=⎟⎠⎞
⎜⎝⎛∂∂
,
( ) ( ) ( )VPPGG PNTNT 0,,, 0−+≈
With increasing T, the pressure range of graphite stability becomes wider:
( ) ( ) ( ) STTGG TNPTNP 0,,,, 0−−≈
S(graphite) = 5.74 J/K, S(diamond) = 2.38 J/K,
G
T (K)800 1300
graphite
diamond2.9 kJ
300
T = 300K
P = 1 bar
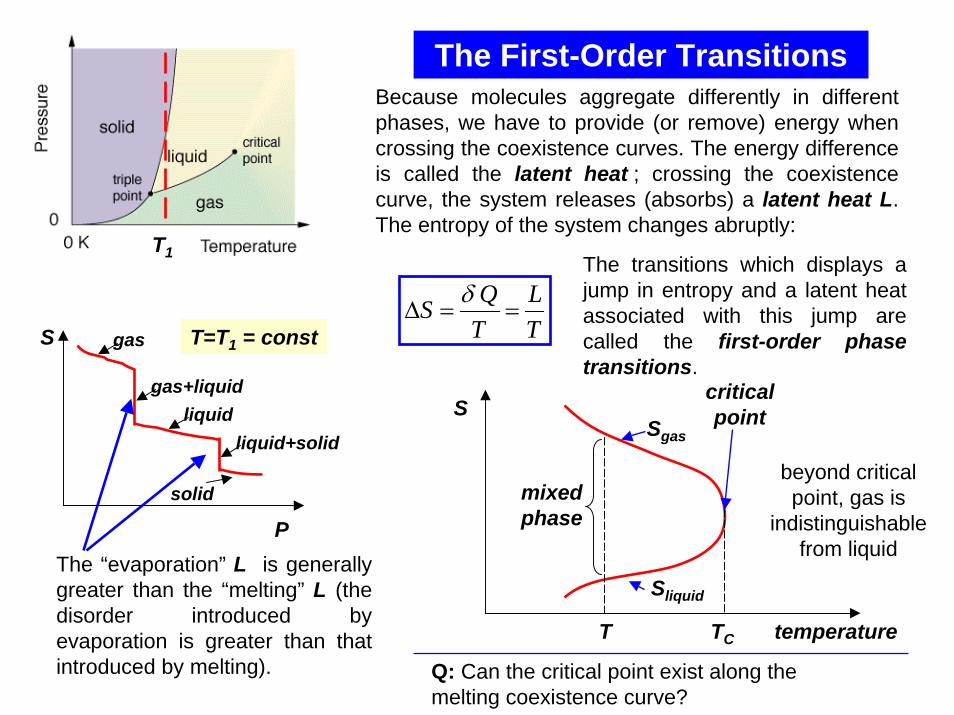
The First-Order Transitions
P
S T=T1 = constgas
gas+liquidliquid
liquid+solid
solid
Because molecules aggregate differently in different phases, we have to provide (or remove) energy when crossing the coexistence curves. The energy difference is called the latent heat ; crossing the coexistence curve, the system releases (absorbs) a latent heat L. The entropy of the system changes abruptly:
T1
TL
TQS ==Δ
δThe transitions which displays a jump in entropy and a latent heat associated with this jump are called the first-order phase transitions.
The “evaporation” L is generally greater than the “melting” L (the disorder introduced by evaporation is greater than that introduced by melting).
T TC
SSgas
Sliquid
criticalpoint
mixedphase
temperature
beyond critical point, gas is
indistinguishable from liquid
Q: Can the critical point exist along the melting coexistence curve?

The First-Order Transitions (cont.)
G
T
solid
liquid
gas
P,N = const
(Pr. 5.9).
On the graph G(T) at P,N = const, the slope dG/dT is always negative:
G
TS
T
ΔS = L/T
NPTGS
,⎟⎠⎞
⎜⎝⎛∂∂
−=T
CP
NPP T
STC,
⎟⎠⎞
⎜⎝⎛∂∂
=
Note that in the first-order transitions, the G(T) curves have a real meaning even beyond the intersection point, this results in metastabilityand hysteresis. There is usually an energy barrier that prevents a transition occurring from the higher μ to the lower μ phase (e.g., gas, being cooled below Ttr does not immediately condense, since surface energy makes the formation of very small droplets energetically unfavorable).
L. water can exist at T far lower than the freezing temperature: water in organic cells can avoid freezing down to –200C in insects and down to –470C in plants.
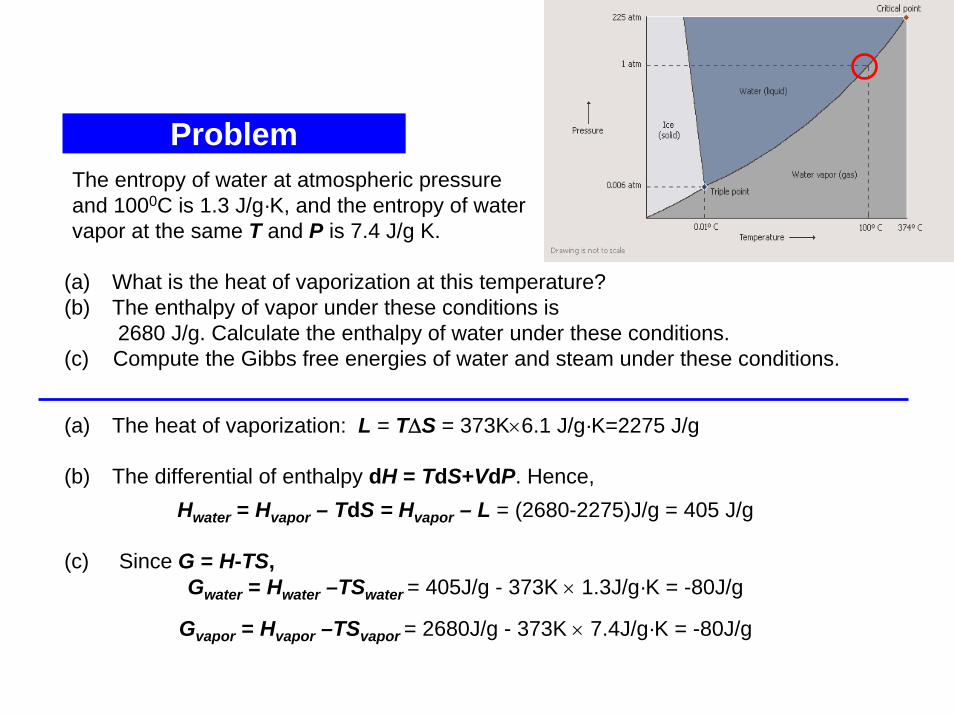
Problem
(a) What is the heat of vaporization at this temperature?(b) The enthalpy of vapor under these conditions is
2680 J/g. Calculate the enthalpy of water under these conditions.(c) Compute the Gibbs free energies of water and steam under these conditions.
The entropy of water at atmospheric pressure and 1000C is 1.3 J/g·K, and the entropy of water vapor at the same T and P is 7.4 J/g K.
(a) The heat of vaporization: L = TΔS = 373K×6.1 J/g·K=2275 J/g
(b) The differential of enthalpy dH = TdS+VdP. Hence,Hwater = Hvapor – TdS = Hvapor – L = (2680-2275)J/g = 405 J/g
(c) Since G = H-TS,Gwater = Hwater –TSwater = 405J/g - 373K × 1.3J/g·K = -80J/g
Gvapor = Hvapor –TSvapor = 2680J/g - 373K × 7.4J/g·K = -80J/g
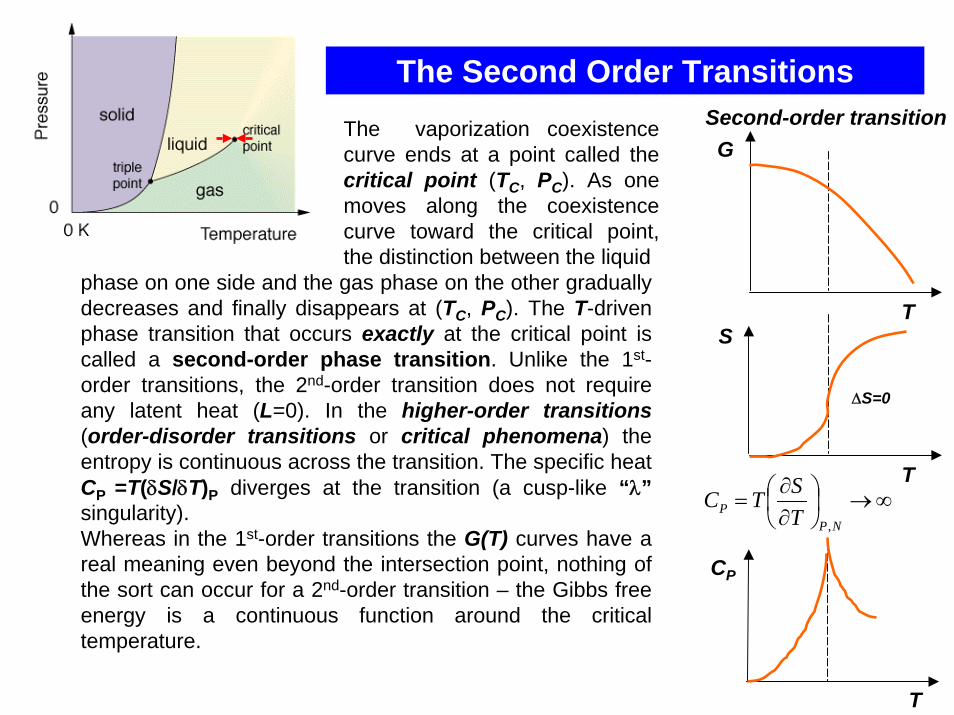
The Second Order Transitions
phase on one side and the gas phase on the other gradually decreases and finally disappears at (TC, PC). The T-driven phase transition that occurs exactly at the critical point is called a second-order phase transition. Unlike the 1st-order transitions, the 2nd-order transition does not require any latent heat (L=0). In the higher-order transitions(order-disorder transitions or critical phenomena) the entropy is continuous across the transition. The specific heat CP =T(δS/δT)P diverges at the transition (a cusp-like “λ”singularity).Whereas in the 1st-order transitions the G(T) curves have a real meaning even beyond the intersection point, nothing of the sort can occur for a 2nd-order transition – the Gibbs free energy is a continuous function around the critical temperature.
G
TS
T
ΔS=0
Second-order transition
T
CP
The vaporization coexistence curve ends at a point called the critical point (TC, PC). As one moves along the coexistence curve toward the critical point, the distinction between the liquid
∞→⎟⎠⎞
⎜⎝⎛∂∂
=NP
P TSTC
,

The Clausius-Clapeyron Relation ( ) ( )TPGTPG ,, 21 =
Along the phase boundary:P
T
ΔP
ΔT
phase boundary( ) ( )TPGTPG ,, 21 =
( ) ( )( ) ( )TPVTPV
TPSTPSdTdP
,,,,
21
21
−−
=- the slope is determined by the entropies and volumes of the two phases. The larger the difference in entropy between the phases – the steeper the coexistence curve, the larger the difference in molar volumes – the shallower the curve.
(compare the slopes of melting and vaporization curves)
Since S1 - S2 = L/T (L is the latent heat), we arrive at the Clausius-Clapeyron Relation :
( )( )TVT
TLdTdP
Δ=
( ) ( )[ ]( )TL
TVTVTdPdT liqgas −
=
- since Vgas > Vliq , and L > 0 for the “liquid→gas”transformation, the boiling temperature increases with pressure. The “freezing” temperature with increasing pressure either increases or decreases, depending on the sign Vliq – Vsolid (exception – 3He).
dPVdTSdPVdTS 2211 +−=+−For the slope of the boundary we have:
( ) ( )TPTP ,, 21 μμ =
Consider two distinct displacements along the coexistence curve, one immediately above the curve (in phase 1), the other immediately below the curve, in phase 2. Because the chemical potentials remain equal along the curve, dμ1 = dμ2
(applies to all coexistence curves)
Example:

Problem1 kg of water at 200C is converted into ice at -100C (all this happens at P = 1 bar). The latent heat of ice melting Lmelt = 334 kJ/kg, the heat capacity of water at constant pressure is 4.2 kJ/(kg·K) and that of ice 2.1 kJ/(kg·K).(a) What is the total change in entropy of the water-ice system? (b) If the density of water at 00C is taken as 10% greater than that of ice, what is the slope of the melting curve of ice at this temperature? Give both sign and size.
( ) ( )
KJ
KJ
KJ
KJ
KkgkJK
kgkJKkgkJkgS
1606781231297
263273ln/1.2
273/334
273293ln/2.41
−=−−−=
⎟⎟⎠
⎞⎜⎜⎝
⎛⎥⎦⎤
⎢⎣⎡⋅−−⎥⎦
⎤⎢⎣⎡⋅−=Δ
3. From 00C to -100C:
2. Melting of ice
1. From 200C to 00C:
melt
melt
TLmS −=Δ
⎟⎠⎞
⎜⎝⎛−==Δ=∂
∂= ∫ K
KmcT
dTmcSmcdTQTQdS water
K
K
water
273293ln
273
293
⎟⎠⎞
⎜⎝⎛−==Δ ∫ K
KmcT
dTmcS ice
K
K
ice
263273ln
263
273
(a)
(b) ( )( )
( ) KPamkgKJ
vvSS
dTdP
icewater
icewater /1023.1101.0/1231 7
33 ×−=×−
⋅=
−−
= −
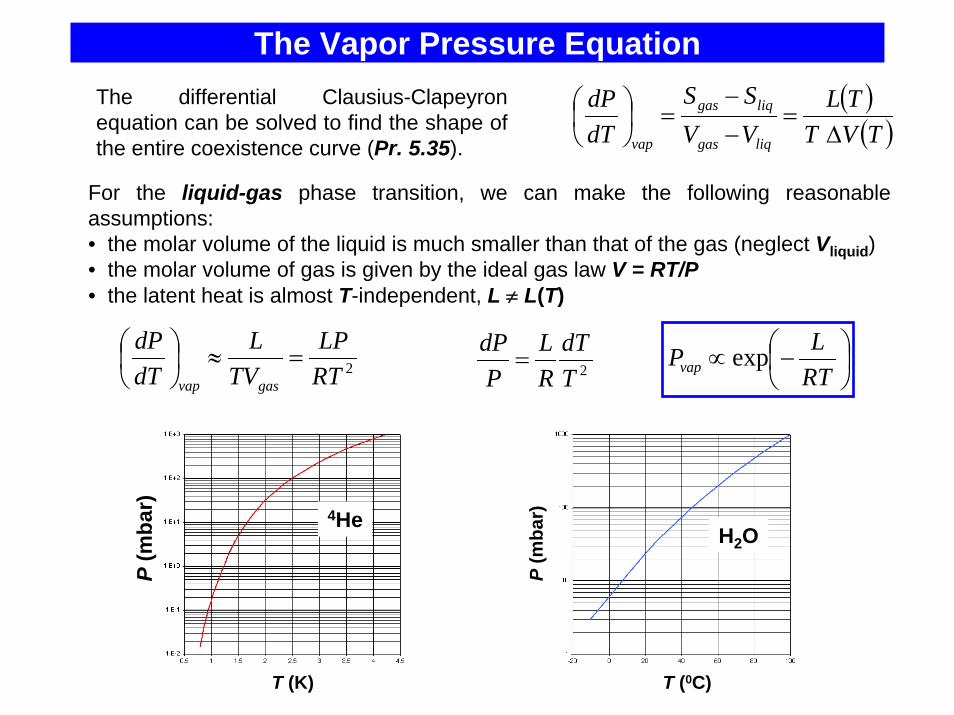
The Vapor Pressure EquationThe differential Clausius-Clapeyron equation can be solved to find the shape of the entire coexistence curve (Pr. 5.35).
( )( )TVT
TLVVSS
dTdP
liqgas
liqgas
vap Δ=
−
−=⎟
⎠⎞
⎜⎝⎛
For the liquid-gas phase transition, we can make the following reasonable assumptions:• the molar volume of the liquid is much smaller than that of the gas (neglect Vliquid)• the molar volume of gas is given by the ideal gas law V = RT/P• the latent heat is almost T-independent, L ≠ L(T)
2RTLP
TVL
dTdP
gasvap
=≈⎟⎠⎞
⎜⎝⎛
2TdT
RL
PdP
= ⎟⎠⎞
⎜⎝⎛−∝
RTLPvap exp
4HeH2O
P (m
bar)
P (m
bar)
T (K)
P (m
bar)
T (0C)
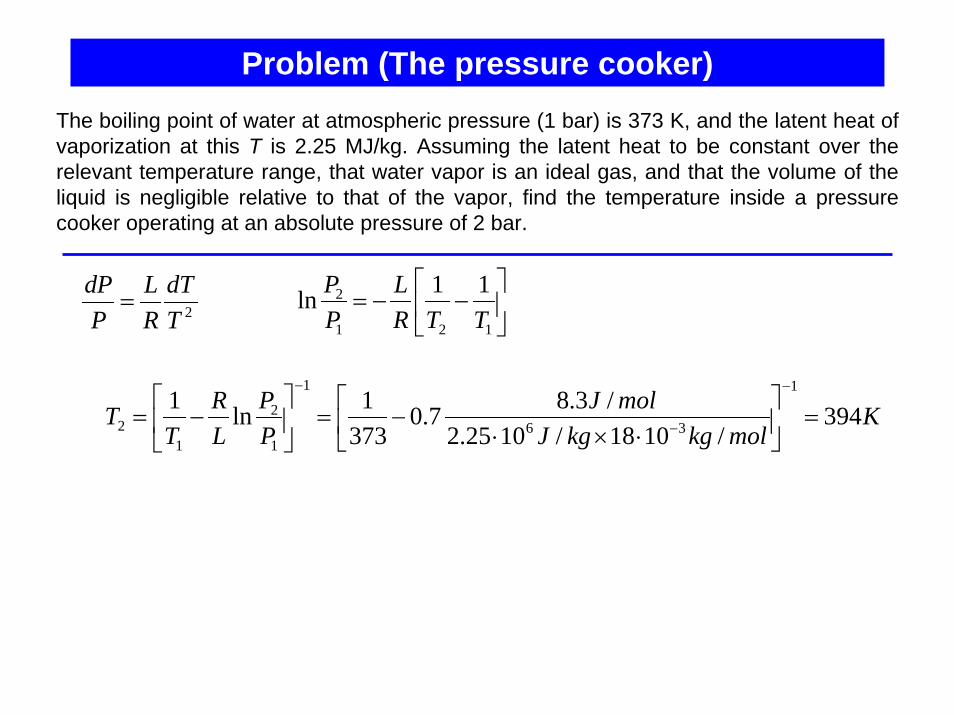
Problem (The pressure cooker)The boiling point of water at atmospheric pressure (1 bar) is 373 K, and the latent heat of vaporization at this T is 2.25 MJ/kg. Assuming the latent heat to be constant over therelevant temperature range, that water vapor is an ideal gas, and that the volume of the liquid is negligible relative to that of the vapor, find the temperature inside a pressure cooker operating at an absolute pressure of 2 bar.
2TdT
RL
PdP
= ⎥⎦
⎤⎢⎣
⎡−−=
121
2 11lnTTR
LPP
KmolkgkgJ
molJPP
LR
TT 394
/1018/1025.2/3.87.0
3731ln1
1
36
1
1
2
12 =⎥
⎦
⎤⎢⎣
⎡⋅×⋅
−=⎥⎦
⎤⎢⎣
⎡−=
−
−
−
Problem
P
T
Ptr
Ttr
gas
solid liquid
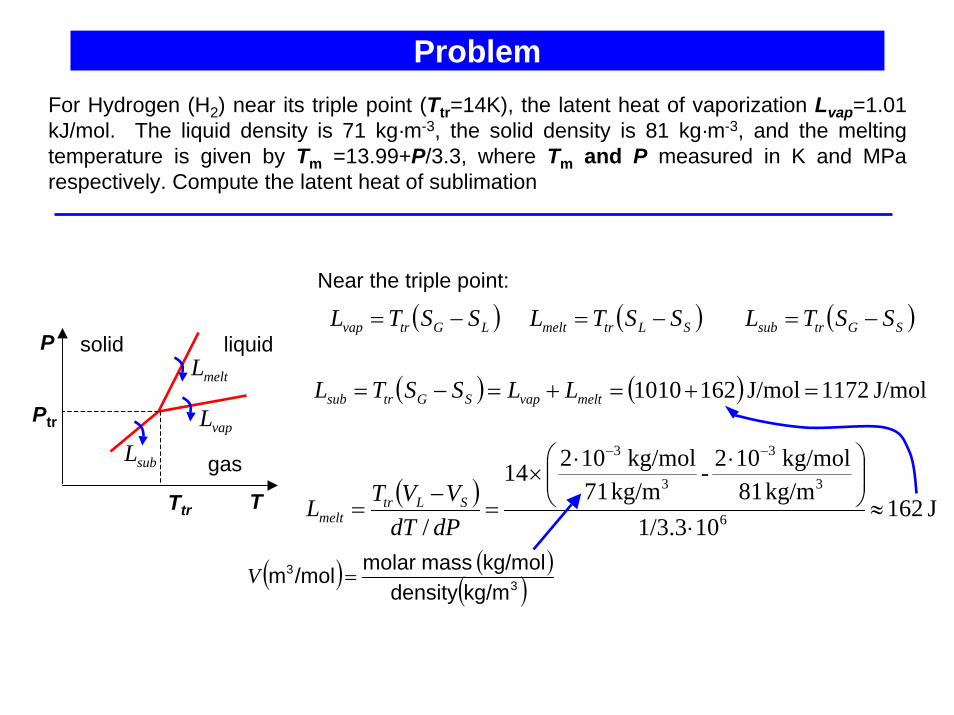
Near the triple point:
( ) J 162101/3.3
kg/m 81kg/mol 102-
kg/m 71kg/mol 10214
/ 6
3
3
3
3
≈⋅
⎟⎟⎠
⎞⎜⎜⎝
⎛ ⋅⋅×
=−
=
−−
dPdTVVTL SLtr
melt
( ) ( ) J/mol 1172J/mol 1621010 =+=+=−= meltvapSGtrsub LLSSTL
( )LGtrvap SSTL −= ( )SLtrmelt SSTL −= ( )SGtrsub SSTL −=
vapL
subL
meltL
( ) ( )( )3
3
kg/mdensitykg/mol mass molar/molm =V
For Hydrogen (H2) near its triple point (Ttr=14K), the latent heat of vaporization Lvap=1.01 kJ/mol. The liquid density is 71 kg·m-3, the solid density is 81 kg·m-3, and the melting temperature is given by Tm =13.99+P/3.3, where Tm and P measured in K and MPa respectively. Compute the latent heat of sublimation
Problem (cont.)
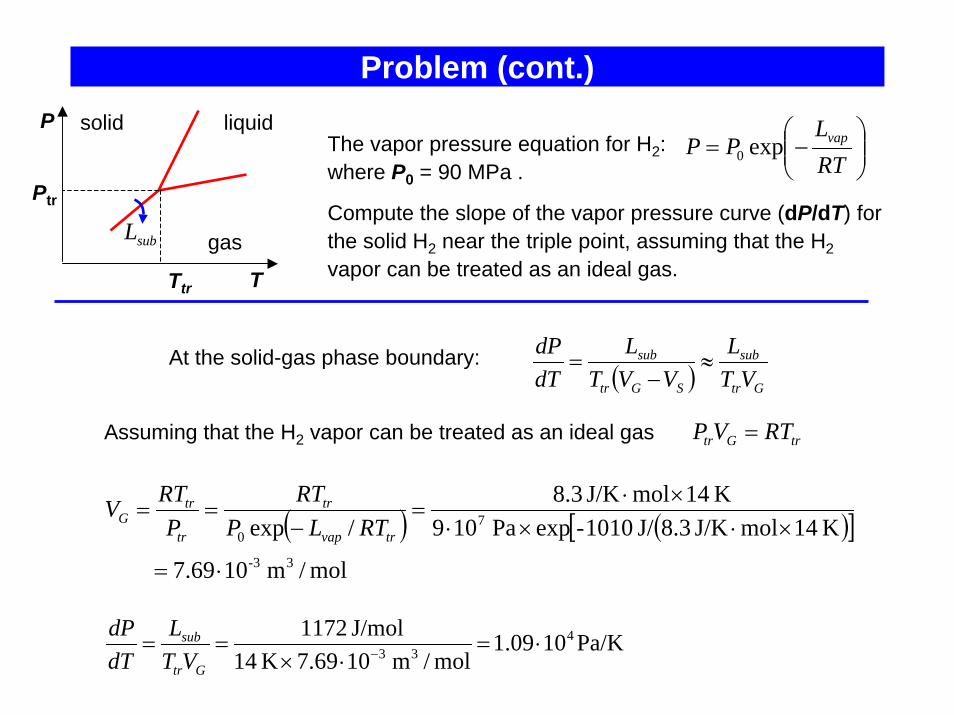
At the solid-gas phase boundary:( ) Gtr
sub
SGtr
sub
VTL
VVTL
dTdP
≈−
=
trGtr RTVP =
( ) ( )[ ]mol/m 1069.7
K 14molJ/K 3.8J/ 1010-expPa 109K 14molJ/K 3.8
/exp33-
70
⋅=
×⋅×⋅×⋅
=−
==trvap
tr
tr
trG RTLP
RTP
RTV
Pa/K1009.1mol/m 1069.7K 14
J/mol 1172 433 ⋅=
⋅×== −
Gtr
sub
VTL
dTdP
Assuming that the H2 vapor can be treated as an ideal gas
⎟⎟⎠
⎞⎜⎜⎝
⎛−=
RTL
PP vapexp0The vapor pressure equation for H2: where P0 = 90 MPa .
Compute the slope of the vapor pressure curve (dP/dT) for the solid H2 near the triple point, assuming that the H2vapor can be treated as an ideal gas.
P
T
Ptr
Ttr
gas
solid liquid
subL

Phase Diagram of H2OFor most “normal” substances, the slope of the melting curve is positive (SL>SS, VL>VS). The phase diagram for water shows the characteristic negative slope of the solid-liquid equilibrium curve. The ice is less dense than water (VL<VS): the hydrogen bonds determine the tetrahedral coordination and openness of the structure of ice. As ice melts into water the change in entropy (or the latent heat) is positive, while the change in volume is negative, hence the negative slope.
The negative slope of the solid-liquid coexistence curve makes ice skating possible: ice melts under the pressure exerted by the skate blade. The Clausius-Clapeyron equation provides the connection between ice skating and the observation that ice floats on water.
Ice I
( )0<
−=
LVVT
dPdT solliq

ProblemIce skating becomes unpleasant if the weather is too cold so that the ice becomes too “hard”. Estimate the lowest temperature for which ice skating is still enjoyable for a person of normal weight. The given data are that the latent heat of fusion of water is 333 J/g, that the density of liquid water is 1 g/cm3, and that ice cubes float with ~9/10 of their volume submerged.
( )L
VVTdPdT solliq −=
The lowest temperature for enjoyable skating is the temperature at which the pressure exerted by the skater on ice is equal to the pressure on the coexistence curve at this T. At P0 =1 bar, ice melts at T0 = 273.15K (=00C).
( )( ) ( ) KPagJ
gmKPPL
VVTT solliq 810
/333/101.0273 8
36
00 −≈
×−=−
−≈Δ
−
pressure: ( )atmPamskgm
smkgareamgP 10001010
101.0/10100 812824
2
==⋅=××
≈= −−
The lowest temperature: - 80C, about right.Let’s verify that from two points on the melting curve, (0.006 bar 273.16K) and (1 bar 273.15K) we can get a reasonable estimate for L:
( ) ( )( )( ) J/g
KPa/gmK 3
27101.0
10994.0101.027327356
21
21 ≈××××
=−
−−=
−
TTPPVVT
KL solliq

Why Is Ice Slippery? (R. Rosenberg, Physics today, Dec. 2005)
Pressure melting does not explain why skating is possible in climates as cold as –30oC.This popular explanation of the thermodynamics of ice skating is not the whole story (the experiments by Robert Wood and other researchers). The mechanism(s) is much more complicated.
The physicists interested in the problem: Faraday, Gibbs, etc.
Two other important factors:
Frictional heating. S. Colbeck in his experiments (1988-1997) attached a thermocouple to a skate blade (and to the bottom of skis) and showed that the increase in temperature with velocity was consistent with frictional heating.
Liquid layer on ice surface below zero. There is a disordered (liquid-like) layer on the surface of ice (its thickness - ~ 10 nm) down to ~ -30oC.
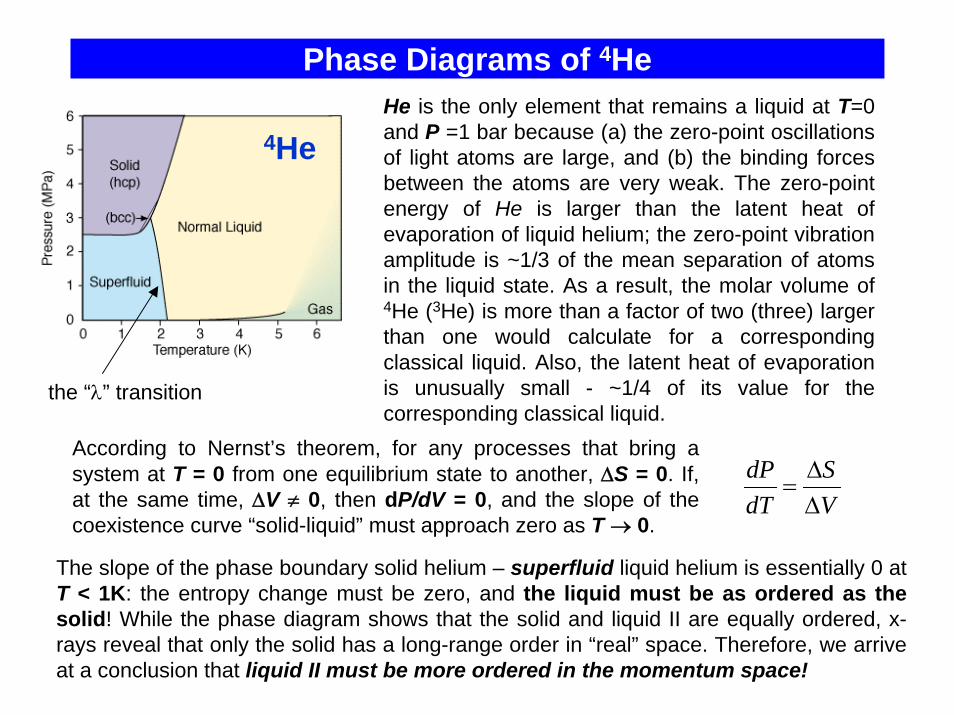
Phase Diagrams of 4HeHe is the only element that remains a liquid at T=0 and P =1 bar because (a) the zero-point oscillations of light atoms are large, and (b) the binding forces between the atoms are very weak. The zero-point energy of He is larger than the latent heat of evaporation of liquid helium; the zero-point vibration amplitude is ~1/3 of the mean separation of atoms in the liquid state. As a result, the molar volume of 4He (3He) is more than a factor of two (three) larger than one would calculate for a corresponding classical liquid. Also, the latent heat of evaporation is unusually small - ~1/4 of its value for the corresponding classical liquid.
4He
The slope of the phase boundary solid helium – superfluid liquid helium is essentially 0 at T < 1K: the entropy change must be zero, and the liquid must be as ordered as the solid! While the phase diagram shows that the solid and liquid II are equally ordered, x-rays reveal that only the solid has a long-range order in “real” space. Therefore, we arrive at a conclusion that liquid II must be more ordered in the momentum space!
VS
dTdP
ΔΔ
=According to Nernst’s theorem, for any processes that bring a system at T = 0 from one equilibrium state to another, ΔS = 0. If, at the same time, ΔV ≠ 0, then dP/dV = 0, and the slope of the coexistence curve “solid-liquid” must approach zero as T → 0.
the “λ” transition
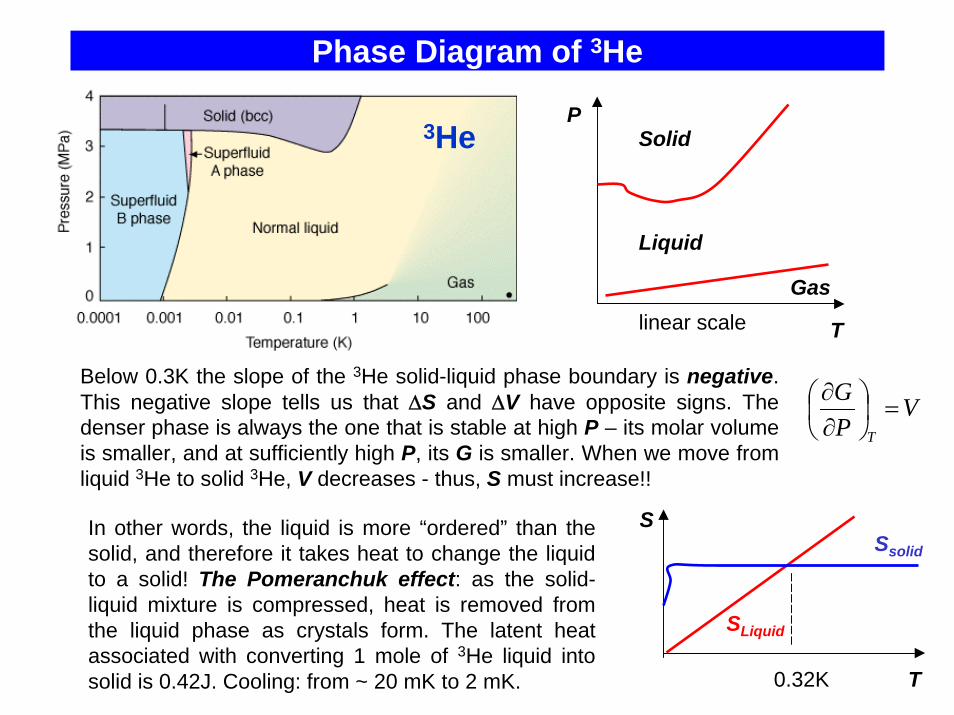
Phase Diagram of 3He
3He
Below 0.3K the slope of the 3He solid-liquid phase boundary is negative. This negative slope tells us that ΔS and ΔV have opposite signs. The denser phase is always the one that is stable at high P – its molar volume is smaller, and at sufficiently high P, its G is smaller. When we move from liquid 3He to solid 3He, V decreases - thus, S must increase!!
VPG
T
=⎟⎠⎞
⎜⎝⎛∂∂
T
Solid
Liquid
Gas
P
linear scale
In other words, the liquid is more “ordered” than the solid, and therefore it takes heat to change the liquid to a solid! The Pomeranchuk effect: as the solid-liquid mixture is compressed, heat is removed from the liquid phase as crystals form. The latent heat associated with converting 1 mole of 3He liquid into solid is 0.42J. Cooling: from ~ 20 mK to 2 mK. T
Ssolid
SLiquid
S
0.32K

Problem
(a) Find the temperature of solidification Tmin at P = Pmin(b) Find the temperature dependence of the latent heat of melting Lmelt. (c) Find the pressure of solidification of 3He at T = 0.
( )SL
melt
melt VVTL
dTdP
−=⎟
⎠⎞
⎜⎝⎛(a) The minimum on the solid-liquid coexistence curve (P= Pmin)
corresponds to dP/dT = 0, and, thus, Lmelt(Tmin) =0.
( ) ( ) ( )[ ]minminminmin TSTSTTL SLmelt −= KTT 15.02ln0min ≈=
(b) ( ) ( ) ( )[ ] 2ln0
2
RTT
RTTSTSTTL SLmelt −=−=
The negative sign of Lmelt for 3He is a unique phenomenon (the Pomeranchuk effect). Over the range of T where Lmelt < 0, the slope of the L-S coexistence curve is negative. (Note that, in contrast to dPmelt/dT < 0 on the phase diagram for water, here the negative slope is observed for VL-VS > 0).
T
Lmelt
Tmin
- a parabola that goes through 0 at T = Tmin.
(c) By integrating the Cl.-Cl. eq. dTTT
VRdP ⎟⎟
⎠
⎞⎜⎜⎝
⎛−
Δ= 2ln
0
( ) Pa 107.312ln2
02ln2
50
0min
0
2
⋅=⎟⎠⎞
⎜⎝⎛ −
Δ−===+⎟⎟
⎠
⎞⎜⎜⎝
⎛−
Δ= TT
VRPTPconstconstT
TT
VRP
At the atmospheric pressure, 3He remains liquid even at T=0. The minimum pressure of 3He solidification is Pmin= 28.9 bar. At low temperatures, the entropy of 1 mole of liquid 3He is SL= RT/T0, where T0=0.22 K, the entropy of solid 3He is temperature-independent: SS = R ln2. The difference between the molar volumes of liquid and solid 3He ΔV = VL-VS = 1.25 cm3/mol
T
Pmelt
Tmin

Summary1. The shape of coexistence curves on the P-T diagram:
( ) ( )TPGTPG ,, 21 =
2. The latent heat in the 1st order phase transitions:
TSHTSPVUNG −=−+== μ LSTH =Δ=Δ
TL
TQS ==Δ
δ
( )( )TVT
TLdTdP
Δ=
3. The slope of the coexistence curve is given by the Clausius-Clapeyron Relation:
By integrating the CC relation, one can restore the shape of the coexistence curve, P(T)
2RTLP
TVL
dTdP
gasvap
=≈⎟⎠⎞
⎜⎝⎛
2TdT
RL
PdP
= ⎟⎠⎞
⎜⎝⎛−∝
RTLPvap exp
4. For the gas-liquid transition, we can replace the CC relation with the vapor equation:
5. The triple point: ( ) ( ) ( )trtrsoltrtrgastrtrliq TPGTPGTPG ,,, ==
( ) ( ) ( )SGtrsubSLtrmeltLGtrvap SSTLSSTLSSTL −=−=−= ( ) ( ) ( )trsubtrvaptrmelt TLTLTL =+