Embed Size (px)
Citation preview
Sandwich Panels
• Two stiff strong skins separated by a lightweight core
• Separation of skins by core increases moment of inertia, with little increase in weight
• Efficient for resisting bending and buckling
• Like an I beam: faces = flanges — carry normal stresscore = web — carries shear stress
• Examples: and
• Faces: composites, metalsCores: honeycombs, foams, balsa
honeycombs: lighter then foam cores for required stiffness, strengthfoams: heavier, but can also provide thermal insulation
• Mechanical behavior depends on face and core properties and/or geometry
• Typically, panel must have some required stiffness and/or strength
• Often, want to minimize weight — optimization probleme.g. refrigerated vehicles; sporting equipment (sail boats, skis)
1
Lecture 16-17, Sandwich Panel Notes, 3.054
engineering nature
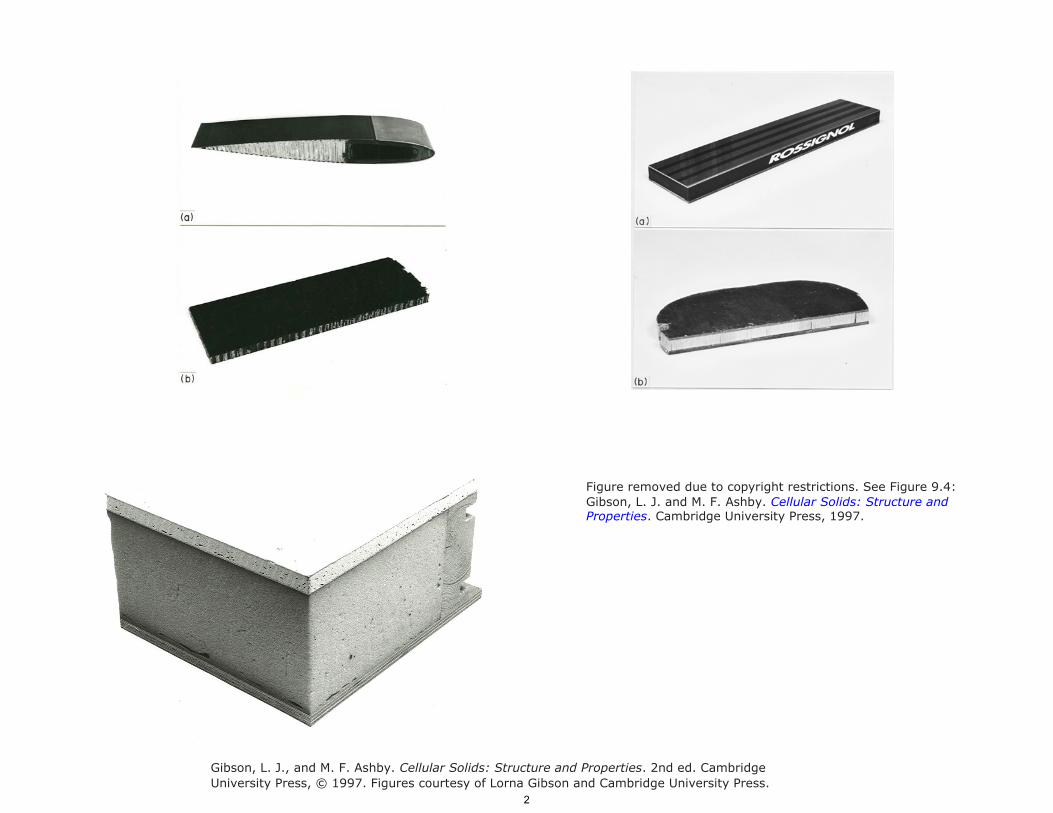
Figure removed due to co pyright re strictions. See Figure 9.4:
Gibson, L. J. and M. F. Ashby. Cellular Solids: Structure and Properties. Cambridge University Press, 1997.
Gibson, L. J., and M. F. Ashby. Cellular Solids: Structure and Properties. 2nd ed. Cambridge
University Press, © 1997. Figures courtesy of Lorna Gibson and Cambridge University Press.
2

Sandwich beam stiffness
• Analyze beams here (simpler than plates; same ideas apply)
V
B.M.
Face: ρf , Ef , σyf
Core: ρ∗c, Ec∗, σc
∗
(Solid: ρs, Es, σys )
Typically Ec∗ � Ef
δ = δb + δs :
P l3δb =
bending deflection δb and shear deflection (of core) δssince Gc
∗ � Ef , core sheer deflections significant
B1=constant, depending on loading configurationB1(EI)eq 3 pt bend, B1 = 48
3
(EI eq =(Efbt
)12× 2)
+ Ecbc3
12+ Ef bt
(ctt 2
2
)× 2 parallel axis theorem
Efbt3
=6
+Ecbc
3
12+Efbt
2(c+ t)2
3
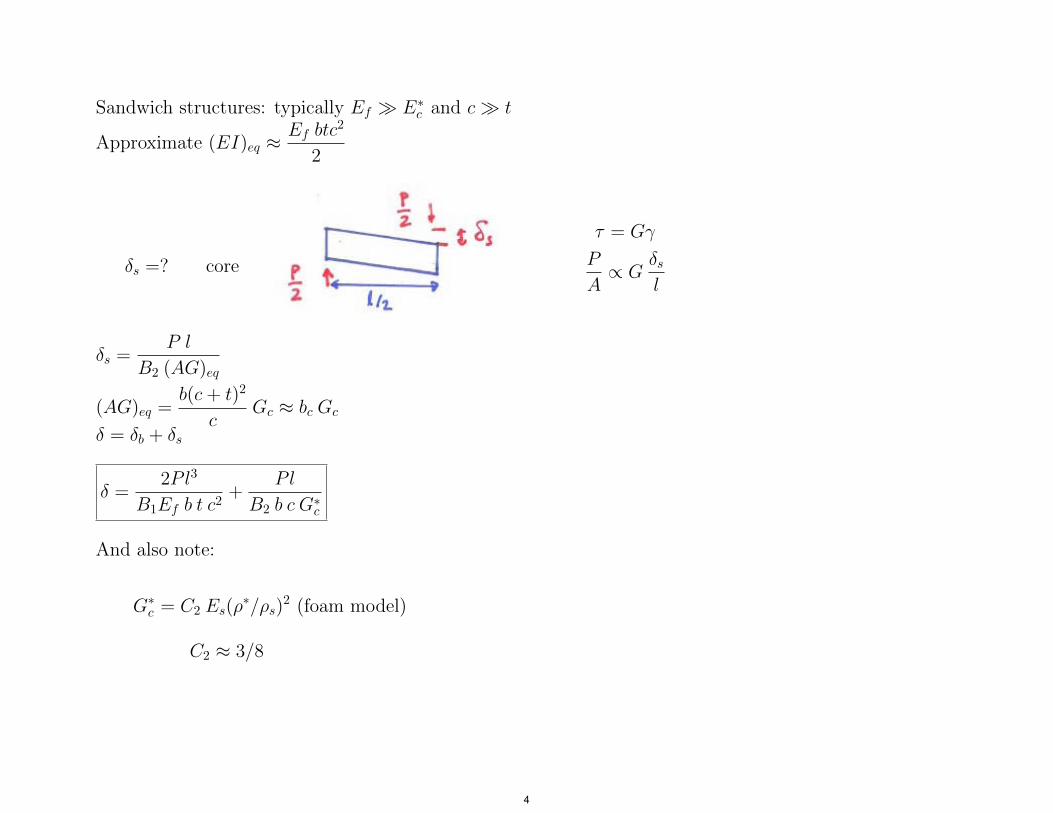
Sandwich structures: typically Ef � Ec∗ and c� t
EApproximate (EI)eq ≈ f btc
2
2
δs =? core
τ = Gγ
P
A∝ G
δsl
P lδs =
B2 (AG)eqb(c+ t)2
(AG)eq = Gcc
≈ bc Gc
δ = δb + δs
2Pl3 Plδ = +
B1Ef b t c2 B2 b c G∗c
And also note:
G∗c = C2 Es(ρ∗/ρs)
2 (foam model)
C2 ≈ 3/8
4
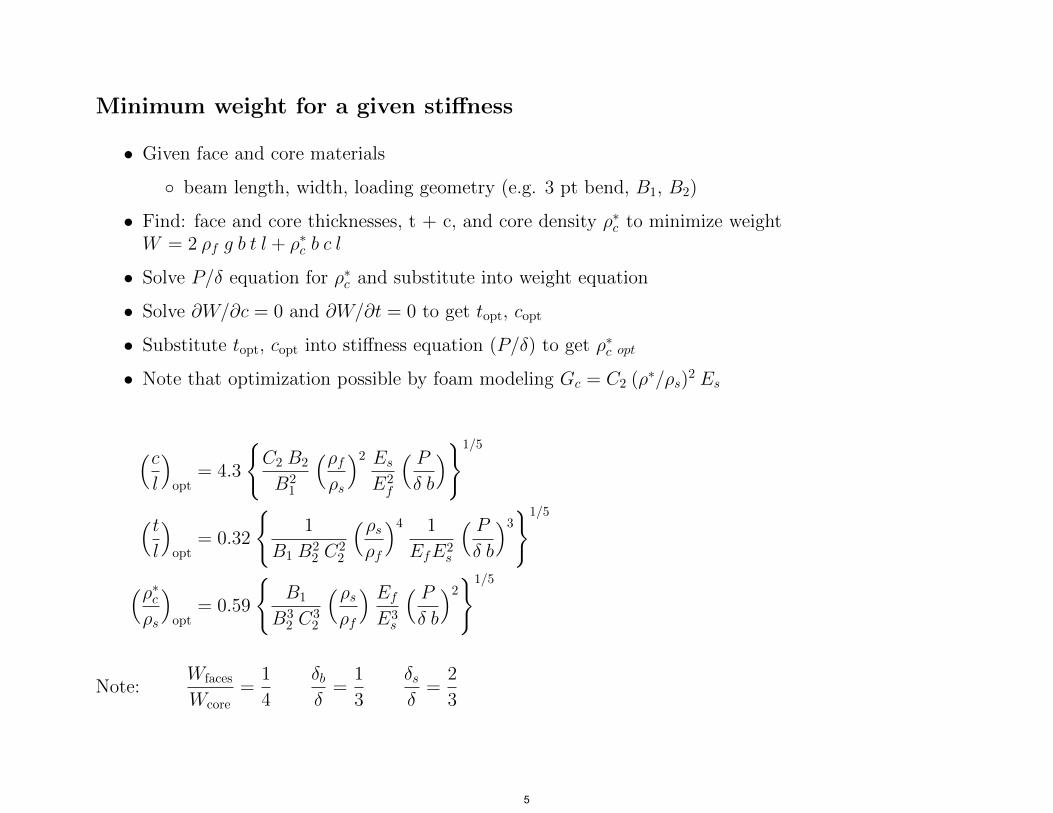
Minimum weight for a given stiffness
• Given face and core materials
◦ beam length, width, loading geometry (e.g. 3 pt bend, B1, B2)
• Find: face and core thicknesses, t + c, and core density ρ∗c to minimize weightW = 2 ρf g b t l + ρ∗c b c l
• Solve P/δ equation for ρ∗c and substitute into weight equation
• Solve ∂W/∂c = 0 and ∂W/∂t = 0 to get topt, copt
• Substitute topt, copt into stiffness equation (P/δ) to get ρ∗c opt
• Note that optimization possible by foam modeling Gc = C2 (ρ∗/ρs)2 Es
(cl
)opt
= 4.3
{C2 B2
B21
(ρfρs
)2 Es
E2f
( Pδ b
)}1/5
(tl
)opt
= 0.32
{1
B1 B22 C
22
(ρsρf
)4 1
EfE2s
( P 13
δ b
) } /5
(ρ∗cρs
)opt
= 0.59
{B1
B32 2 s
Wfaces 1 δb 1 δs 2Note: = = =
Wcore 4 δ 3 δ 3
C3
(ρsρf
) Ef
E3
( Pδ b
)2}1/5
5

Gibson, L. J., and M. F. Ashby. Cellular Solids: Structure and Properties. 2nd ed. Cambridge
University Press, © 1997. Table courtesy of Lorna Gibson and Cambridge University Press.
6

Comparison with experiments
• All faces with rigid PU foam core
• Gc = 0.7 Es (ρ∗c/ρs)2
• Beams designed to have same stiffness, P/δ, span l, width, b
• One set had ρ∗c = ρ∗c opt, varied t, c
• One set had t = topt, varied ρ∗c, c
• One set had c = copt, varied t, ρ∗c
• Confirms minimum weight design; similar results with circular sandwich plates
Strength of sandwich beams
• Stresses in sandwich beamsNormal stresses
My c 2 Mσf = Ef = M Ef =
(EI) 2 E b t c2eq f b t cMy c 2 M E∗
σc = Ec∗ = M E∗
)eq 2 Ef b t c2c = c
(EI b t c Ef
Since Ec∗ � Ef σc � σf ⇒ faces carry almost all normal stress
7
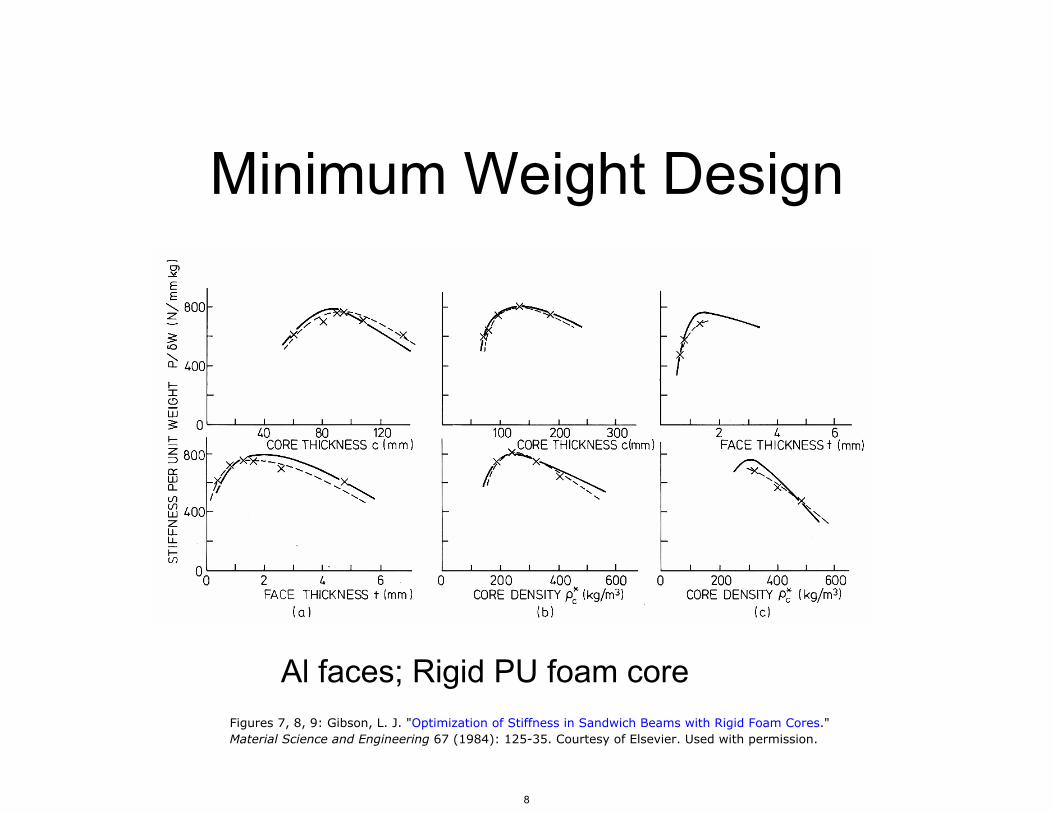
Minimum Weight Design
Al faces; Rigid PU foam core Figures 7, 8, 9: Gibson, L. J. "Optimization of Stiffness in Sandwich Beams with Rigid Foam Cores."Material Science and Engineering 67 (1984): 125-35. Courtesy of Elsevier. Used with permission.
8

• For beam loaded by a concentrated load, P (e.g. 3 pt bend)
P lMmax = e.g. 3 pt bend B3 = 4; cantilever B3 = 1
B3
σf =P l
B3 btc
• Shear stresses vary parabolically through the cross-section, but if
Ef � Ec∗ and c� t τc = V
b c V = shear force at section of interest
τc =P
B4 bcVmax =
Pe.g. 3 pt bend B4 = 2
B4
Failure modes
face: can yieldcompressible face can buckle locally – “wrinkling”
core: can fail in shearalso: can have debonding and indentation
we will assume perfect bond and load distributed sufficiently to avoid indentation
9

Stresses
Face: Normal stress Core: Shear stress
Approximate stress distributions, for: Ec<<Ef and t<<c
Gibson, L. J., and M. F. Ashby. Cellular Solids: Structure and Properties. 2nd ed. Cambridge
University Press, © 1997. Figures courtesy of Lorna Gibson and Cambridge University Press.
10
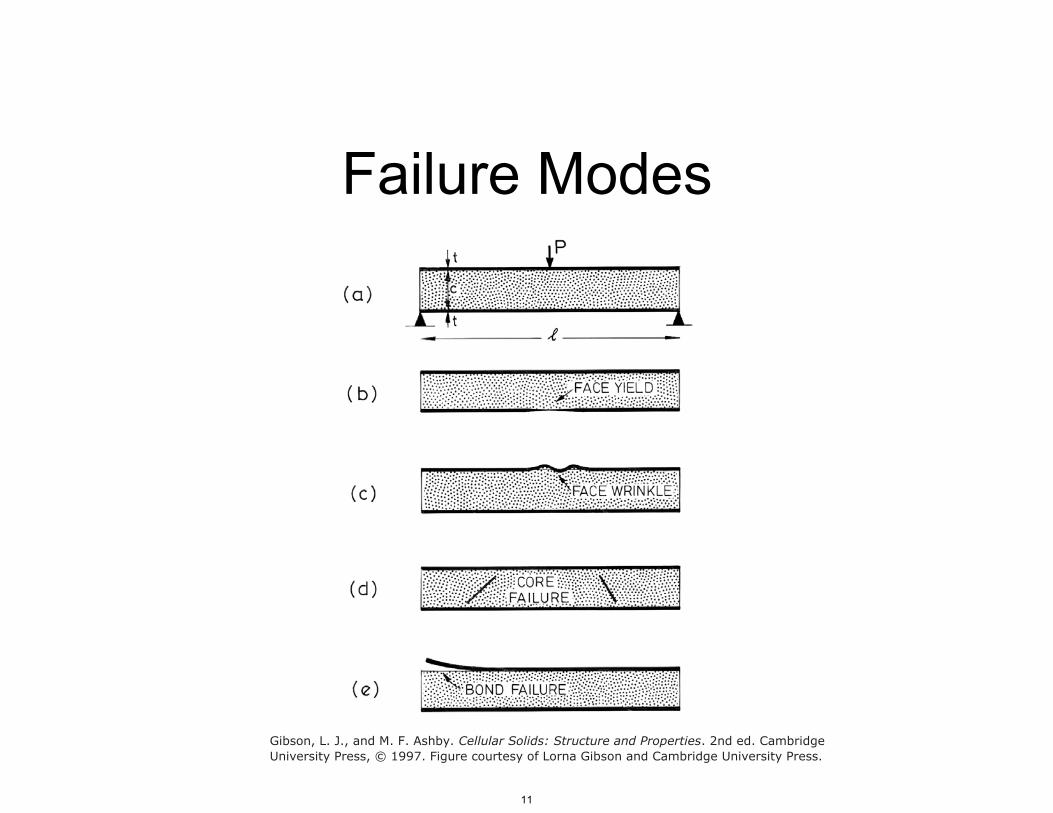
Failure Modes
Gibson, L. J., and M. F. Ashby. Cellular Solids: Structure and Properties. 2nd ed. Cambridge
University Press, © 1997. Figure courtesy of Lorna Gibson and Cambridge University Press.
11
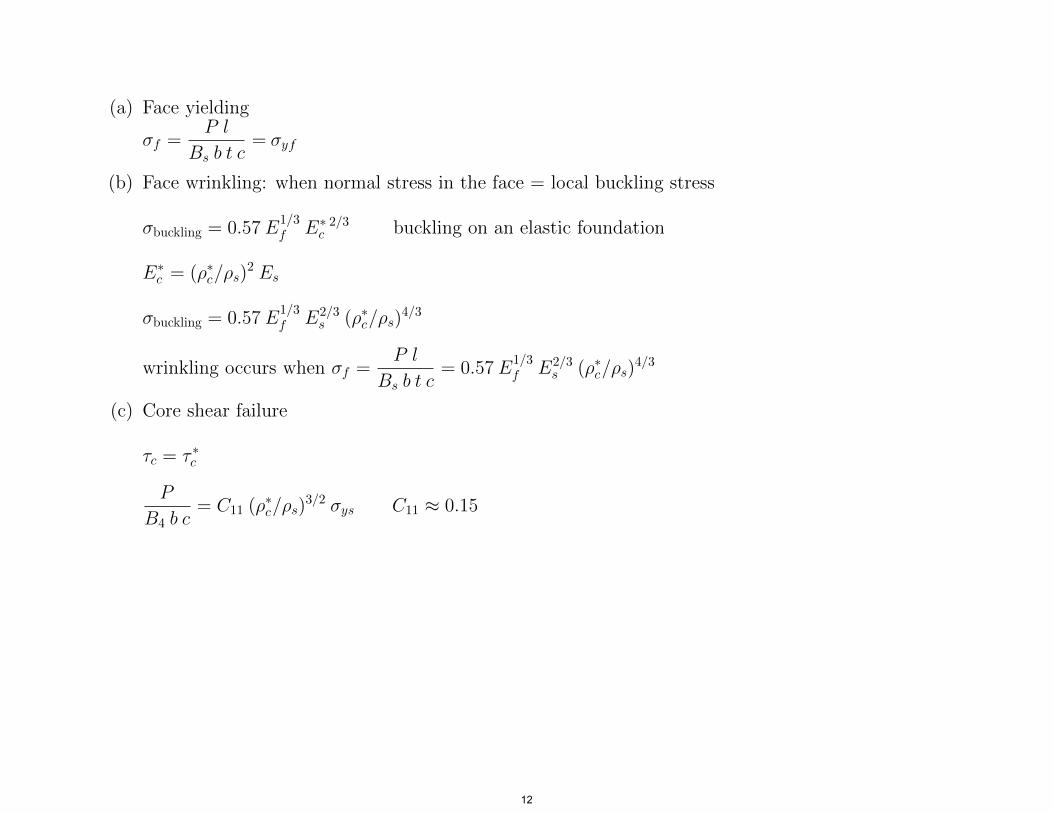
(a) Face yieldingP l
σf = = σy fBs b t c
(b) Face wrinkling: when normal stress in the face = local buckling stress
1/3σbuckling = 0.57 Ef E∗ 2/3c buckling on an elastic foundation
E 2c∗ = (ρ∗c/ρs) Es
1/3σbuckling = 0.57 E 2/3 4/3
f Es (ρ∗c/ρs)
P lwrinkling occurs when σf =
1/3= 0.57 E E2/3 (ρ∗/ρ )4/3s
B ss b t c
f c
(c) Core shear failure
τc = τc∗
P= C11 (ρ∗
B4 b cc/ρs)
3/2 σys C11 ≈ 0.15
12
• Dominant failure load is the one that occurs at the lowest load
• How does the failure mode depend on the beam design?
• Look at transition from one failure mode to another
• At the transition — two failure modes occur at same load
face yielding: Pfy = B3 b c(t/l) σy f
1/3face wrinkling: P = 0.57B b c (t/l) E E2/3
w 3 f s (ρ∗ 4f c/ρs)
/3
core shear: Pcs = C11 B4 b c σ3/2
ys (ρ∗c/ρs)
• Face yielding and face wrinkling occur at some load if
1/3B b c (t/l) σ = 0.57B b c (t/l) E E2/3
3 ( 3yf 3 f s ρ∗c/ρs)
4/
for (ρ∗c/ρ ) =
(σy
s
3
1/3 2/30.57 Ef Es
) /4
i.e. for given face and core materials, at constant (ρ∗c/ρs)
13

t• Face yield — core shearl
=C11 B4
B3
(ρ∗cρs
)3/2 (σysσyf
)• Face wrinkling — core shear
t
l=
C11 B4
0.57B3
( σys
E1/3f E
2/3s
) (ρ∗cρ
)1/6s
• Note: transition equation only involve constants (C11 B3 B4), material properties (Ef , Es, σys) andt/l, ρ∗c/ρs; do not involve core thickness, c
• Can plot transition equation on plot with axes ρ∗c/ρs and t/l
• Values of axes chosen to represent realistic values of
ρ∗c/ρs — typically 0.02 to 0.3
t/l — typically 1/2000 to 1/200 = 0.0005 to 0.005
• Low values of t/l and ρ∗c/ρs ⇒ face wrinkling
◦ t thin and core stiffness, which acts as elastic foundation, low
• Low values t/l, higher values ρ∗c/ρs ⇒ transition to face yielding
• Higher values of t/l ⇒ transition to core failure
14

Failure Mode Map
Gibson, L. J., and M. F. Ashby. Cellular Solids: Structure and Properties. 2nd ed. Cambridge
University Press, © 1997. Figure courtesy of Lorna Gibson and Cambridge University Press.
15

Failure Map: Expts
Figures 12 and 13: Triantafillou, T. C., and L. J. Gibson. "Failure Mode Maps for Foam Core Sandwich Beams."Materials Science and Engineering 95 (1987): 37–53. Courtesy of Elsevier. Used with permission.
16

• Map shown in figure for three point bending (B2 = 4, B4 = 2)
• Changing loading configuration moves boundaries a little, but overall, picture similar
• Expts on sandwich beams with Al faces and rigid PU foam cores confirm equation
• If know b, c — can add contours of failure loads
Minimum weight design for stiffness and strength: topt, copt
Given: stiffness P/δ Find: face and core thickness, t, cstrength P0 to minimize weightspan l width Dloading configuration (B1 B2 B3 B4)face material (ρf , σyf , Ef)core material and density (ρs, Es, σys, ρ
∗c)
17

• Can obtain solution graphically, axes t/l and c/l
• Equation for stiffness constraint and each failure mode plotted
• Dashed lines — contours of weight
• Design-limiting constraints are stiffness and face yielding
• Optimum point — where they intersect
• Could add (ρ∗c/ρs) as variable on third axis and create surfaces for stiffness and failure equation; findoptimum in the same way
• Analytical solution possible but cumbersome
• Also, values of c/l obtained this way may be unreasonably large — then have to introduce anadditional constraint on c/l (e.g. c/l < 0.1)
18

Gibson, L. J., and M. F. Ashby. Cellular Solids: Structure and Properties. 2nd ed. Cambridge
University Press, © 1997. Figure courtesy of Lorna Gibson and Cambridge University Press.
19

Minimum weight design: materials
• What are best materials for face and core? (stiffness constraint)
• Go back to min. wt. design for stiffness
• Can substitute[ (ρ∗c)opt, topt, copt into weight equation to get min. wt.:
1W = 3.18 b l2
B1 B22 C
22
ρfρ4s
EfE2s
( P 5
δ
) /3
b
]1• Faces: W minimized with materials that minimize ρf/Ef (or maximize Ef/ρf)
• Core: W minimized with materials that minimize ρ4s/E2 1/2s (or maximize Es /ρs)
• Note: ◦ faces of sandwich loaded by normal stress, axiallyif have solid material loaded axially, want to maximize E/ρ◦ core loaded in shear and in the foam, cell edges bend
if have solid material, loaded as beam in bending and want to minimizeweight for a given stiffness, maximize E1/2/ρ
• Sandwich panels may have face and core same material: e.g. Al faces Al foam coreintegral polymer face and core
◦ then want to maximize E3/5/ρ “structural polymer foams”
Case study: Downhill ski design
• Stiffness of ski gives skier right “feel”
• Too flexible — difficult to control
20

• Too stiff — skier suspended, as on a plank, between bumps
• Skis designed primarily for stiffness
• Originally skis made from a single piece of wood
• Next — laminated wood skis with denser wood (ash, hickory) on top of lighter wood core (pine,spruce)
• Modern skis − sandwich beams
− faces — fiber composites or Alcontrols stiffness− core — honecombs, foams (e.g. rigid PU), balsa
]• Additional materials
◦ bottom-layer of polyethylene — reduces friction
◦ short strip phenol — screw binding in
◦ neoprene strip ∼ 300 mm long — damping
◦ steel edges — better control
21
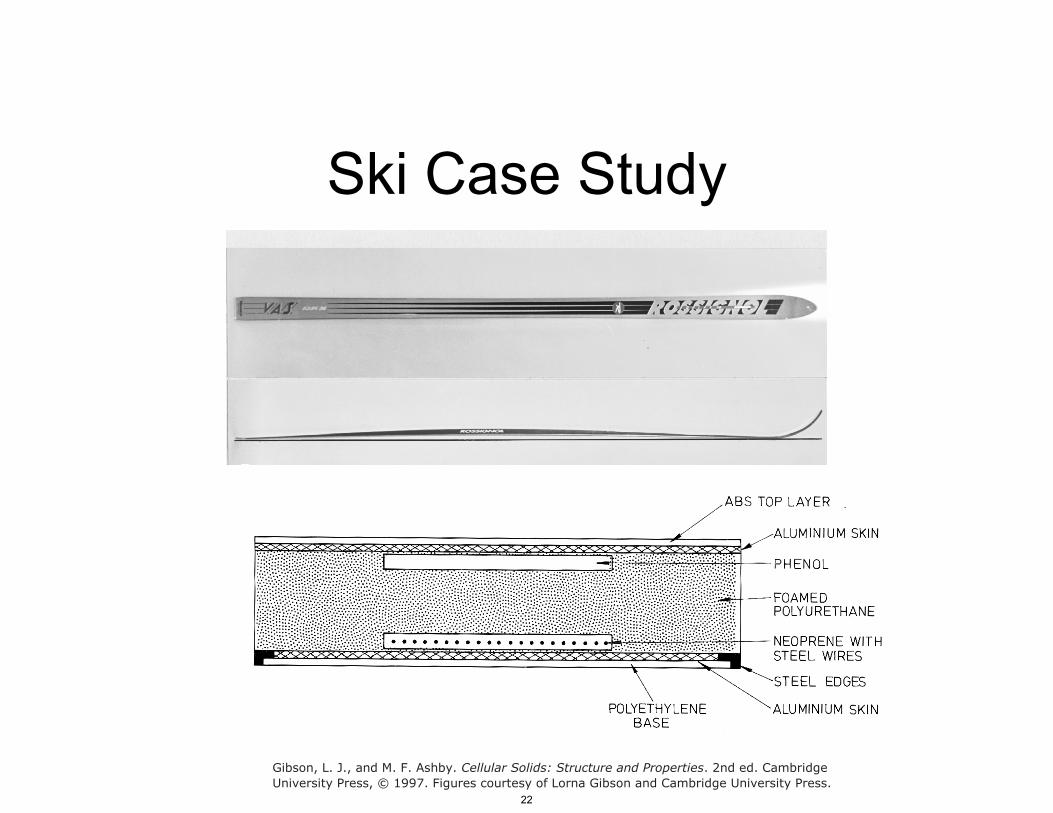
Ski Case Study
Gibson, L. J., and M. F. Ashby. Cellular Solids: Structure and Properties. 2nd ed. Cambridge
University Press, © 1997. Figures courtesy of Lorna Gibson and Cambridge University Press.
22

Ski case study
• Properties of face and core material
Al Solid PU Foam PU
ρ(Mg/m3) 2.7 1.2 0.53E GPa 70 1.94 0.38G GPa − − 0.14
• Ski geometry
◦ Al faces constant thickness t
◦ PU foam core — c varies along length, thickest at center, where moment highest
◦ ski cambered
◦ mass of ski = 1.3 kg (central 1.7 m, neglecting tip and tail)
23

Ski Case Study
Gibson, L. J., and M. F. Ashby. Cellular Solids: Structure and Properties. 2nd ed. Cambridge
University Press, © 1997. Figures courtesy of Lorna Gibson and Cambridge University Press.
24

Bending stiffness
• Plot c vs. x, distance along ski
• Calculated (EI)eq vs. x
• Calculated moment applied vs. x
• Get M/(EI)eq vs. x
• Can then find bending deflection, δb = 0.28 P
• Shear deflection found from avg. equiv. shear rigidity
P lδs = = 0.0045 P
(AG)eq
• δ = δb + δs = 0.29 P P/δ = 3.5 N/mm measured P/δ = 3.5 N/mm
• Note current design δs � δb; at optimum δs ∼ 2δb (constant c)
• Can ski be redesigned to give same stiffness, P/δ, at lower weight?
• If use optimization method described earlier (assuming c=constant along length)
copt=70 mm mass=0.31kg ⇒ 75% reduction from current design
topt=0.095 mm
p∗c opt=29 kg/m3 But this design impractical ⇒ c too large, t too small
25
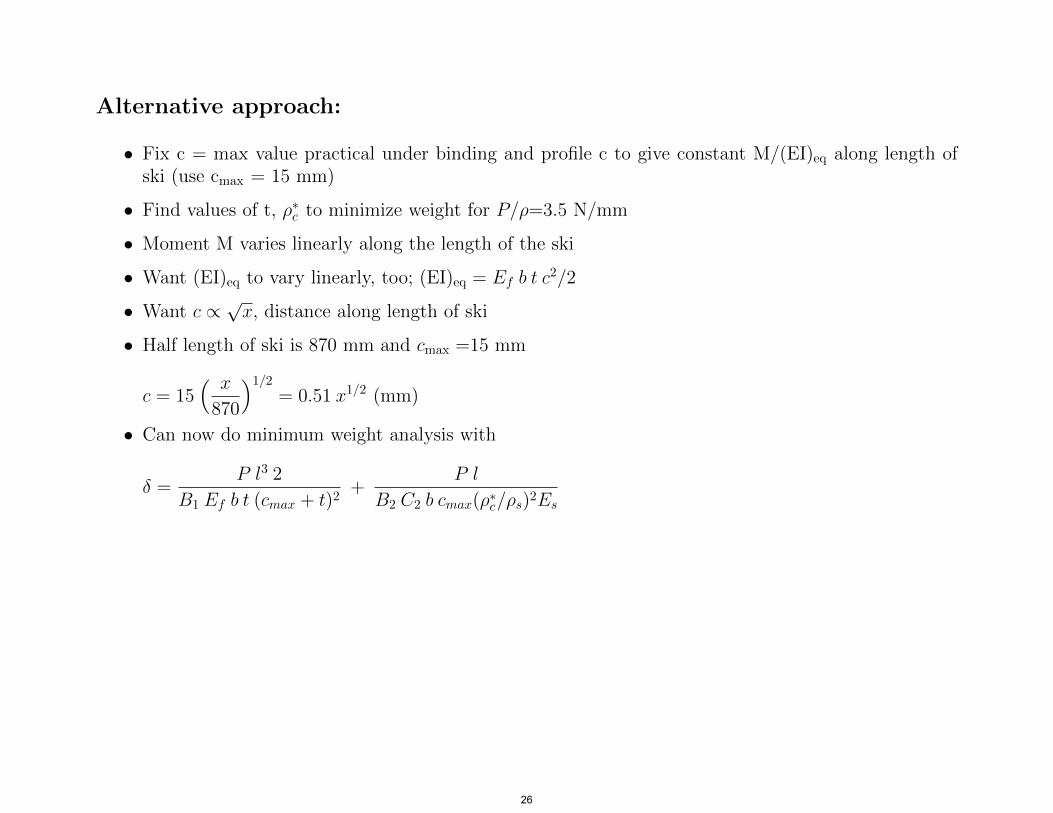
Alternative approach:
• Fix c = max value practical under binding and profile c to give constant M/(EI)eq along length ofski (use cmax = 15 mm)
• Find values of t, ρ∗c to minimize weight for P/ρ=3.5 N/mm
• Moment M varies linearly along the length of the ski
• Want (EI)eq to vary linearly, too; (EI)eq = Ef b t c2/2
Want c√
• ∝ x, distance along length of ski
• Half length of ski is 870 mm and cmax =15 mm
c = 15( x 1/2
= 0.51 x1/2 (mm)870
• Can now do
)minimum weight analysis with
P l3 2δ =
P l+
B1 Ef b t (cmax + t)2 B2 C2 b cmax(ρ∗c/ρs)2Es
26

Gibson, L. J., and M. F. Ashby. Cellular Solids: Structure and Properties. 2nd ed. Cambridge
University Press, © 1997. Figure courtesy of Lorna Gibson and Cambridge University Press.
27
• B1 — corresponds to beams with constant M/EI
• B2 — cantilever value (B2 = 1) multiplied by average value of c divided by maximum valueof c B2 = 2/3
∂ω• Solve stiffness equation for ρ∗c, substitute into weight equation and take = 0∂t
• Solve for topt, then ρ∗c opt
• Find: c 3max=15 mm ρ∗c opt=1.63 kg/mtopt = 1.03 mm mass = 0.88 kg ⇒ 31% less than current design
Daedalus
• MIT designed and built human powered aircraft (1980s)
• Flew 72 miles in ∼ 4 hours from Crete to Santorini, 1988
• Kanellos Kanellopoulos — Greek bicycle champion pedaled and flew
mass 68.5# = 31 kg propeller: kevlar faces, PS foam core (11′ long)length 29′ = 8.8 m wiring and trailing edge strips kevlar faces / rohacell foam corewingspin 112′ = 34 m tail surface struts: carbon composite faces, balsa core
28
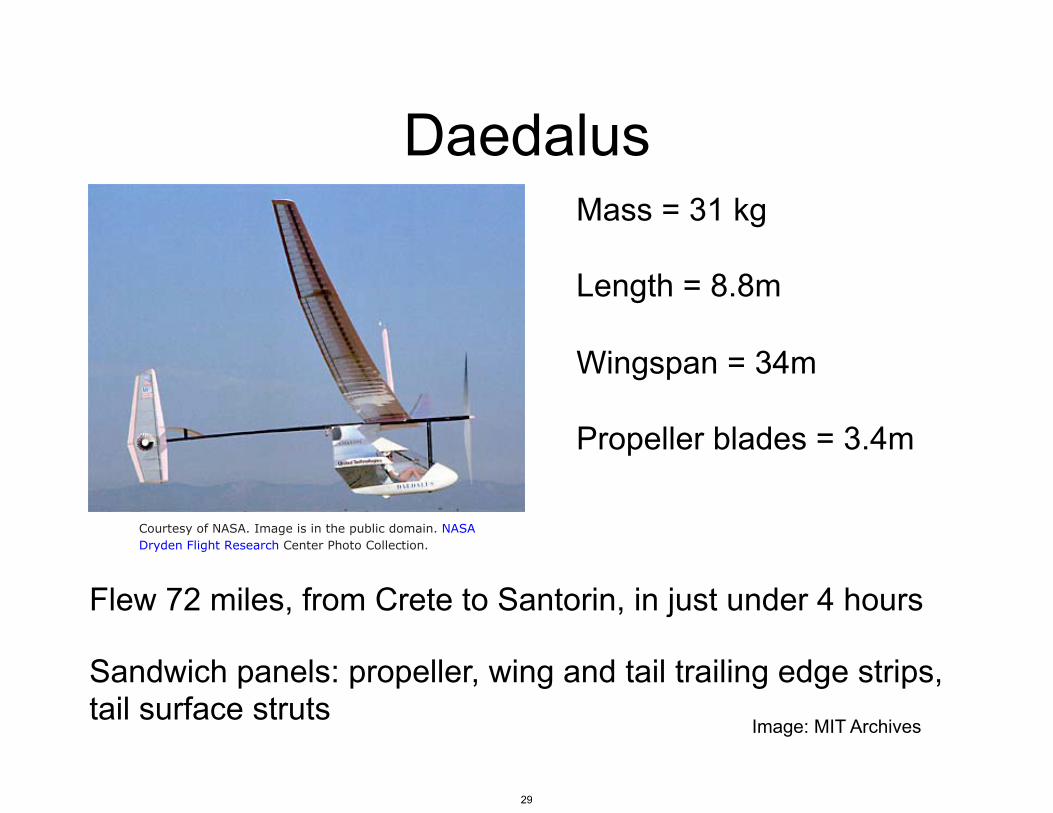
Daedalus Mass = 31 kg Length = 8.8m Wingspan = 34m Propeller blades = 3.4m
Flew 72 miles, from Crete to Santorin, in just under 4 hours
Sandwich panels: propeller, wing and tail trailing edge strips, tail surface struts
Image: MIT Archives
Courtesy of NASA. Image is in the public domain. NASA
Dryden Flight Rese arch Center Photo Collection.
29
MIT OpenCourseWarehttp://ocw.mit.edu
3.054 / 3.36 Cellular Solids: Structure, Properties and ApplicationsSpring 2015
For information about citing these materials or our Terms of Use, visit: http://ocw.mit.edu/terms.


![Performance and failure of metal sandwich plates subjected ... · Keywords: sandwich plates, honeycomb core, folded plate core, strength, ductility, ... [Liang et al. 2007], two types](https://img.pdfslide.net/doc/110x75/5b14a9907f8b9a487c8e2ec3/performance-and-failure-of-metal-sandwich-plates-subjected-keywords-sandwich.jpg)