Embed Size (px)
Citation preview
Lecture 2:
GIS Data Sources, Data Types
and Representation
GE 118: INTRODUCTION TO GIS
Engr. Meriam M. Santillan
Caraga State University
Geographic Data in GIS
Can be obtained from various sources in
different formats
Can be inputted into a GIS using different
methods
Some Sources of Data for GIS
Maps
Census and Survey Data
Aerial Photographs
Satellite Images
Ground/Land Survey Data
GPS Data
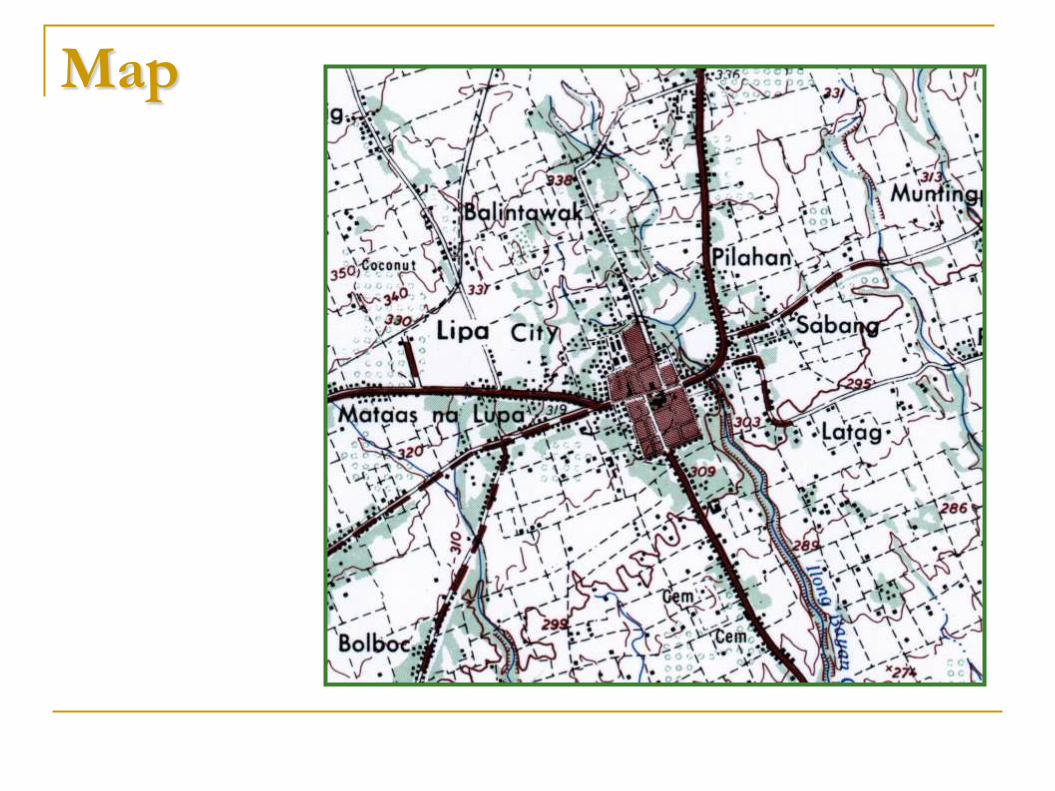
Map
Gender Quickstat
(An Update of NSO's Most Requested Sex-
disaggregated Statistics)
as of 1st Quarter 2005
60
.2
295,
056
39
.8
195,
185
490,
241
80
and
over
56
.7
286,
734
43
.3
218,
622
505,
356
75 -
79
years
54
.7
436,
356
45
.3
361,
614
797,
970
70 -
74
years
53
.2
605,
374
46
.8
533,
469
1,13
8,84
3
65 -
69
years
51
.9
847,
013
48
.1
786,
137
1,63
3,15
0
60 -
64
years
50
.5
960,
516
49
.5
943,
133
1,90
3,64
9
55 -
59
years
49
.7
1,30
3,68
4
50
.3
1,31
8,63
2
2,62
2,31
6
50 -
54
years
49
.0
1,63
3,34
2
51
.0
1,69
6,71
2
3,33
0,05
4
45 -
49
years
49
.1
2,04
3,18
0
50
.9
2,12
0,31
4
4,16
3,49
4
40 -
44
years
49
.1
2,40
4,20
2
50
.9
2,49
6,82
1
4,90
1,02
3
35 -
39
years
49
.4
2,74
1,77
2
50
.6
2,80
4,52
2
5,54
6,29
4
30 -
34
years
49
.7
3,01
7,47
3
50
.3
3,05
3,61
6
6,07
1,08
9
25 -
29
years
50
.2
3,54
6,88
5
49
.8
3,52
2,51
8
7,06
9,40
3
20 -
24
years
49
.9
3,99
9,46
8
50
.1
4,01
7,83
0
8,01
7,29
8
15 -
19
years
49
.3
4,40
8,41
7
50
.7
4,54
1,19
7
8,94
9,61
4
10 -
14
years
48
.8
4,73
2,76
8
51
.2
4,96
2,01
3
9,69
4,78
1
5 -
9
years
48
.8
4,71
7,57
0
51
.2
4,95
1,93
2
9,66
9,50
2
2000
0 -
4
years
49
.6
37,9
79,8
10
50
.4
38,5
24,2
67
76,5
04,0
77
May
Total
Popul
ation
DEMOGRAPHY (Source: Census of Population
and Housing)
Pe
rc
en
t
Nu
mb
er
Pe
rc
en
t
Nu
mb
er
Nu
mbe
r
Year
Female Male
Bot
h
Sex
es
DATA
REF
ERE
NCE
PERI
OD
INDIC
ATOR
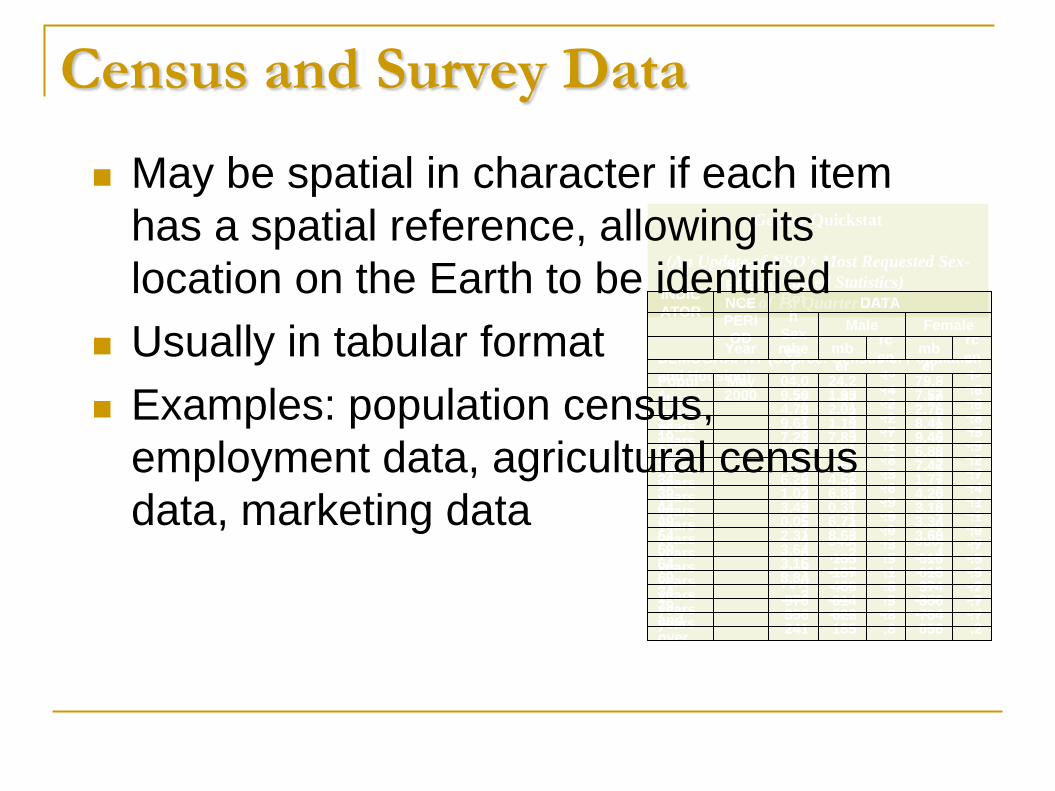
Census and Survey Data
May be spatial in character if each item
has a spatial reference, allowing its
location on the Earth to be identified
Usually in tabular format
Examples: population census,
employment data, agricultural census
data, marketing data
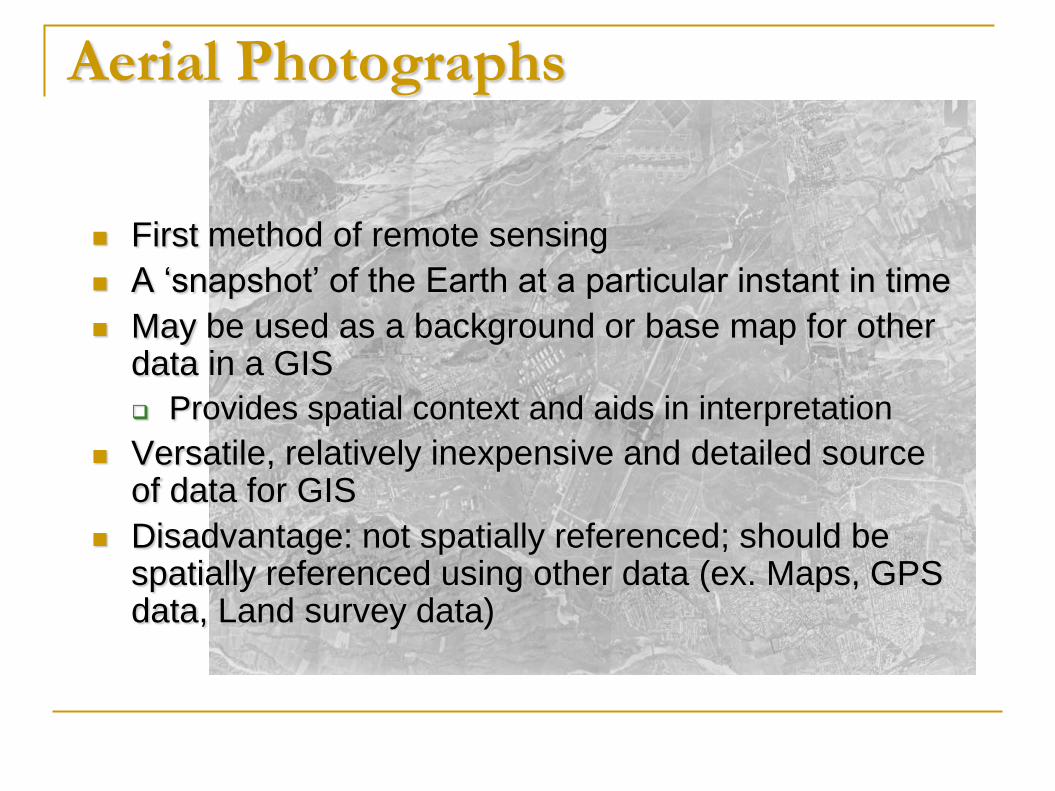
Aerial Photographs
First method of remote sensing
A ‘snapshot’ of the Earth at a particular instant in time
May be used as a background or base map for other data in a GIS
Provides spatial context and aids in interpretation
Versatile, relatively inexpensive and detailed source of data for GIS
Disadvantage: not spatially referenced; should be spatially referenced using other data (ex. Maps, GPS data, Land survey data)
Important Characteristics of Aerial
Photos for GIS (Curran 1989)
Wide availability
Low cost compared with other
remotely sensed images
Wide area views
Time-freezing ability
High spectral and spatial resolution
Three-dimensional perspective
Satellite Images
Collected by sensors on board a satellite, which are then relayed to ground stations and then computer-processed to produce images
Can be used to detect features not readily apparent to the naked eye (ex. Sedimentation, moisture content, ground temperature variations)
Processing is needed for data reduction, georeferencing, enhancing, and data integration
Examples: Landsat, SPOT, Ikonos, Quickbird, AVHRR
Advantages of Satellite Images
Easy to transfer/transport -- always available in digital form
Specific features can be highlighted by manipulating the displayed wavebands
Repeated converage of the Earth – important for temporal analysis and continuous monitoring
Large coverage area – useful for regional or national mapping applications
Low cost compared with other data sources
Ability to acquire current/timely images
Accurate and complete
Uniform standards across areas
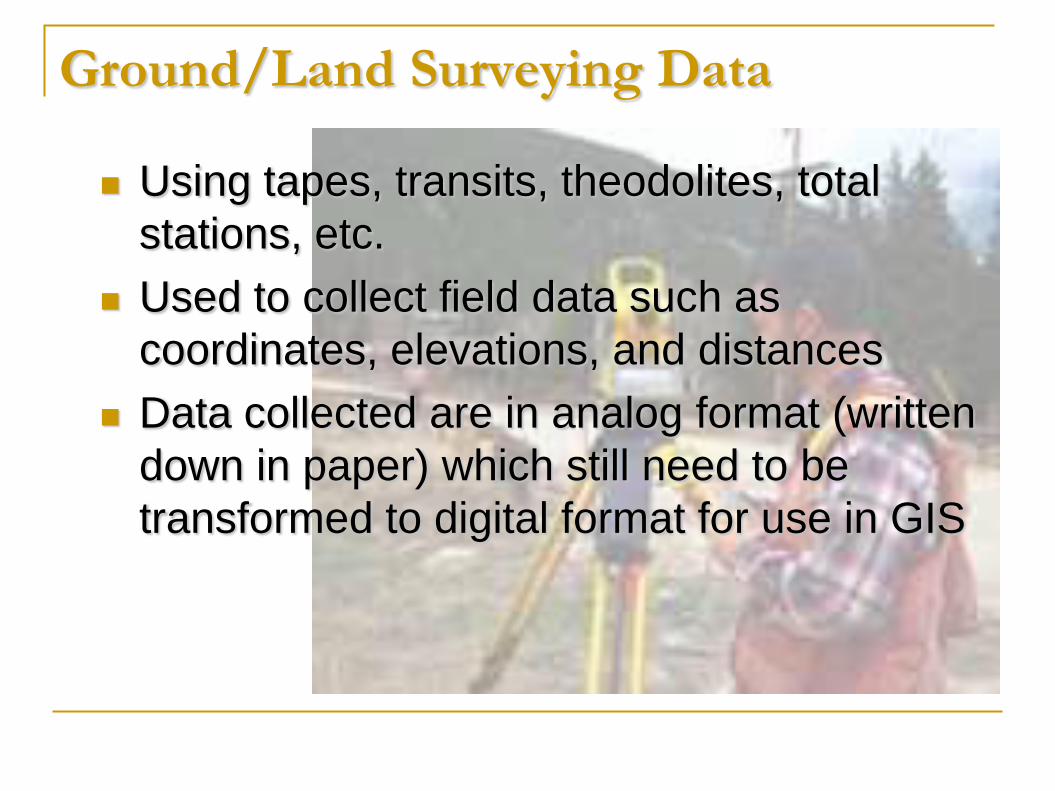
Ground/Land Surveying Data
Using tapes, transits, theodolites, total
stations, etc.
Used to collect field data such as
coordinates, elevations, and distances
Data collected are in analog format (written
down in paper) which still need to be
transformed to digital format for use in GIS
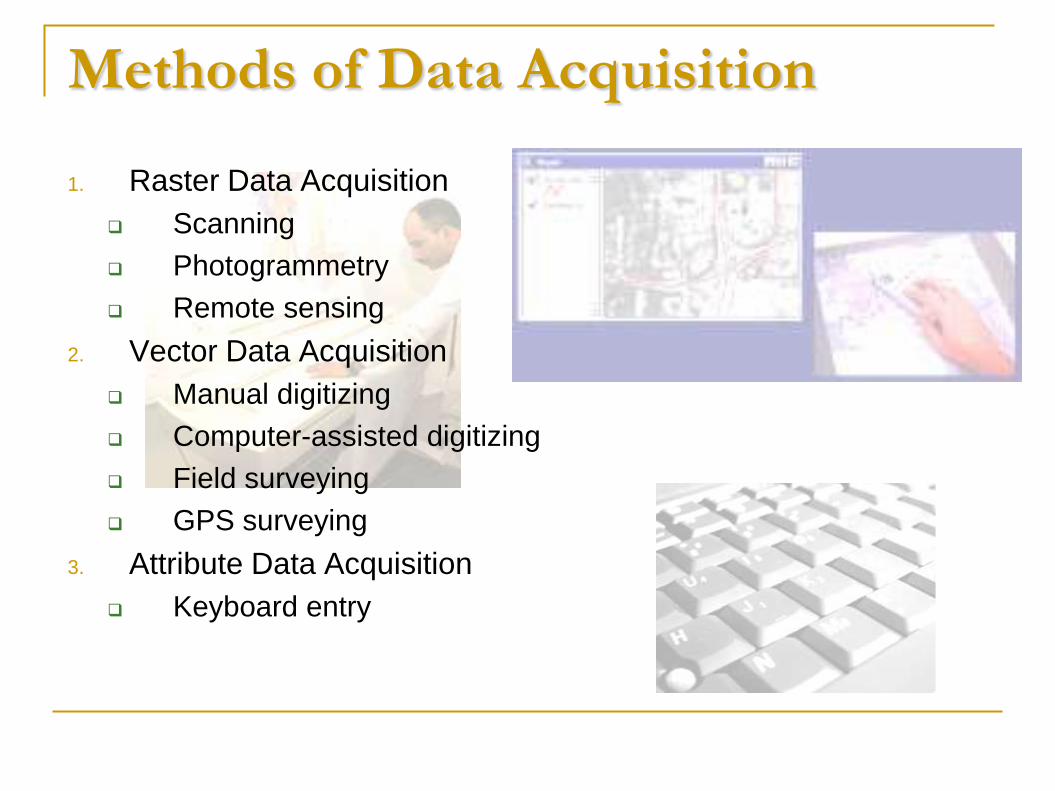
Methods of Data Acquisition
1. Raster Data Acquisition
Scanning
Photogrammetry
Remote sensing
2. Vector Data Acquisition
Manual digitizing
Computer-assisted digitizing
Field surveying
GPS surveying
3. Attribute Data Acquisition
Keyboard entry
Categories of Geographic Data
Acquisition
Primary – collected through first-hand
observation
Secondary – data collected by another
individual or organization; most are published
data
Primary Raster and Vector Data
Raster Data
satellite images
scanned aerial photographs
Vector Data
Land survey points
GPS observation data
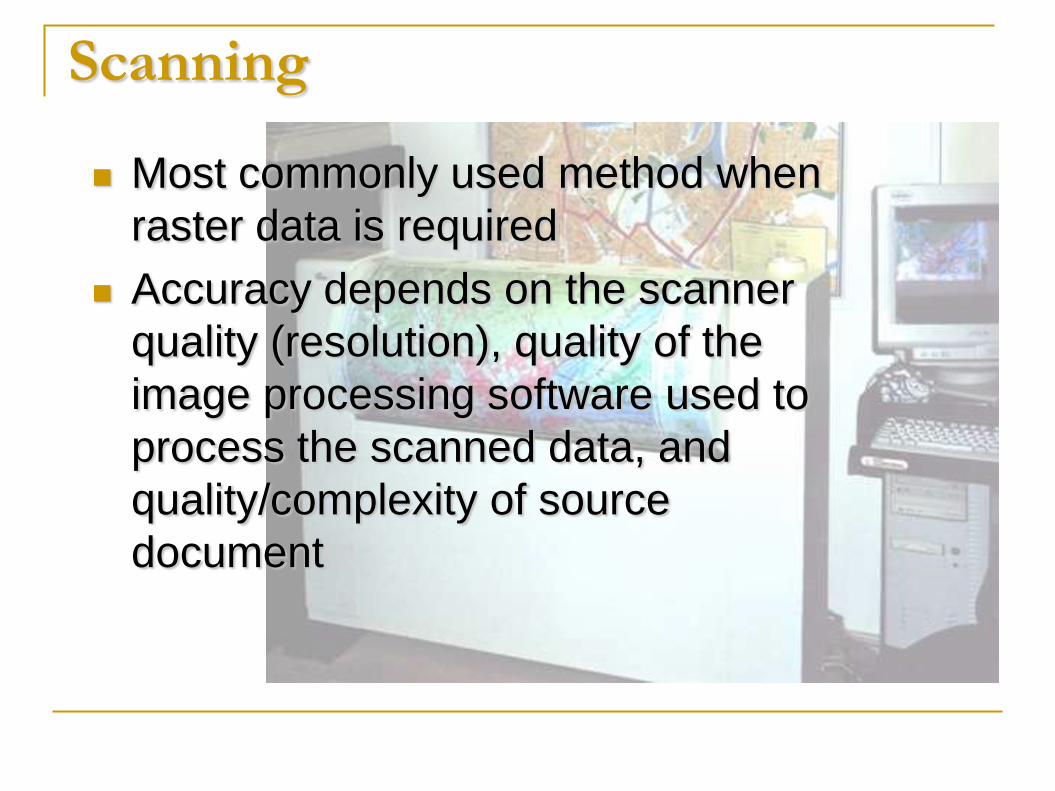
Scanning
Most commonly used method when
raster data is required
Accuracy depends on the scanner
quality (resolution), quality of the
image processing software used to
process the scanned data, and
quality/complexity of source
document
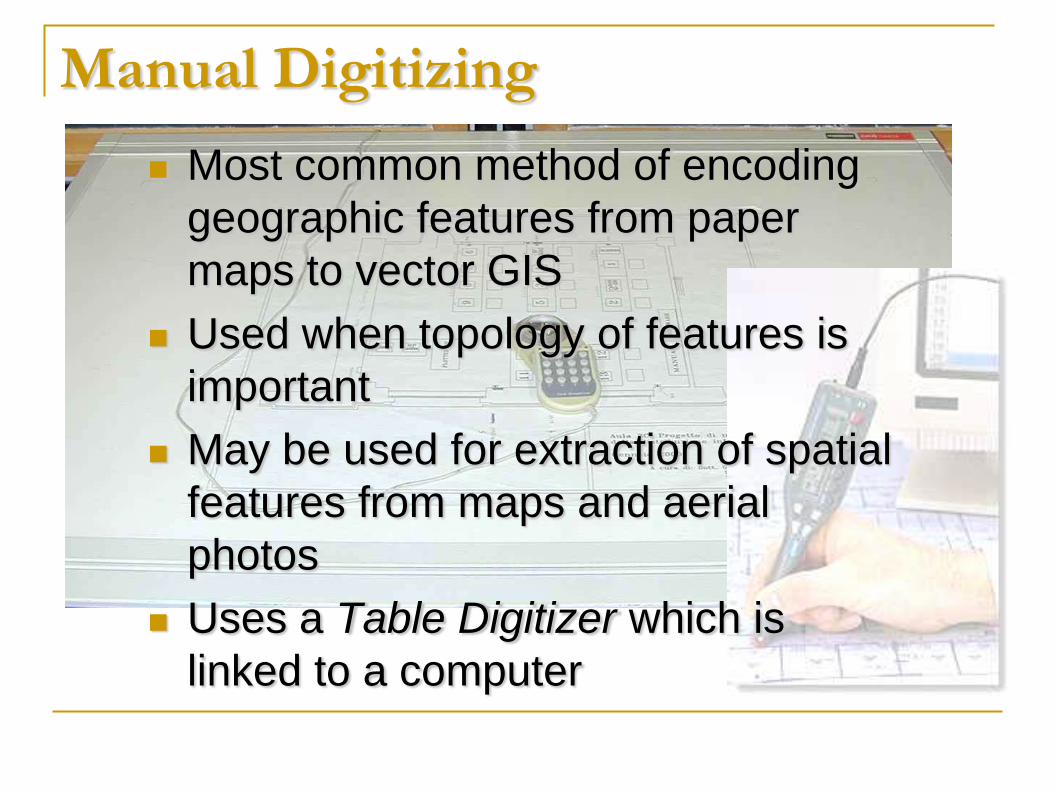
Manual Digitizing
Most common method of encoding
geographic features from paper
maps to vector GIS
Used when topology of features is
important
May be used for extraction of spatial
features from maps and aerial
photos
Uses a Table Digitizer which is
linked to a computer
Digital Geographic Data
Numerical representations that describe real-world features and phenomena
Must be encoded in digital form and organized as a geographic database to be useful to GIS
This digital database creates our perception of the real world
Conventional Data vs.
Digital Geographic Data
Conventional Data: Paper map
Static representation
Represents a general-purpose snapshot of the real world at a given time only
Digital Geographic Data:
Dynamic representation
Allows a range of functions for storing, processing, analyzing, and visualizing spatial data
Has tools that allow users to interact with the data to meet their objectives
What is a Data Model?
The heart of any GIS
A way of representing data
Mathematical construct for representing
geographic objects or surfaces as data
A set of constructs for describing and
representing selected aspects of the real world
in a computer. Longley, Goodchild, Maguire & Rhind
For example:
•the vector data model represents
geography as collections of points,
lines, and polygons;
•the raster data model represent
geography as cell matrixes that store
numeric values; and
•the TIN data model represents
geography as sets of contiguous,
nonoverlapping triangles
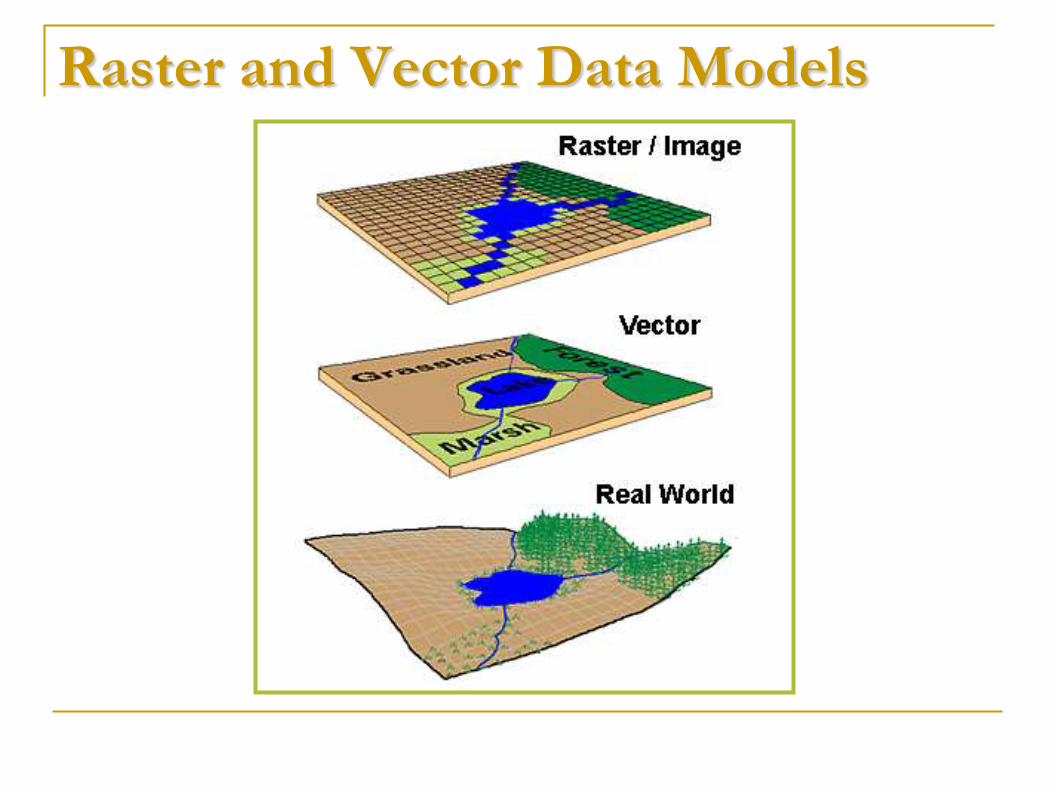
Raster and Vector Data Models
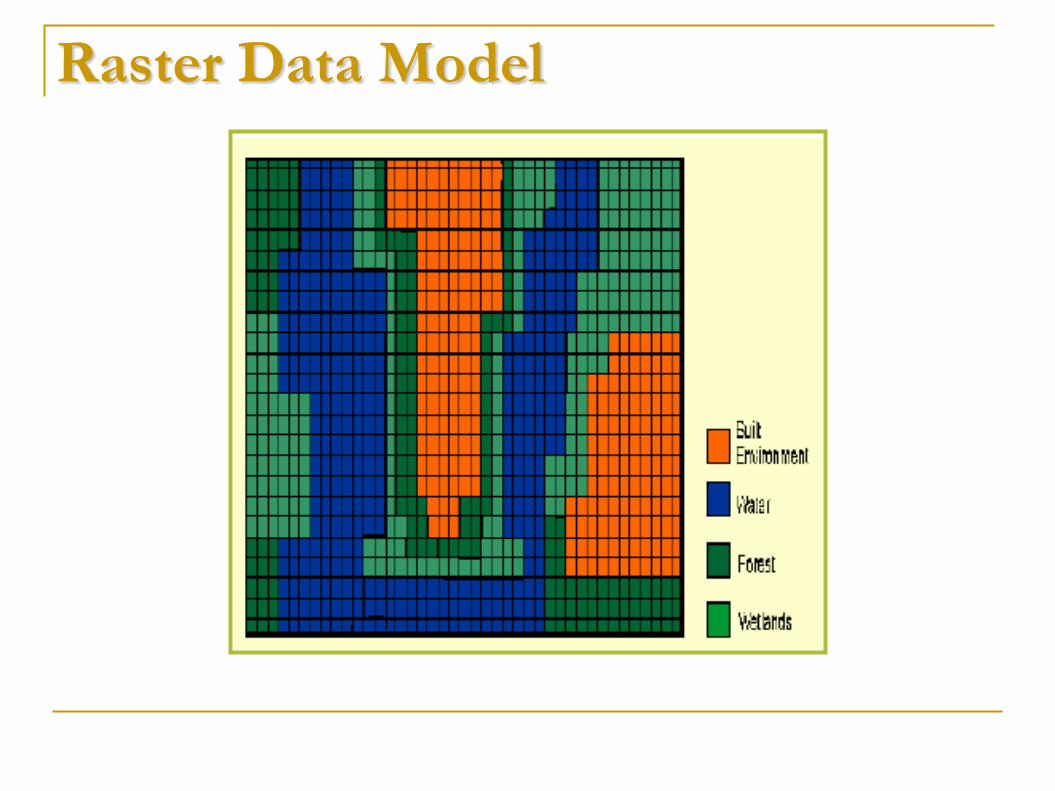
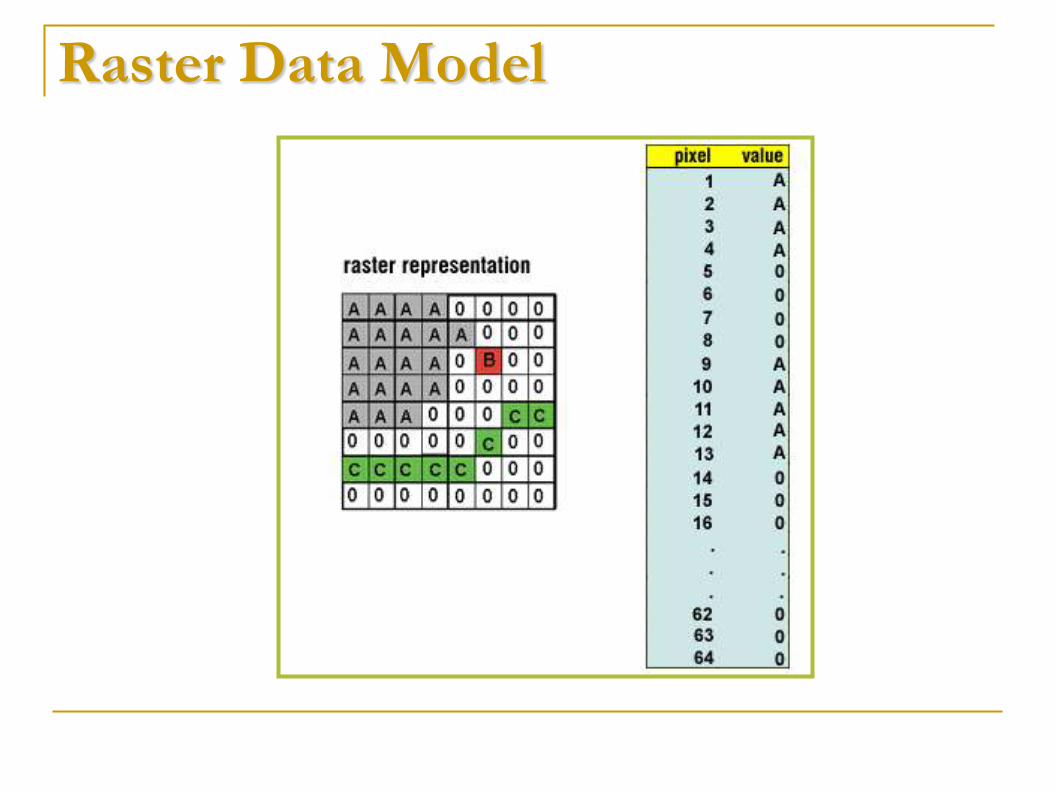
Raster Data Model
Treats geographic space as populated by one or more spatial phenomena, which vary continuously over space and having no obvious boundaries.
Best used to represent geographic features that are continuous over a large area (eg. soil type, vegetation, etc.)
Uses an array of rectangular cells/pixels/grids to represent real-world objects.
Each cell is defined by a coordinate location and an attribute that identifies the feature.
Similar features are assigned equal attribute values.
Cell’s linear dimensions defines the spatial resolution
Raster Data Model
Raster Data Model
Raster File Formats
BMP (bitmaps) – used by graphics in Microsoft Windows applications; no compression
DIB (Device Independent Bitmaps)
GIF (Graphical Interchange Format) – widely used for images to be used on the World Wide Web
TIFF (Tagged Image File Format) – non-proprietary, system-independent
JPEG (Joint Photographic Experts Group) – primarily for storage of photographic images and for the World Wide Web
GeoTIFF – extension of the TIFF format that contains georeferencing information
PNG (Portable Network Graphics) – patent-free; intended to replace the GIF format
PCX – supported by many image scanners
MrSID (Multi-resolution Seamless Image Database)
GRID – proprietary format used by ESRI in ArcInfo and ArcView GIS
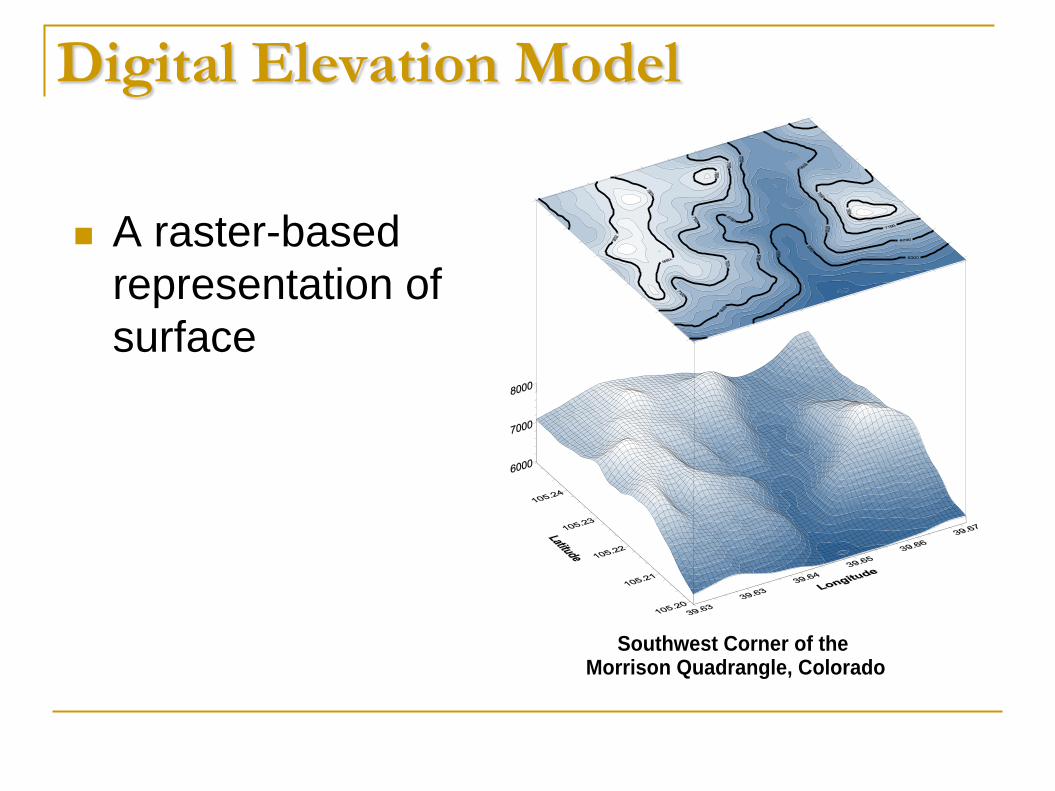
Digital Elevation Model
A raster-based
representation of
surface
Southwest Corner of the Morrison Quadrangle, Colorado
Vector Data Model
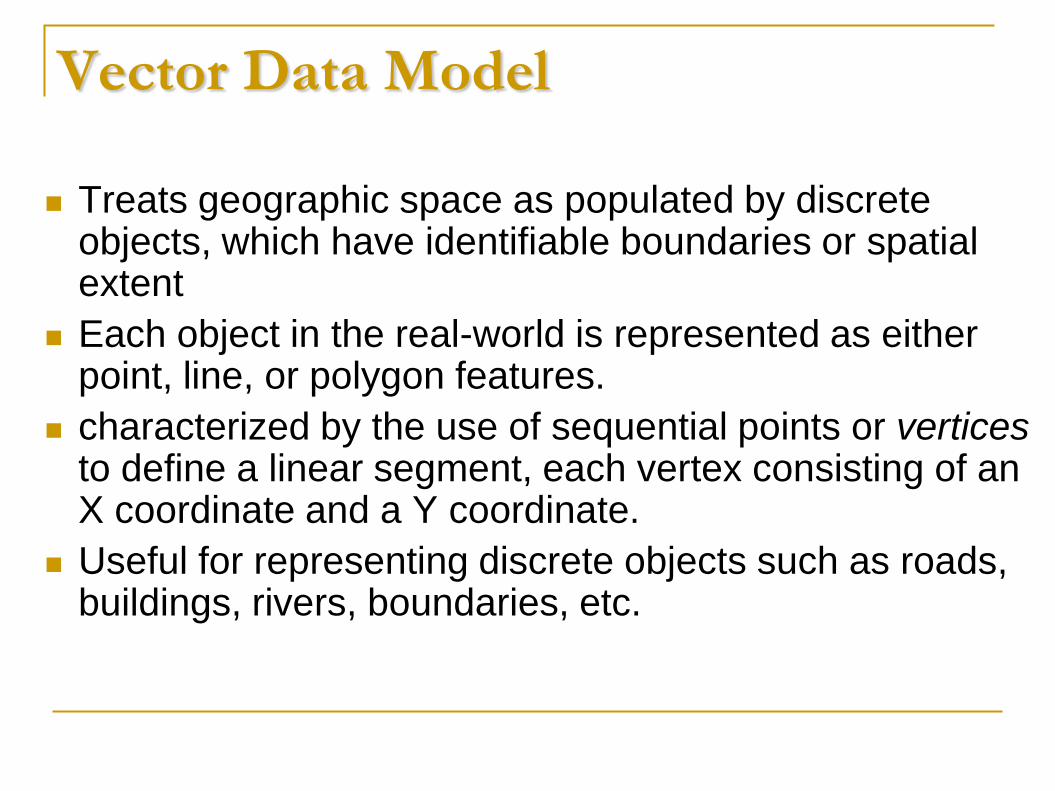
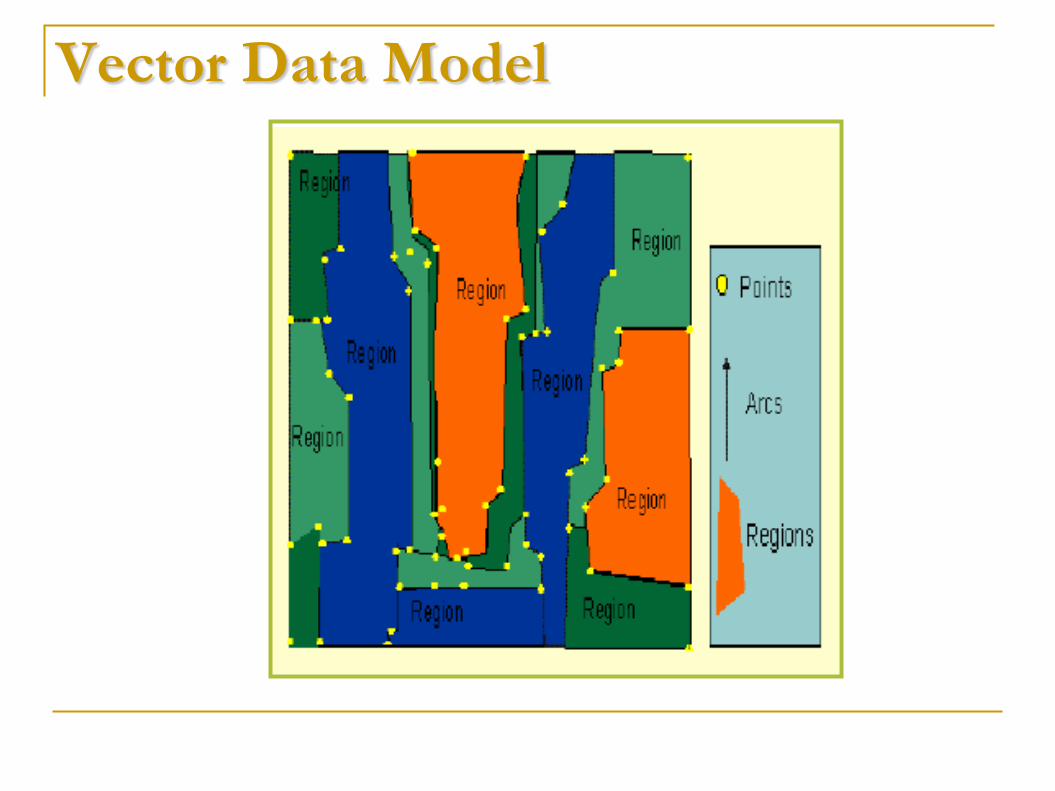
Treats geographic space as populated by discrete objects, which have identifiable boundaries or spatial extent
Each object in the real-world is represented as either point, line, or polygon features.
characterized by the use of sequential points or vertices to define a linear segment, each vertex consisting of an X coordinate and a Y coordinate.
Useful for representing discrete objects such as roads, buildings, rivers, boundaries, etc.
Vector Data Model
Types of Vector Data Model
1. Simple data model
2. Topologic data model
Simple (Spaghetti) Data Model
a one-for-one translation of the analog map
Features (lines and polygons) may overlap
No relationships between features
Generally used where analysis is not
important (eg. Plotting)
Examples are digitized maps and CAD data
Simple (Spaghetti) Data Model
Advantages:
Easy to create and store
Can be retrieved and rendered on screen very
quickly
Simple (Spaghetti) Data Model
Disadvantages: Spatial analysis (eg. Shortest path network analysis)
cannot be performed easily due to lack of any connectivity
relationships
Redundant since the boundary segment between two
polygons can be stored twice (once for each feature)
Inflexible since it is difficult to dissolve common boundaries
when joining polygons
Cannot be used in certain applications such as land
management because of overlapping features
Topological Data Model
Essentially just a simple data model structured using topologic rules
often referred to as an intelligent data structure because spatial relationships between geographic features are easily derived when using them
the dominant vector data structure currently used in GIS technology
Most commonly used variants is the arc-node data model
Topological Data Model Components
Point (vertex) – where a line originates or terminates
Node – where a link originates or terminates
Line – a segment between two points (vertices)
Link (or arc or chain) – a connection between two nodes
– may consist of several lines which are joined at points (vertices)
– can only originate, terminate or be connected at nodes
Polygon (area) – composed of links
– adjacent polygons have only one link between them
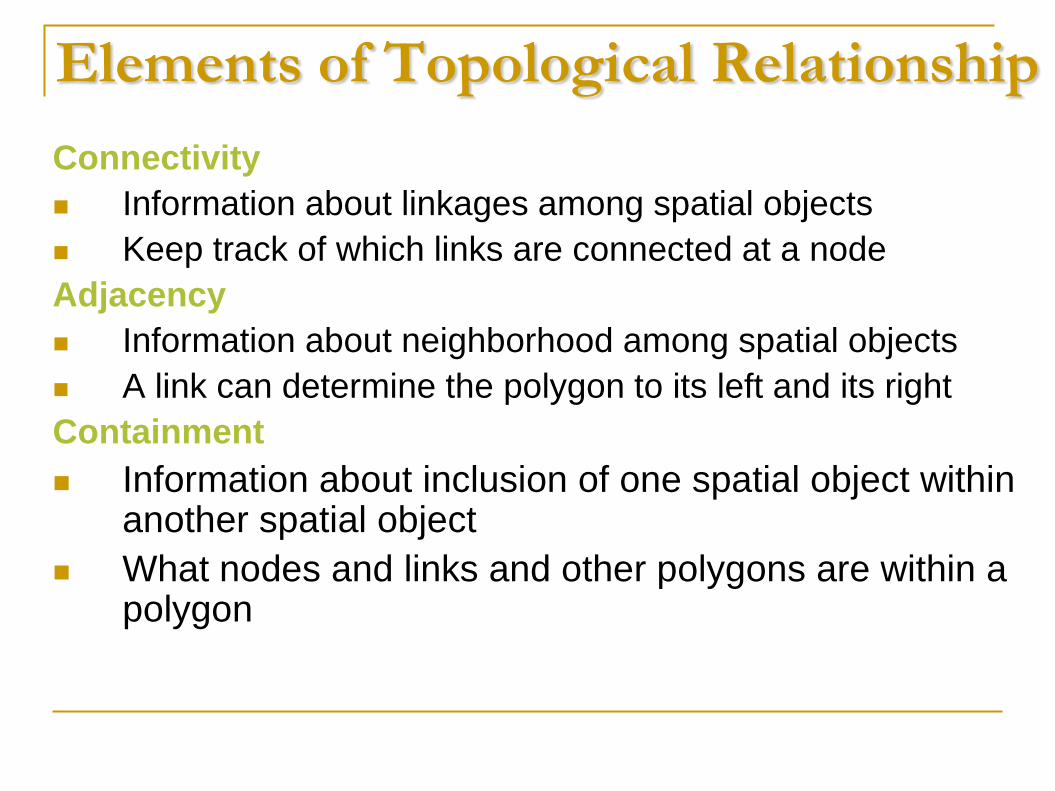
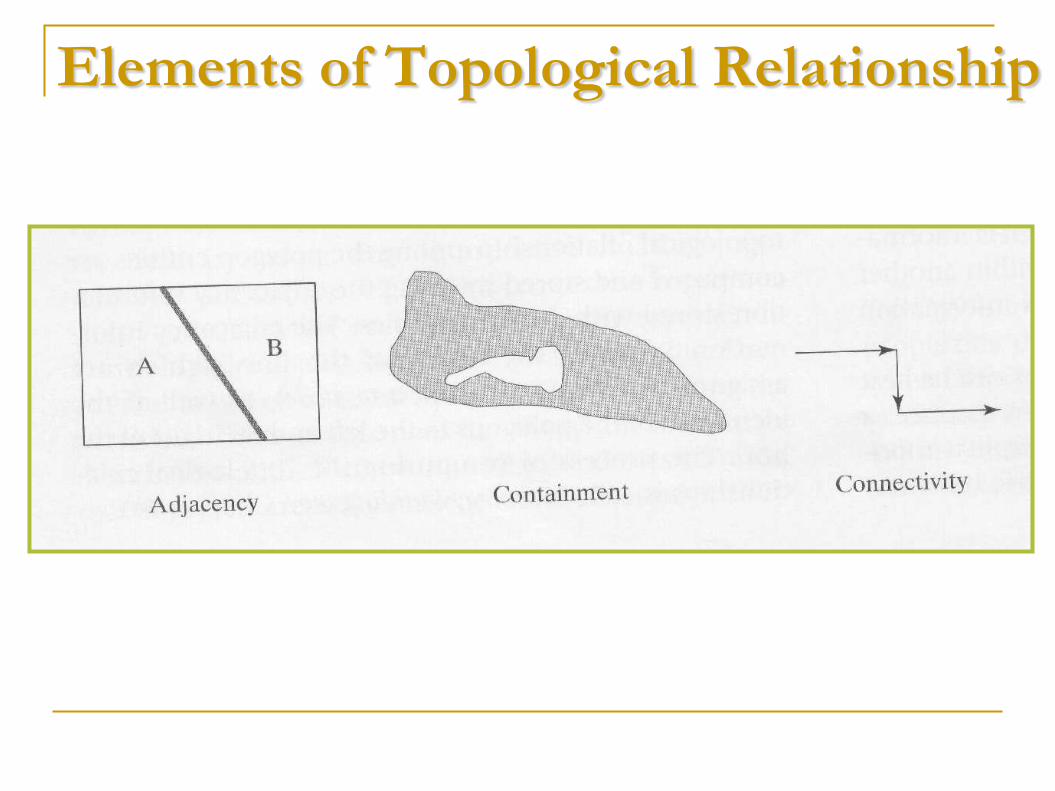
Elements of Topological Relationship
Connectivity
Information about linkages among spatial objects
Keep track of which links are connected at a node
Adjacency
Information about neighborhood among spatial objects
A link can determine the polygon to its left and its right
Containment
Information about inclusion of one spatial object within another spatial object
What nodes and links and other polygons are within a polygon
Elements of Topological Relationship
Topological Map
Explains the concept of topological relationships
A map that contains explicit topological information
on top of the geometric information expressed in
coordinates (Masry and Lee, 1988)
All spatial entities are decomposed and
represented in the form of the three basic
graphical elements (point, line, polygon)
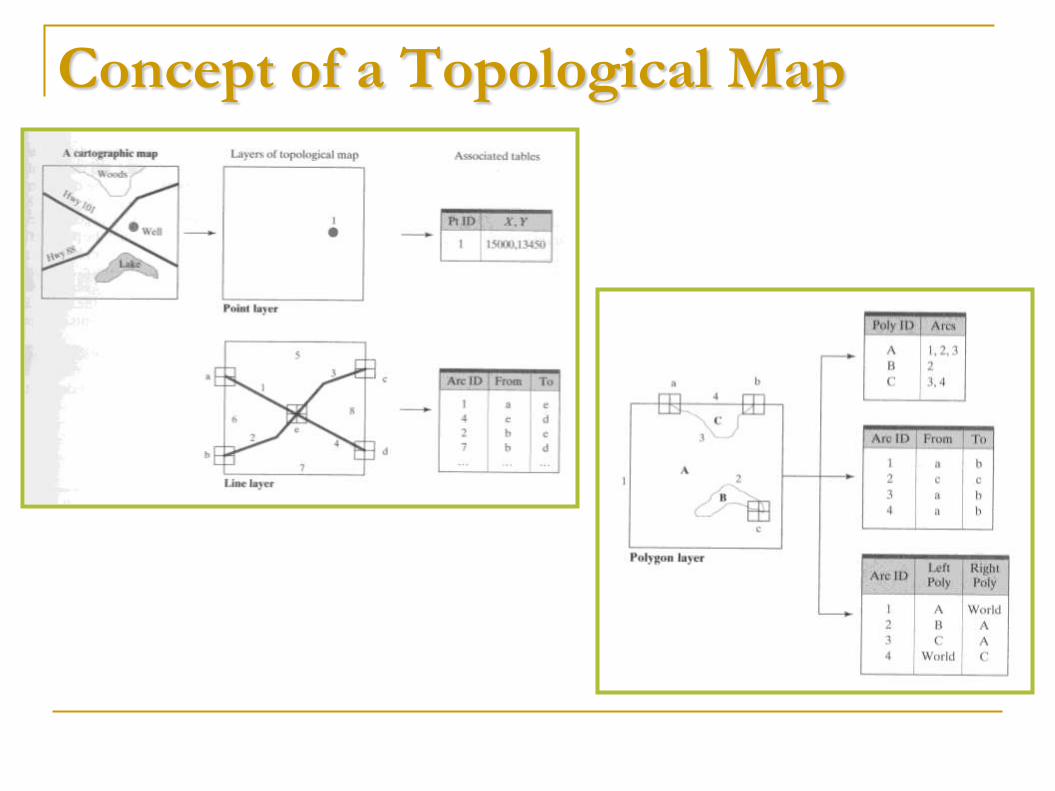
Concept of a Topological Map
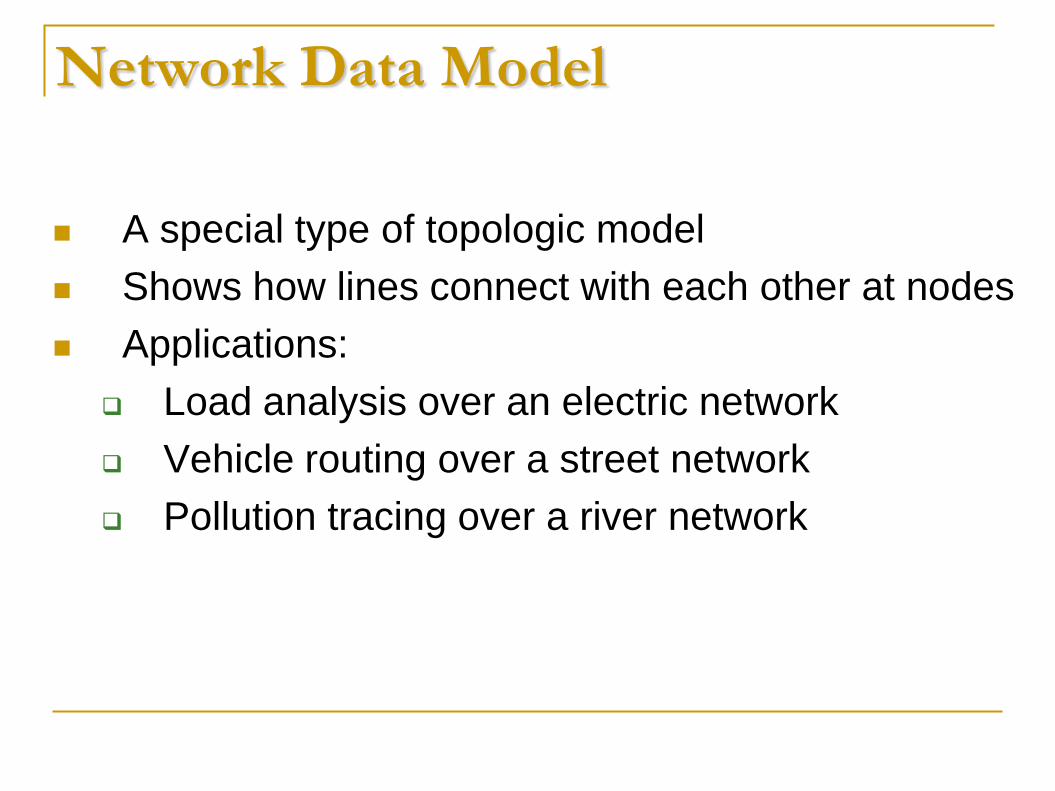
Network Data Model
A special type of topologic model
Shows how lines connect with each other at nodes
Applications:
Load analysis over an electric network
Vehicle routing over a street network
Pollution tracing over a river network
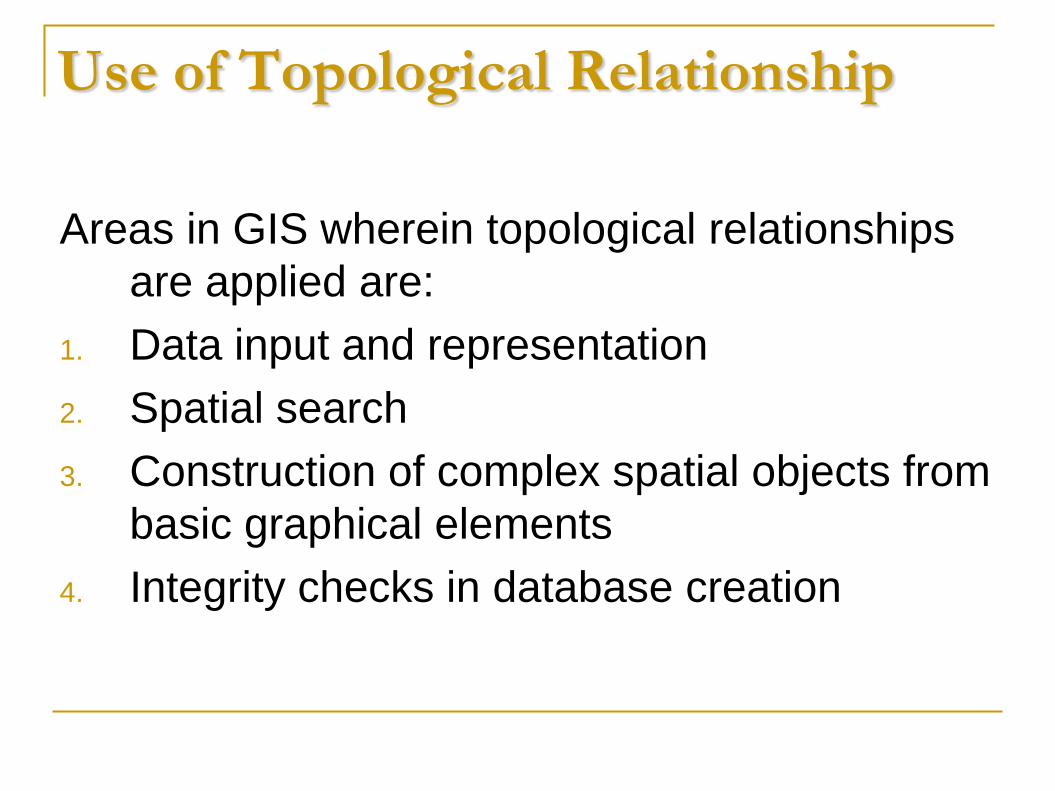
Use of Topological Relationship
Areas in GIS wherein topological relationships
are applied are:
1. Data input and representation
2. Spatial search
3. Construction of complex spatial objects from
basic graphical elements
4. Integrity checks in database creation
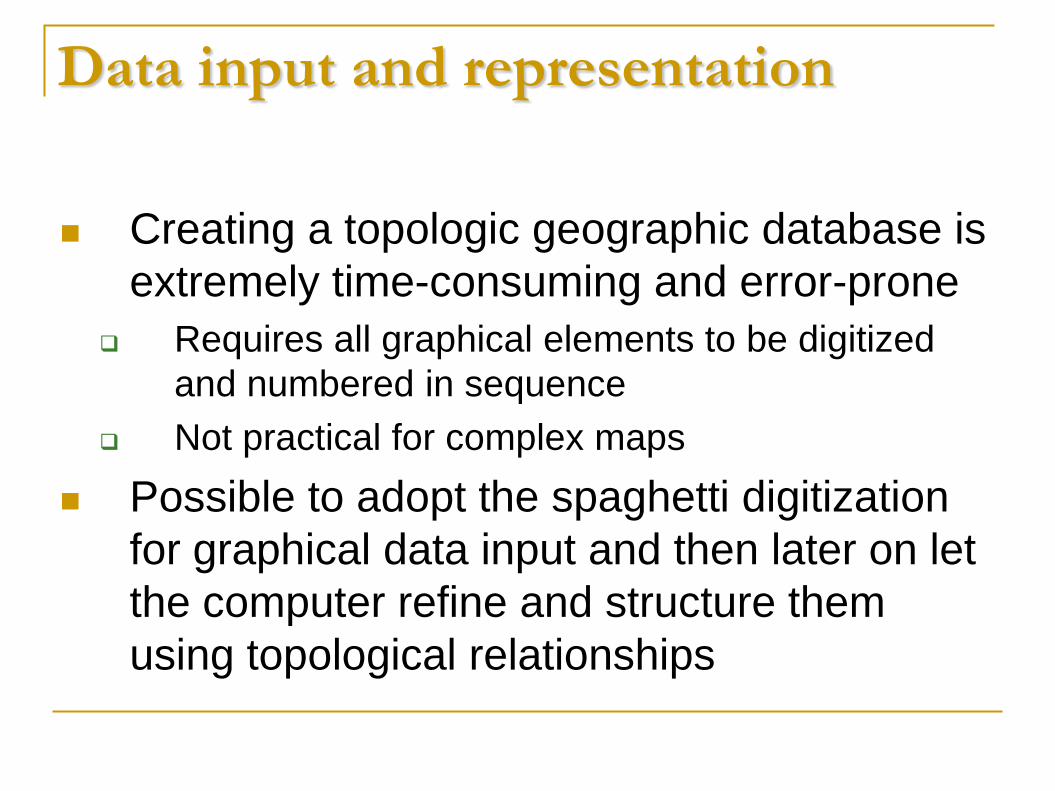
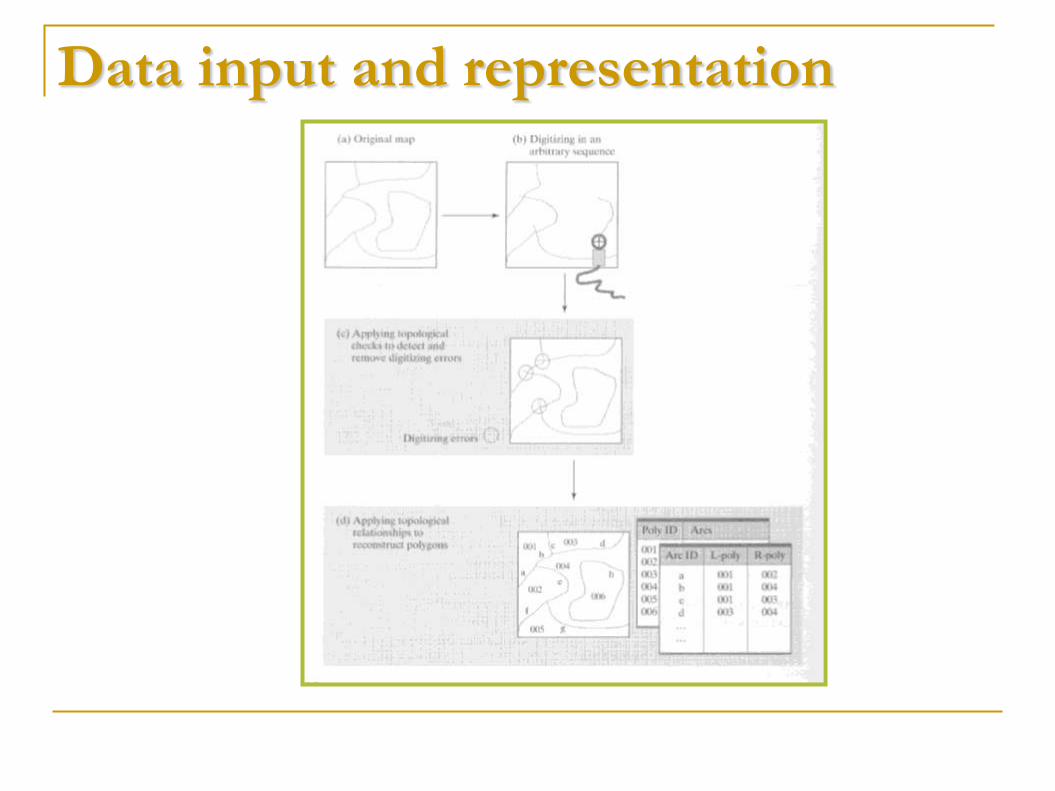
Data input and representation
Creating a topologic geographic database is
extremely time-consuming and error-prone
Requires all graphical elements to be digitized
and numbered in sequence
Not practical for complex maps
Possible to adopt the spaghetti digitization
for graphical data input and then later on let
the computer refine and structure them
using topological relationships
Data input and representation
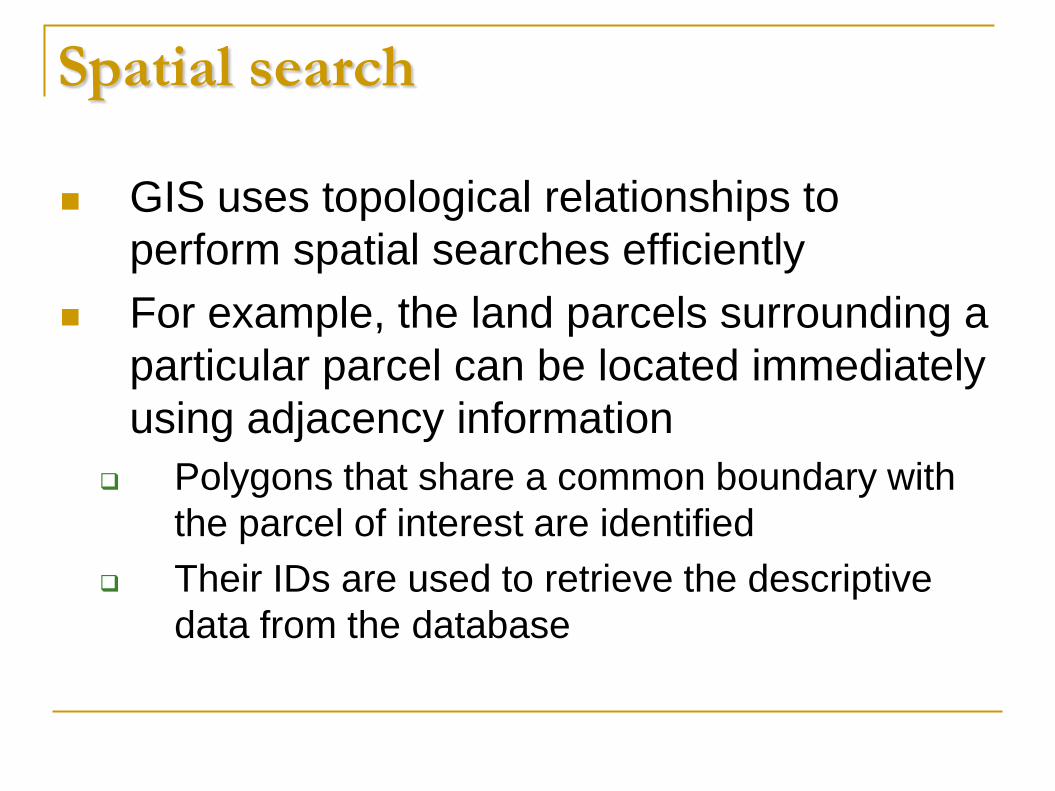
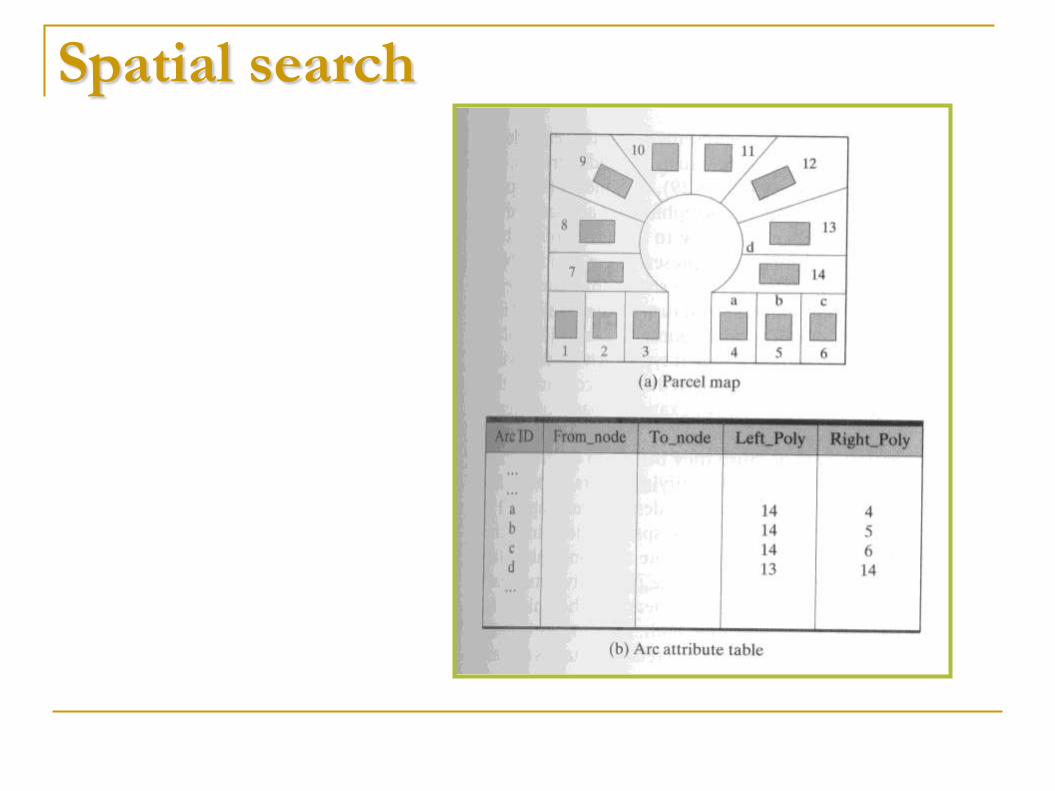
Spatial search
GIS uses topological relationships to
perform spatial searches efficiently
For example, the land parcels surrounding a
particular parcel can be located immediately
using adjacency information
Polygons that share a common boundary with
the parcel of interest are identified
Their IDs are used to retrieve the descriptive
data from the database
Spatial search
Construction of complex
spatial objects
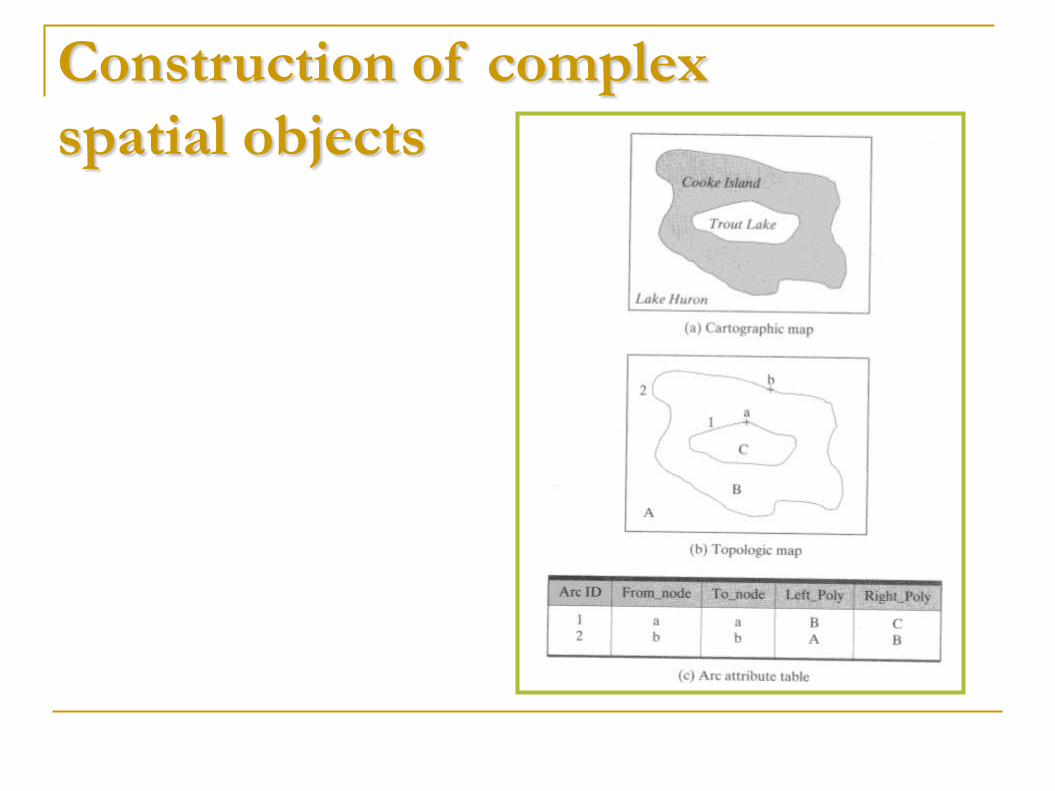
Complex objects are represented as
complex polygons in a geographic database
Two types of complex polygons are:
Those containing one or more holes (or
islands/enclaves) constructed from vector
lines using topological information
Those made up of two or more polygons that
are not physically connected constructed
using a common identifier
Construction of complex
spatial objects
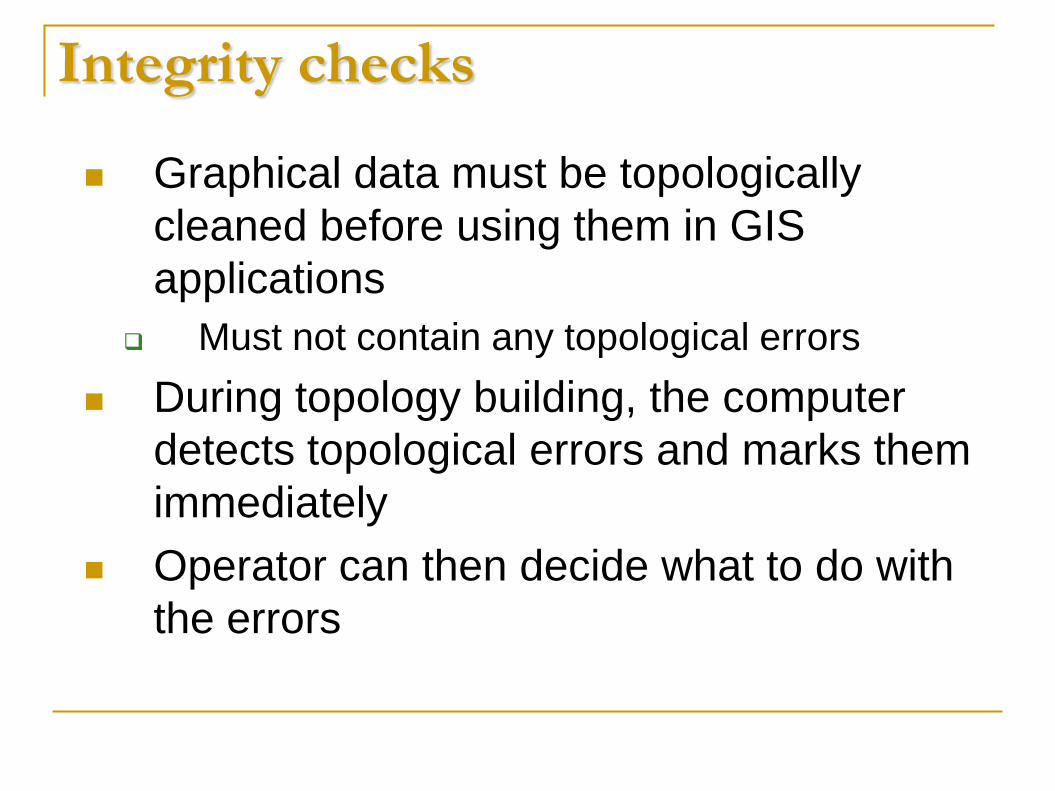
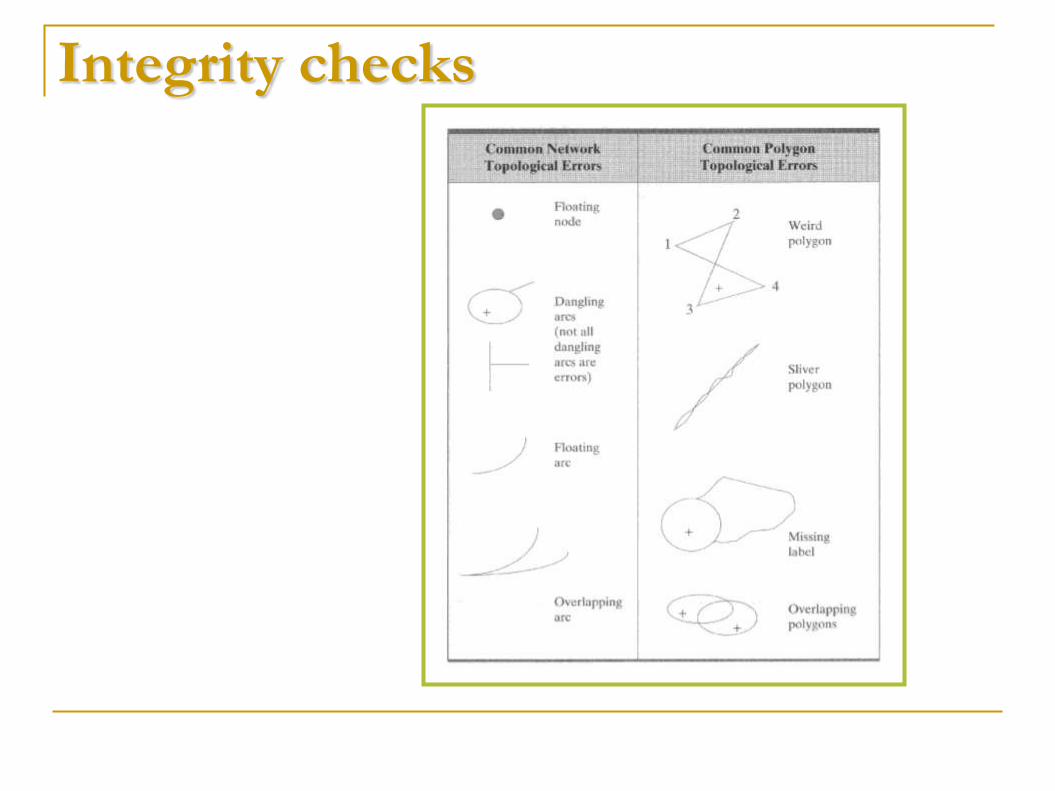
Integrity checks
Graphical data must be topologically
cleaned before using them in GIS
applications
Must not contain any topological errors
During topology building, the computer
detects topological errors and marks them
immediately
Operator can then decide what to do with
the errors
Integrity checks
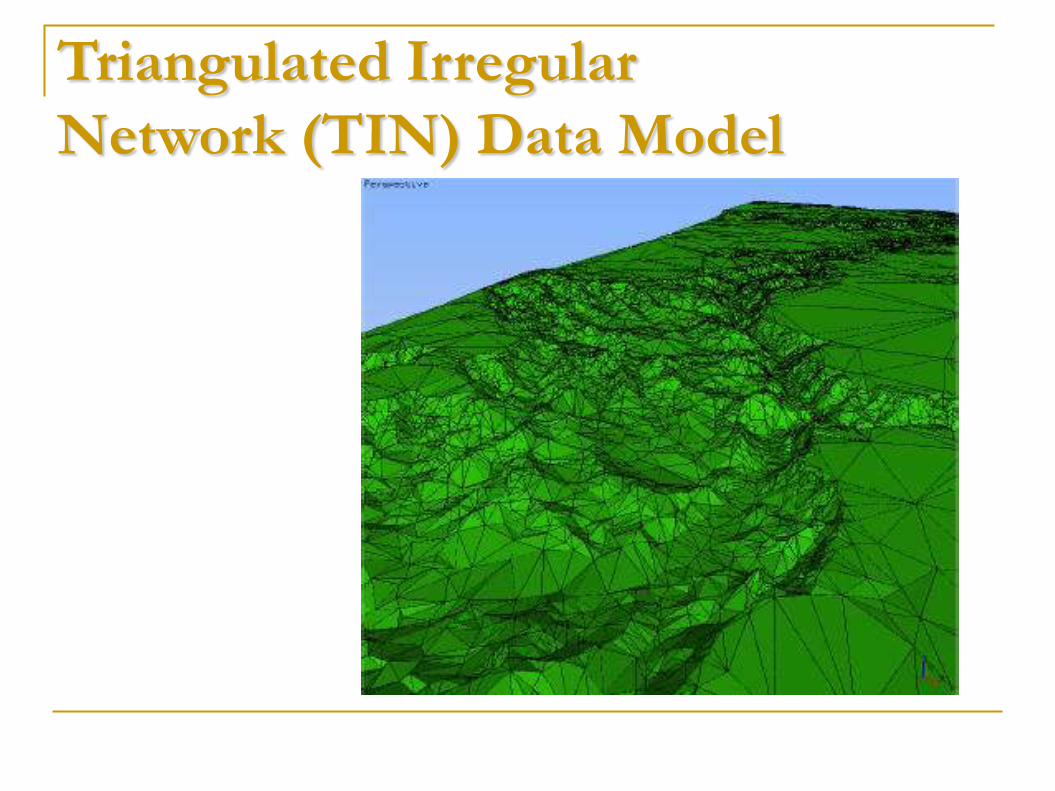
Triangulated Irregular
Network (TIN) Data Model Creates and represents surfaces in GIS
Surface is represented as contiguous, non-overlapping triangles
Size of triangles may be adjusted to reflect the relief of the surface
being modelled
Larger triangles for relatively flat terrain
Smaller triangles for rugged terrain
Manages information about the nodes that comprise each triangle
and the neighbors of each triangle
Applications:
Volumetric calculations for road design
Drainage studies
Landslide studies
Triangulated Irregular
Network (TIN) Data Model
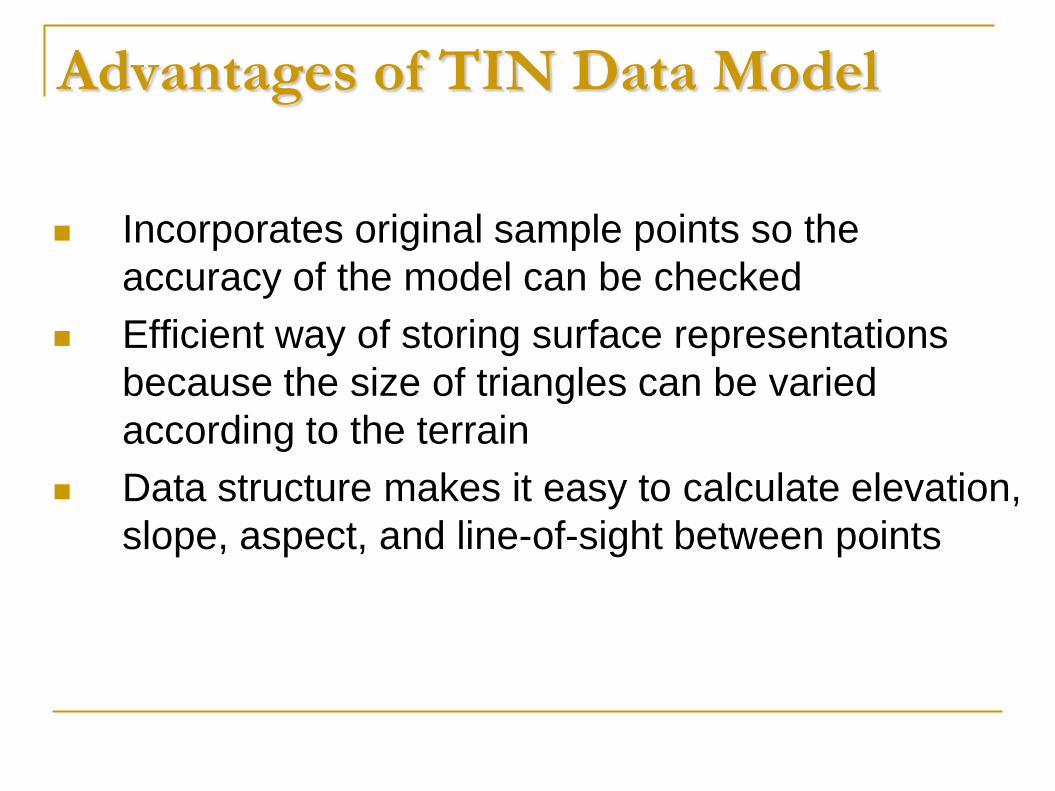
Advantages of TIN Data Model
Incorporates original sample points so the
accuracy of the model can be checked
Efficient way of storing surface representations
because the size of triangles can be varied
according to the terrain
Data structure makes it easy to calculate elevation,
slope, aspect, and line-of-sight between points
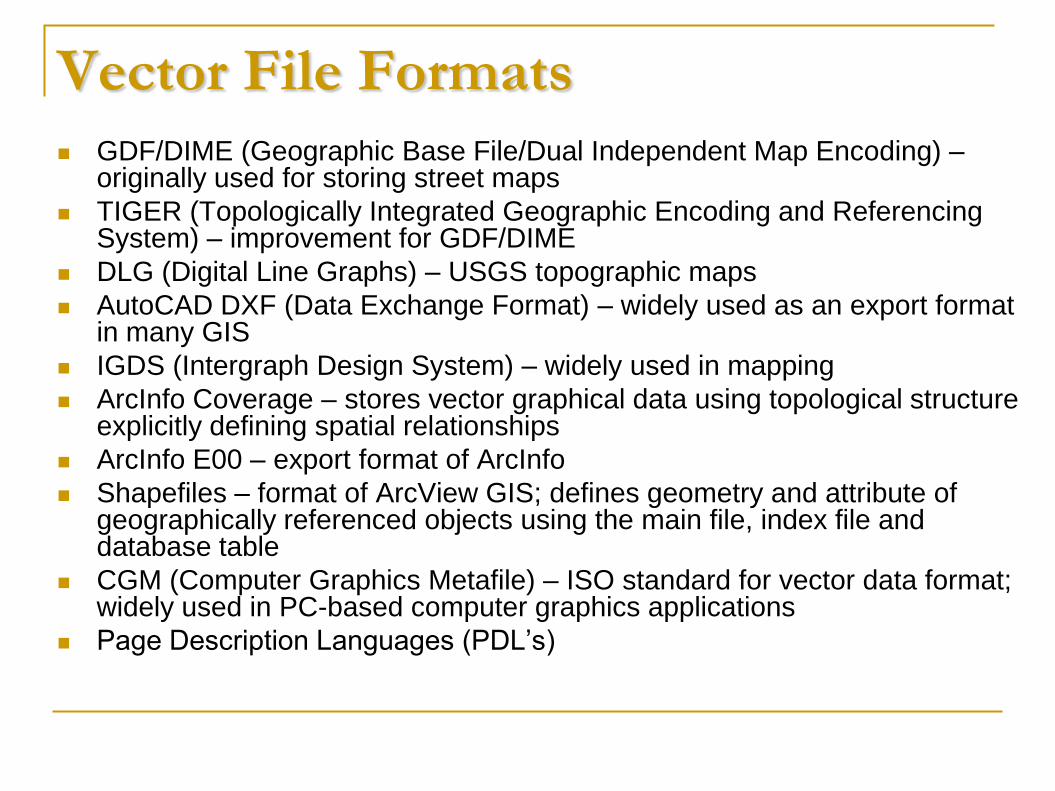
Vector File Formats
GDF/DIME (Geographic Base File/Dual Independent Map Encoding) – originally used for storing street maps
TIGER (Topologically Integrated Geographic Encoding and Referencing System) – improvement for GDF/DIME
DLG (Digital Line Graphs) – USGS topographic maps
AutoCAD DXF (Data Exchange Format) – widely used as an export format in many GIS
IGDS (Intergraph Design System) – widely used in mapping
ArcInfo Coverage – stores vector graphical data using topological structure explicitly defining spatial relationships
ArcInfo E00 – export format of ArcInfo
Shapefiles – format of ArcView GIS; defines geometry and attribute of geographically referenced objects using the main file, index file and database table
CGM (Computer Graphics Metafile) – ISO standard for vector data format; widely used in PC-based computer graphics applications
Page Description Languages (PDL’s)
source and type of data
analytical procedures to be used
intended use of data
Considerations in choosing between
Raster and Vector
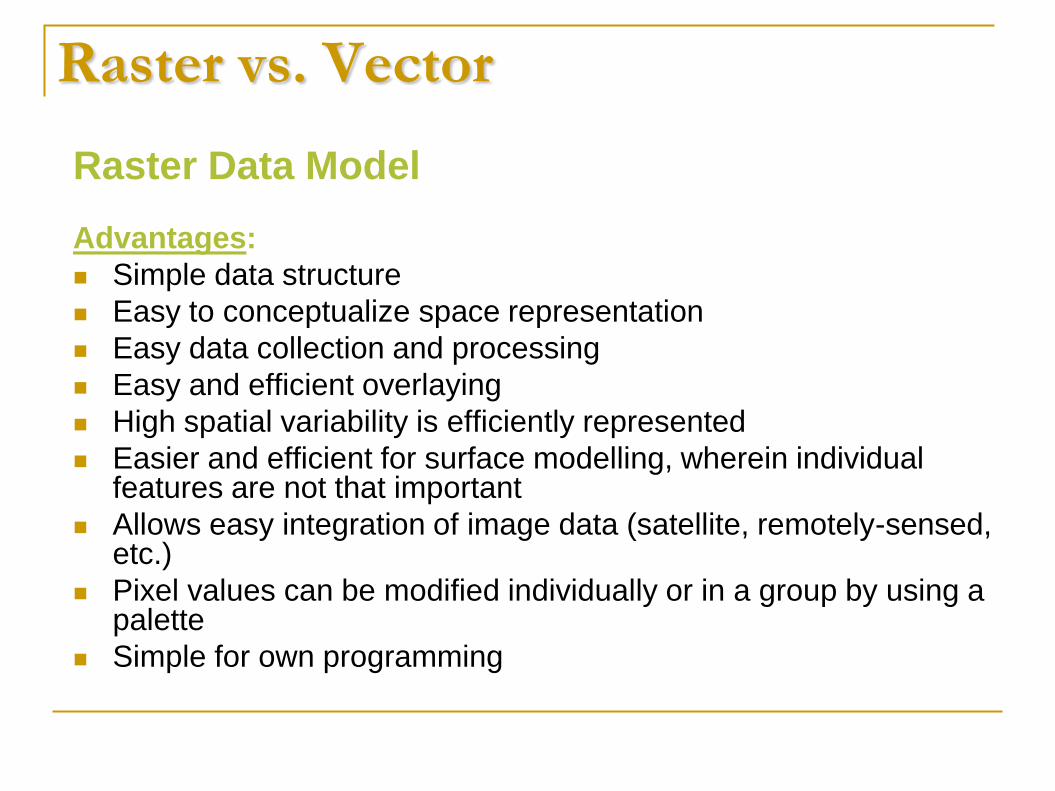
Raster vs. Vector
Raster Data Model
Advantages:
Simple data structure
Easy to conceptualize space representation
Easy data collection and processing
Easy and efficient overlaying
High spatial variability is efficiently represented
Easier and efficient for surface modelling, wherein individual features are not that important
Allows easy integration of image data (satellite, remotely-sensed, etc.)
Pixel values can be modified individually or in a group by using a palette
Simple for own programming
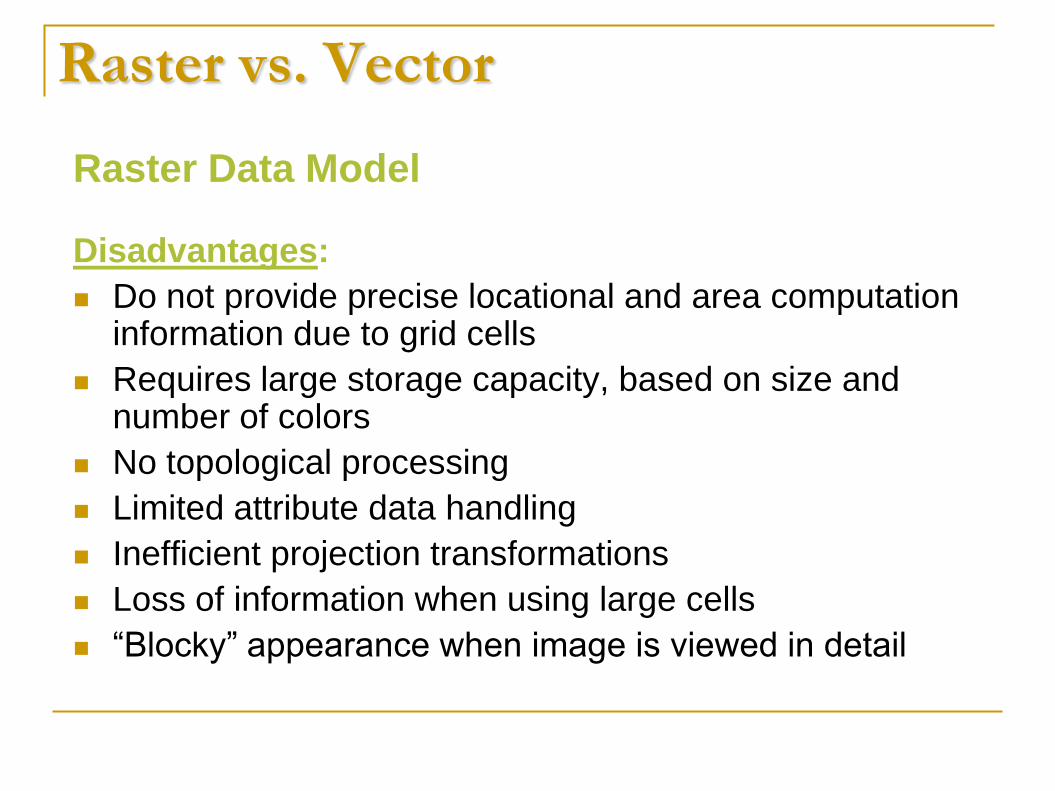
Raster vs. Vector
Raster Data Model
Disadvantages:
Do not provide precise locational and area computation information due to grid cells
Requires large storage capacity, based on size and number of colors
No topological processing
Limited attribute data handling
Inefficient projection transformations
Loss of information when using large cells
“Blocky” appearance when image is viewed in detail
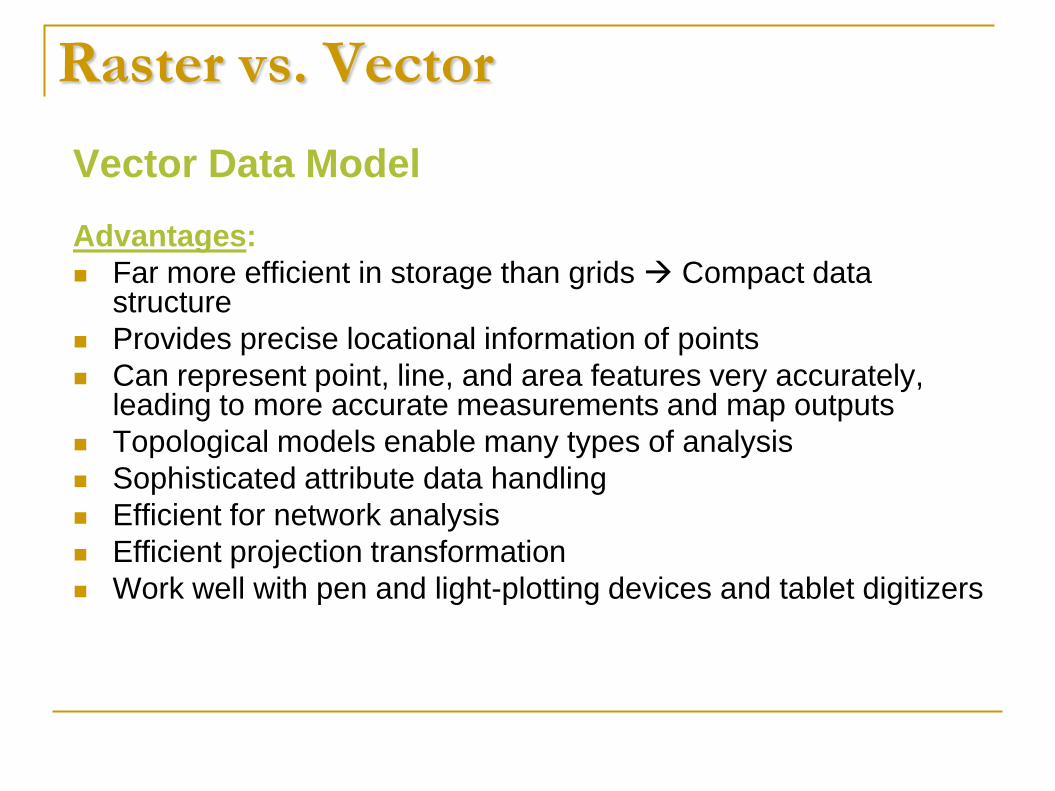
Raster vs. Vector
Vector Data Model
Advantages:
Far more efficient in storage than grids Compact data structure
Provides precise locational information of points
Can represent point, line, and area features very accurately, leading to more accurate measurements and map outputs
Topological models enable many types of analysis
Sophisticated attribute data handling
Efficient for network analysis
Efficient projection transformation
Work well with pen and light-plotting devices and tablet digitizers
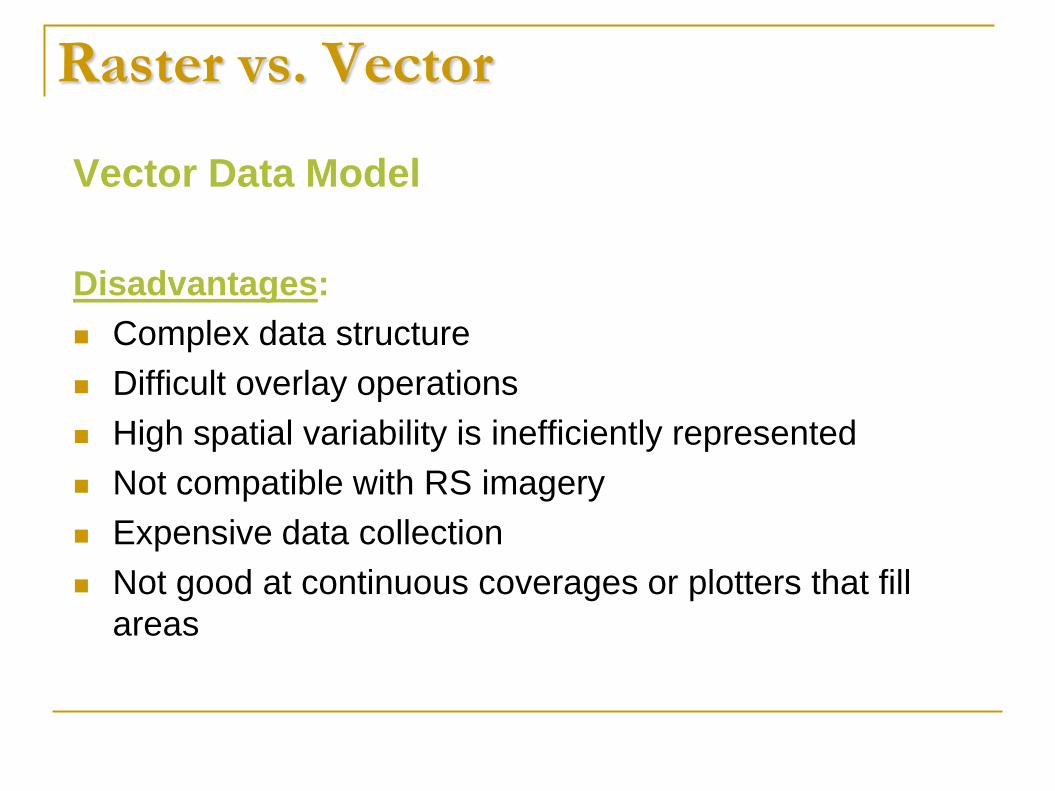
Raster vs. Vector
Vector Data Model
Disadvantages:
Complex data structure
Difficult overlay operations
High spatial variability is inefficiently represented
Not compatible with RS imagery
Expensive data collection
Not good at continuous coverages or plotters that fill
areas
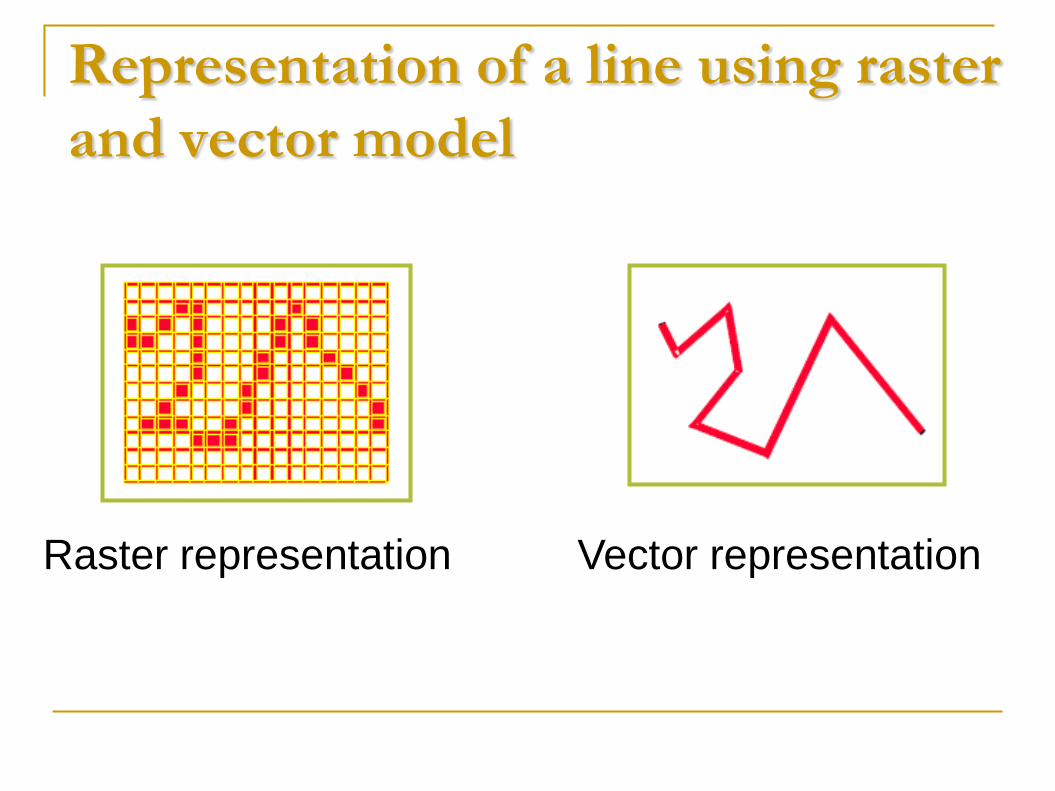
Representation of a line using raster
and vector model
Raster representation Vector representation

Thank you!