Embed Size (px)
Citation preview
Lecture 20:Technical Analysis
Steven Skiena
Department of Computer ScienceState University of New YorkStony Brook, NY 11794–4400
http://www.cs.sunysb.edu/∼skiena

The Efficient Market Hypothesis
The Efficient Market Hypothesisstates that the price ofa financial asset reflects all available public informationavailable, and responds only to unexpected news.If so, prices are optimal estimates of investment value at alltimes.If so, it is impossible for investors to predict whether the pricewill move up or down.There are a variety of slightly different formulations of theEfficient Market Hypothesis (EMH). For example, supposethat prices are predictable but the function is too hard tocompute efficiently. . .
Implications of the Efficient Market Hypothesis
EMH implies it is pointless to try to identify the best stock,but instead focus our efforts in constructing the highest returnportfolio for our desired level of risk.EMH implies that technical analysis is meaningless, becausepast price movements are all public information.EMH’s distinction between public and non-public informa-tion explains whyinsider tradingshould be both profitableand illegal.Like any simple model of a complex phenomena, the EMHdoes not completely explain the behavior of stock prices.However, that it remains debated (although not completelybelieved) means it is worth our respect.
Technical Analysis
The term “technical analysis” covers a class of investmentstrategies analyzing patterns of past behavior for futurepredictions.Technical analysis of stock prices is based on the followingassumptions (Edwards and Magee):
• Market value is determined purely by supply and demand
• Stock prices tend to move in trends that persist for longperiods of time.
• Shifts in supply and demand cause reversals in trends.
• These shifts can be detected in charts/graphs.

• Many chart patterns tend to repeat themselves.
There have been long and loud debates of the relativemerits of technical analysis andfundamental analysis, whichassesses the profitability and prospects of the given security.
Technical Analysis: Pro
Many professionals use it. Many amateurs use it, too. Howcan this be if it has no value?M. Taylor and H. Allen, “The Use of Technical Analysisin the Foreign Exchange Market”, J. International Moneyand Finance, June 1992, 304-314. surveys foreign exchangedealers and find that the vast majority place some weight ontechnical analysis.Since market prices reflect supply and demand, any under-standing of popular trading strategies can potentially providean edge.
Given the diverse strategies and goals of different traders(e.g.hedging and risk reduction vs. profit maximization) theremay be positive investment opportunities even in an efficientmarket.Certain technical analysis methods seem to mirror naturalhuman strategies (buy when it breaks through a high, sellwhen it is declining, etc.)Many natural (e.g daily/annual weather patterns) and humanphenomena (e.g. meal times and jet lag) revolve aroundrhythms and cycles – why not market phenomena which area combination of both?
Technical Analysis: Con
Technical analysis is like driving a car while looking througha rear-view mirror. . .If you believe in the efficient market hypothesis / randomwalk theory, technical analysis cannot work, because com-plete knowledge of past history is encoded in the currentprice.In many trading theories, the patterns are ambiguous and thetrading strategies not rigorously defined. Thus two people cantake the opposite position on a trade while still following thesame theory. This makes it difficult to benchmark the qualityof the theory.
The cycles of the market may be like the cycles of a child ona swing, periodic, but unpredictable due to irregularitiesofkicking patterns and wind gusts.Short-term claims of excellent performance often just reflectluck.Published studies generally reach ambiguous conclusions,although several do favor technical analysis to some degree.
Types of Charts
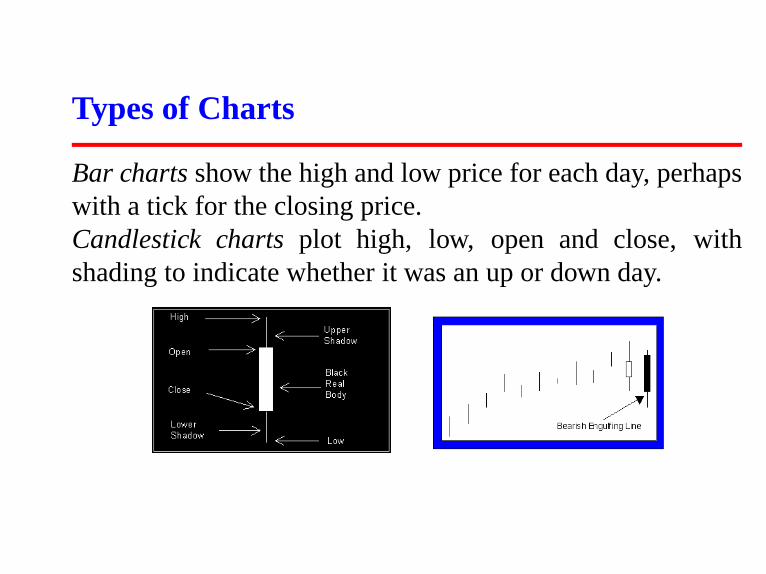
Bar chartsshow the high and low price for each day, perhapswith a tick for the closing price.Candlestick chartsplot high, low, open and close, withshading to indicate whether it was an up or down day.
Certain trading systems look for certain shapes of thesebars, such as the “Candlestick hammer”, which looks like ahammer.The primary merit to such systems appear to be as avisualization tool, making it easy to eyeball recent marketactivity.
Trend Reversal / Continuation Patterns
A broad class of technical trading strategies revolve aroundthe current price with respect to recent history.The support levelof a stock is the lower end of its recenttrading range.The resistance levelof a stock is the upper end of its recenttrading range.The Dow theory suggests buying (selling) when a price isnear its support (resistance) level – buy low, sell high.Combining volume trends with price trends seek to capturemarket sentiment. Hitting a new low with high volume isbearish, while it might not be as significant with low volume.
B. Lehmann “Fads, Martingales, and Market Efficiency”,TheQuarterly Journal of Economics, February 1990, pp. 1-28.observed that stocks which fall by a sizable amount one weektend to experience a sizable rise the following week.N. Jagadeesh, “Evidence of Predictable Behavior of SecurityReturns”,J. Finance, July 1990, 881-898. finds that similarpatterns occur on monthly scales.

Moving Average Indicators
Typically exponentially weighted moving average models areused to place the current price in context within abanddetermined by the high, low and average prices in the interval.The width of these bands may be governed by extreme values,fixed percentages, or volatility (given movements are lesssignificant in times of high volatility).
Bollinger Bands
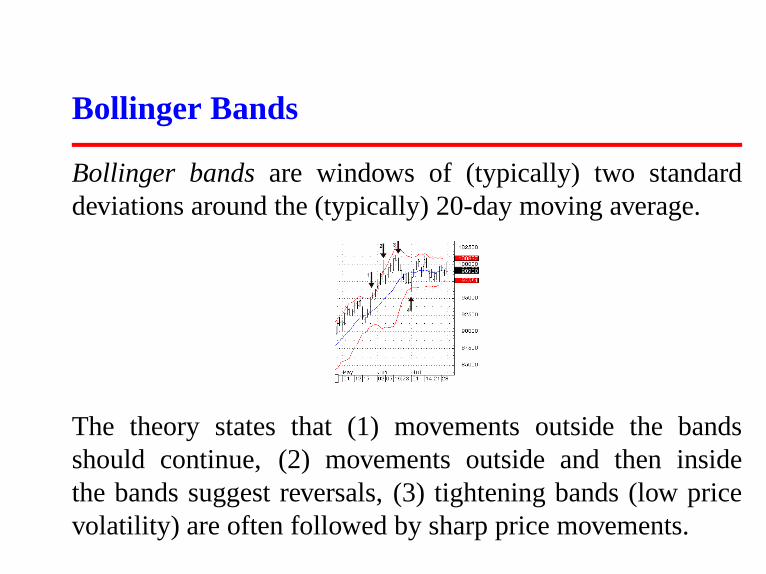
Bollinger bandsare windows of (typically) two standarddeviations around the (typically) 20-day moving average.
The theory states that (1) movements outside the bandsshould continue, (2) movements outside and then insidethe bands suggest reversals, (3) tightening bands (low pricevolatility) are often followed by sharp price movements.
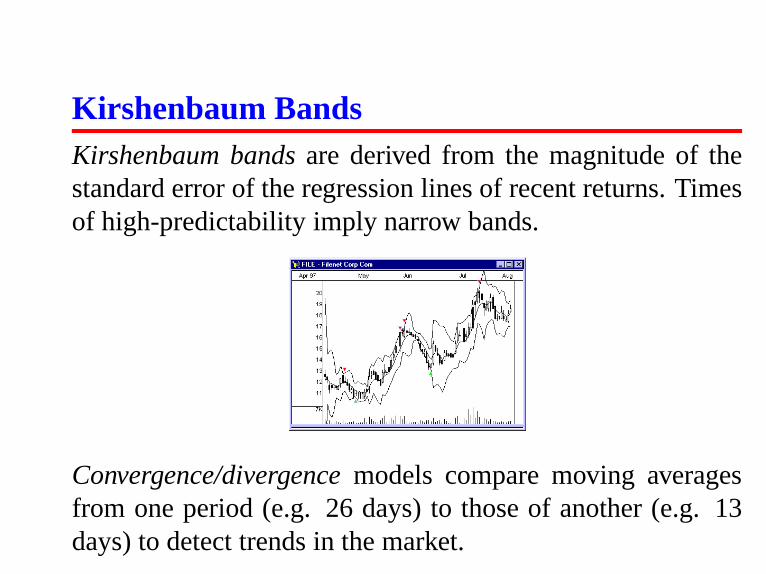
Kirshenbaum BandsKirshenbaum bandsare derived from the magnitude of thestandard error of the regression lines of recent returns. Timesof high-predictability imply narrow bands.
Convergence/divergencemodels compare moving averagesfrom one period (e.g. 26 days) to those of another (e.g. 13days) to detect trends in the market.
Oscillators
Money flow indicatorsfactor in price changes and volumes tomeasure how much money is being invested in the security.These strategies assume that markets oscillate between over-bought and over-sold levels.The notion of accumulation/distributionis a cumulativemeasure of the volume “bought” in up periods subtractedfrom that of volume “sold” in down periods.This is a measure of whether money is flowing into or out ofthe market.Directional movement crossoverscompare the differences ofhigh prices and the differences of low prices to suggest a trend
Chaikin Oscillator
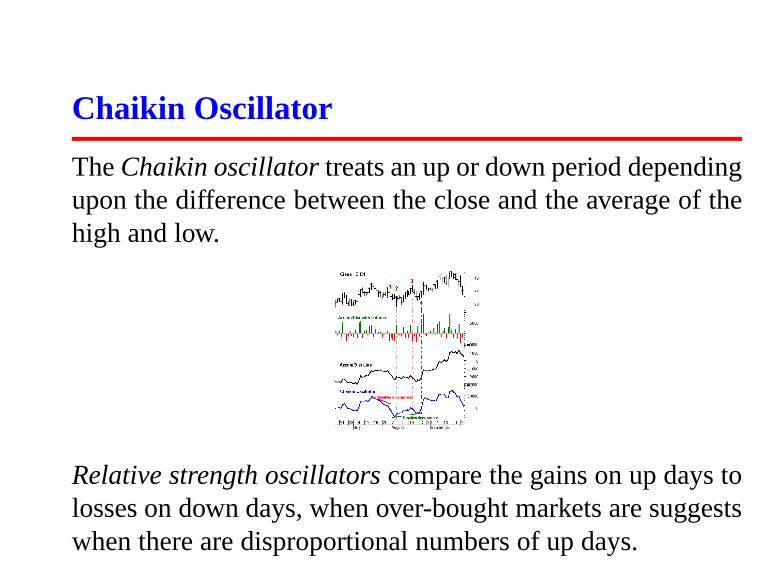
TheChaikin oscillatortreats an up or down period dependingupon the difference between the close and the average of thehigh and low.
Relative strength oscillatorscompare the gains on up days tolosses on down days, when over-bought markets are suggestswhen there are disproportional numbers of up days.

McClellan Oscillator
The McClellan Oscillator is a measure of market breadthbased on the smoothed difference between the number ofadvancing and declining issues on the NYSE. The systemcompares (subtracts) the EWMAs of 19 and 39 day functions.

Pros vs. Joes Indicators
The ratio of short-selling between NYSE specialists (marketmakers) vs others compares smart to dumb money.The ratio of short-selling interest to the average daily volumeof the previous month. If few shares are being sold short,there is less potential demand for future shares since less willbe bought to cover short positions.Put-call ratios measure options activity. Typically call volumeis far greater than put volume.
Insider Indicators
Insider trading measures the activity of people who havereason to know what is happening inside a company.Advisory indices measure what financial advisors are rec-ommending. Results suggest taking a position contrary tofinancial advisors.
Elliot Wave Theory
The popular (but mystical) Elliot Wave Theory was firstpublished in 1939 based on the work of Ralph Nelson Elliot.It claims that market movements and other dimensions ofhuman behavior are based on repetitive patterns of waves.The theory claims that (1) action is followed by reaction, (2)five waves (peaks or trophs) in the direction of the mail trendare followed by three corrective waves. (3) Such a cyclebecomes two subdivisions of the next 5-3 wave, (4) The 5-3 pattern of waves is constant, although time spans of eachwave may vary.
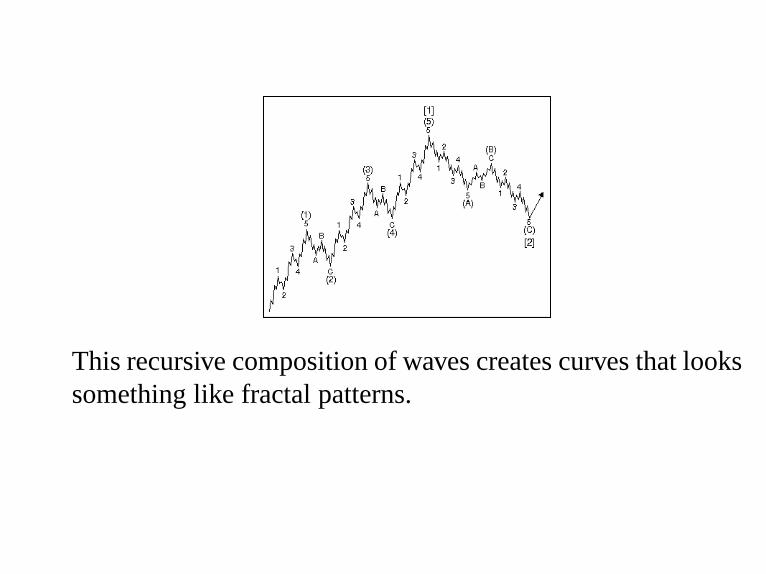
This recursive composition of waves creates curves that lookssomething like fractal patterns.
Fibonacci Numbers
The 5-3 pattern of Elliot Wave theory becomes intertwinedwith theFibonacci numbers, whereFn = Fn−1 + Fn−2.Fibonacci numbers arise in any process modeled by thisrecurrence, e.g. phyllotaxis in plants.The thirteen piano keys of an octave are partitioned into 8white and 5 black.The golden ratio of 0.618is the ratio between successiveFibonacci numbers.Fibonacci trend lines tend to appear at ratios of 38.2 %,50%, and 61.8%, according to several trading systems,where values increasing/decreasing by such ratios are deemedsignificant.
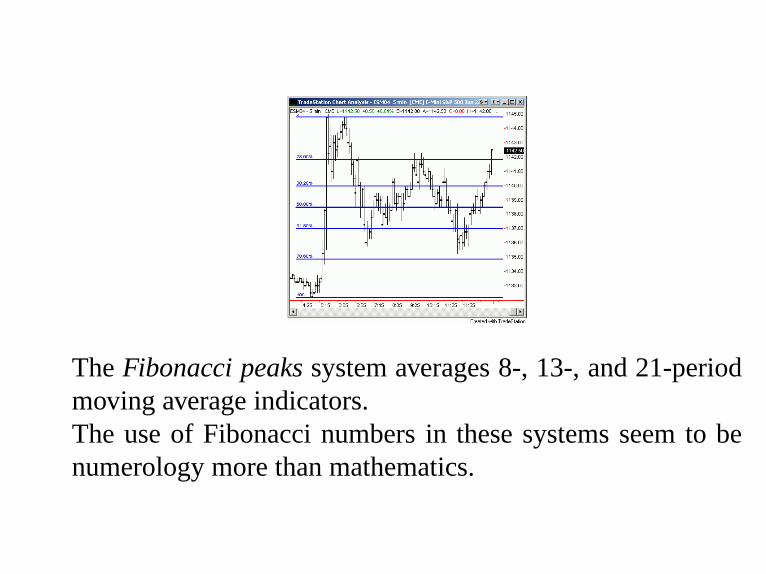
TheFibonacci peakssystem averages 8-, 13-, and 21-periodmoving average indicators.The use of Fibonacci numbers in these systems seem to benumerology more than mathematics.

Conclusions: Bauer and Dahlquist
These are drawn from “Technical Market Indicators: Anal-ysis and Performance” by Bauer and Dahlquist, 1999, whostudied 60 technical indicators for 878 stocks on daily datafrom 1985 to 1996.
• If you trade strictly following technical signals you willon average do worse than buy-and-hold, because . . .
• Technical indicators on average signal a high proportionof cash positions– Because the magnitude of positivereturns historically exceeds those of negative returns,the opportunity cost of a conservative cash position aresignificant. Thus . . .
• Technical indicators generally outperform buy-and-holdfor stocks that are declining but under perform for thosethat are rising in price.
• Technical indicators do on average contain informationthat may be of value in trading.– Bauer-Dahlquist foundthat 50 of 60 tested indicators returned showed greaterthan average returns on the days the indicators signaledlong/buy. They also found that lower than average (butstill positive) returns occurred on days when the indicatorssignaled short/sell. However, these signals were notsufficient to outperform buy-and-hold.
• Portfolio management is the important issue intechnically-based trading systems– Portfoliomanagement is trivial for buy-and-hold, but it is notclear how you take advantage of such relatively weaksignals as appear to come from technical analysis.
• Strategy evaluation typically ignores transaction costs,slippage (inability to transact at published prices), andinterest– The first two work against technical analysis,while the latter is not sufficient for such strategies to beatbuy-and-hold.
• Leveraged positions may be necessary to exploit certainopportunities– However, leverage also increases risk inthe event of a downturn.
Conclusions: Skiena
Technical analysis is widely used by tradersas justificationfor making what are relatively arbitrary decisions.The “formal” strictures of such methods may well enhancethe traders performance just as rhythmic structures like haikuor limericks enhance poet’s performance.If markets behave as random walks, then technical analysis isevery bit as justified as any other trading strategy.Technical analysis seems able to help identify trends whichare occurring, however the evidence is less compelling thatitcan pick up significant changes in trends.


![SCC-211 - Capítulo 12 Gridswiki.icmc.usp.br/images/3/34/SCC211Cap12.pdf · Material do Steven Skiena Os próximos 14 slides contêm material de Steven Skiena disponíveis em [2]](https://img.pdfslide.net/doc/110x75/605b2d910f118c29276f78be/scc-211-captulo-12-material-do-steven-skiena-os-prximos-14-slides-contm.jpg)