Embed Size (px)
Citation preview
LECTURE 24 Hysteresis Effects on Unemployment
April 23, 2013
Economics 134 Christina Romer Spring 2013 David Romer
Announcements
• Hand in short papers.
• Problem set 4 is being distributed. It is due a week from today (Tuesday, April 30th).
Overview
• The last section of the course talks about the interaction between short-run policy and long-run outcomes.
• Determinants of the normal unemployment rate.
• Budget policy and the health of the economy.
I. DETERMINANTS OF THE NORMAL OR NATURAL RATE OF UNEMPLOYMENT
Decomposing the Unemployment Rate
• U = UNormal + UCyclical
• UNormal reflects a range of structural factors and is where the economy comes to rest when we are at potential output.
• UCyclical is the extra unemployment due to a recession (or negative unemployment due to a boom).
Another name for the normal unemployment rate is the NAIRU
• NAIRU stands for non-accelerating inflation rate of unemployment.
• The level of unemployment where inflation does not tend to either rise or fall.
What affects normal unemployment?
• Efficiency of the labor market, including the degree of match between worker characteristics and job requirements
• Demographic features of the labor force (for example, younger workers tend to have a higher normal unemployment rate)
• Labor market institutions (such as union strength, firing costs, payroll taxes, minimum wages, unemployment compensation)
What could cause the normal unemployment rate to change?
• Sectoral change leading to more mismatch.
• Better recruiting or job-finding tools.
• Changes in demographic features of the labor force
• Changes in labor market institutions
• Prolonged periods of high (or low) cyclical unemployment
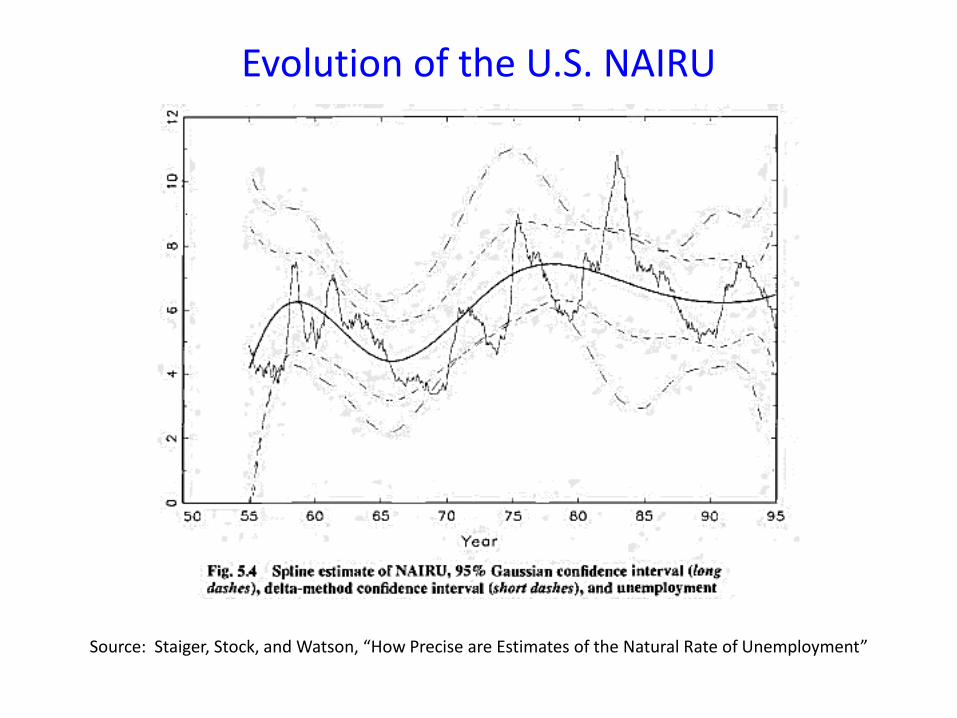
Evolution of the U.S. NAIRU
Source: Staiger, Stock, and Watson, “How Precise are Estimates of the Natural Rate of Unemployment”
Why do we care if the normal unemployment rate has risen?
• It is the unemployment rate where the economy will come to rest. A higher rate is hard on people, the government budget, and standards of living.
• If unemployment is high because of a rise in the natural rate, aggregate demand policy may not be effective in reducing it.
• Might need other types of policies, such as better job training or recruiting tools.
II. THE IMPACT OF PROLONGED RECESSION ON THE NATURAL RATE (BALL PAPER)
Why might prolonged cyclical unemployment lead to an increase in the NAIRU?
• Labor supply effects: people become used to unemployment and may remain counted as unemployed, but aren’t really looking for work (or putting downward pressure on wages).
• Bargaining effects: Prolonged unemployment causes members to leave union, and so they aren’t represented in bargaining.
• Labor demand effects: Firms don’t want to hire long-term unemployed, so employed don’t worry about losing their job and so don’t moderate wage demands.
Measuring the NAIRU
• Ball estimates it empirically.
• Essentially looks at the behavior of inflation to deduce if unemployment is above or below normal.
• For this to make sense, needs to assume that supply shocks and other errors in the usual Phillips curve relationship are small.
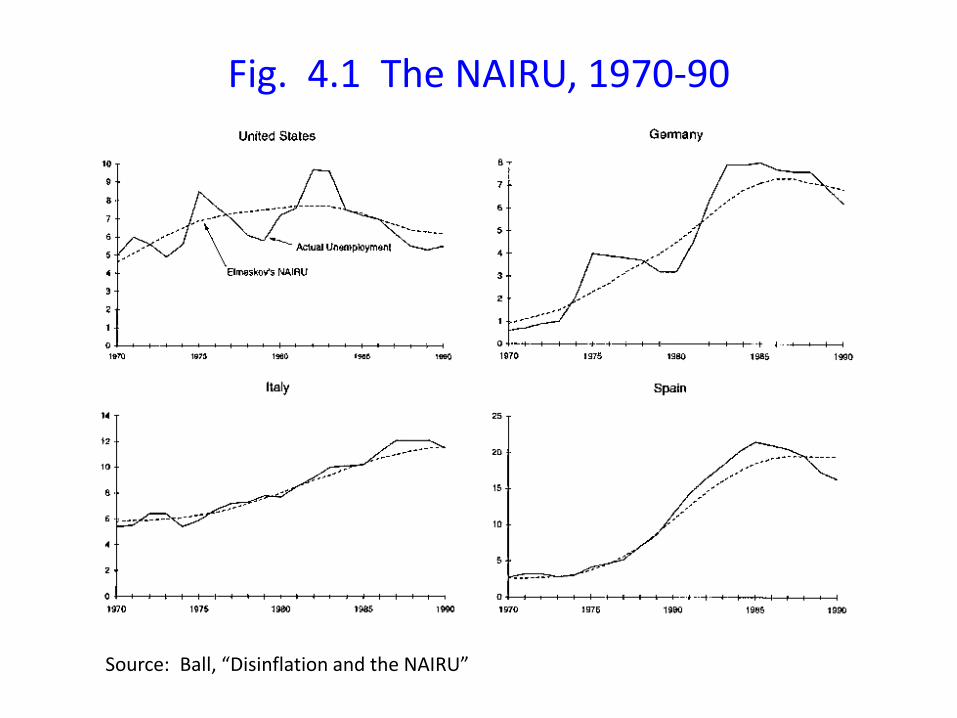
Fig. 4.1 The NAIRU, 1970-90
Source: Ball, “Disinflation and the NAIRU”
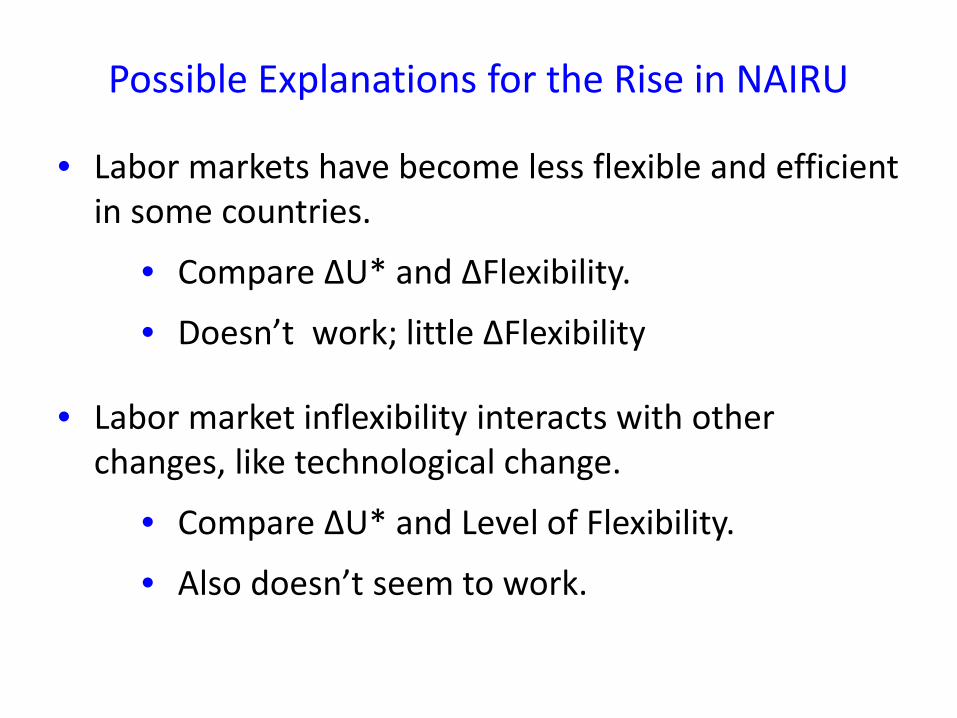
Possible Explanations for the Rise in NAIRU
• Labor markets have become less flexible and efficient in some countries.
• Compare ΔU* and ΔFlexibility.
• Doesn’t work; little ΔFlexibility
• Labor market inflexibility interacts with other changes, like technological change.
• Compare ΔU* and Level of Flexibility.
• Also doesn’t seem to work.
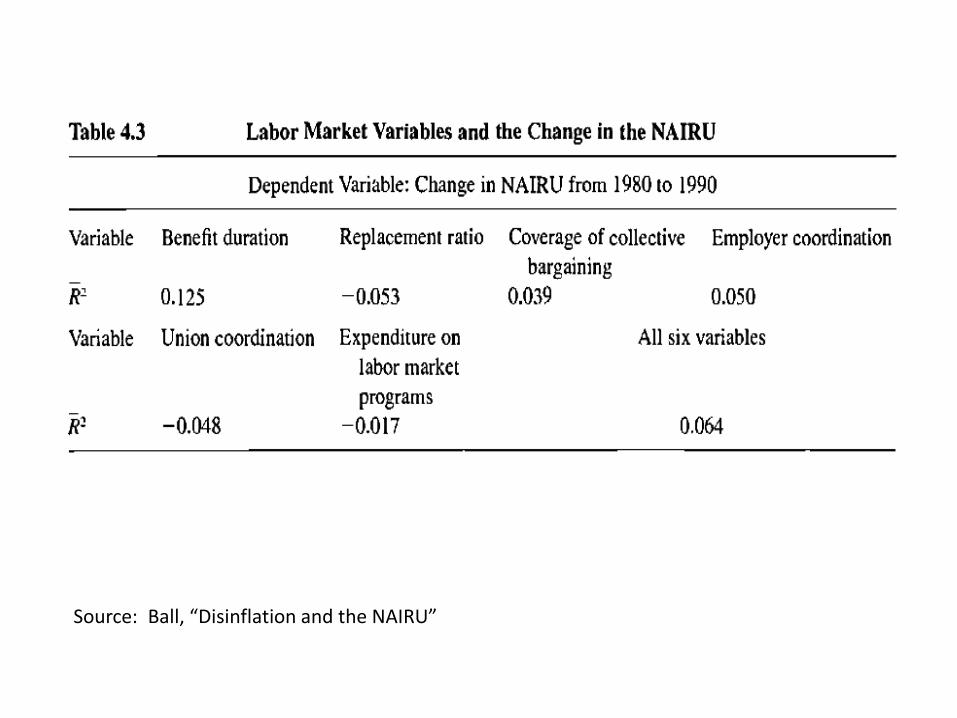
Source: Ball, “Disinflation and the NAIRU”
Source: Ball, “Disinflation and the NAIRU”
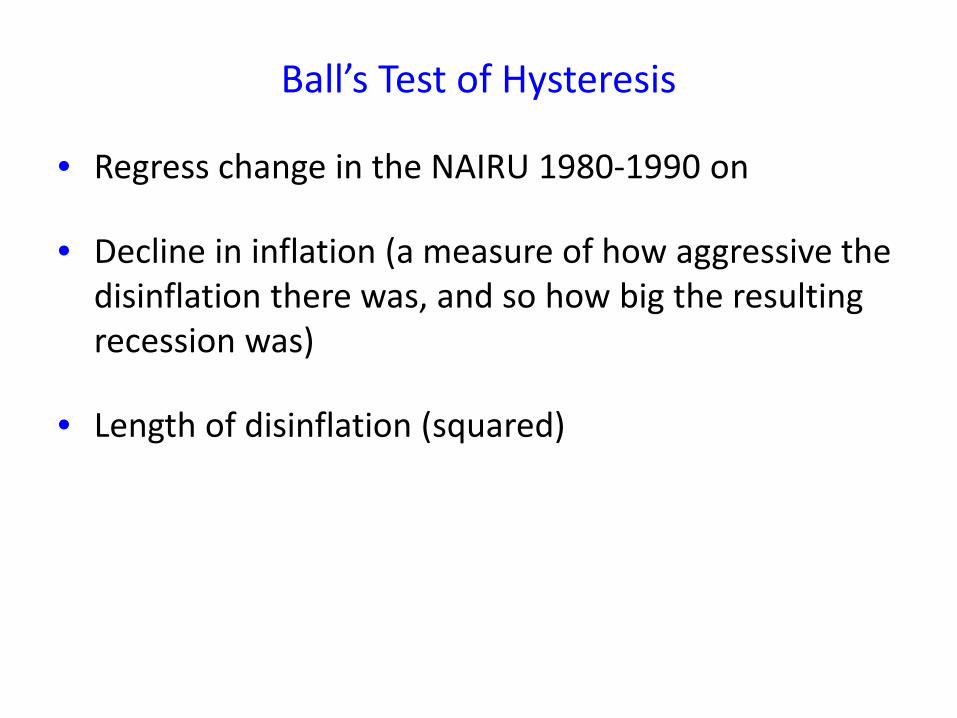
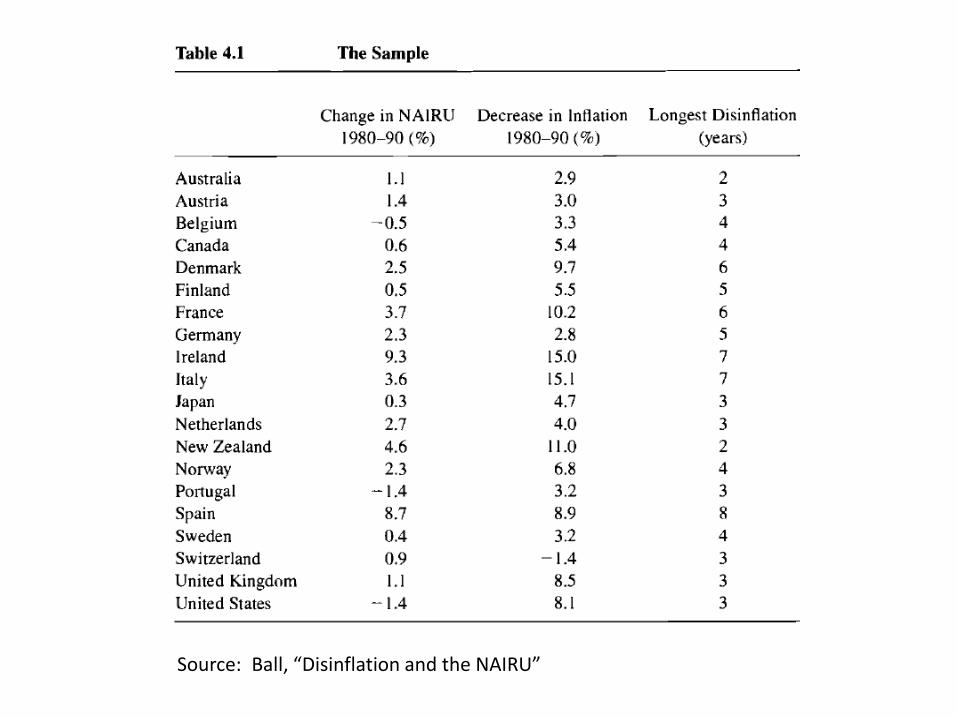
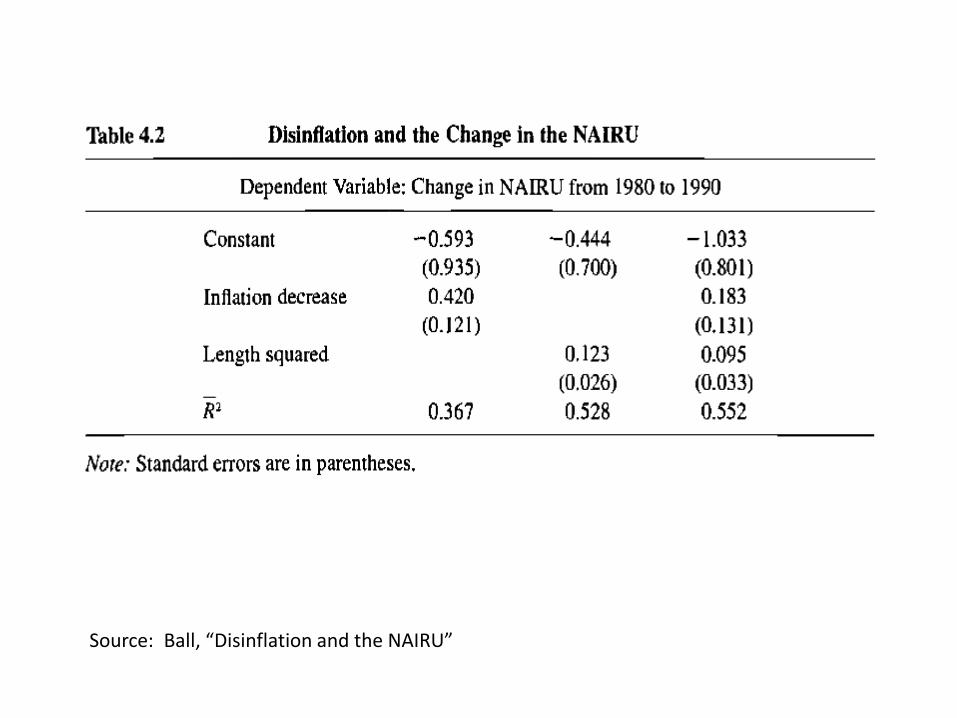
Ball’s Test of Hysteresis
• Regress change in the NAIRU 1980-1990 on
• Decline in inflation (a measure of how aggressive the disinflation there was, and so how big the resulting recession was)
• Length of disinflation (squared)
Source: Ball, “Disinflation and the NAIRU”
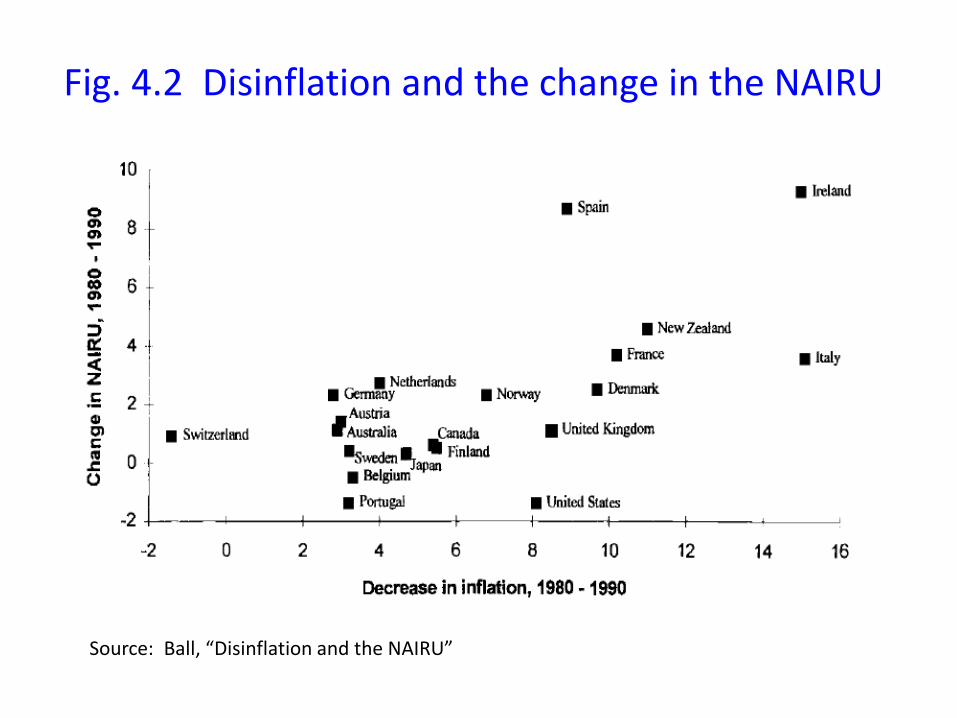
Fig. 4.2 Disinflation and the change in the NAIRU
Source: Ball, “Disinflation and the NAIRU”
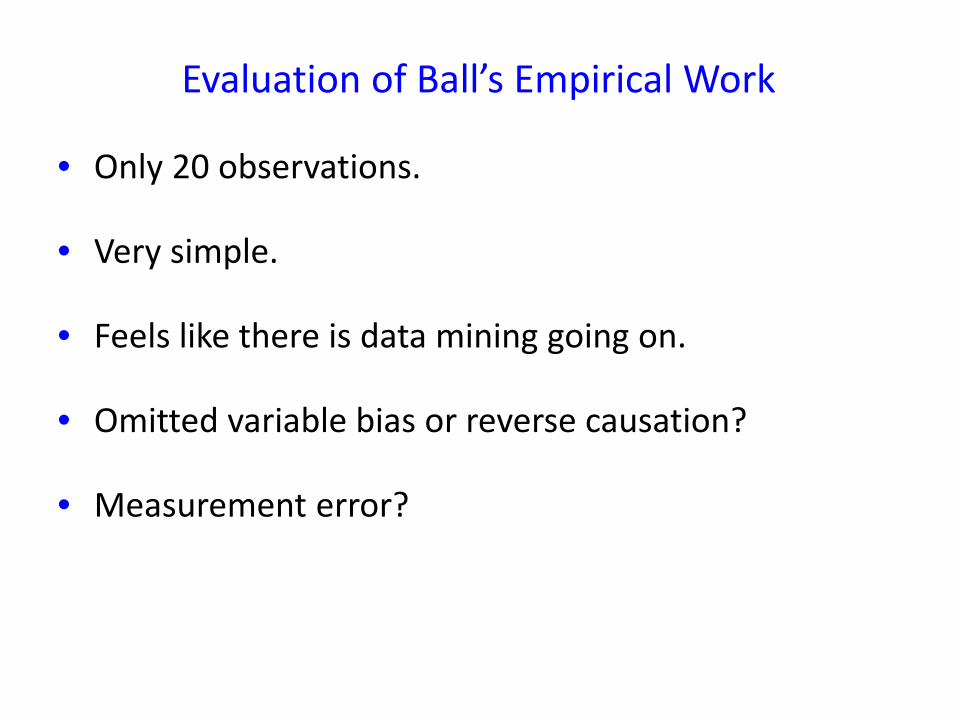
Evaluation of Ball’s Empirical Work
• Only 20 observations.
• Very simple.
• Feels like there is data mining going on.
• Omitted variable bias or reverse causation?
• Measurement error?
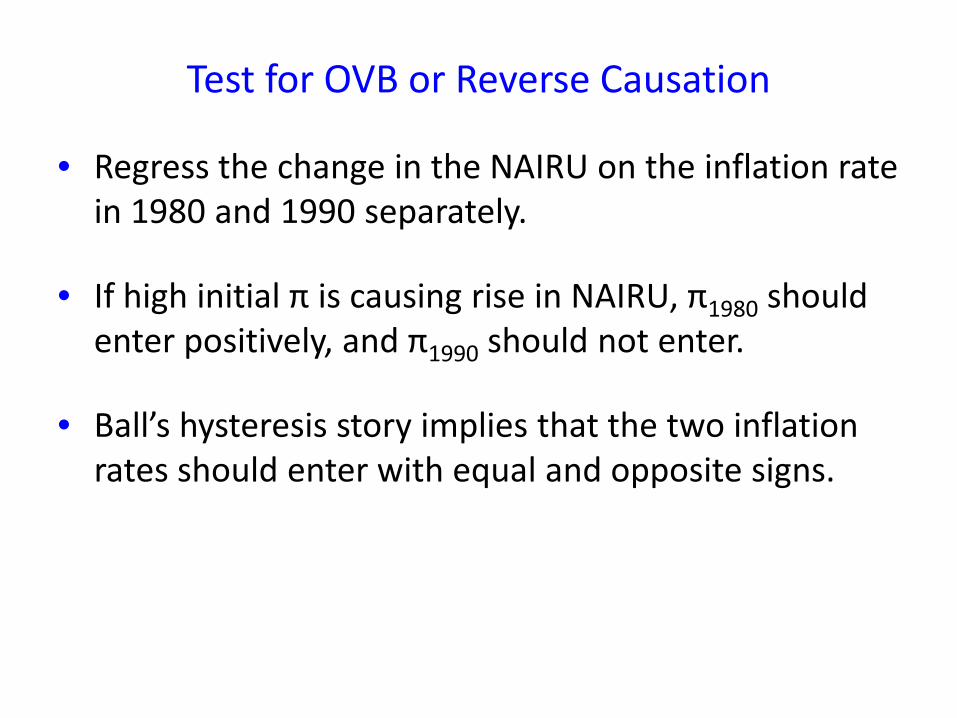
Test for OVB or Reverse Causation
• Regress the change in the NAIRU on the inflation rate in 1980 and 1990 separately.
• If high initial π is causing rise in NAIRU, π1980 should enter positively, and π1990 should not enter.
• Ball’s hysteresis story implies that the two inflation rates should enter with equal and opposite signs.
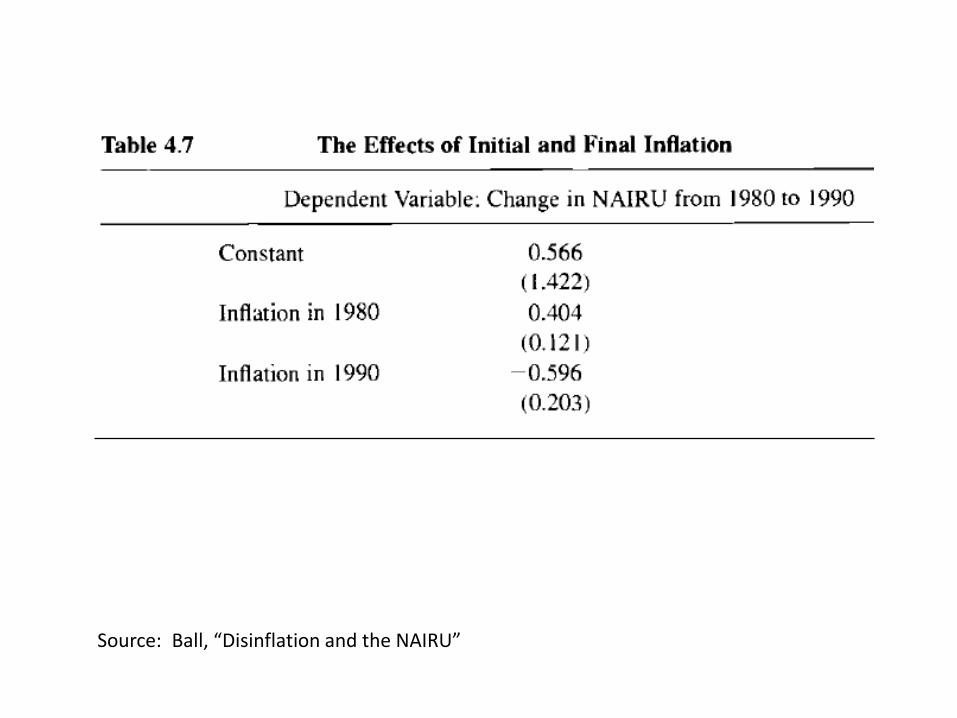
Source: Ball, “Disinflation and the NAIRU”
Dealing with Hysteresis
• Get cyclical unemployment down quickly can prevent a rise in the natural rate.
• A period of particularly low unemployment (an inflationary boom) may have hysteresis effect in the good direction (lowering the NAIRU).
III. POSSIBLE SOURCES OF A RISE IN THE NAIRU IN THE UNITED STATES SINCE 2007
Idea 1: Hysteresis
• The unemployment rate in the U.S. has been very high since early 2009.
• The number of long-term unemployed is exceptionally high.
• So if there were ever going to be hysteresis in the United States, it would be now.
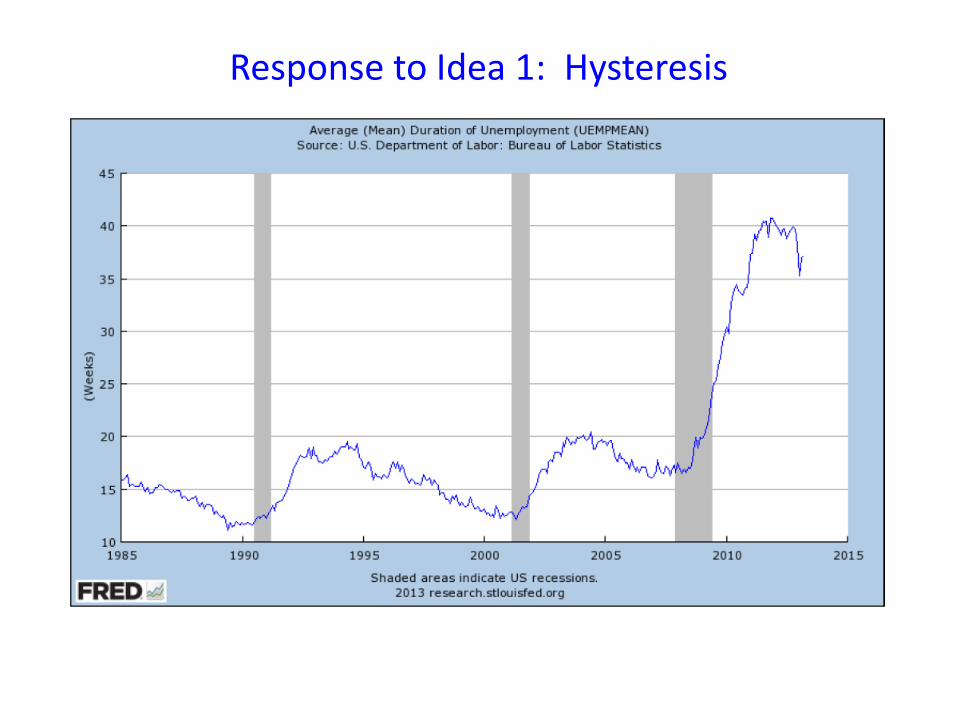
Response to Idea 1: Hysteresis
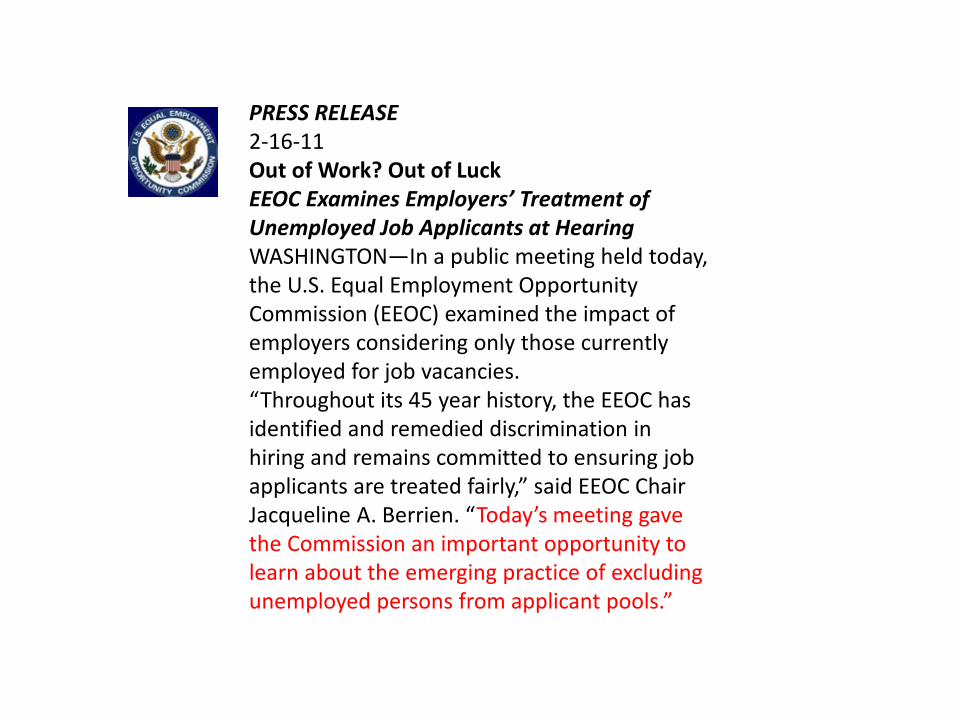
PRESS RELEASE 2-16-11 Out of Work? Out of Luck EEOC Examines Employers’ Treatment of Unemployed Job Applicants at Hearing WASHINGTON—In a public meeting held today, the U.S. Equal Employment Opportunity Commission (EEOC) examined the impact of employers considering only those currently employed for job vacancies. “Throughout its 45 year history, the EEOC has identified and remedied discrimination in hiring and remains committed to ensuring job applicants are treated fairly,” said EEOC Chair Jacqueline A. Berrien. “Today’s meeting gave the Commission an important opportunity to learn about the emerging practice of excluding unemployed persons from applicant pools.”
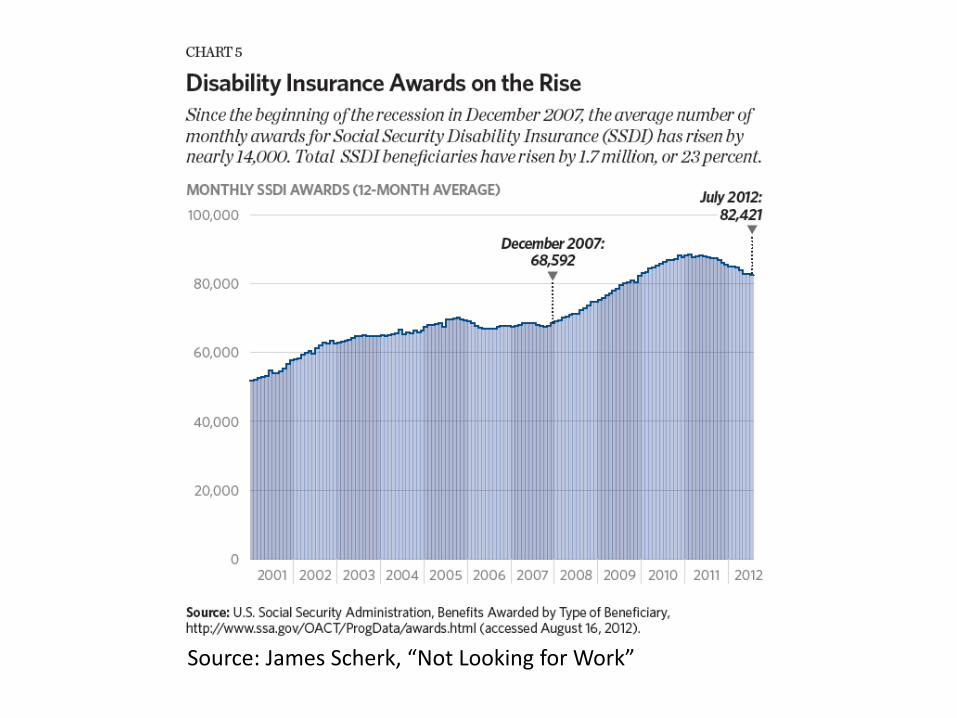
Source: James Scherk, “Not Looking for Work”
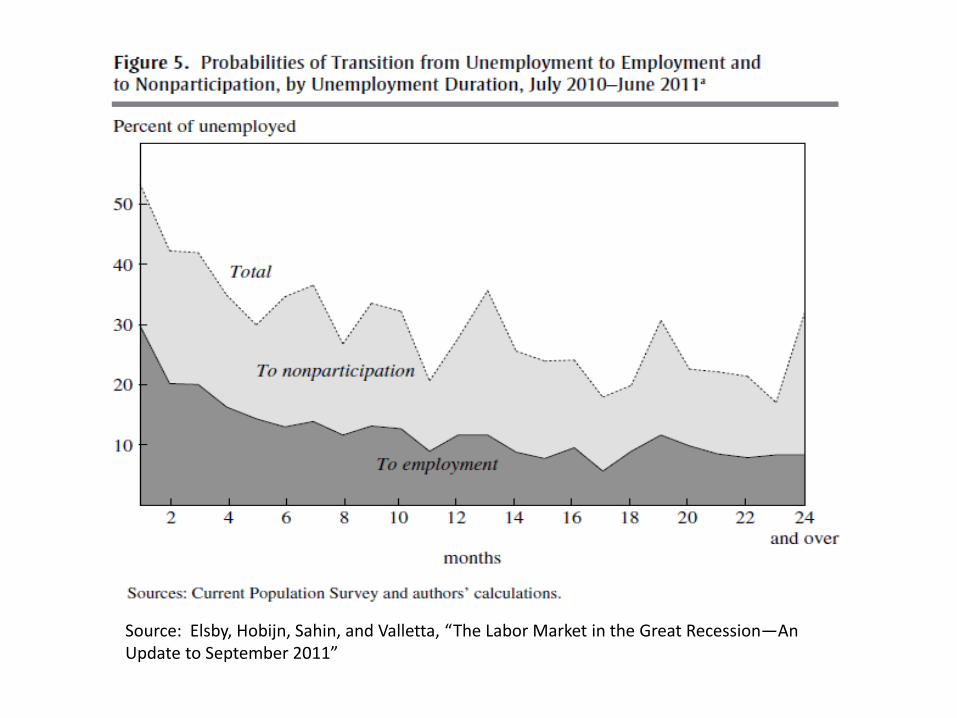
Source: Elsby, Hobijn, Sahin, and Valletta, “The Labor Market in the Great Recession—An Update to September 2011”
Idea 2: Sectoral change has raised normal unemployment
• The collapse of the housing bubble and the financial crisis have permanently shrunk employment in these sectors.
• There is a skills mismatch.
• If some of these workers never find jobs, this will raise normal unemployment.
Response to Idea 2: Sectoral change has raised normal unemployment
• There are about 0.4 million more unemployed construction and finance workers than before the crisis.
• If none of them found jobs (and didn’t drop out of the labor force), this would raise the unemployment rate by about 0.3 p.p. (The labor force is about 150 million.)
• Notice numbers were higher in the Valletta and Kuang paper from earlier in the recession. People in construction and finance have been finding jobs since 2010.
Response to Idea 2: Sectoral change has raised normal unemployment
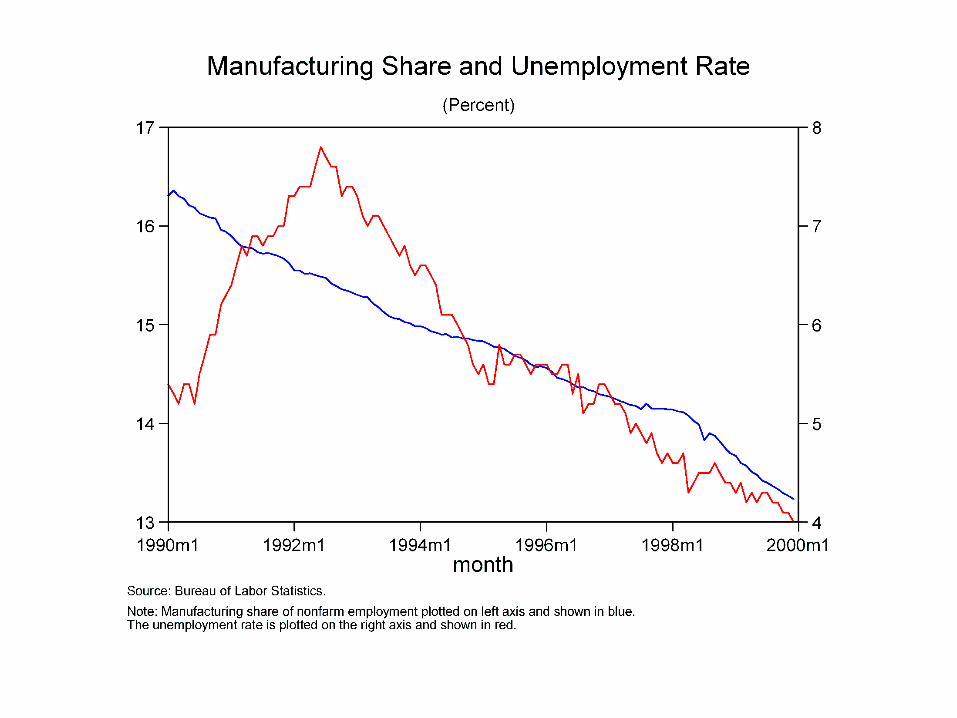
• More fundamentally, economies can normally cope with changes in industrial composition. (For example, manufacturing was declining through the 1990s at the same time that normal unemployment was declining.)
Response to Idea 2: Sectoral change has raised normal unemployment
• More fundamentally, economies can normally cope with changes in industrial composition. (For example, manufacturing was declining through the 1990s at the same time that normal unemployment was declining.
• Rates of leaving unemployment have been low for everyone during the recent recession and slow recovery.
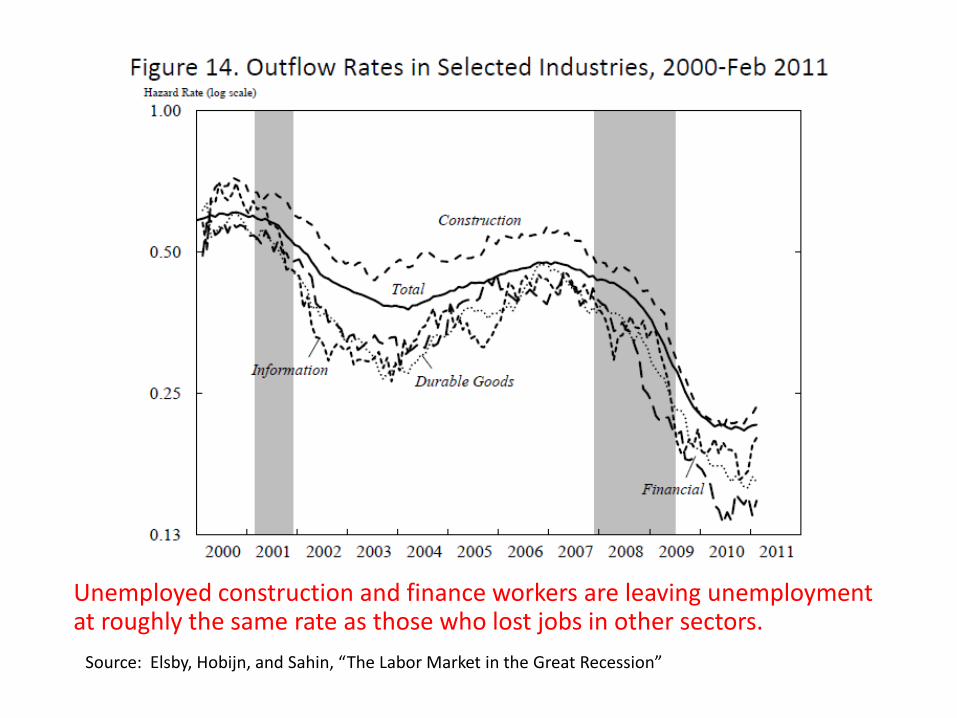
Unemployed construction and finance workers are leaving unemployment at roughly the same rate as those who lost jobs in other sectors.
Source: Elsby, Hobijn, and Sahin, “The Labor Market in the Great Recession”
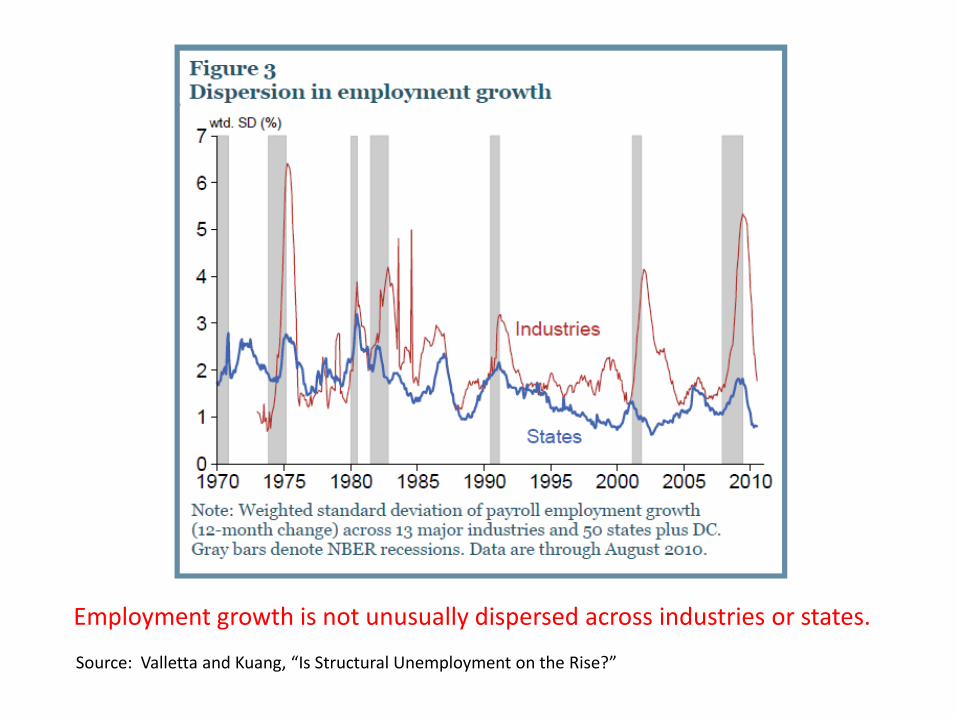
Employment growth is not unusually dispersed across industries or states.
Source: Valletta and Kuang, “Is Structural Unemployment on the Rise?”
Idea 3: House Lock
• 10 million families are underwater on their mortgages (they owe more than the house is worth).
• This makes it hard for them to move to take a job somewhere else.
• Geographic mismatch (workers aren’t where the jobs are) is raising normal unemployment.
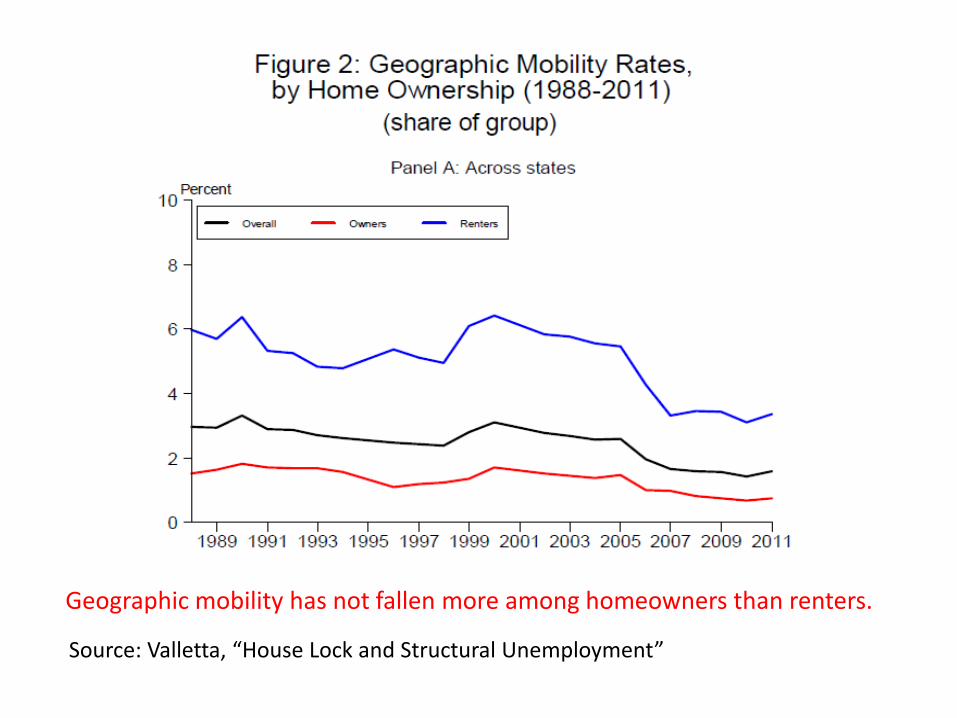
Geographic mobility has not fallen more among homeowners than renters.
Source: Valletta, “House Lock and Structural Unemployment”
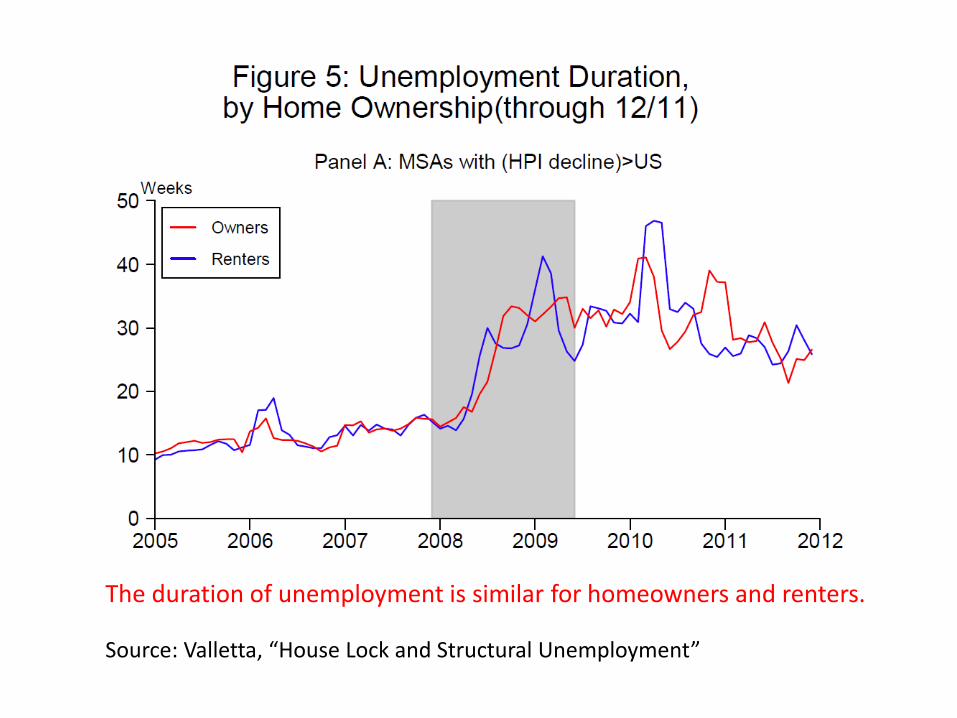
The duration of unemployment is similar for homeowners and renters.
Source: Valletta, “House Lock and Structural Unemployment”
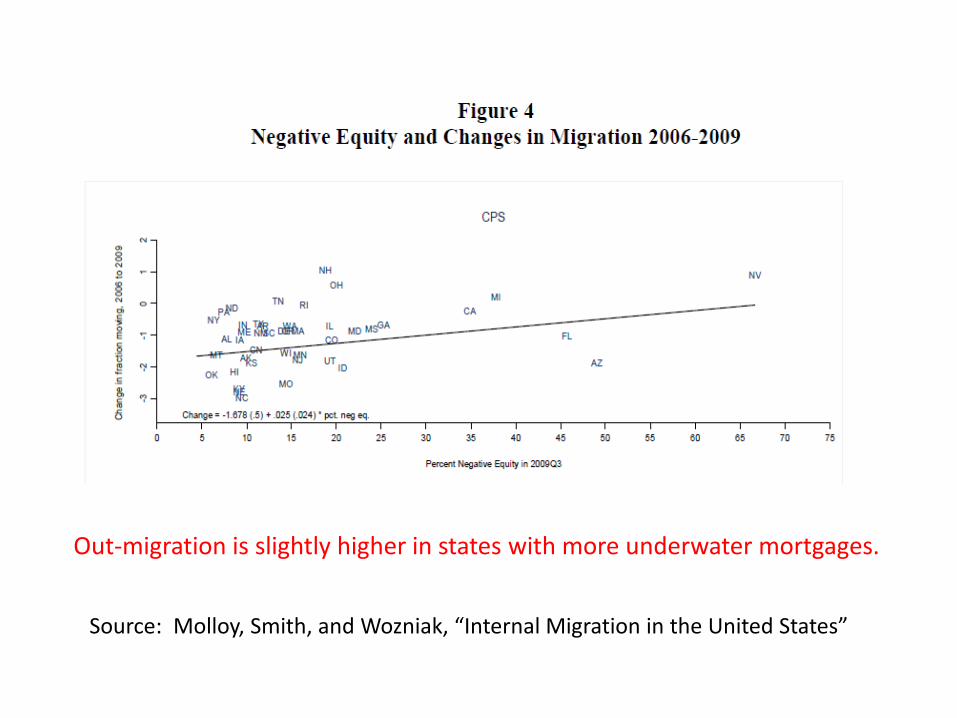
Out-migration is slightly higher in states with more underwater mortgages.
Source: Molloy, Smith, and Wozniak, “Internal Migration in the United States”
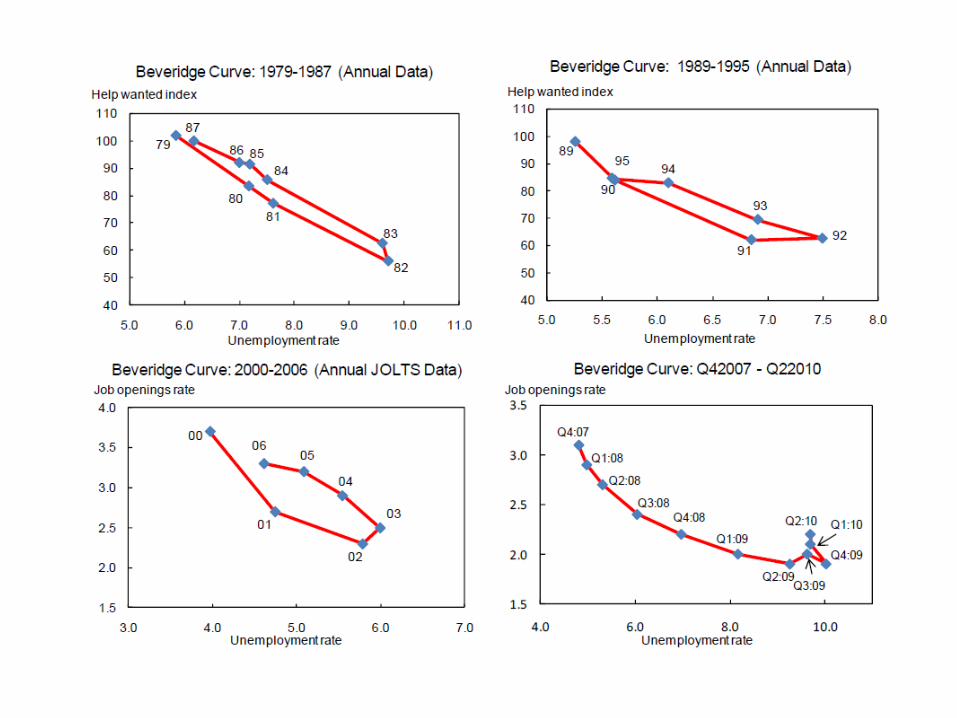
IV. EVIDENCE ON THE NAIRU RECENTLY FROM THE BEVERIDGE CURVE
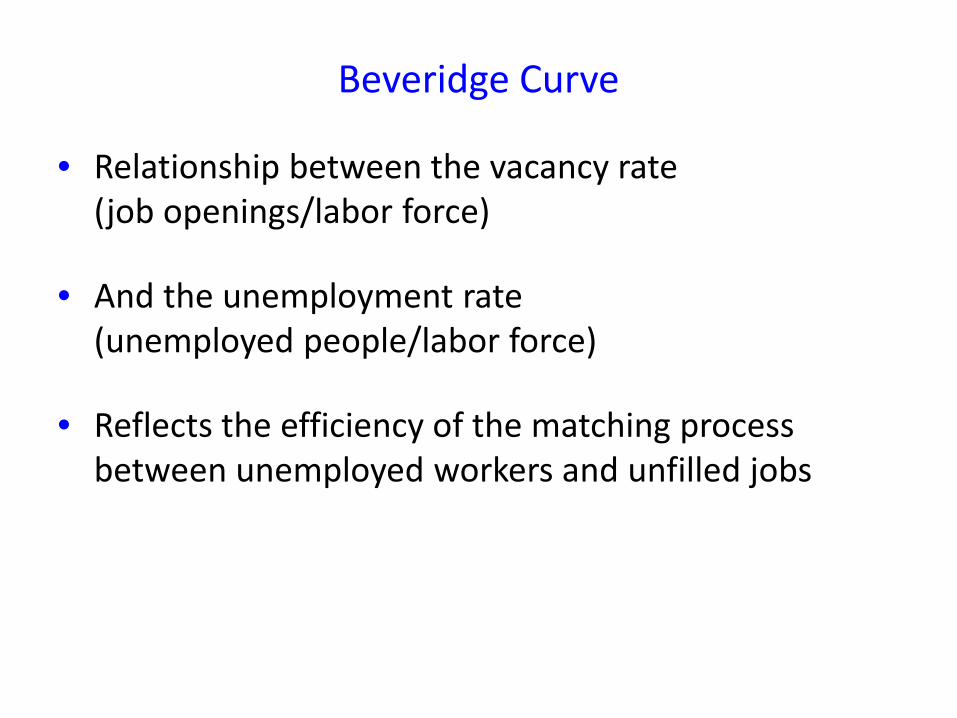
Beveridge Curve
• Relationship between the vacancy rate (job openings/labor force)
• And the unemployment rate (unemployed people/labor force)
• Reflects the efficiency of the matching process between unemployed workers and unfilled jobs
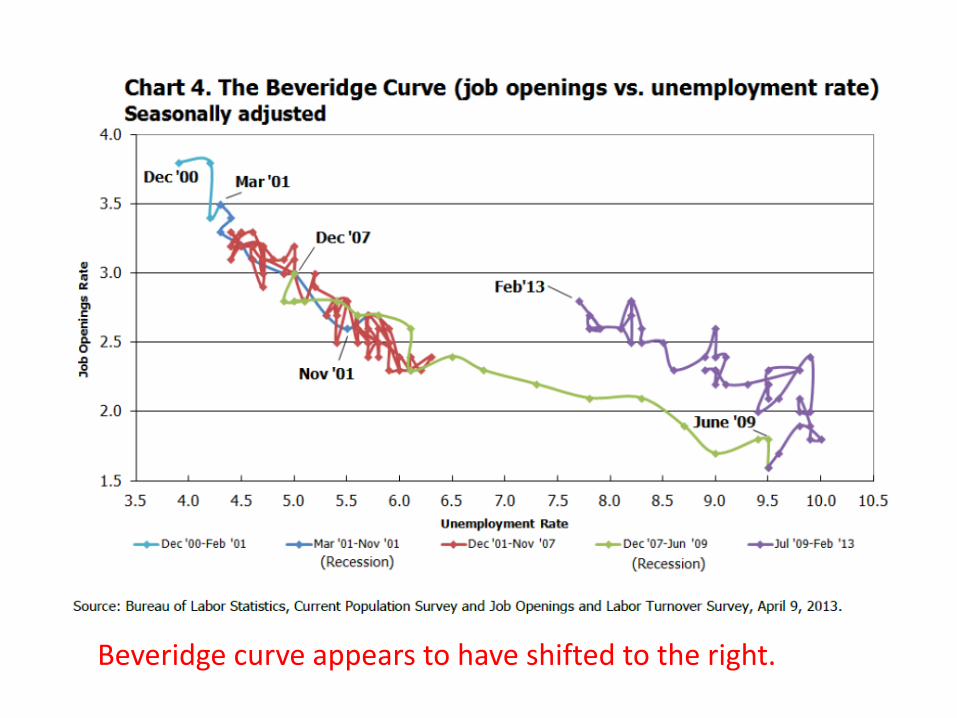
Beveridge curve appears to have shifted to the right.
Does a shift in the Beveridge Curve show that the natural rate has risen?
• It could.
• But, it also could say that the normal vacancy rate has risen.
• Or that both the normal vacancy and normal unemployment rate has risen.
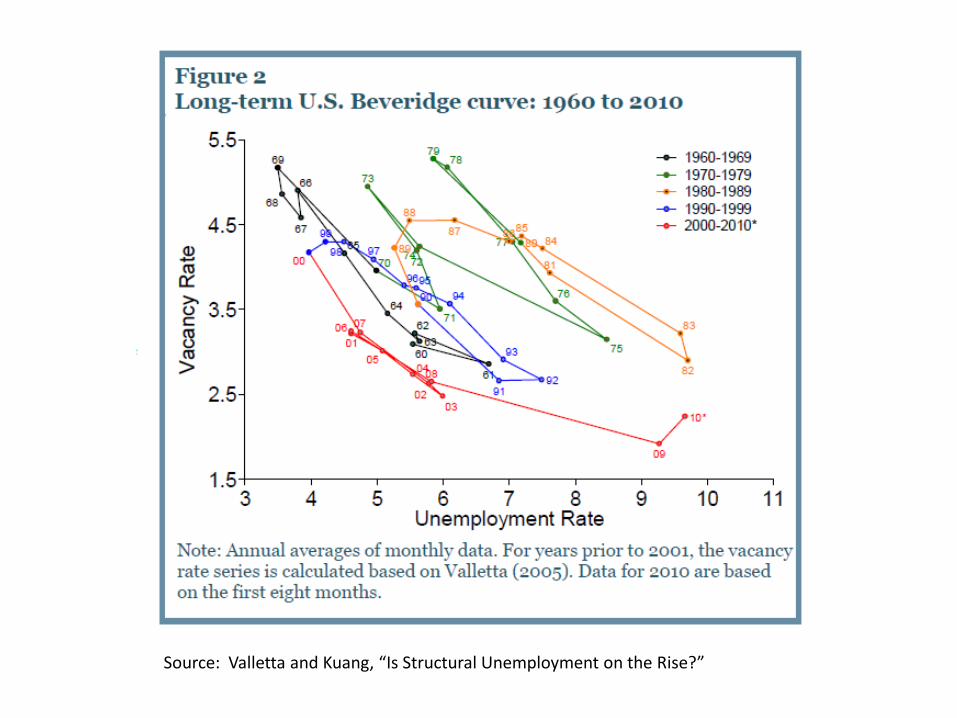
Source: Valletta and Kuang, “Is Structural Unemployment on the Rise?”
Historical Shifts in the Beveridge Curve
• Between the 1960s and 1980s, the unemployment rate associated with a given level of vacancies rose about 4 percentage points.
• Most experts think that the natural rate rose about 2 percentage points over this same period.
• So, a rule of thumb might be that the raise in the natural rate is ½ the shift out in the Beveridge Curve.
• By that calculation, today’s shift in the curve could suggest a rise in U* of about 1.25 percentage points.
Explanations for the Shift in the Beveridge Curve
• Typical pattern early in recoveries
Explanations for the Shift in the Beveridge Curve
• Typical pattern early in recoveries
• Reflects changing composition of firms toward those that tend to post vacancies (bigger firms, non-construction firms)
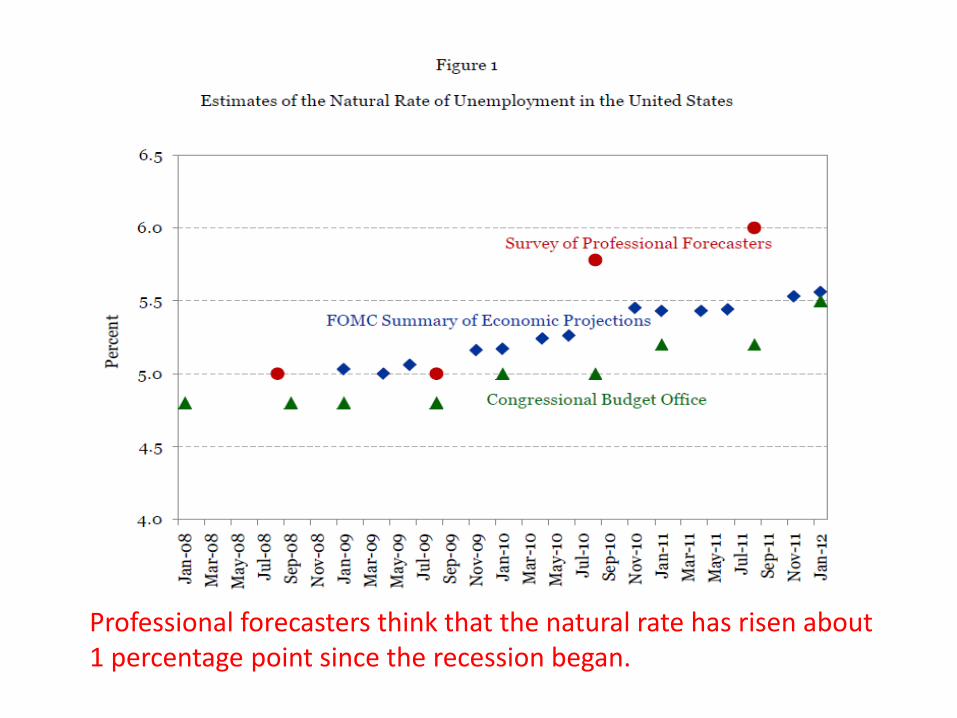
Professional forecasters think that the natural rate has risen about 1 percentage point since the recession began.