Embed Size (px)
Citation preview
by
Roger Pynn
LECTURE 4: Diffraction
This Lecture
2. Diffraction1. Diffraction by a lattice in the kinematic approximation2. Direct lattice and reciprocal lattice3. Effect of lattice vibrations, absorption, and instrument resolution4. Single-crystal compared with powder diffraction5. Use of monochromatic beams and time-of-flight to measure powder
diffraction6. Rietveld refinement of powder patterns7. Examples of science with powder diffraction
• Refinement of structures of new materials• Materials texture• Strain measurements• Protein crystallography• Pair distribution functions (PDF)
From Previous Lecture:
0
)(
,
)()'(
,
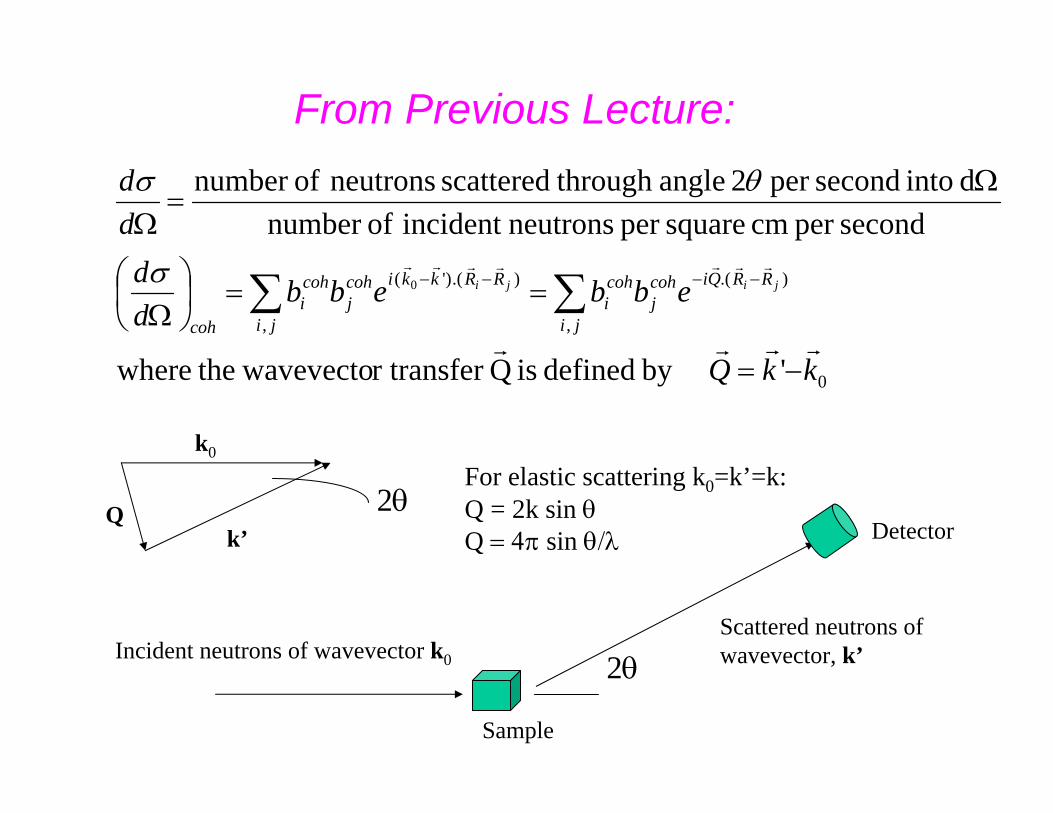
'by defined is Q r transfer wavevecto thewhere
secondper cm squareper neutronsincident ofnumber d into secondper 2 angle through scattered neutrons ofnumber
0
kkQ
ebbebbdd
dd
jiji RR.Qicohj
ji
cohi
RR.kkicohj
ji
cohi
cohrrrr
rrrrrrr
−=
==⎟⎠⎞
⎜⎝⎛
Ω
Ω=
Ω
−−−− ∑∑σ
θσ
Incident neutrons of wavevector k0
Scattered neutrons of wavevector, k’
k0
k’Q
Detector
Sample
2θ
2θFor elastic scattering k0=k’=k:Q = 2k sin θQ = 4π sin θ/λ
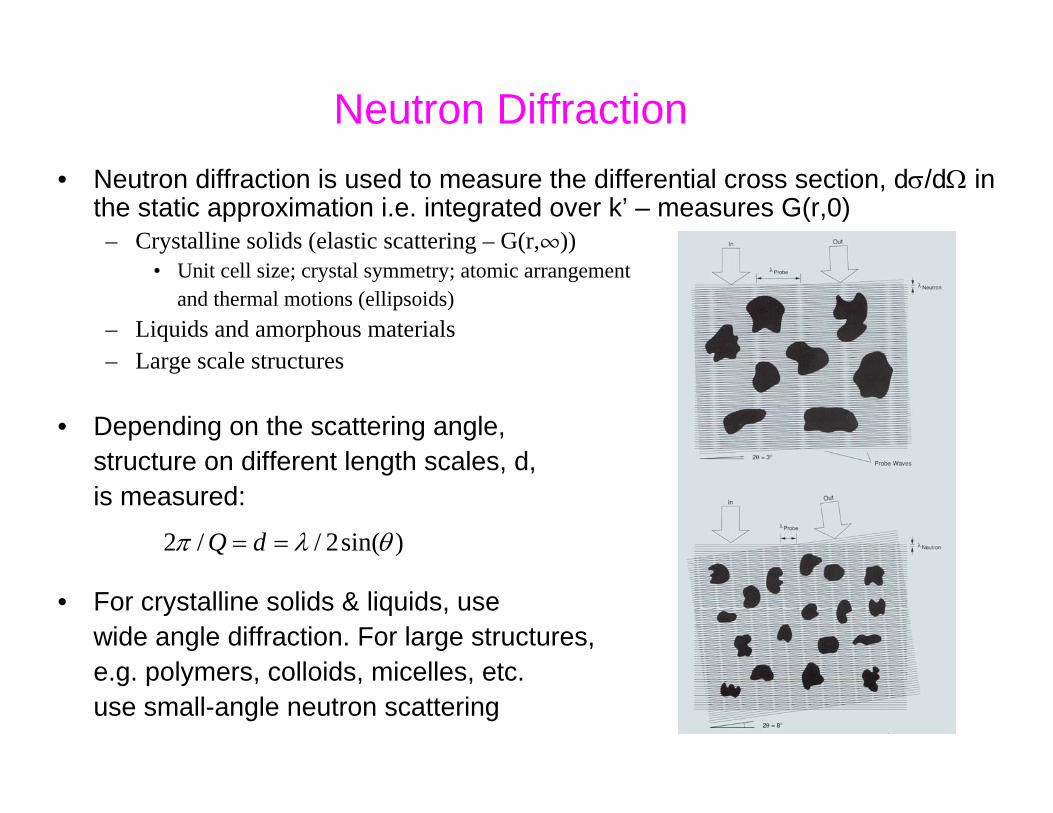
Neutron Diffraction• Neutron diffraction is used to measure the differential cross section, dσ/dΩ in
the static approximation i.e. integrated over k’ – measures G(r,0)– Crystalline solids (elastic scattering – G(r,¶))
• Unit cell size; crystal symmetry; atomic arrangementand thermal motions (ellipsoids)
– Liquids and amorphous materials– Large scale structures
• Depending on the scattering angle,structure on different length scales, d,is measured:
• For crystalline solids & liquids, usewide angle diffraction. For large structures,e.g. polymers, colloids, micelles, etc.use small-angle neutron scattering
)sin(2//2 θλπ == dQ
The Kinematical Approximation
• Note that the approximation we have just seen ignores– Depletion of the incident beam by scattering or absorption– Multiple scattering
i.e. energy is not conserved
• This so-called “kinematic approximation” is OK for weak scattering, very small crystals or “bad” crystals
• It is usually used for interpreting diffraction experiments, though “extinction corrections” are often needed with single crystals– If it’s not adequate, use dynamical theory (see H. Kaiser’s lecture)
• In addition, we have so-far ignored thermal motion of atoms
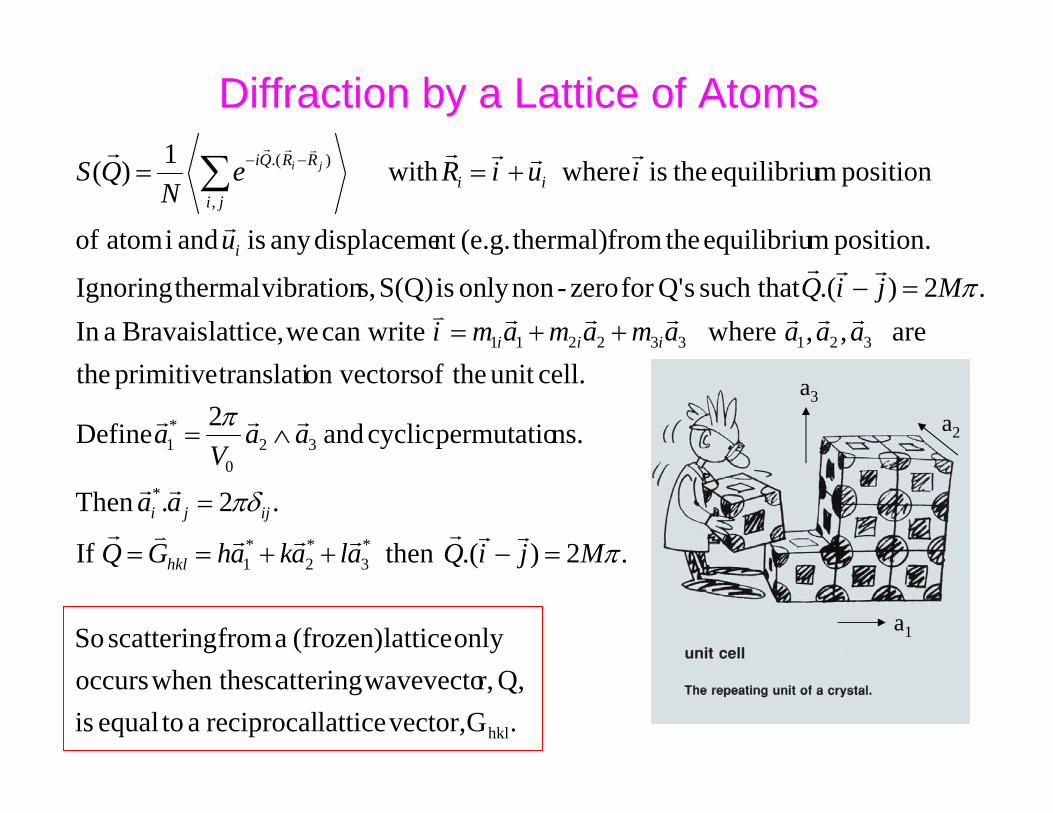
Diffraction by a Lattice of Atoms
.G vector,lattice reciprocal a toequal isQ, r, wavevectoscattering when theoccurs
only lattice (frozen) a from scattering So
.2).( then If
.2.Then
ns.permutatio cyclic and 2 Define
cell.unit theof on vectors translatiprimitive the are ,, where can write welattice, Bravais aIn
.2).(such that sQ'for zero-nononly is S(Q) s, vibration thermalIgnoring
position. mequilibriu thefrom thermal)(e.g.nt displacemeany is and i atom of
position mequilibriu theis where with1)(
hkl
*3
*2
*1
*
320
*1
321332211
,
).(
π
πδ
π
π
MjiQalakahGQ
aa
aaV
a
aaaamamamiMjiQ
u
iuiReN
QS
hkl
ijji
iii
i
iiji
RRQi ji
=−++==
=
∧=
++=
=−
+== ∑ −−
rrrrrrvr
rr
rrr
rrrrrrv
rrr
r
rrrrr vrr
a1
a2
a3
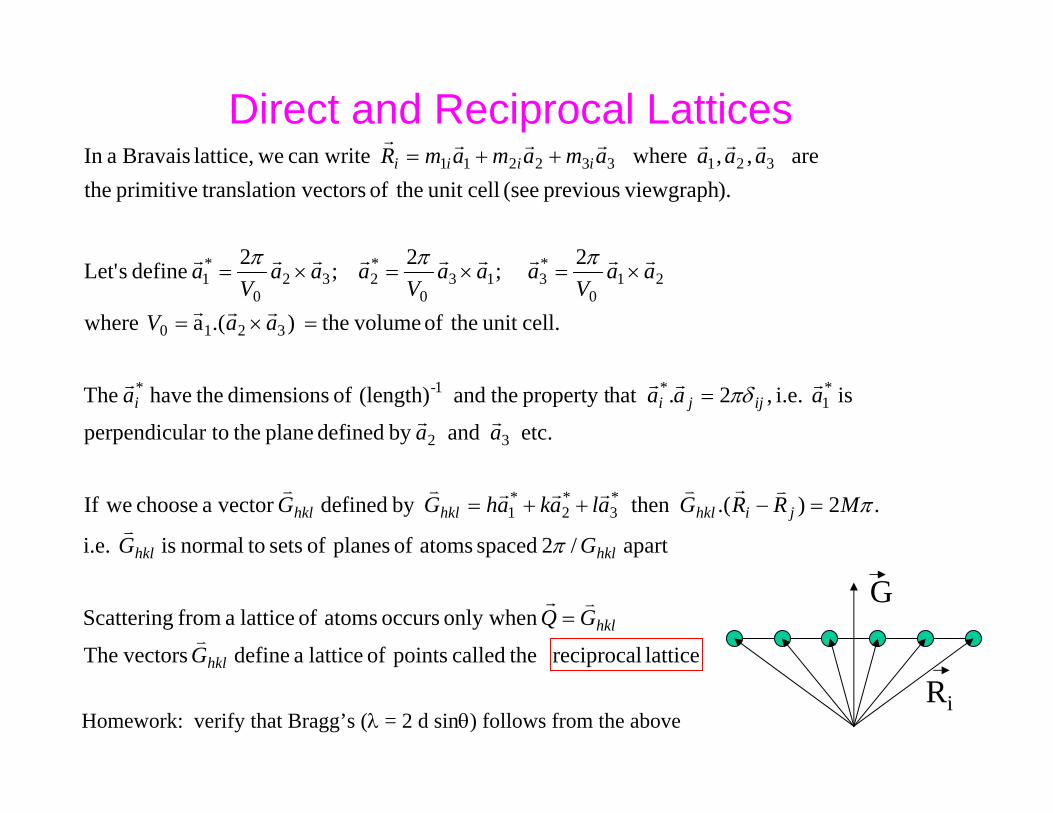
Direct and Reciprocal Lattices
lattice reciprocal thecalled points of lattice a define vectorsThe
only when occurs atoms of lattice a from Scattering
apart /2 spaced atoms of planes of sets tonormal is i.e.
.2).( then by defined vector a choose weIf
etc. and by defined plane thelar toperpendicu
is i.e. ,2.hat property t theand (length) of dimensions thehave The
cell.unit theof volume the ).(a where
2 ;2 ;2 define sLet'
). viewgraphprevious (see cellunit theof on vectors translatiprimitive the are ,, where can write welattice, Bravais aIn
*3
*2
*1
32
*1
*1-*
3210
210
*313
0
*232
0
*1
321332211
hkl
hkl
hklhkl
jihklhklhkl
ijjii
iiii
G
GQ
GG
MRRGalakahGG
aa
aaaa
aaV
aaV
aaaV
aaaV
a
aaaamamamR
v
vr
v
vrvrrrvv
rr
rrrr
rrr
rrrrrrrrr
rrrrrrr
=
=−++=
=
=×=
×=×=×=
++=
π
π
πδ
πππ
Ri
G
Homework: verify that Bragg’s (λ = 2 d sinθ) follows from the above
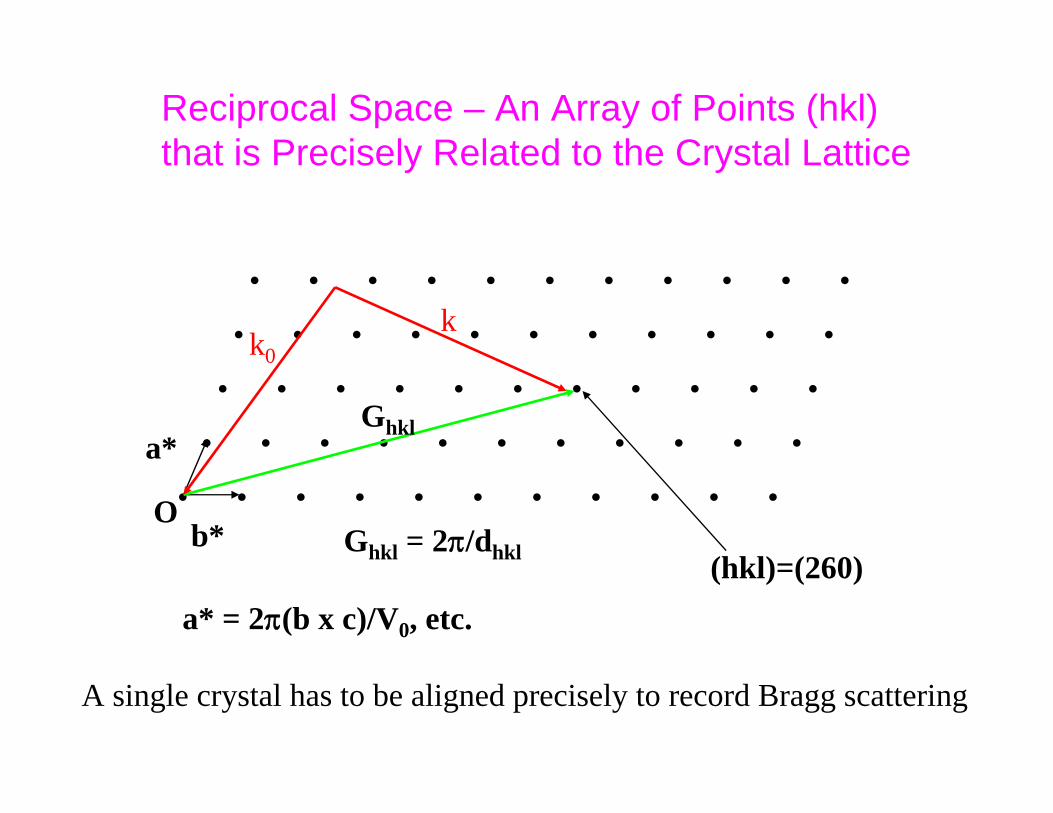
Reciprocal Space – An Array of Points (hkl)that is Precisely Related to the Crystal Lattice
• • • • • • • • • • •
• • • • • • • • • • •
• • • • • • • • • • •
• • • • • • • • • • •
• • • • • • • • • • •
a*
b*(hkl)=(260)
Ghkl
a* = 2π(b x c)/V0, etc.
OGhkl = 2π/dhkl
k0k
A single crystal has to be aligned precisely to record Bragg scattering
Notation
• Ghkl is called a reciprocal lattice vector (node denoted hkl)
• h, k and l are called Miller indices
• (hkl) describes a set of planes perpendicular to Ghkl, separated by 2π/Ghkl
• {hkl} represents a set of symmetry-related lattice planes
• [hkl] describes a crystallographic direction
• <hkl> describes a set of symmetry equivalent crystallographic directions
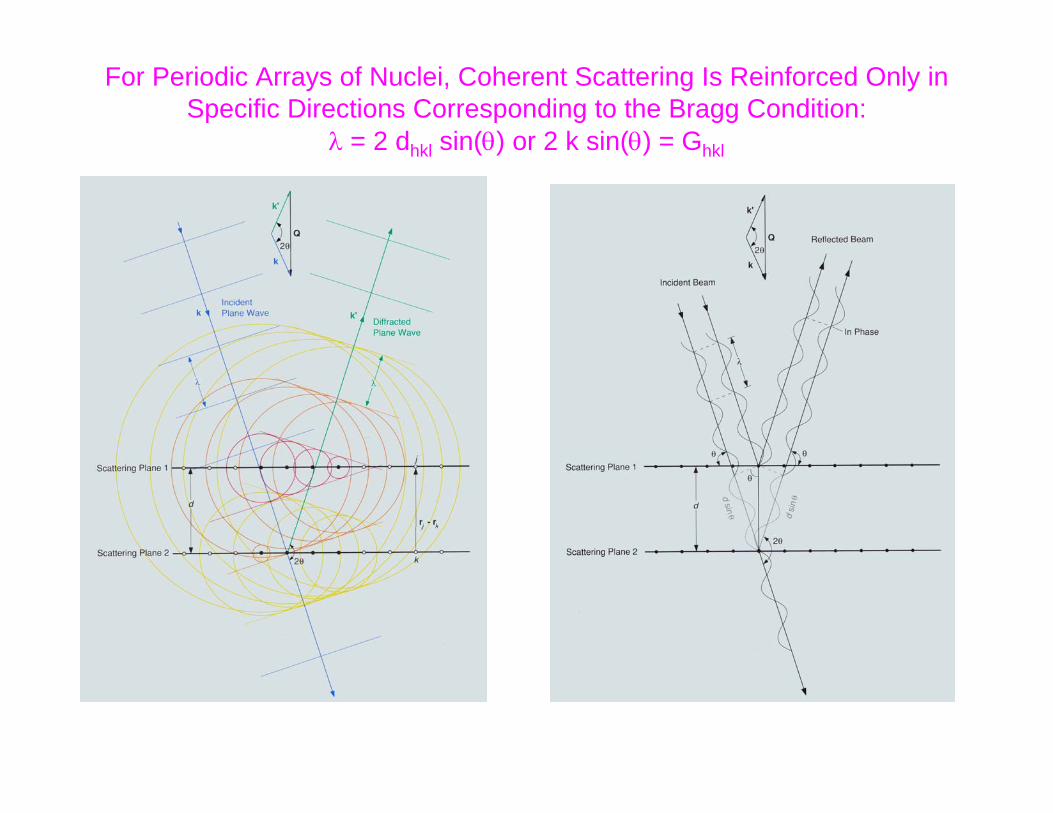
For Periodic Arrays of Nuclei, Coherent Scattering Is Reinforced Only in Specific Directions Corresponding to the Bragg Condition:
λ = 2 dhkl sin(θ) or 2 k sin(θ) = Ghkl

Atomic Vibrations
• The formalism on the previous slide works fine if the atoms are stationary: in reality, they are not
• Remember, from the last lecture that
• We average over the (fluctuating) atomic positions by introducing a probability that an atom will be at given position. Instead of the Fourier Transform of δ functions, this gives the FT of the δ functions convolvedwith a spread function. The result is that S(Q) is multiplied by the FT of the spread function i.e. by if we use a Gaussian spread function
• Atomic vibrations cause a decrease in the intensity of Bragg scattering. The “missing” scattering appears between Bragg peaks and results in inelastic scattering
ensemble,
).(1)( ∑ −−=ji
RRQi jieN
QSrrrr
3/exp 22 uQ−
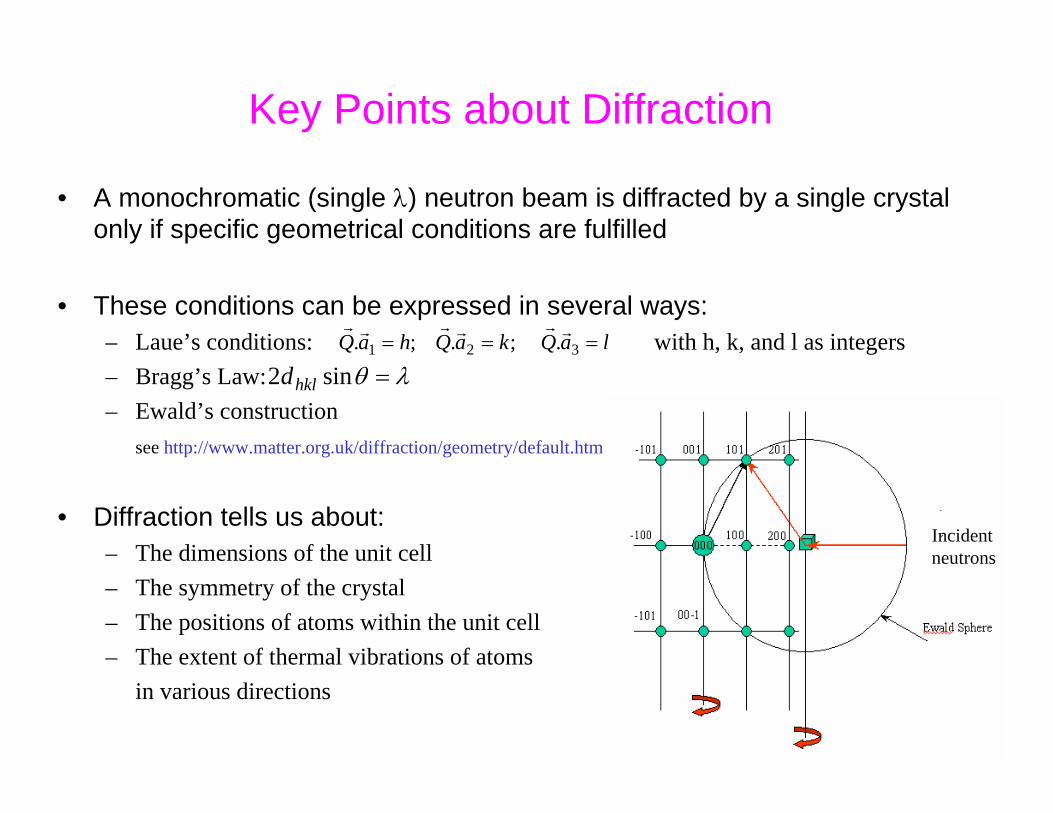
• A monochromatic (single λ) neutron beam is diffracted by a single crystal only if specific geometrical conditions are fulfilled
• These conditions can be expressed in several ways:– Laue’s conditions: with h, k, and l as integers – Bragg’s Law: – Ewald’s construction
see http://www.matter.org.uk/diffraction/geometry/default.htm
• Diffraction tells us about:– The dimensions of the unit cell– The symmetry of the crystal– The positions of atoms within the unit cell– The extent of thermal vibrations of atoms
in various directions
. ;. ;. 321 laQkaQhaQ ===rrrrrr
λθ =sin2 hkld
Incidentneutrons
Key Points about Diffraction
Bragg Scattering from Crystals
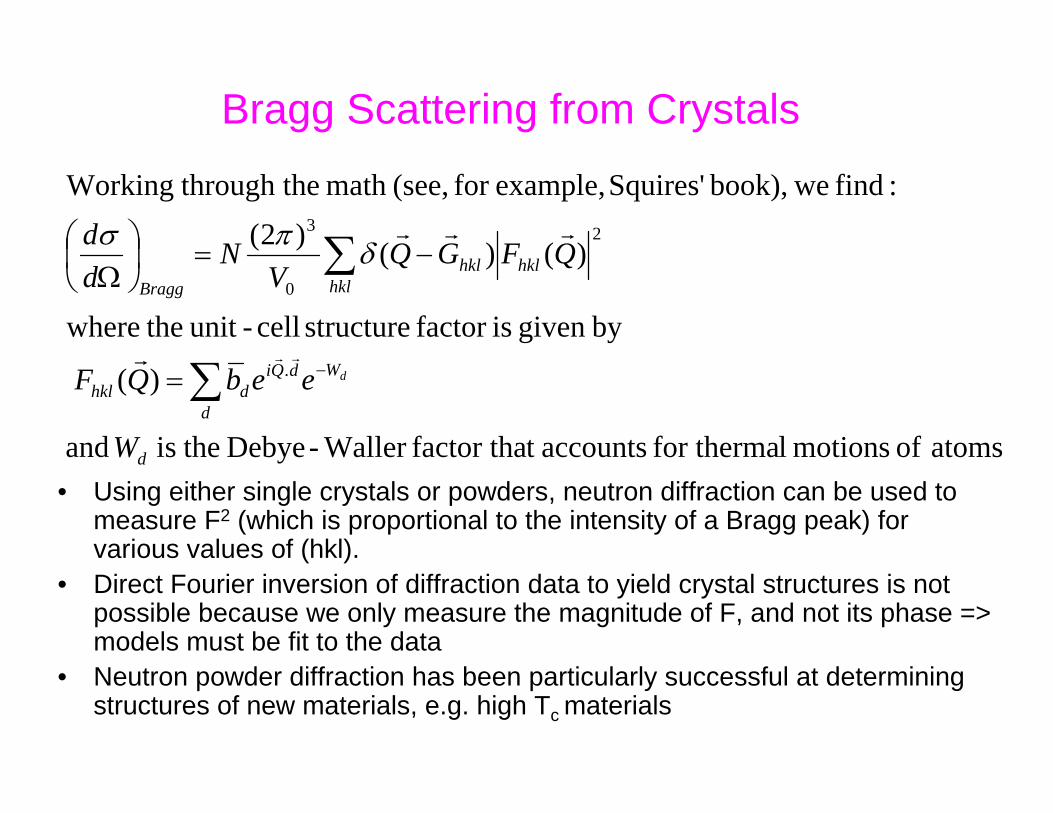
• Using either single crystals or powders, neutron diffraction can be used to measure F2 (which is proportional to the intensity of a Bragg peak) for various values of (hkl).
• Direct Fourier inversion of diffraction data to yield crystal structures is not possible because we only measure the magnitude of F, and not its phase => models must be fit to the data
• Neutron powder diffraction has been particularly successful at determining structures of new materials, e.g. high Tc materials
atoms of motions lfor therma accountst factor thaWaller -Debye theis and
)(
bygiven isfactor structure cell-unit thewhere
)()()2(:find webook), Squires' example,for (see,math he through tWorking
.
2
0
3
d
WdQi
ddhkl
hklhklhkl
Bragg
W
eebQF
QFGQV
Ndd
d−∑
∑
=
−=⎟⎠⎞
⎜⎝⎛
Ω
rrr
rrrδπσ
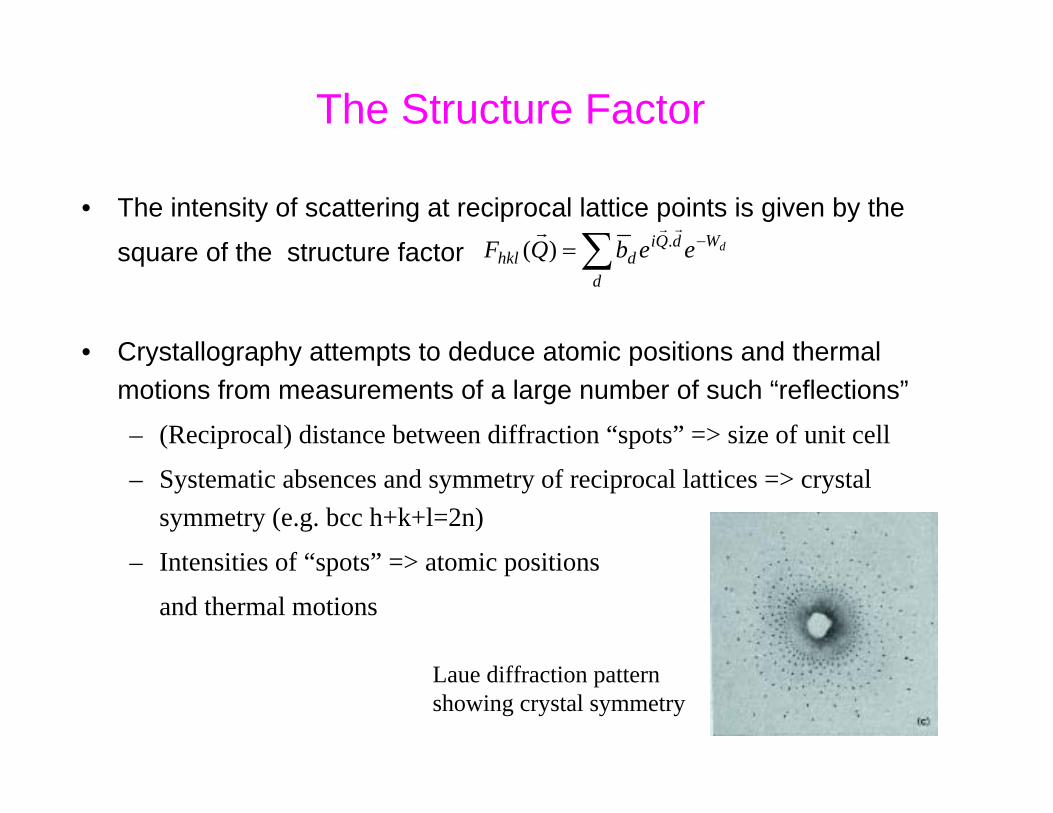
The Structure Factor
• The intensity of scattering at reciprocal lattice points is given by the
square of the structure factor
• Crystallography attempts to deduce atomic positions and thermal motions from measurements of a large number of such “reflections”
– (Reciprocal) distance between diffraction “spots” => size of unit cell
– Systematic absences and symmetry of reciprocal lattices => crystal symmetry (e.g. bcc h+k+l=2n)
– Intensities of “spots” => atomic positions
and thermal motions
dWdQi
ddhkl eebQF −∑=
rrr .)(
Laue diffraction patternshowing crystal symmetry
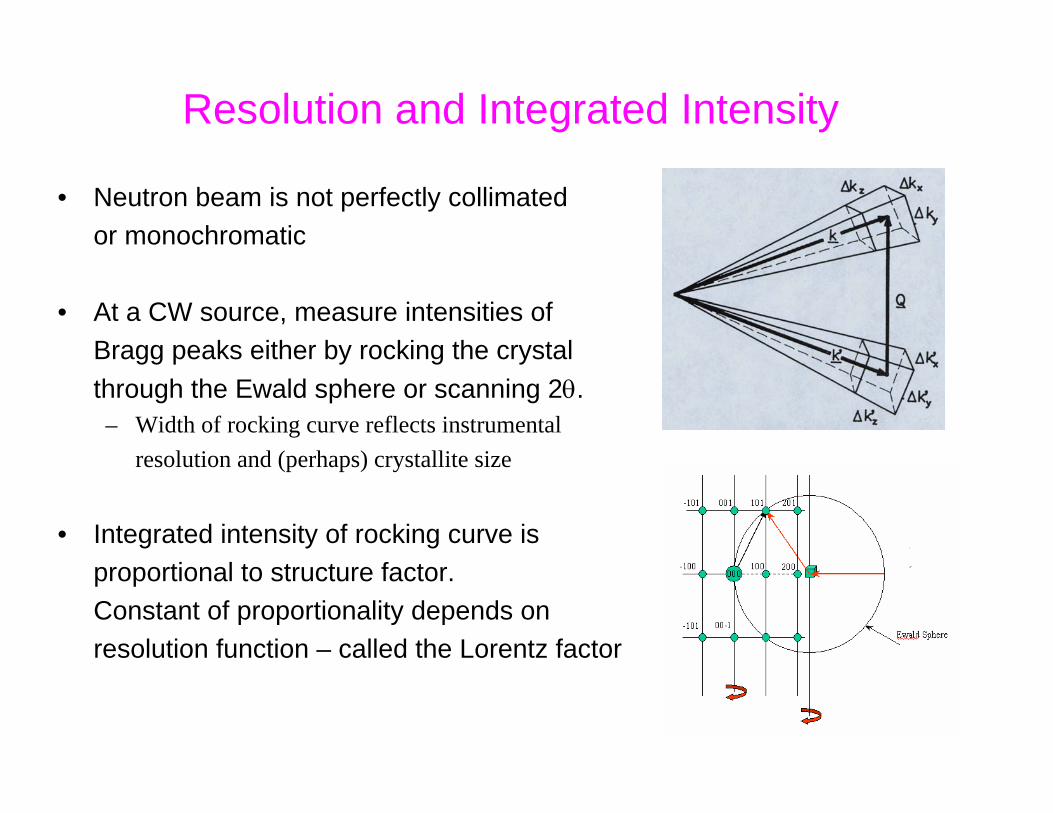
Resolution and Integrated Intensity
• Neutron beam is not perfectly collimated or monochromatic
• At a CW source, measure intensities of Bragg peaks either by rocking the crystal through the Ewald sphere or scanning 2θ.– Width of rocking curve reflects instrumental
resolution and (perhaps) crystallite size
• Integrated intensity of rocking curve is proportional to structure factor. Constant of proportionality depends on resolution function – called the Lorentz factor

Useful Web Sites
• The following sites provide tutorials on diffraction. It is a good idea to go through them and try the examples.
• http://www.matter.org.uk/diffraction/introduction/default.htm
• http://www.uni-wuerzburg.de/mineralogie/crystal/teaching/teaching.html
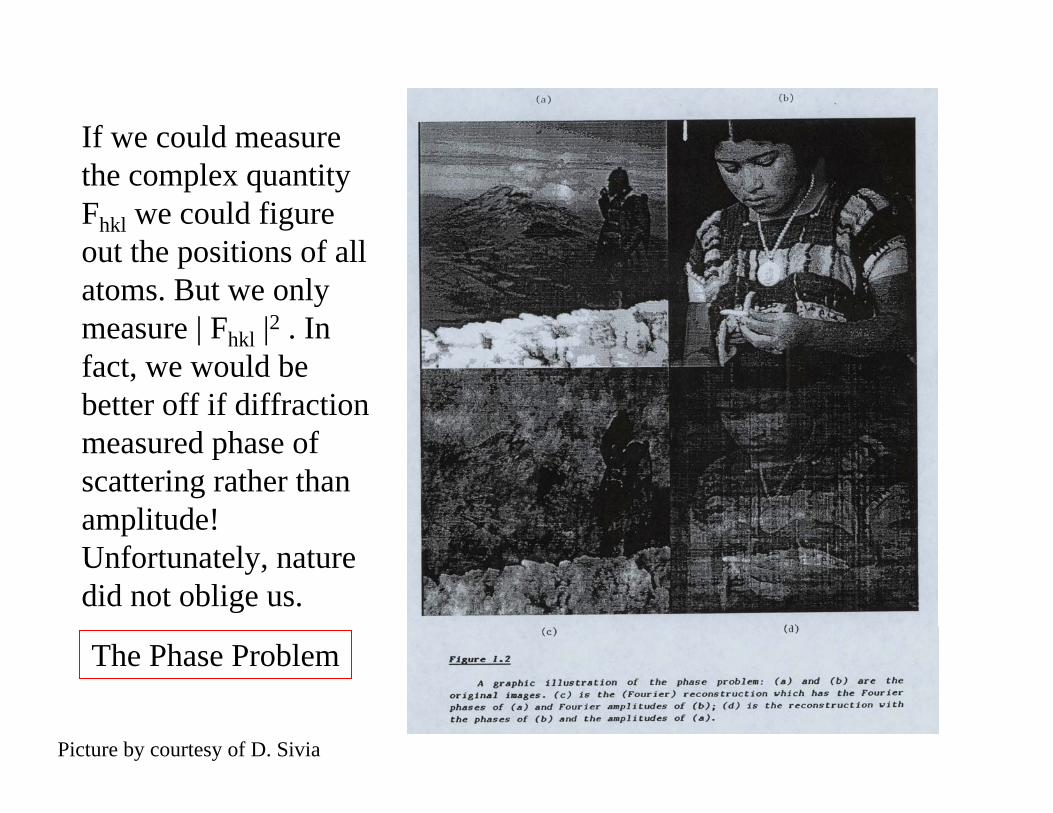
If we could measure the complex quantity Fhkl we could figure out the positions of all atoms. But we only measure | Fhkl |2 . In fact, we would be better off if diffraction measured phase of scattering rather than amplitude!Unfortunately, nature did not oblige us.
Picture by courtesy of D. Sivia
The Phase Problem
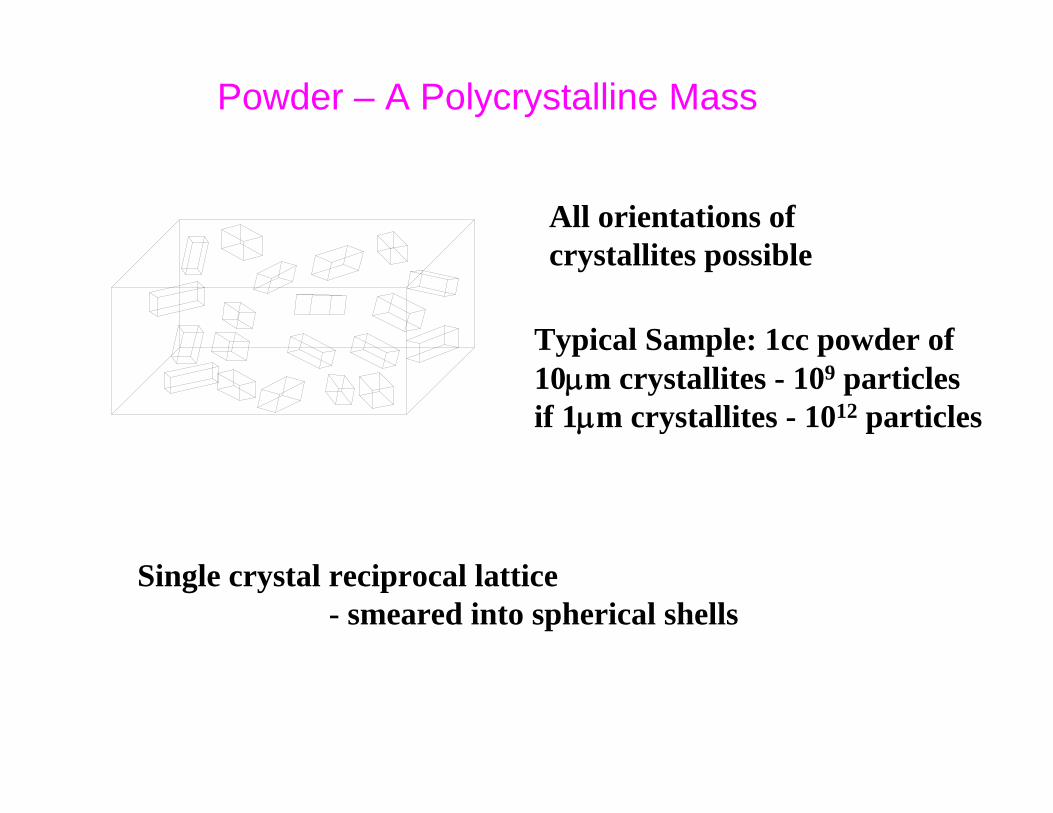
Powder – A Polycrystalline Mass
All orientations of crystallites possible
Typical Sample: 1cc powder of 10μm crystallites - 109 particlesif 1μm crystallites - 1012 particles
Single crystal reciprocal lattice - smeared into spherical shells
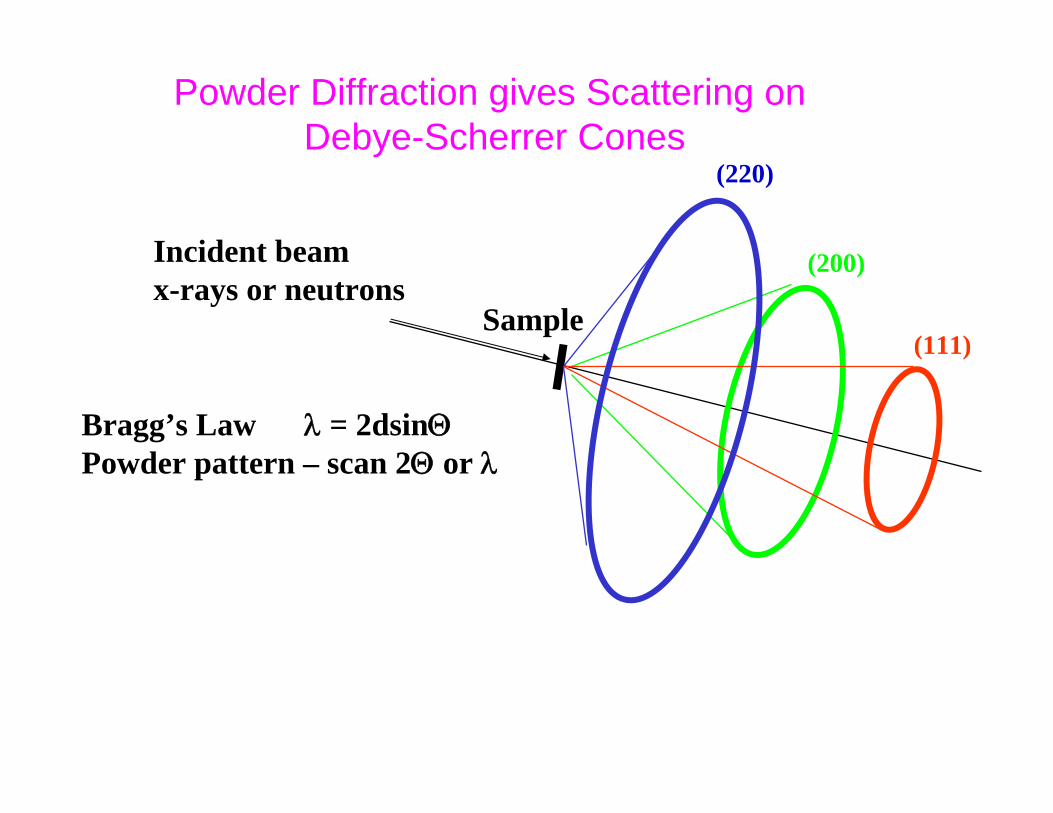
Incident beamx-rays or neutrons
Sample(111)
(200)
(220)
Powder Diffraction gives Scattering on Debye-Scherrer Cones
Bragg’s Law λ = 2dsinΘPowder pattern – scan 2Θ or λ
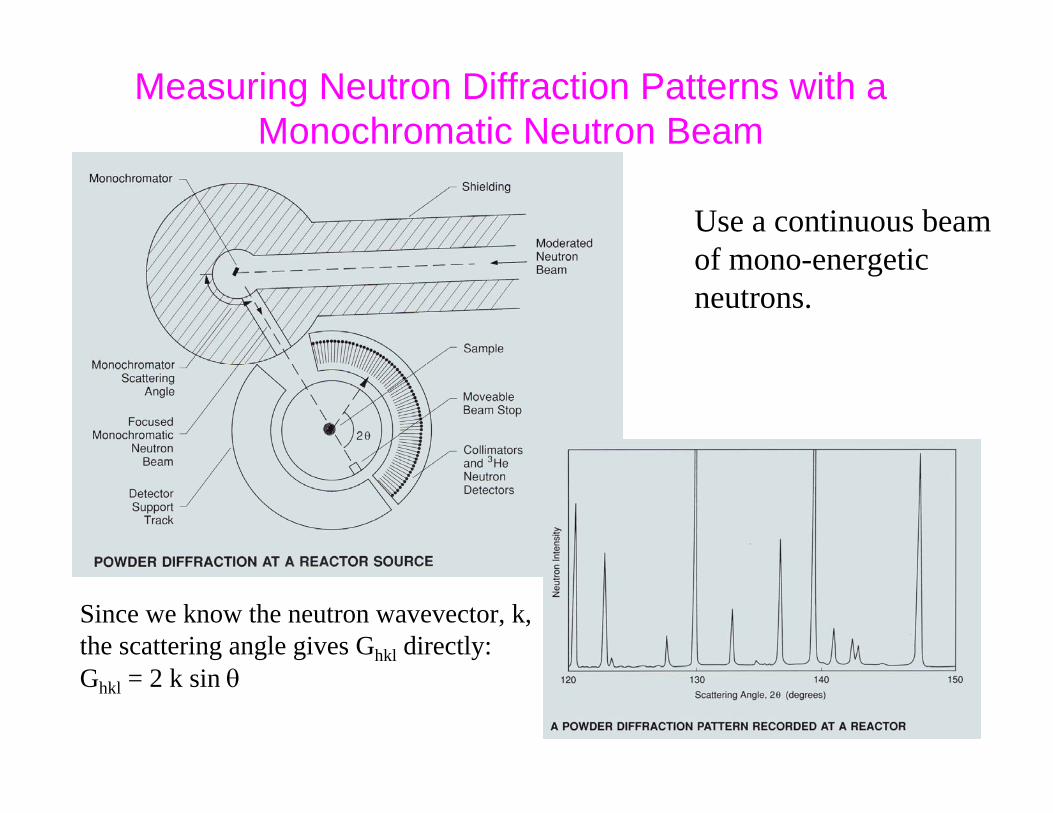
Measuring Neutron Diffraction Patterns with a Monochromatic Neutron Beam
Since we know the neutron wavevector, k,the scattering angle gives Ghkl directly:Ghkl = 2 k sin θ
Use a continuous beamof mono-energeticneutrons.
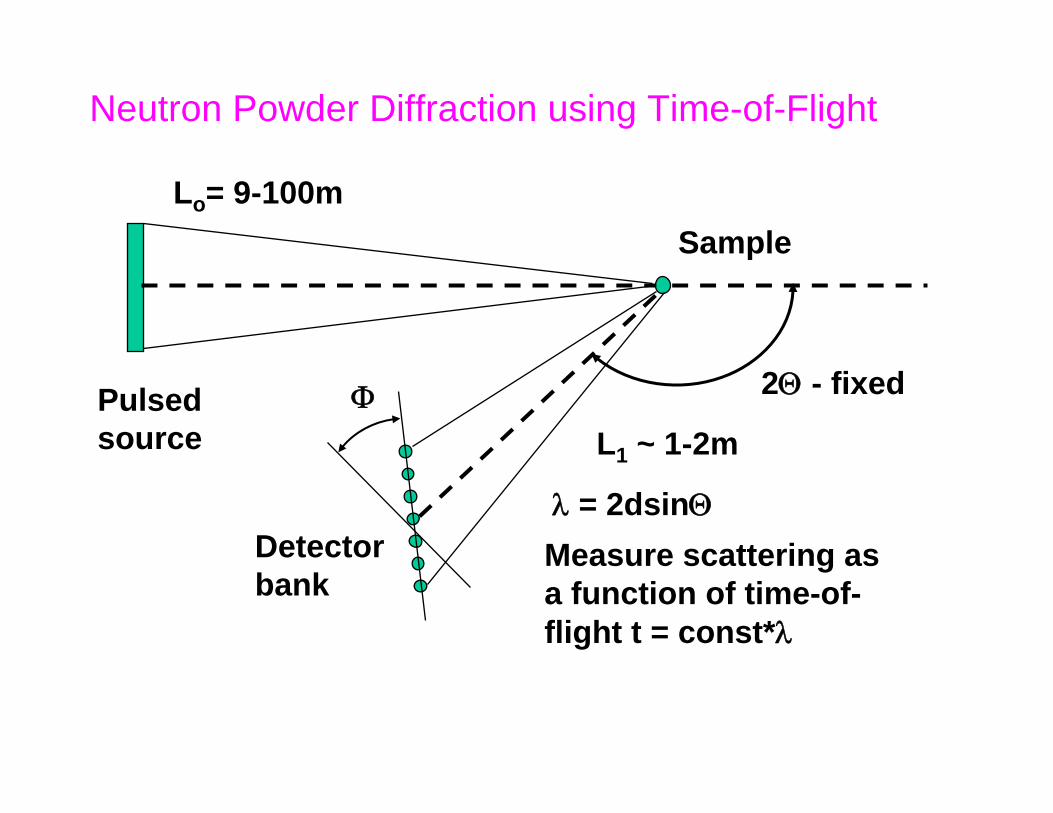
Neutron Powder Diffraction using Time-of-Flight
Sample
Detectorbank
Pulsedsource
Lo= 9-100m
L1 ~ 1-2m
2Θ - fixed
λ = 2dsinΘ
Measure scattering as a function of time-of-flight t = const*λ
Φ
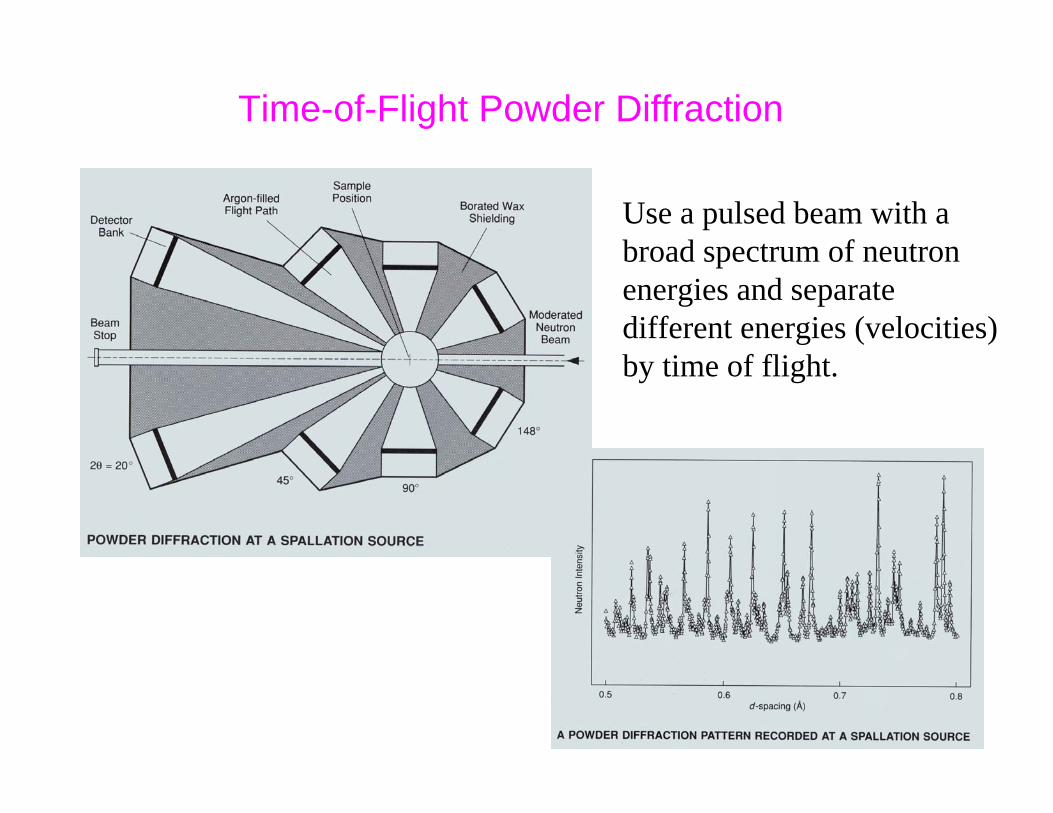
Time-of-Flight Powder Diffraction
Use a pulsed beam with abroad spectrum of neutronenergies and separate different energies (velocities)by time of flight.
10.0 0.05 155.9 CPD RRRR PbSO4 1.909A neutron data 8.8 Scan no. = 1 Lambda = 1.9090 Observed Profile
D-spacing, A
Coun
ts
1.0 2.0 3.0 4.0
X10E
3
.5
1.0
1.
5
2.0
2.
5
10.000 0.025 159.00 CPD RRRR PbSO4 Cu Ka X-ray data 22.9. Scan no. = 1 Lambda1,lambda2 = 1.540 Observed Profile
D-spacing, A
Coun
ts
1.0 2.0 3.0 4.0
X10E
4
.0
.5
1.0
1.
5
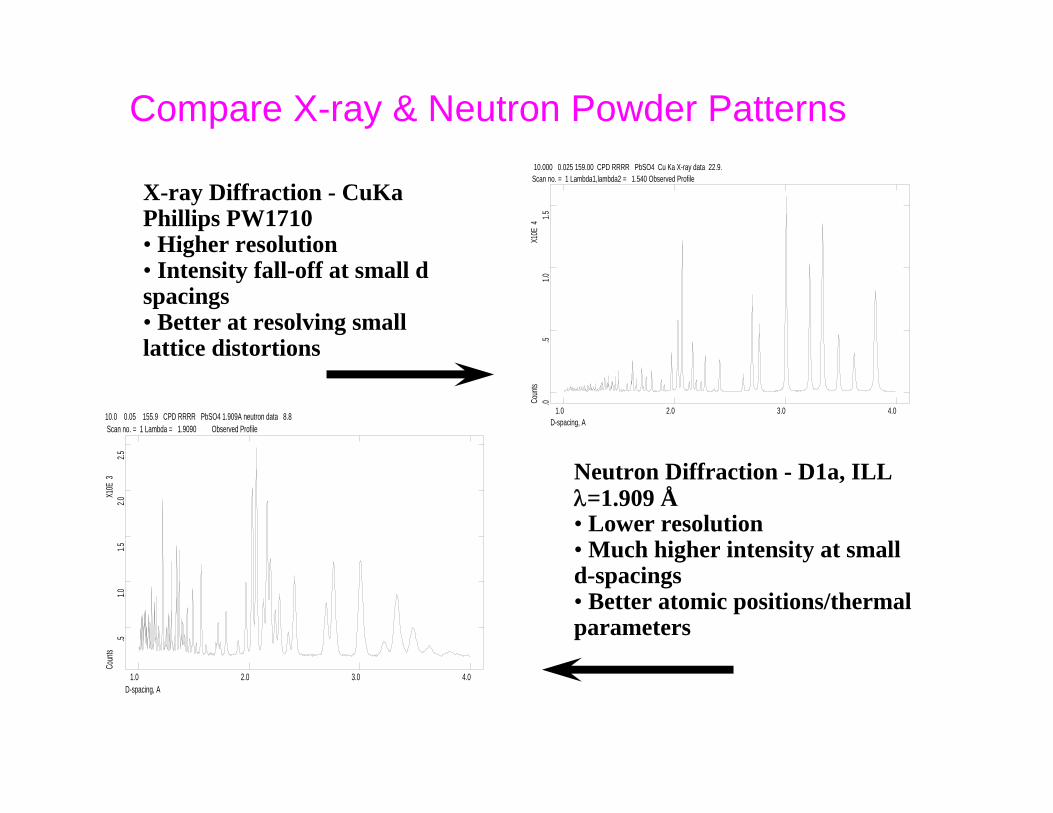
X-ray Diffraction - CuKaPhillips PW1710• Higher resolution• Intensity fall-off at small d spacings• Better at resolving small lattice distortions
Neutron Diffraction - D1a, ILL λ=1.909 Å• Lower resolution• Much higher intensity at small d-spacings• Better atomic positions/thermal parameters
Compare X-ray & Neutron Powder Patterns
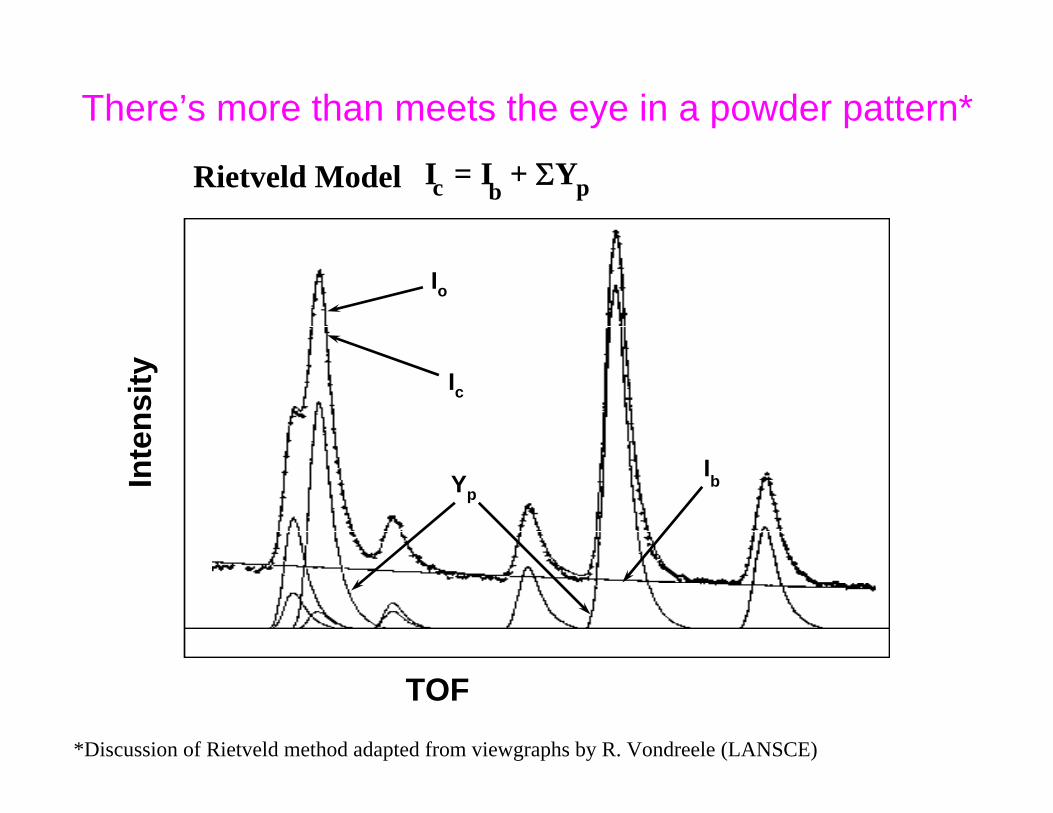
Ic = Ib + ΣYp
Io
Ic
YpIb
Rietveld Model
TOF
Inte
nsity
There’s more than meets the eye in a powder pattern*
*Discussion of Rietveld method adapted from viewgraphs by R. Vondreele (LANSCE)
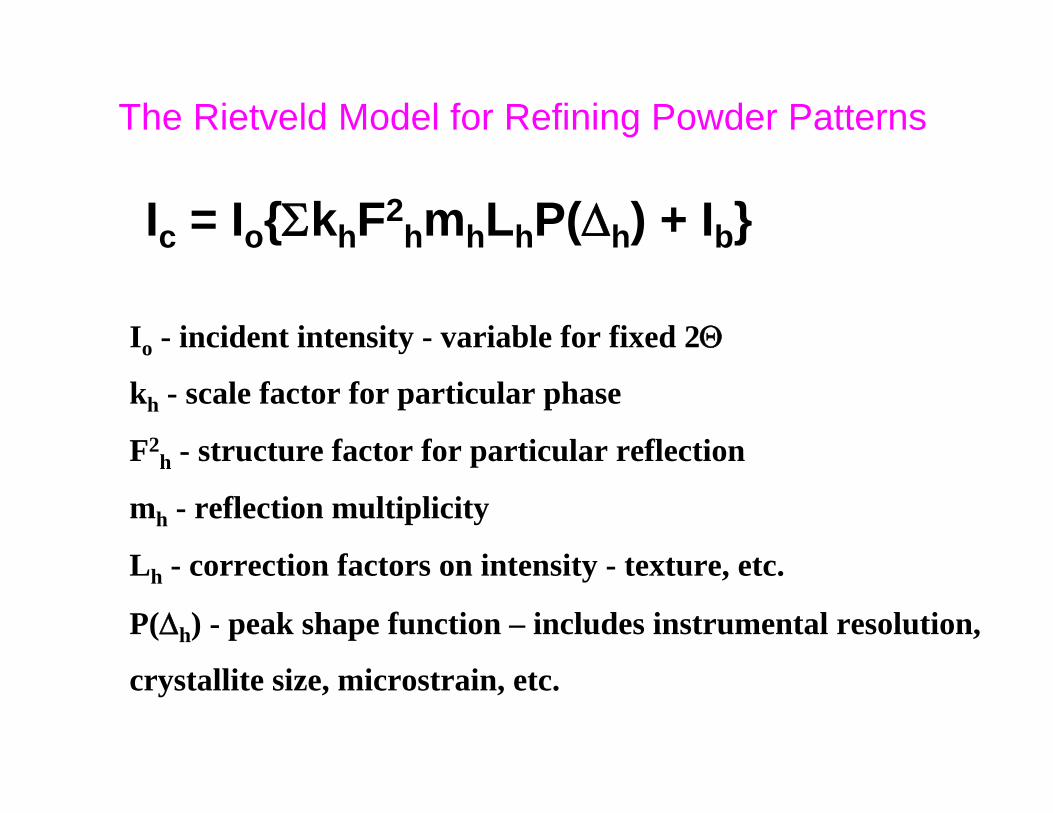
The Rietveld Model for Refining Powder Patterns
Io - incident intensity - variable for fixed 2Θ
kh - scale factor for particular phase
F2h - structure factor for particular reflection
mh - reflection multiplicity
Lh - correction factors on intensity - texture, etc.
P(Δh) - peak shape function – includes instrumental resolution,
crystallite size, microstrain, etc.
Ic = Io{ΣkhF2hmhLhP(Δh) + Ib}
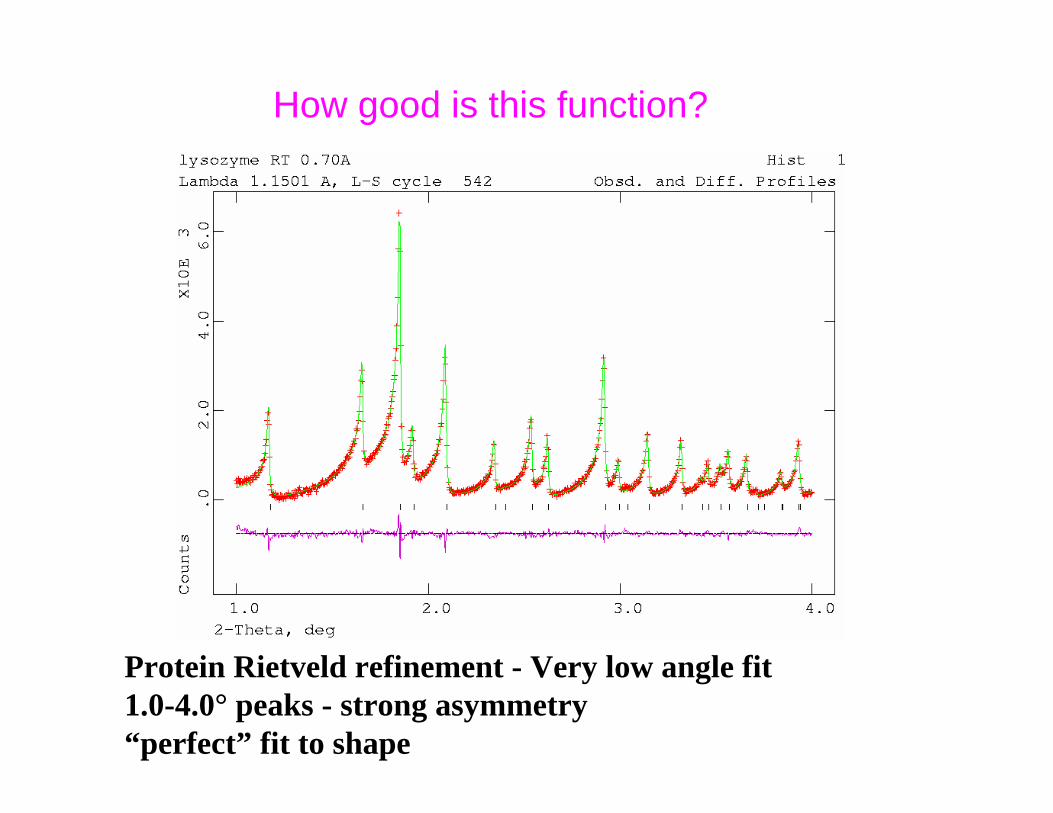
How good is this function?
Protein Rietveld refinement - Very low angle fit1.0-4.0° peaks - strong asymmetry“perfect” fit to shape
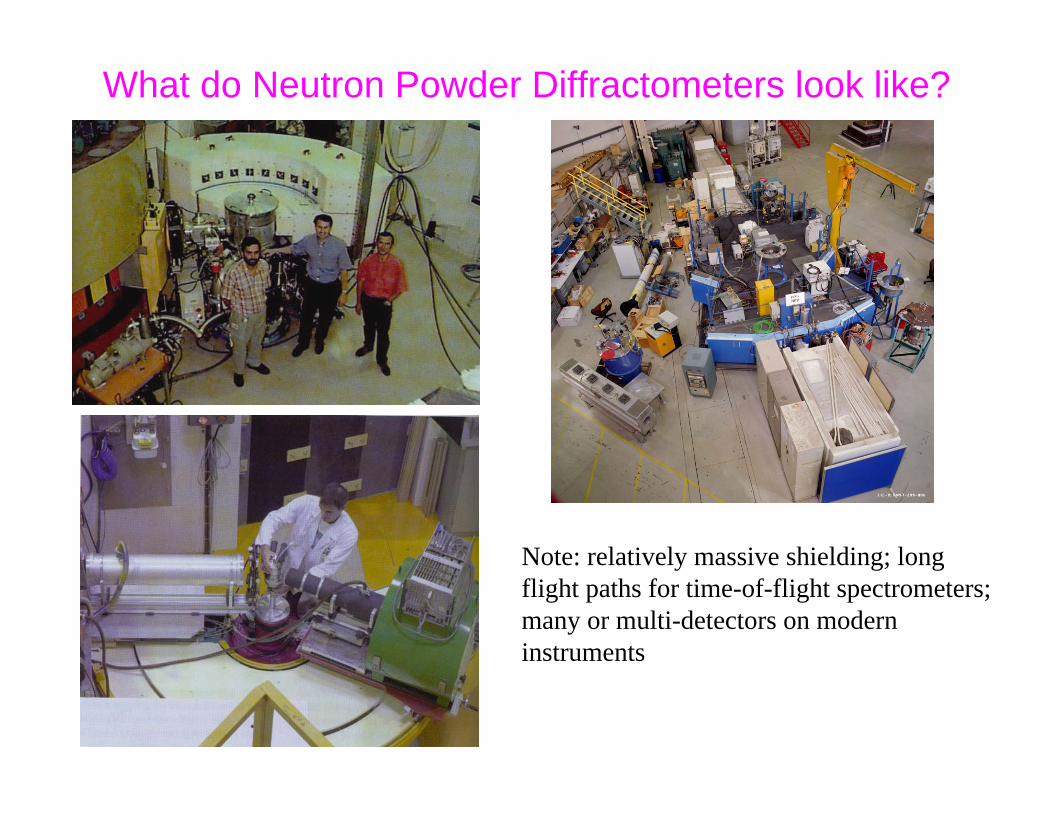
What do Neutron Powder Diffractometers look like?
Note: relatively massive shielding; longflight paths for time-of-flight spectrometers;many or multi-detectors on modern instruments
Examples of Science using Neutron Diffraction
• Refinement of structures of new materials• Materials texture• Strain measurements• Laue instruments for neutron protein crystallography• Pair distribution functions (PDF)
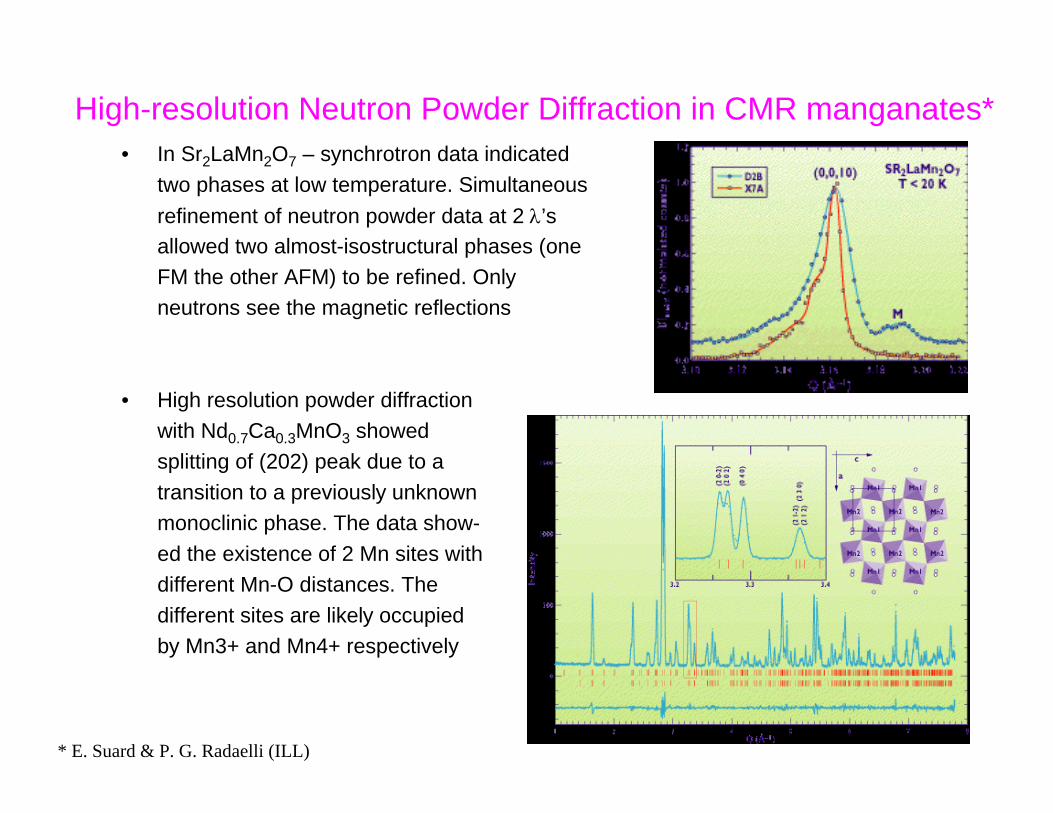
High-resolution Neutron Powder Diffraction in CMR manganates*• In Sr2LaMn2O7 – synchrotron data indicated
two phases at low temperature. Simultaneousrefinement of neutron powder data at 2 λ’sallowed two almost-isostructural phases (oneFM the other AFM) to be refined. Only neutrons see the magnetic reflections
• High resolution powder diffractionwith Nd0.7Ca0.3MnO3 showedsplitting of (202) peak due to atransition to a previously unknownmonoclinic phase. The data show-ed the existence of 2 Mn sites withdifferent Mn-O distances. Thedifferent sites are likely occupiedby Mn3+ and Mn4+ respectively
* E. Suard & P. G. Radaelli (ILL)
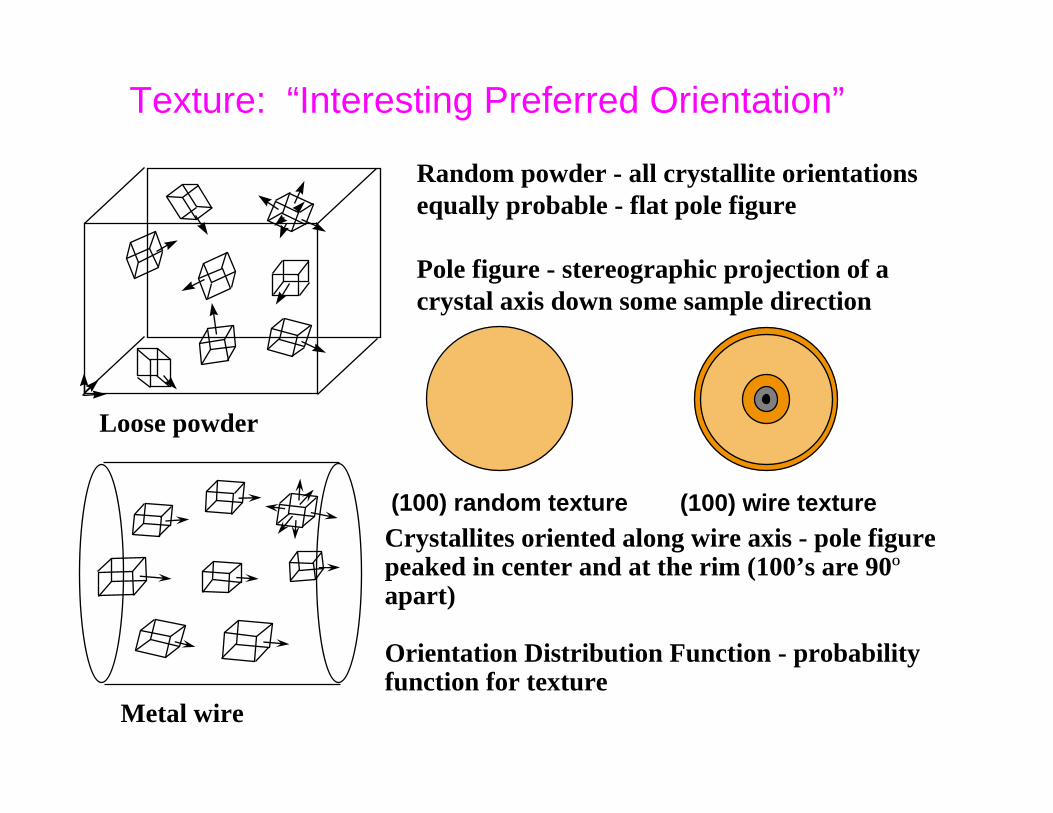
Random powder - all crystallite orientations equally probable - flat pole figure
Crystallites oriented along wire axis - pole figure peaked in center and at the rim (100’s are 90ºapart)
Orientation Distribution Function - probability function for texture
(100) wire texture(100) random texture
Texture: “Interesting Preferred Orientation”
Pole figure - stereographic projection of a crystal axis down some sample direction
Loose powder
Metal wire
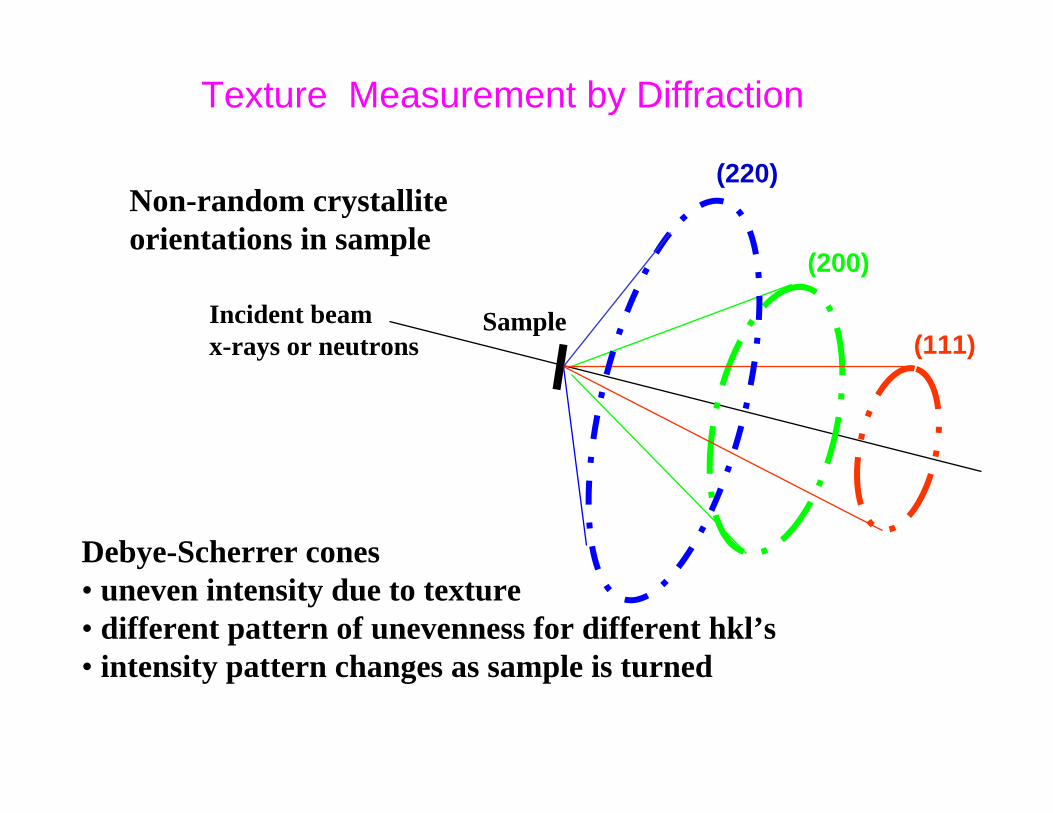
Texture Measurement by Diffraction
Debye-Scherrer cones • uneven intensity due to texture • different pattern of unevenness for different hkl’s• intensity pattern changes as sample is turned
Non-random crystallite orientations in sample
Incident beamx-rays or neutrons
Sample(111)
(200)
(220)
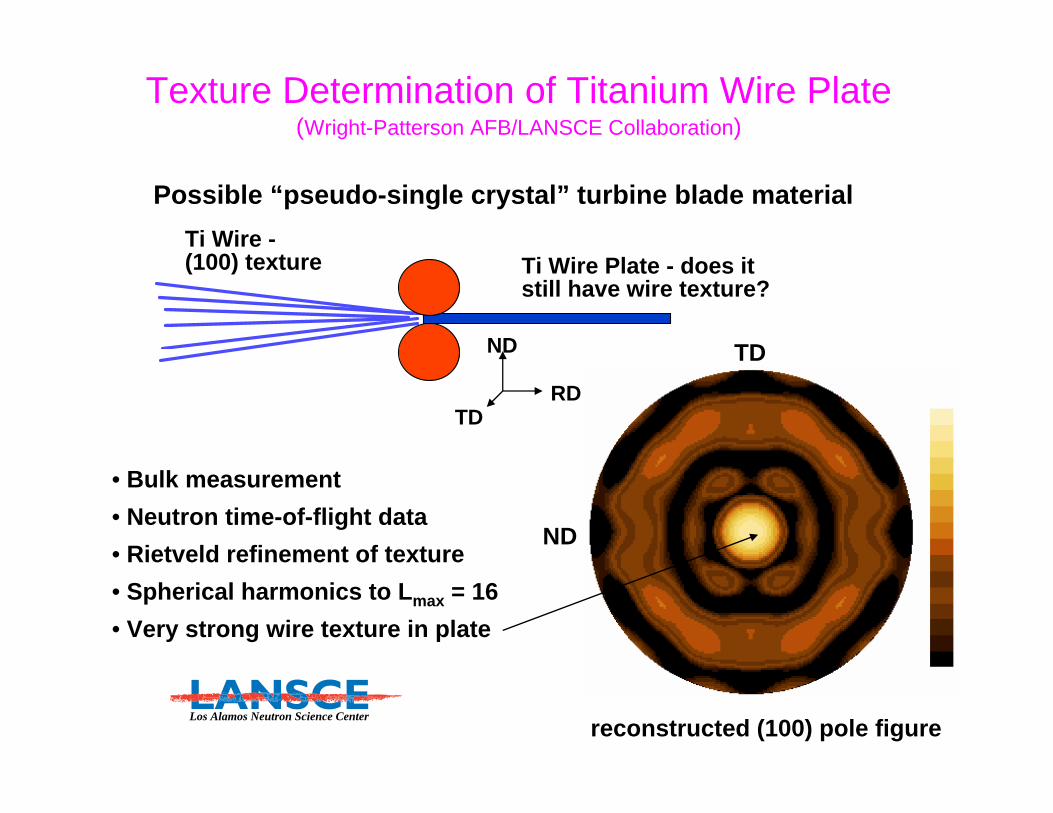
Texture Determination of Titanium Wire Plate(Wright-Patterson AFB/LANSCE Collaboration)
Possible “pseudo-single crystal” turbine blade material
Ti Wire Plate - does it still have wire texture?
Ti Wire - (100) texture
• Bulk measurement• Neutron time-of-flight data• Rietveld refinement of texture• Spherical harmonics to Lmax = 16• Very strong wire texture in plate
TD
ND
reconstructed (100) pole figure
ND
RDTD
Los Alamos Neutron Science Center
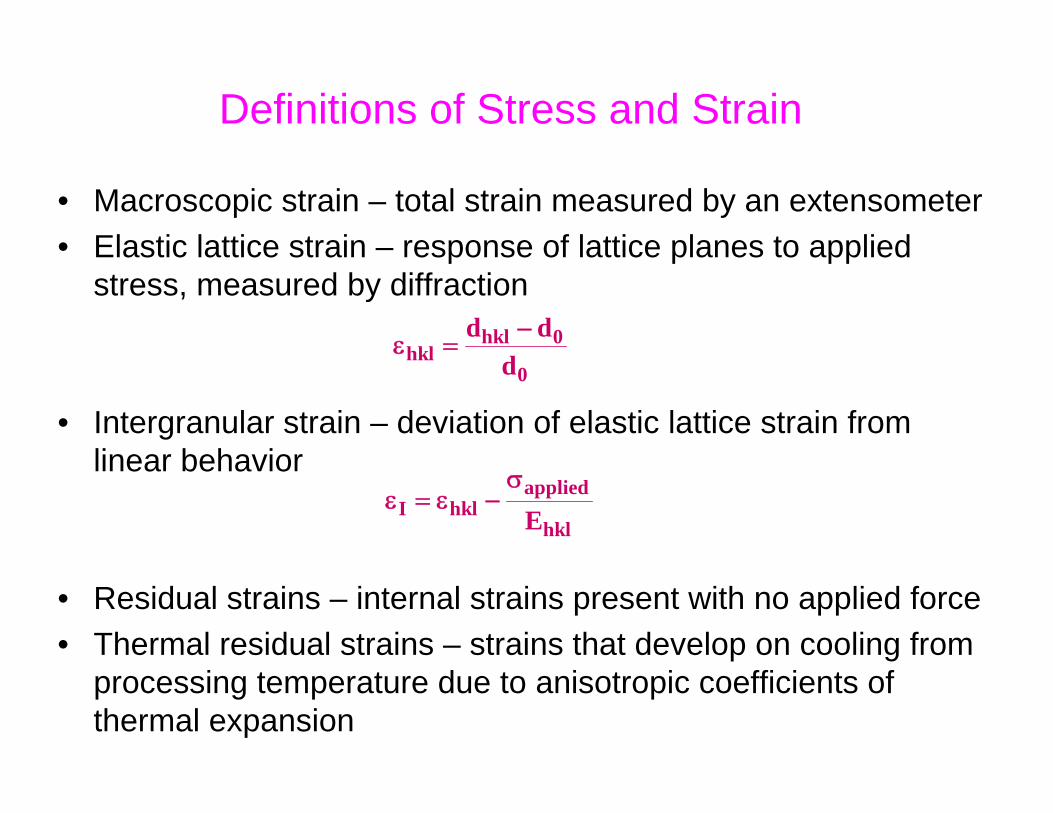
Definitions of Stress and Strain
• Macroscopic strain – total strain measured by an extensometer• Elastic lattice strain – response of lattice planes to applied
stress, measured by diffraction
• Intergranular strain – deviation of elastic lattice strain from linear behavior
• Residual strains – internal strains present with no applied force• Thermal residual strains – strains that develop on cooling from
processing temperature due to anisotropic coefficients of thermal expansion
hkl 0hkl
0
d dd
−ε =
appliedI hkl
hklEσ
ε = ε −
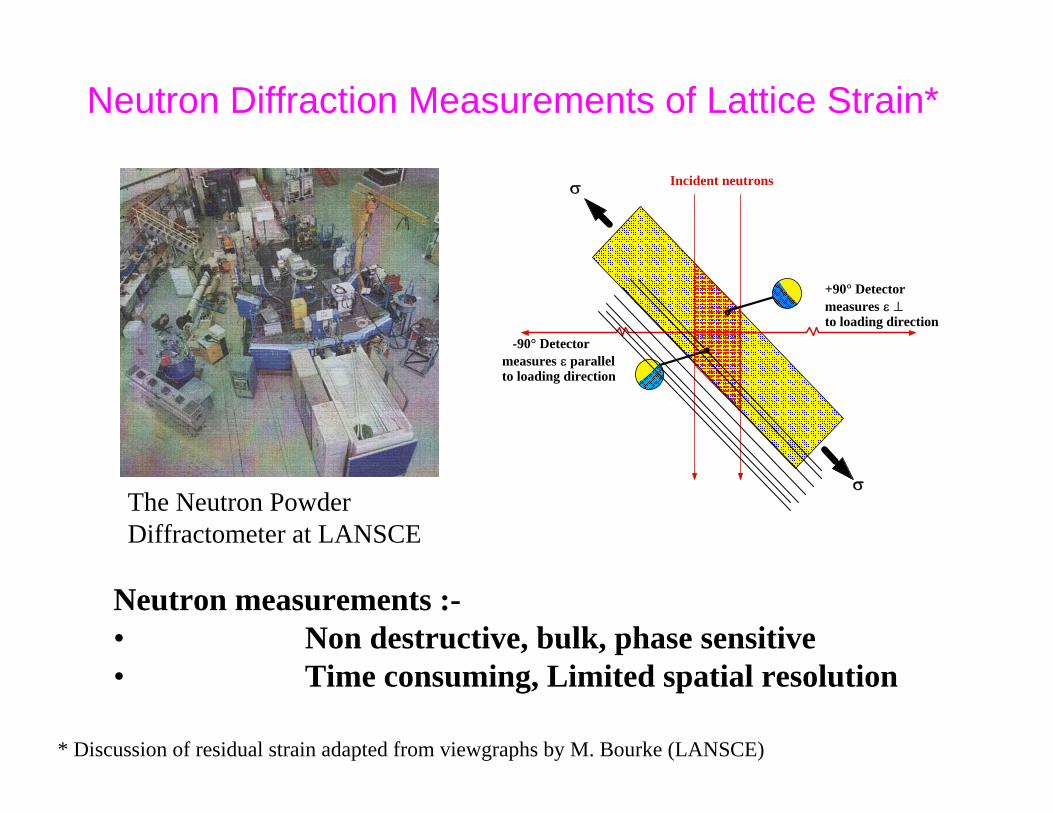
Neutron Diffraction Measurements of Lattice Strain*
Neutron measurements :-• Non destructive, bulk, phase sensitive• Time consuming, Limited spatial resolution
Text box
σ
σ
Incident neutrons
-90° Detector measures ε parallel to loading direction
+90° Detector measures ε ⊥ to loading direction
The Neutron PowderDiffractometer at LANSCE
* Discussion of residual strain adapted from viewgraphs by M. Bourke (LANSCE)
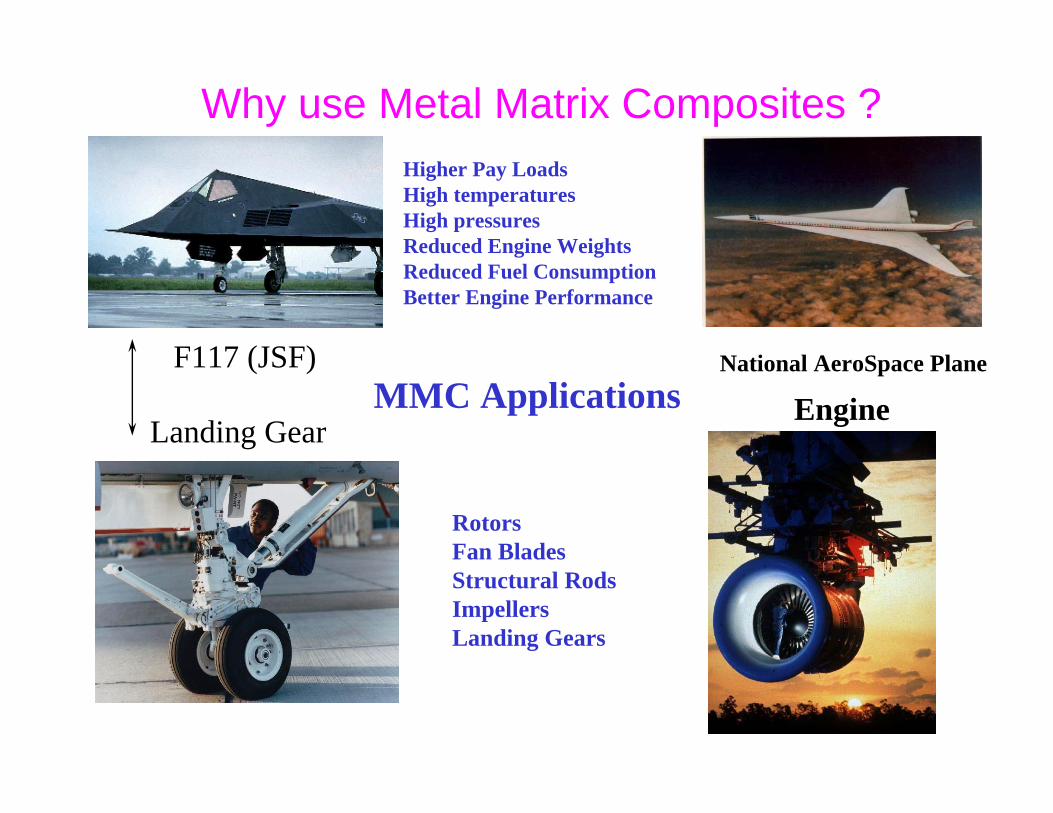
Why use Metal Matrix Composites ?Higher Pay LoadsHigh temperaturesHigh pressuresReduced Engine WeightsReduced Fuel ConsumptionBetter Engine Performance
RotorsFan BladesStructural RodsImpellersLanding Gears
MMC ApplicationsNational AeroSpace PlaneF117 (JSF)
EngineLanding Gear
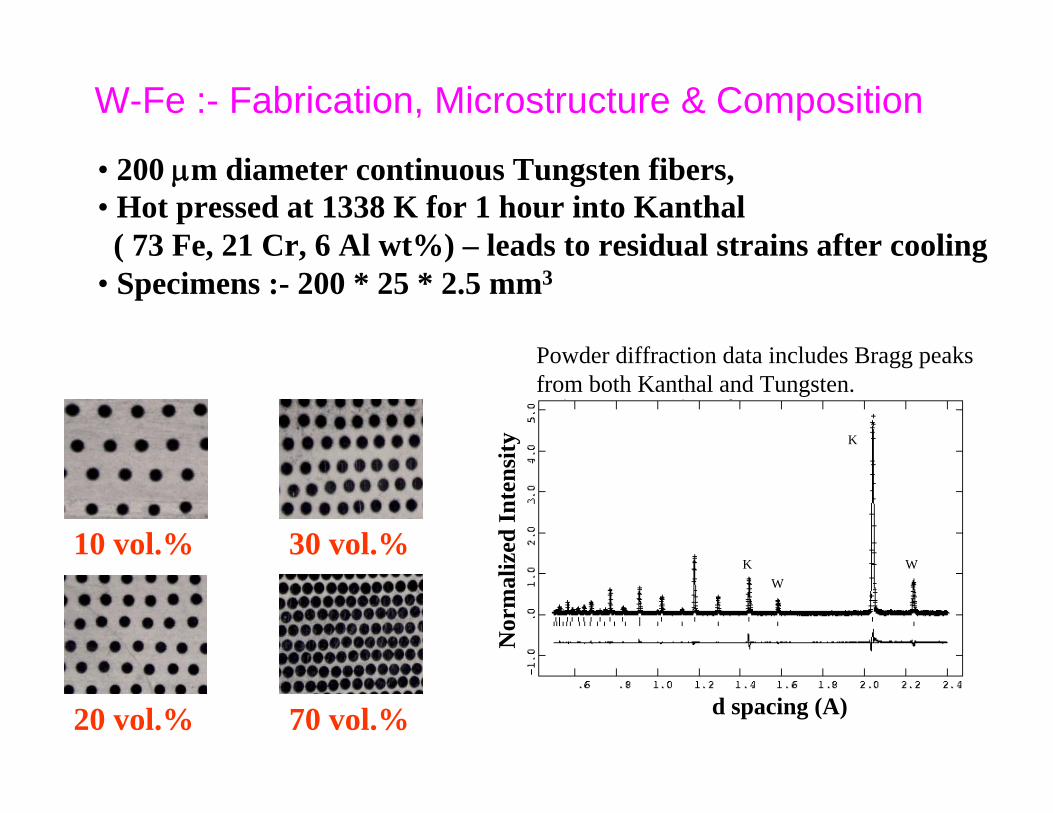
W-Fe :- Fabrication, Microstructure & Composition
• 200 μm diameter continuous Tungsten fibers, • Hot pressed at 1338 K for 1 hour into Kanthal( 73 Fe, 21 Cr, 6 Al wt%) – leads to residual strains after cooling
• Specimens :- 200 * 25 * 2.5 mm3
10 vol.%
70 vol.%20 vol.%
30 vol.%W
K
KW
d spacing (A)
Nor
mal
ized
Inte
nsity
Powder diffraction data includes Bragg peaks from both Kanthal and Tungsten.
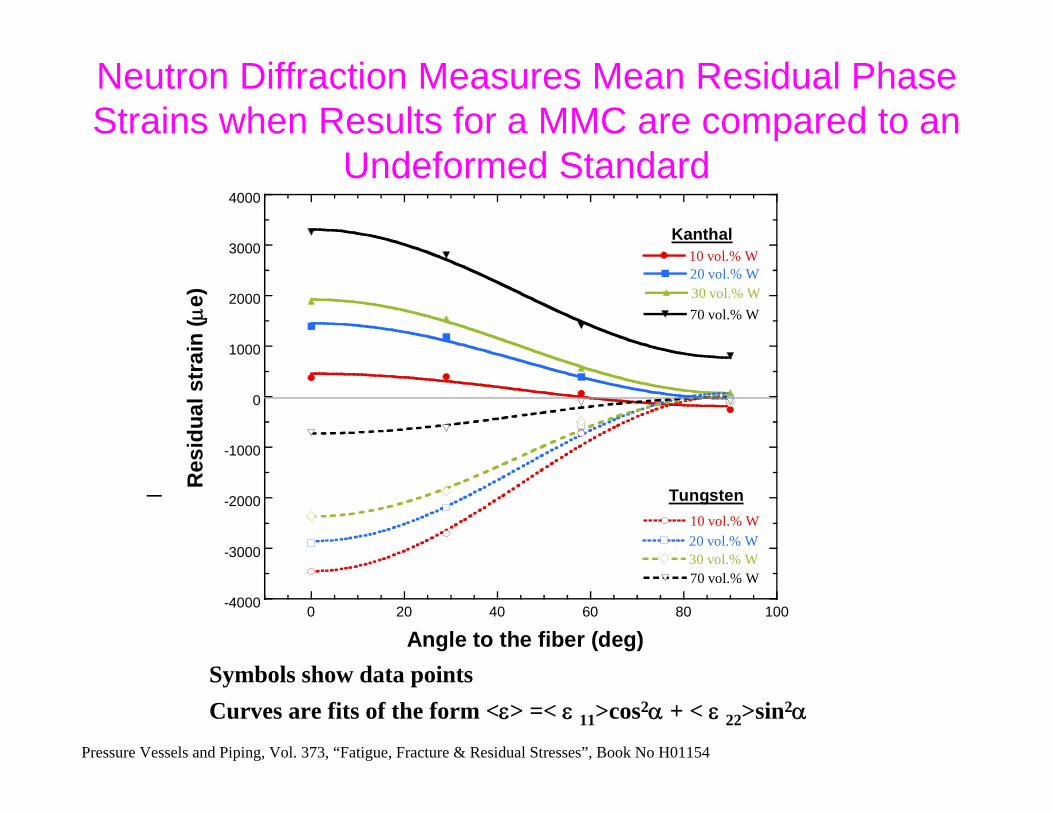
Neutron Diffraction Measures Mean Residual Phase Strains when Results for a MMC are compared to an
Undeformed Standard
Symbols show data pointsCurves are fits of the form <ε> =< ε 11>cos2α + < ε 22>sin2α
-4000
-3000
-2000
-1000
0
1000
2000
3000
4000
0 20 40 60 80 100
10 vol.% W20 vol.% W30 vol.% W70 vol.% W
10 vol.% W20 vol.% W30 vol.% W70 vol.% W
Angle to the fiber (deg)
Res
idua
l Str
ain
(μe)
Kanthal
Tungsten
Res
idua
l str
ain
(μe)
Pressure Vessels and Piping, Vol. 373, “Fatigue, Fracture & Residual Stresses”, Book No H01154
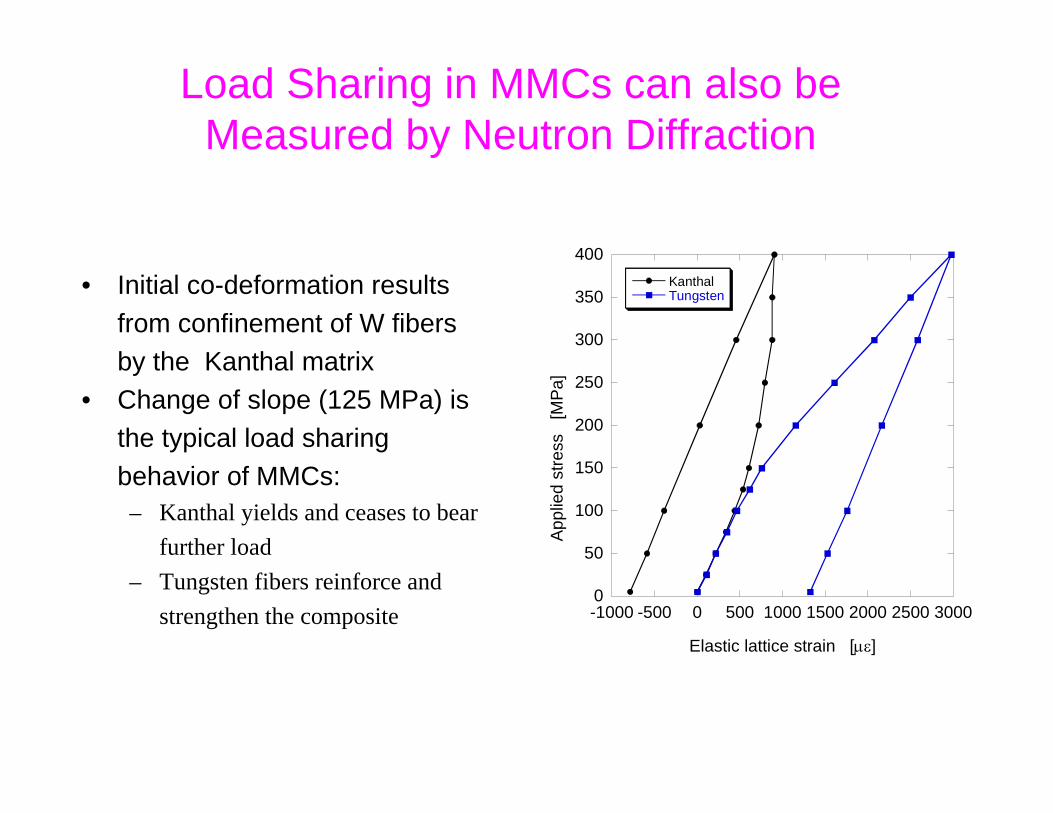
Load Sharing in MMCs can also be Measured by Neutron Diffraction
• Initial co-deformation resultsfrom confinement of W fibersby the Kanthal matrix
• Change of slope (125 MPa) isthe typical load sharingbehavior of MMCs:– Kanthal yields and ceases to bear
further load– Tungsten fibers reinforce and
strengthen the composite -1000 -500 0 500 1000 1500 2000 2500 30000
50
100
150
200
250
300
350
400KanthalTungsten
Elastic lattice strain [με]
App
lied
stre
ss
[MPa
]
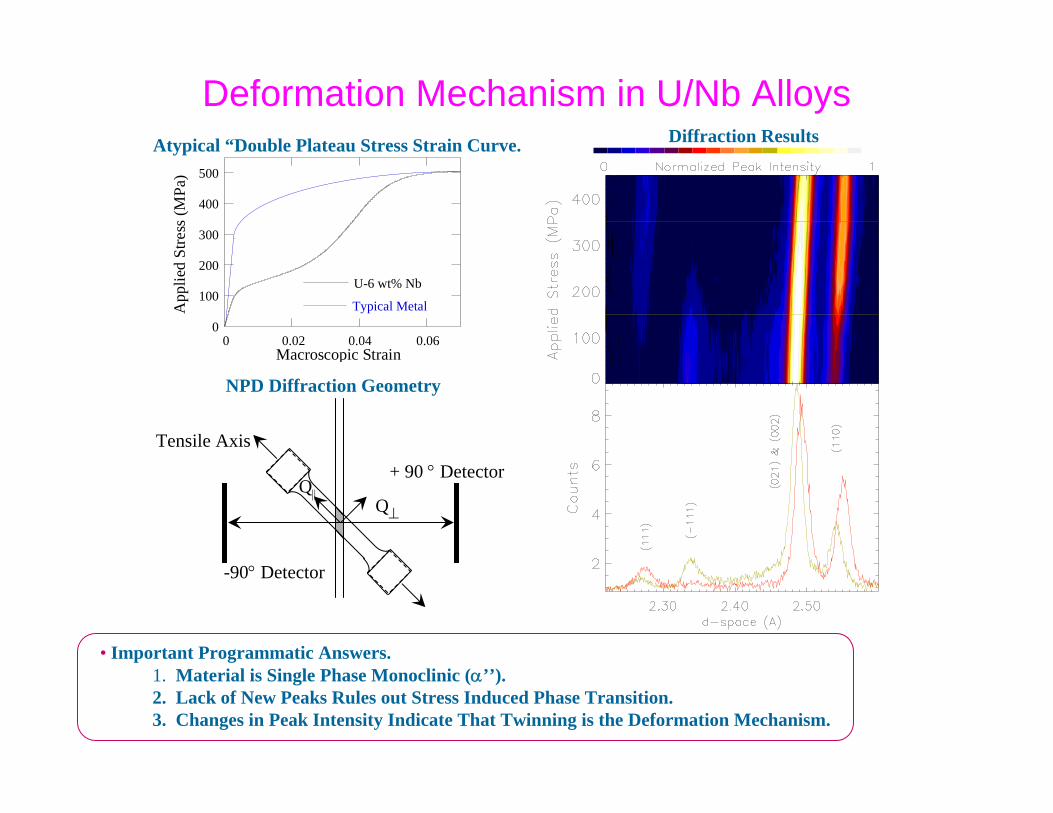
• Important Programmatic Answers.1. Material is Single Phase Monoclinic (α’’).2. Lack of New Peaks Rules out Stress Induced Phase Transition.3. Changes in Peak Intensity Indicate That Twinning is the Deformation Mechanism.
Deformation Mechanism in U/Nb Alloys
+ 90 ° Detector
-90° Detector
Tensile Axis
Q⊥
Q||
0
100
200
300
400
500
0 0.02 0.04 0.06
U-6 wt% Nb
App
lied
Stre
ss (M
Pa)
Macroscopic Strain
Typical Metal
Atypical “Double Plateau Stress Strain Curve.
NPD Diffraction Geometry
Diffraction Results
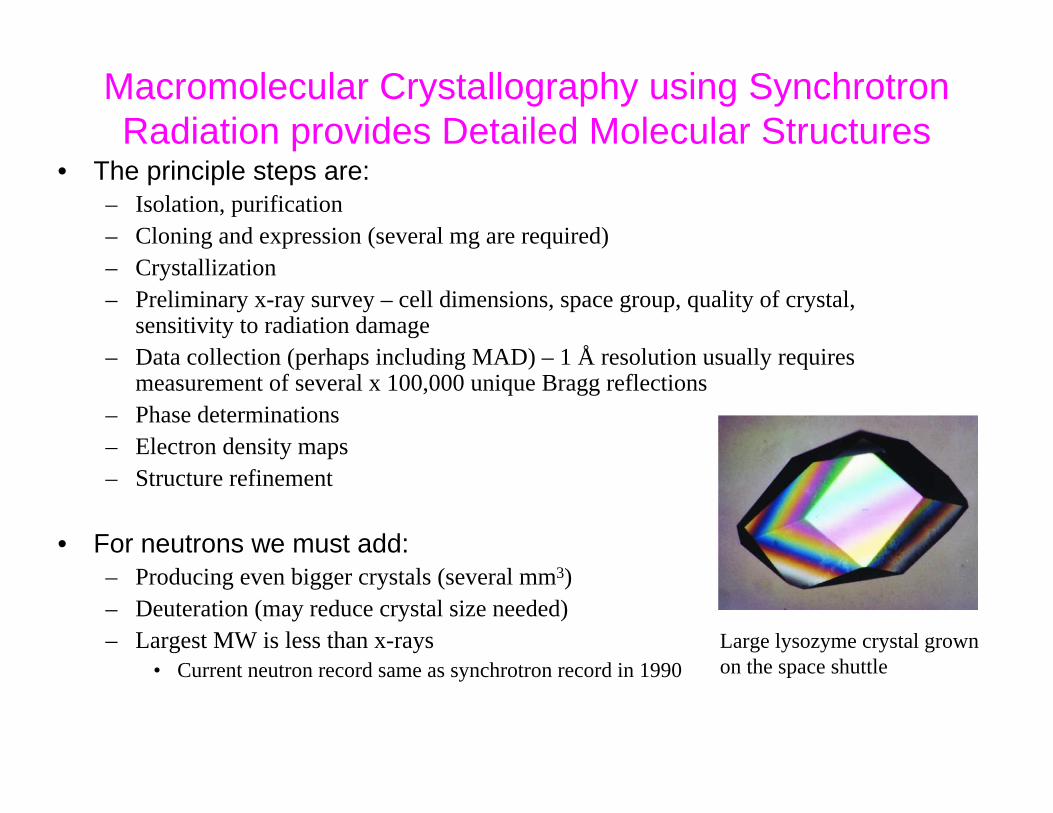
Macromolecular Crystallography using Synchrotron Radiation provides Detailed Molecular Structures
• The principle steps are:– Isolation, purification– Cloning and expression (several mg are required)– Crystallization– Preliminary x-ray survey – cell dimensions, space group, quality of crystal,
sensitivity to radiation damage– Data collection (perhaps including MAD) – 1 Å resolution usually requires
measurement of several x 100,000 unique Bragg reflections– Phase determinations– Electron density maps– Structure refinement
• For neutrons we must add:– Producing even bigger crystals (several mm3)– Deuteration (may reduce crystal size needed)– Largest MW is less than x-rays
• Current neutron record same as synchrotron record in 1990Large lysozyme crystal grownon the space shuttle
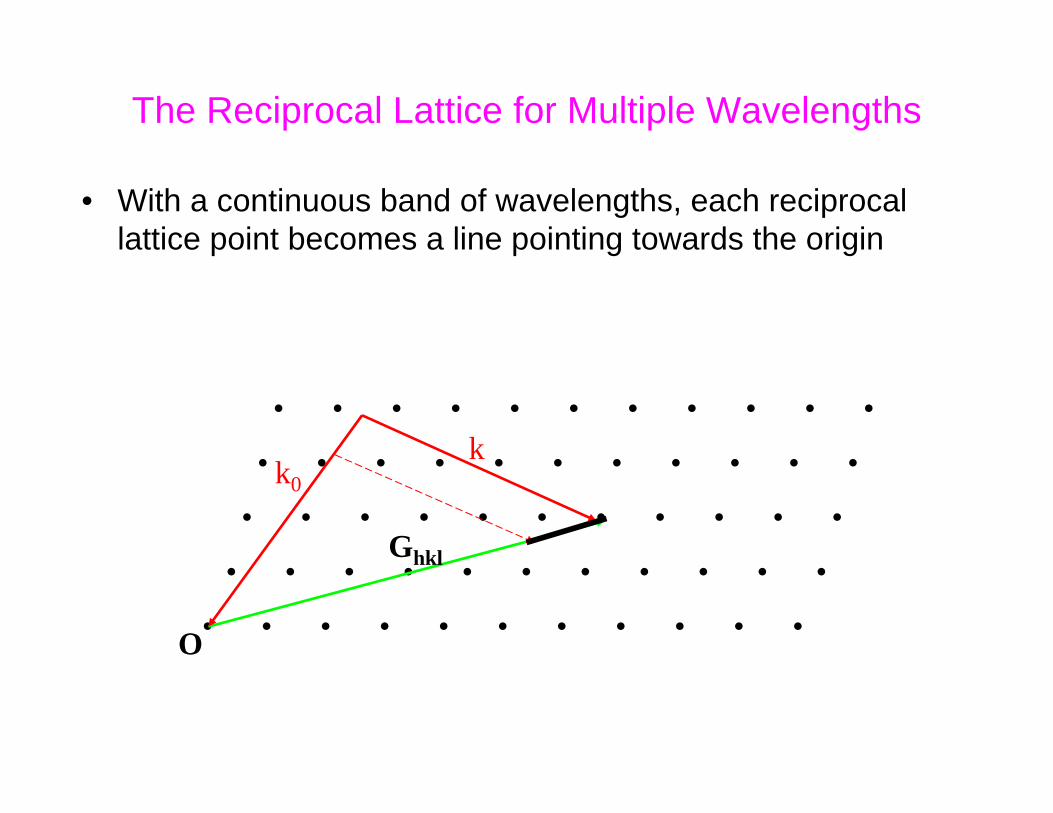
The Reciprocal Lattice for Multiple Wavelengths
• With a continuous band of wavelengths, each reciprocal lattice point becomes a line pointing towards the origin
• • • • • • • • • • •
• • • • • • • • • • •
• • • • • • • • • • •
• • • • • • • • • • •
• • • • • • • • • • •
Ghkl
O
k0k
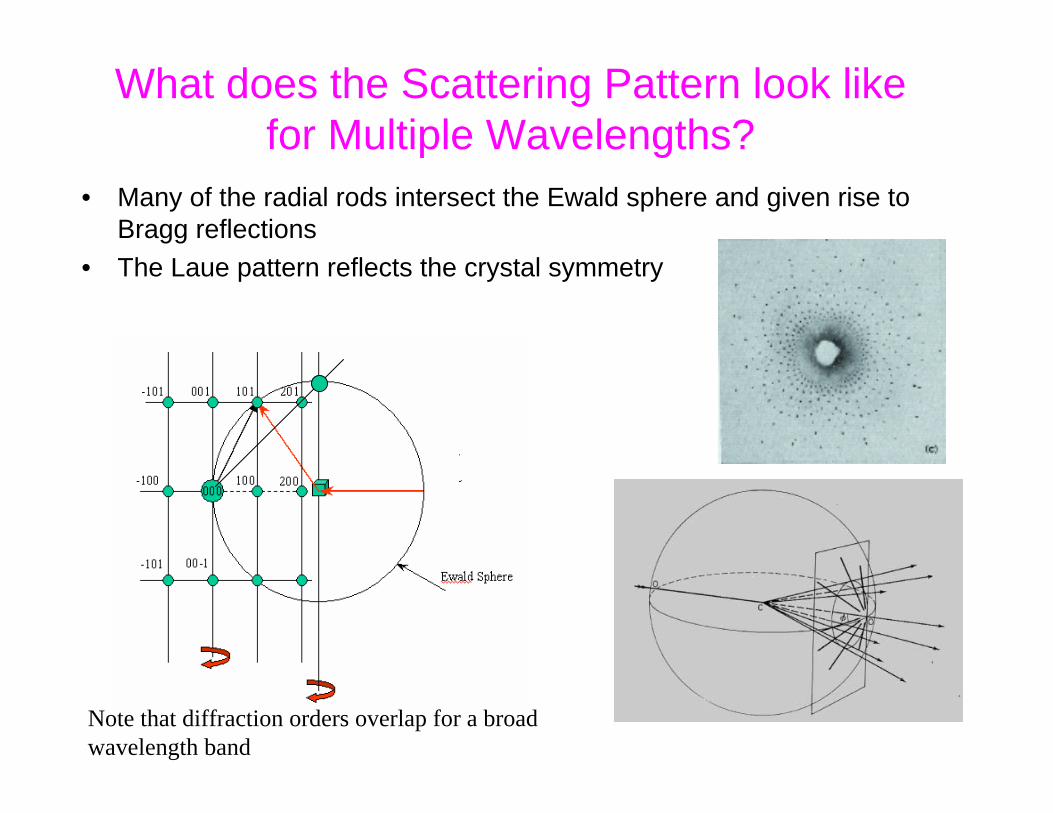
What does the Scattering Pattern look like for Multiple Wavelengths?
• Many of the radial rods intersect the Ewald sphere and given rise to Bragg reflections
• The Laue pattern reflects the crystal symmetry
Note that diffraction orders overlap for a broadwavelength band
What is the Role for Neutron Scattering in Protein Crystallography?
• Even the highest resolution synchrotron x-ray studies have trouble locating protons in protein crystals– Especially true if there is a close-by metal atom (e.g. in enzymes)– X-rays measure electron density – if a proton and its electrons are displaced x-
rays will give a false impression of proton location
• Neutron diffraction can locate protons even in moderate resolution studies (~2 Å)– Neutrons locate nuclei not (generally) electrons– Either H or D scatter comparably with other nuclei
• There are many cases were H plays a vital role in proteins– Primary motive power for many enzymatic reactions– Hydrogen bonding and hydration contribute to structural stability
The Laue Method is a Powerful Tool for Neutron Protein Crystallography
• “Quasi-Laue” technique implemented at continuous neutron sources– “quasi” because it uses restricted wavelength band (1.5 to 2 Å typically) to
avoid overlapping Bragg peaks– Use image-plate detectors that measure over a wide range of scattering
angles but with relatively low efficiency– Typically requires crystals of several mm3 and MW less than ~50 kDa
• Full Laue method implemented at LANSCE*– Uses wavelengths from ~0.6Å to ~6.5Å, separated by TOF– Peak-to-background ratio is excellent because bgr is spread over many TOF
channels– Has recently solved structure with MW ~ 160 kDa
*Langan et al J. App. Cryst., 37, 24 (2004)
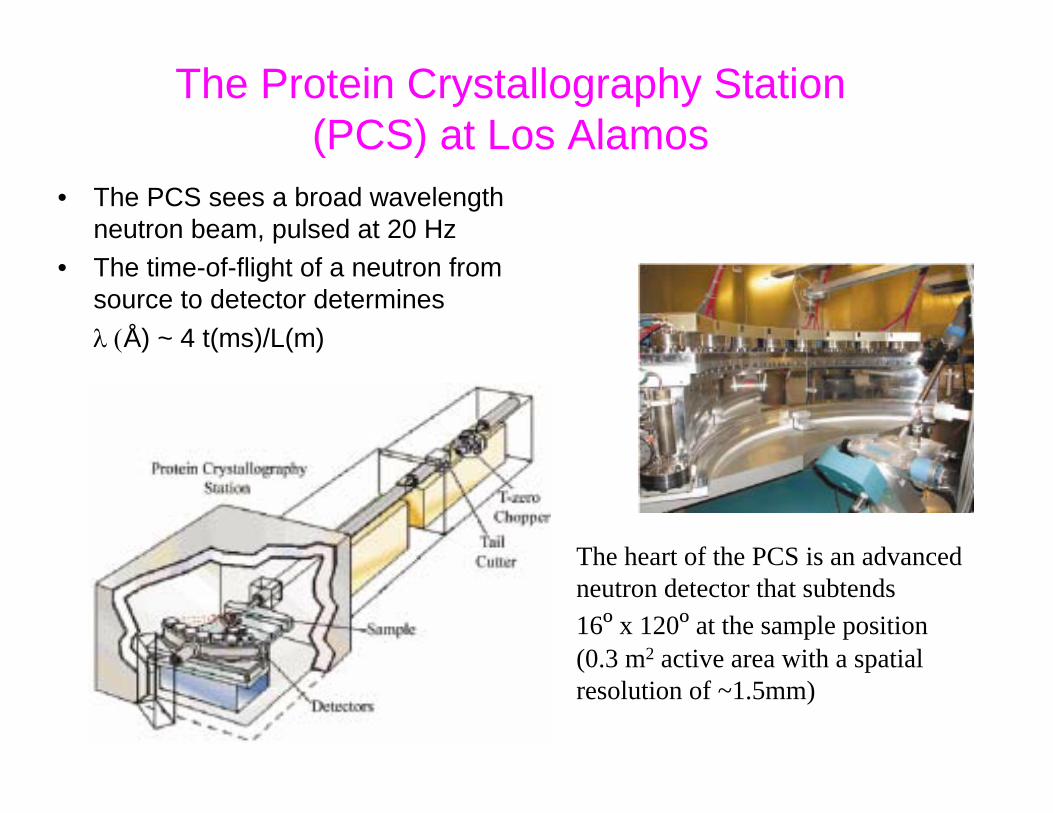
The Protein Crystallography Station (PCS) at Los Alamos
• The PCS sees a broad wavelength neutron beam, pulsed at 20 Hz
• The time-of-flight of a neutron from source to detector determines λ (Å) ~ 4 t(ms)/L(m)
The heart of the PCS is an advancedneutron detector that subtends 16º x 120º at the sample position(0.3 m2 active area with a spatial resolution of ~1.5mm)
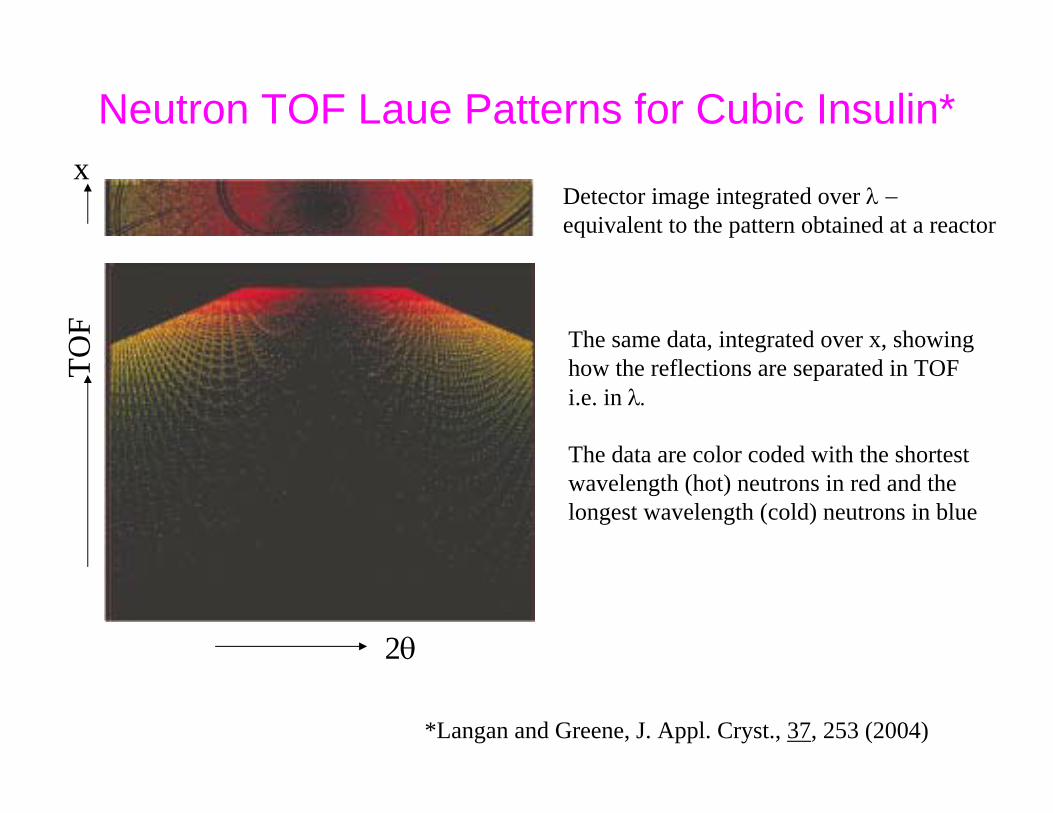
Neutron TOF Laue Patterns for Cubic Insulin*
Detector image integrated over λ −equivalent to the pattern obtained at a reactor
2θ
The same data, integrated over x, showinghow the reflections are separated in TOF i.e. in λ.
The data are color coded with the shortestwavelength (hot) neutrons in red and the longest wavelength (cold) neutrons in blue
x
TOF
*Langan and Greene, J. Appl. Cryst., 37, 253 (2004)
Preparing a Neutron Protein Crystallography Experiment• Need to know x-ray structure and have a good scientific case for
needing to know H positions
• X-ray crystals are ~0.1 mm3; neutrons need 1 mm3 or larger for hydrogenated samples
• Scattering power increases by ~10x if crystal is deuterated
• Typically, insert gene that encodes protein in E Coli and grow up using D2O and deuterated nutrient – probably need about 5 L of final medium for neutron experiment (this can be done at LANSCE)
• Extract protein and grow deuterated crystal – crystal mosaic needs to be 0.2º to 0.3º
• MW limit is currently about 150 kDa for good quality crystals
The Process of Obtaining Neutron Laue Patterns
• Detector response correction – use incoherent scatterer• Check crystal centering – telescope• Collect data (~12 hours per crystal orientation)• Check diffraction quality – intensity & standard deviation• Locate diffraction spots in x, y and λ• Check no spurious peaks• Index reflections & determine crystal orientation• Predict reflection positions & overlay on observations• Integrate reflections• Perform wavelength normalization (I ~ λ2)• Average intensities of equivalent reflections• Refine crystal structure (use x-ray structure)
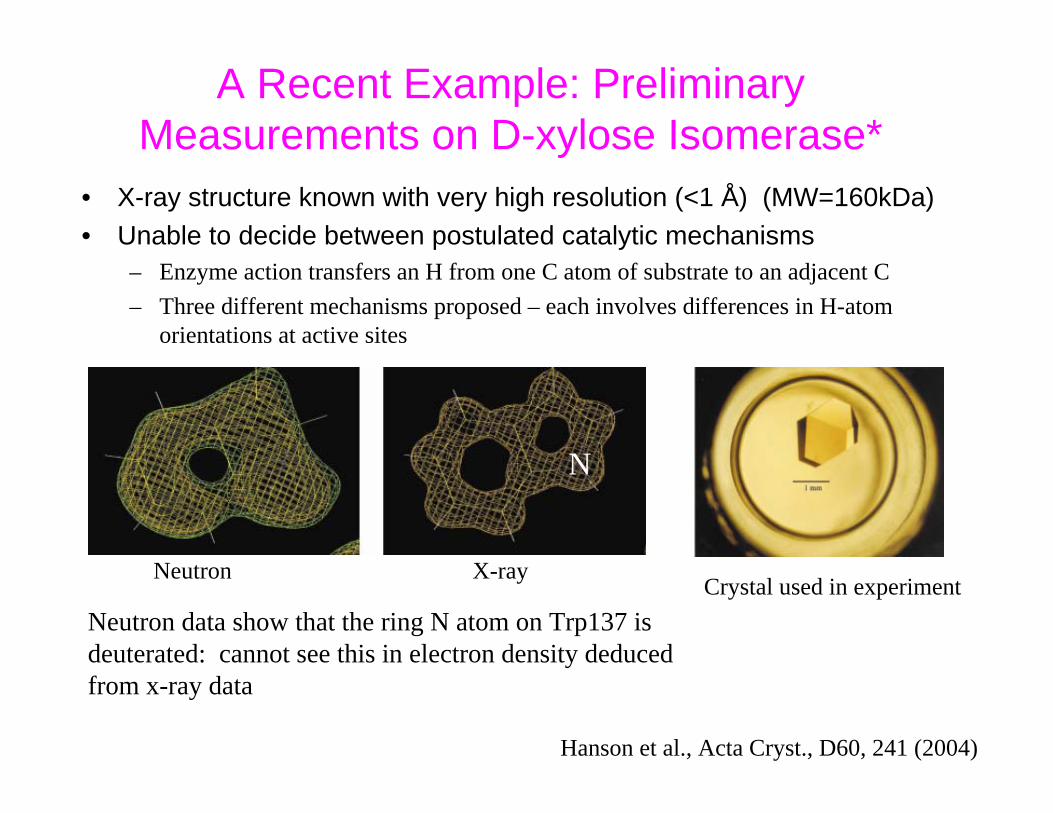
A Recent Example: Preliminary Measurements on D-xylose Isomerase*
• X-ray structure known with very high resolution (<1 Å) (MW=160kDa)• Unable to decide between postulated catalytic mechanisms
– Enzyme action transfers an H from one C atom of substrate to an adjacent C– Three different mechanisms proposed – each involves differences in H-atom
orientations at active sites
Hanson et al., Acta Cryst., D60, 241 (2004)
X-rayNeutron
Neutron data show that the ring N atom on Trp137 isdeuterated: cannot see this in electron density deducedfrom x-ray data
N
Crystal used in experiment
Pair Distribution Functions
• Modern materials are often disordered.• Standard crystallographic methods lose the aperiodic
(disorder) information.• We would like to be able to sit on an atom and look at
our neighborhood.• The PDF method allows us to do that (see next slide):
– First we do a neutron or x-ray diffraction experiment– Then we correct the data for experimental effects– Then we Fourier transform the data to real-space
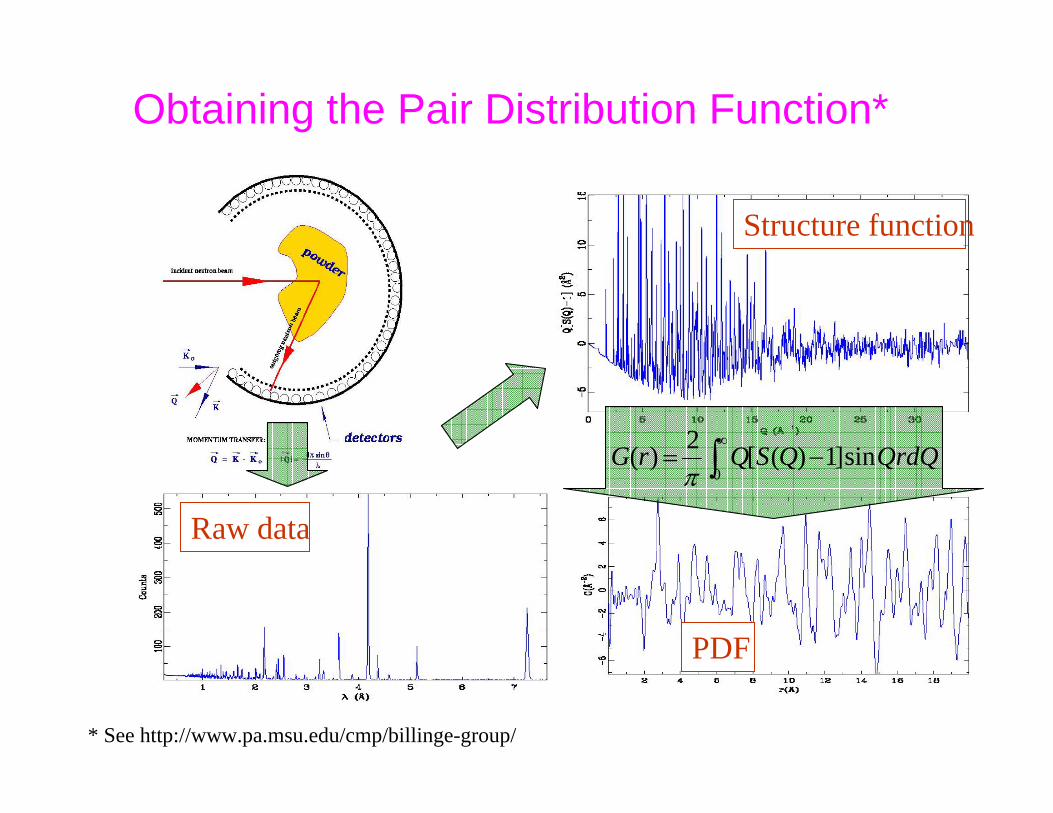
Obtaining the Pair Distribution Function*
Raw data
Structure function
QrdQQSQrG sin]1)([2)(0∫∞
−=π
* See http://www.pa.msu.edu/cmp/billinge-group/
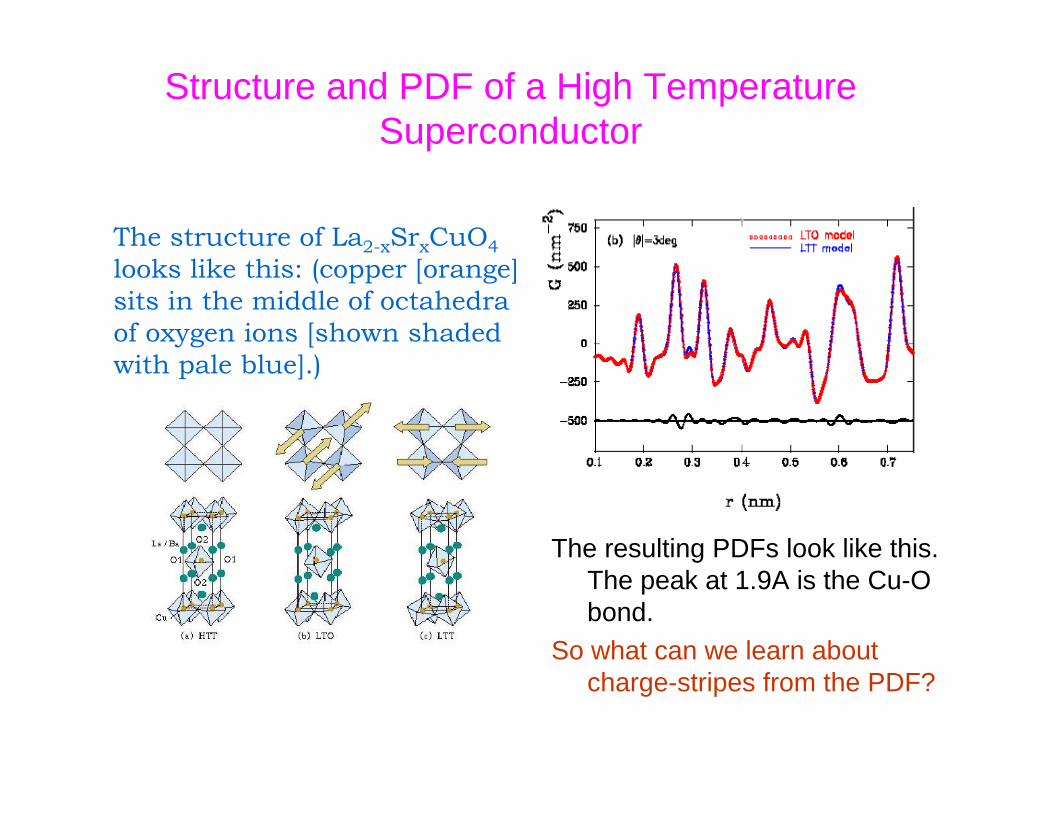
Structure and PDF of a High Temperature Superconductor
The resulting PDFs look like this. The peak at 1.9A is the Cu-O bond.
So what can we learn about charge-stripes from the PDF?
The structure of La2-xSrxCuO4looks like this: (copper [orange] sits in the middle of octahedraof oxygen ions [shown shaded with pale blue].)
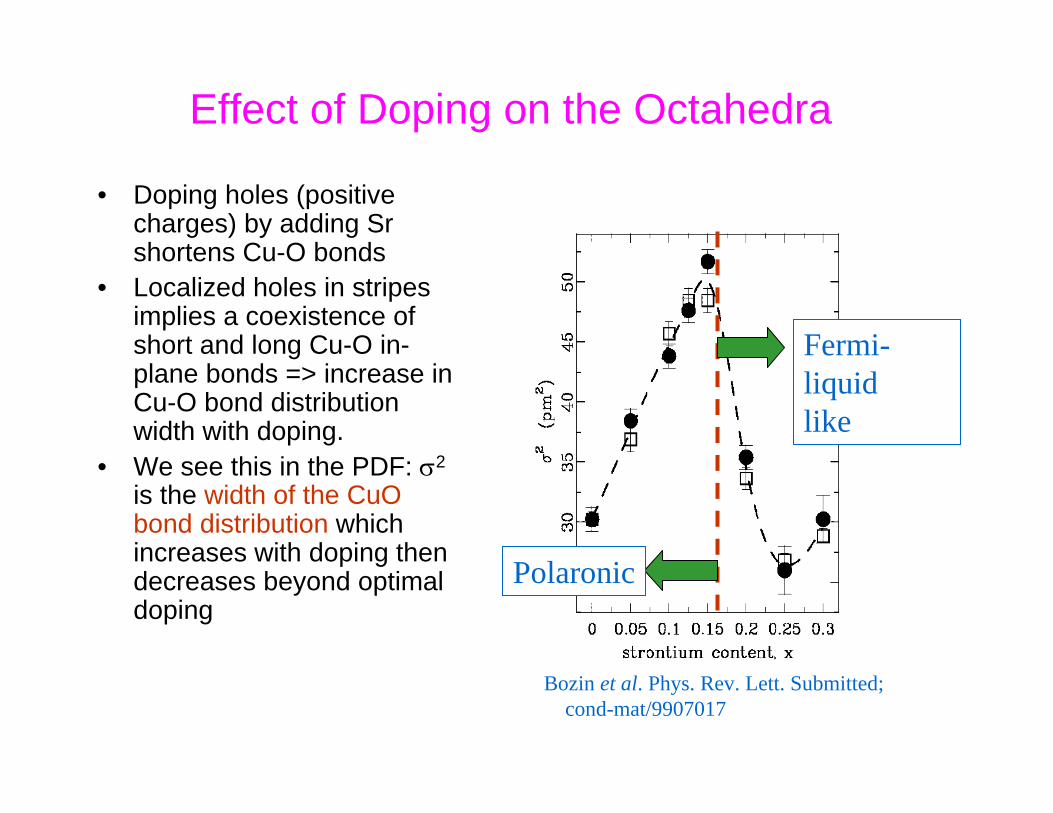
Effect of Doping on the Octahedra
• Doping holes (positive charges) by adding Srshortens Cu-O bonds
• Localized holes in stripes implies a coexistence of short and long Cu-O in-plane bonds => increase in Cu-O bond distribution width with doping.
• We see this in the PDF: σ2
is the width of the CuObond distribution which increases with doping then decreases beyond optimal doping
Polaronic
Fermi-liquidlike
Bozin et al. Phys. Rev. Lett. Submitted; cond-mat/9907017