Embed Size (px)
Citation preview

Economics 2 Professor Christina Romer Spring 2018 Professor David Romer
LECTURE 5
CONSUMERS AND UTILITY MAXIMIZATION
JANUARY 30, 2018
I. INTRODUCTION TO CONSUMER OPTIMIZATION
II. THE BUDGET CONSTRAINT
A. Description
B. Diagram for the case of 2 goods
C. What causes the budget constraint to change?
1. Change in income (discussion of the paper by Duflo)
2. Change in a price
III. UTILITY MAXIMIZATION
A. What do consumers seek to maximize?
B. Marginal utility
C. Diminishing marginal utility
1. Intuition and example
2. Relationship between total utility and marginal utility (including a brief digression using calculus)
D. Variation in how quickly marginal utility declines
E. The condition for utility maximization (the rational spending rule)
IV. WHY DEMAND CURVES SLOPE DOWN
A. Substitution effect
B. Income effect
C. A more general example
D. Individual household and market demand curves
V. WHY DEMAND CURVES SHIFT
A. A change in tastes
B. A change in income (further discussion of the paper by Duflo)

LECTURE 5 Consumers and Utility Maximization
January 30, 2018
Economics 2 Christina Romer Spring 2018 David Romer

Announcements
• Hand in Problem Set 1.
• Suggested answers will be posted after class on Thursday.
• Office hours this week will be today (Tuesday), 4-6 p.m.

I. INTRODUCTION TO CONSUMER OPTIMIZATION
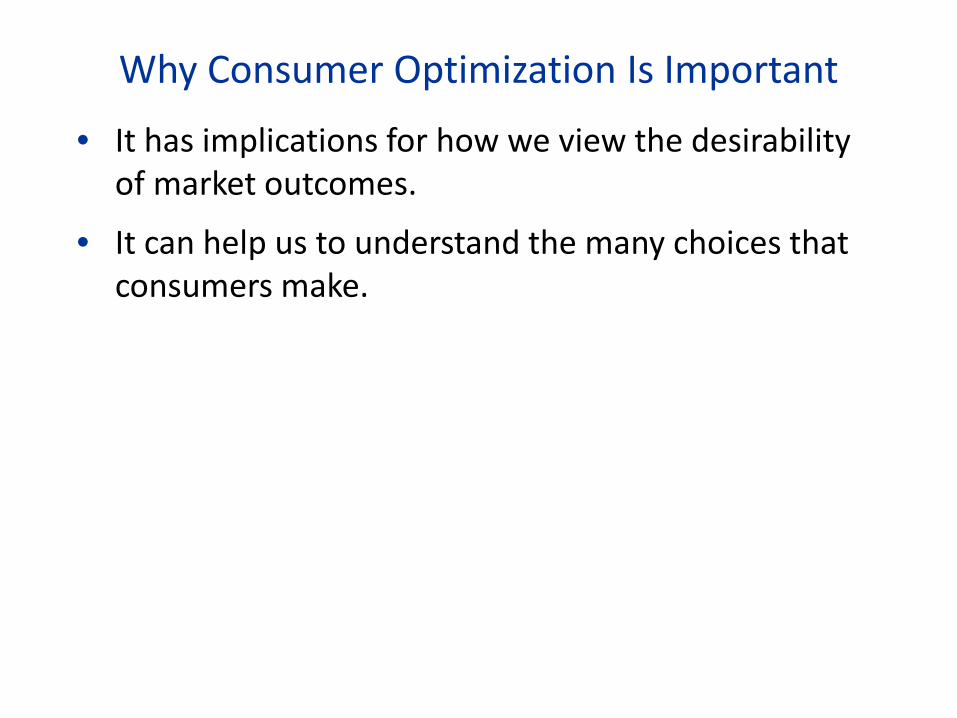
Why Consumer Optimization Is Important
• It has implications for how we view the desirability of market outcomes.
• It can help us to understand the many choices that consumers make.

II. THE BUDGET CONSTRAINT
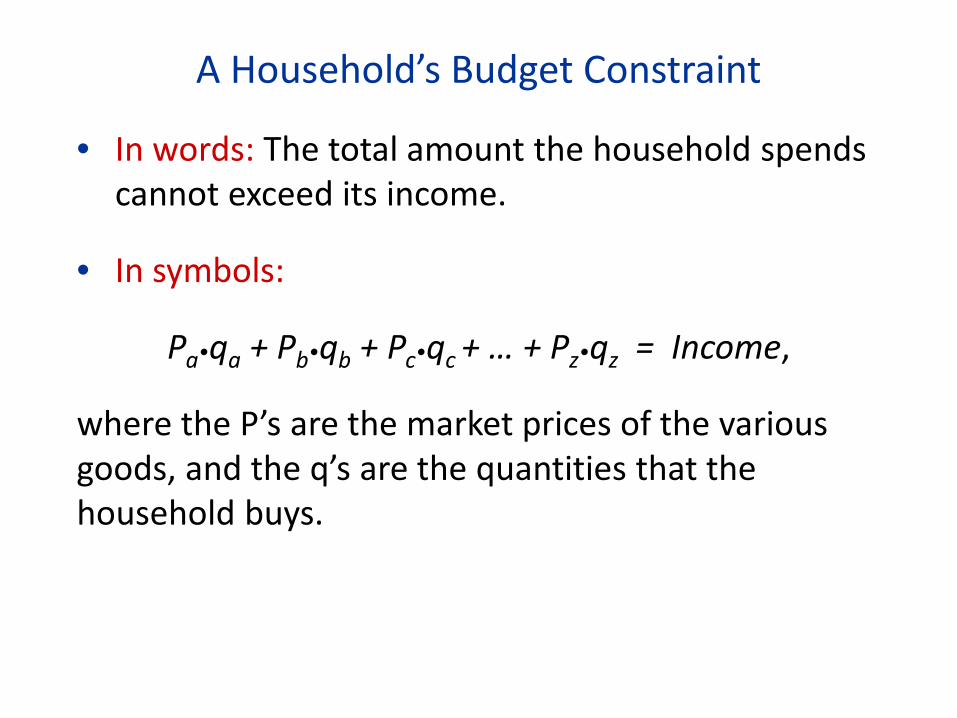
A Household’s Budget Constraint
• In words: The total amount the household spends cannot exceed its income.
• In symbols:
Pa•qa + Pb•qb + Pc•qc + … + Pz•qz = Income,
where the P’s are the market prices of the various goods, and the q’s are the quantities that the household buys.
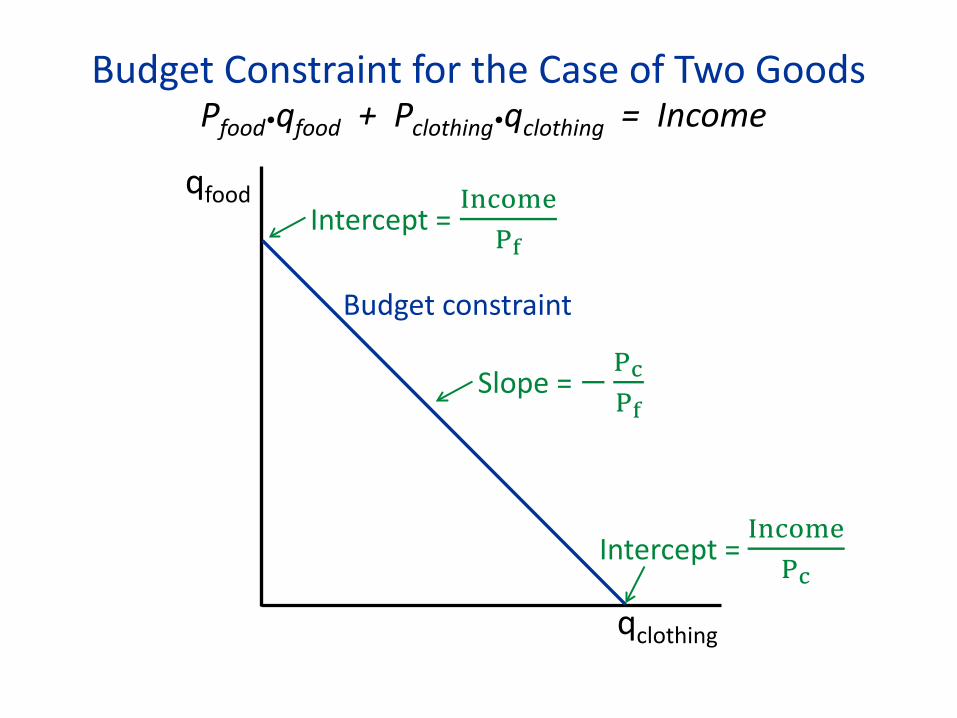
Budget Constraint for the Case of Two Goods Pfood•qfood + Pclothing•qclothing = Income
qclothing
qfood Intercept = Income
Pf
Slope = −PcPf
Intercept = IncomePc
Budget constraint
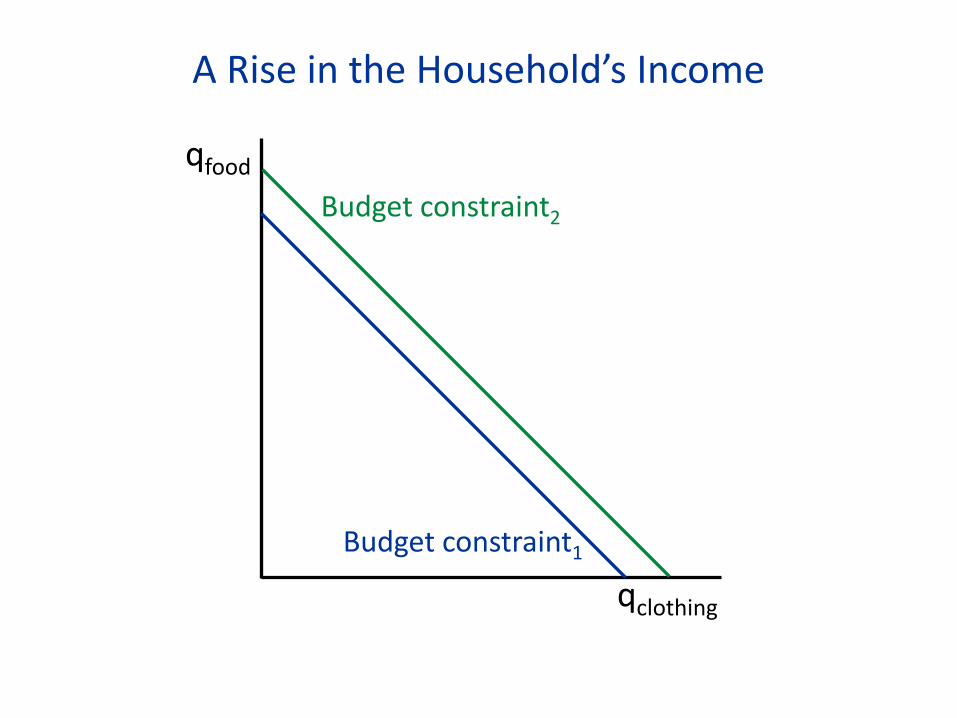
A Rise in the Household’s Income
qclothing
qfood
Budget constraint1
Budget constraint2
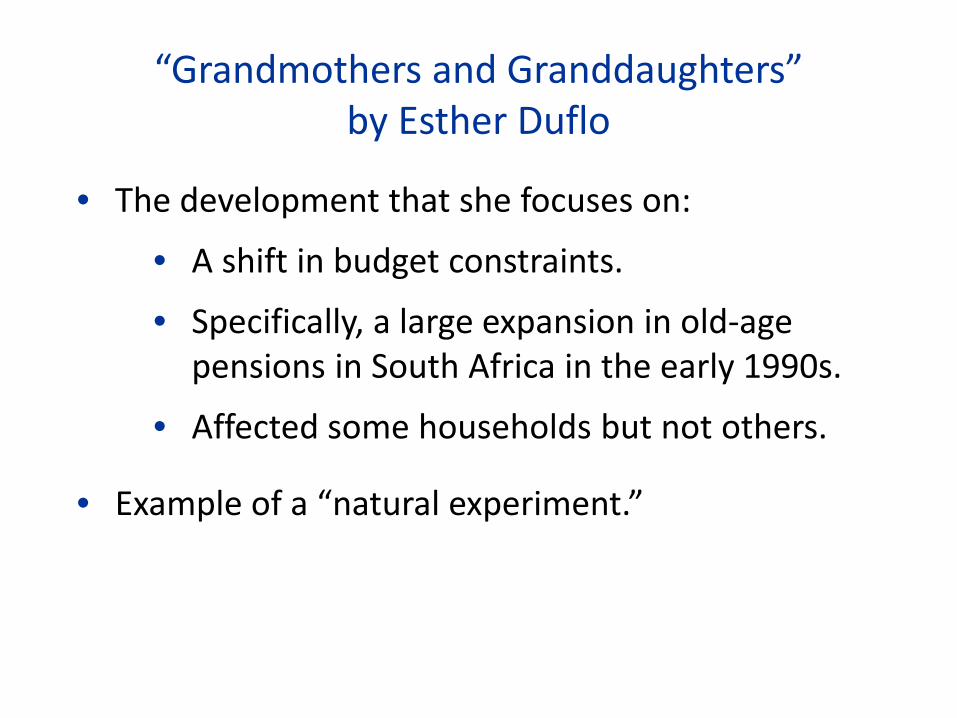
“Grandmothers and Granddaughters” by Esther Duflo
• The development that she focuses on:
• A shift in budget constraints.
• Specifically, a large expansion in old-age pensions in South Africa in the early 1990s.
• Affected some households but not others.
• Example of a “natural experiment.”
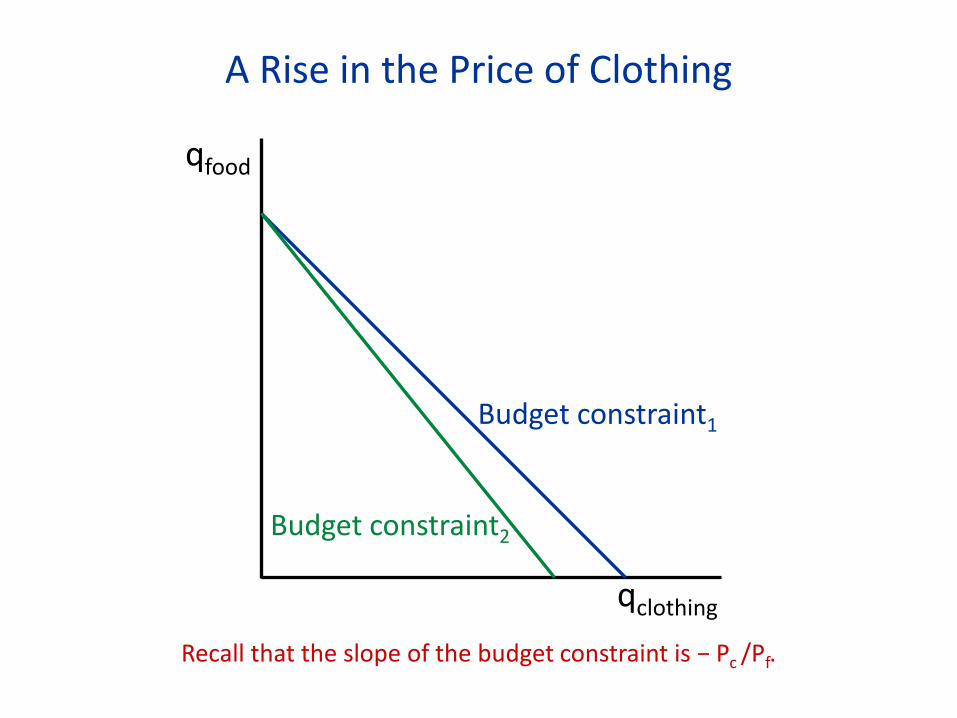
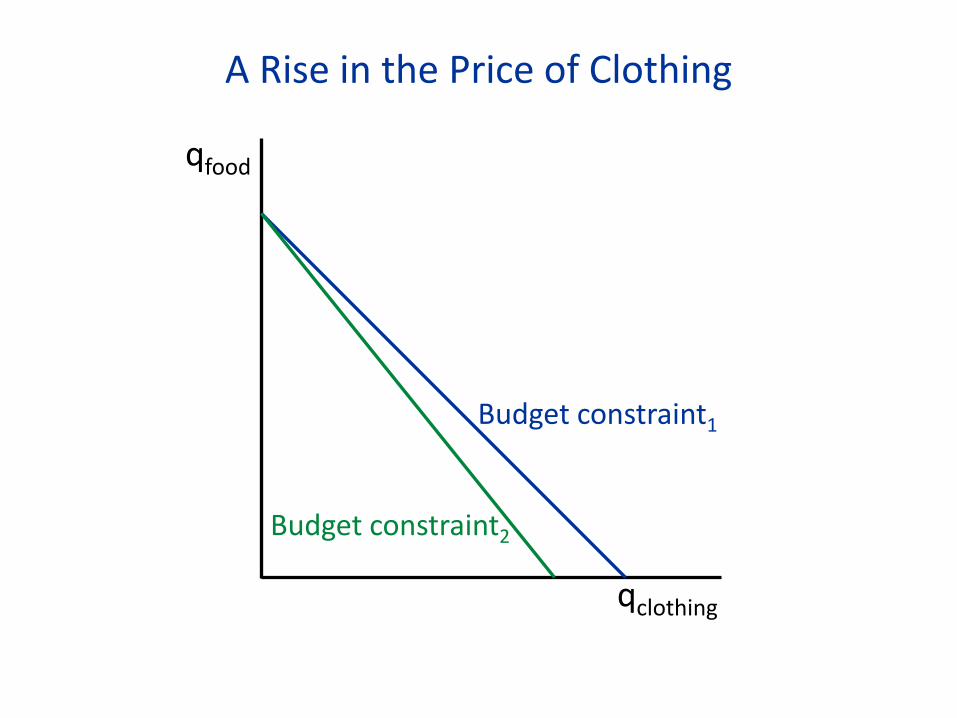
A Rise in the Price of Clothing
qclothing
qfood
Budget constraint1
Budget constraint2
Recall that the slope of the budget constraint is − Pc /Pf.

III. UTILITY MAXIMIZATION
What do we think consumers maximize?
• Happiness, satisfaction, utility.
• We don’t make judgments about what gives people happiness.
Utility
• Total Utility: The total happiness one gets from consuming some amount of a good.
• Marginal Utility: The extra utility derived from consuming one more unit of a good.
Diminishing Marginal Utility
• As a household consumes more of a good, the marginal utility of the good declines.
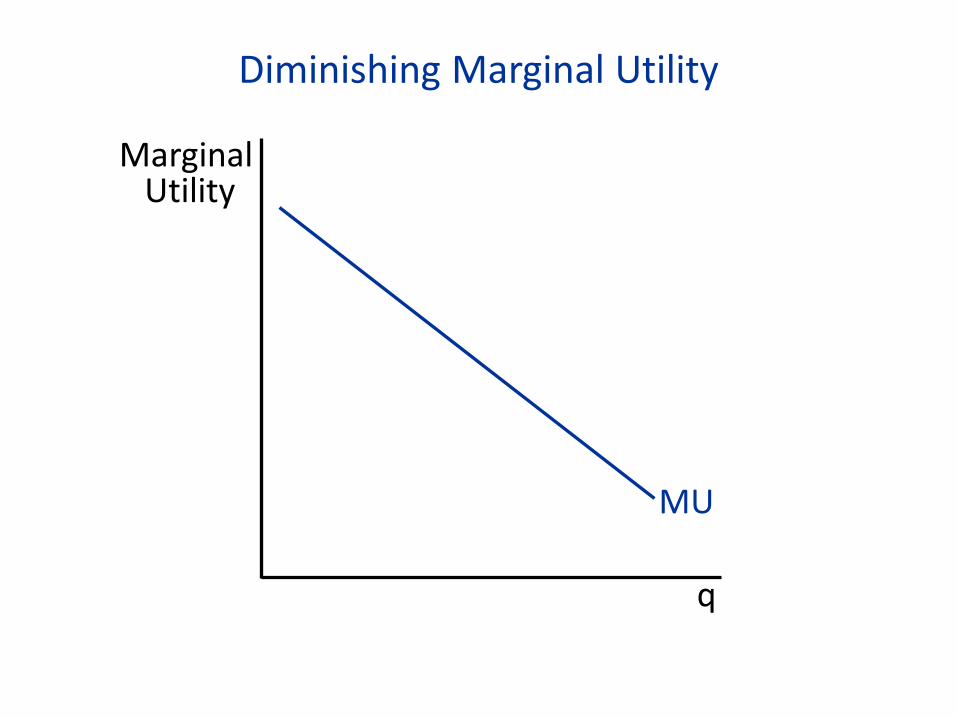
Diminishing Marginal Utility
q
Marginal Utility
MU
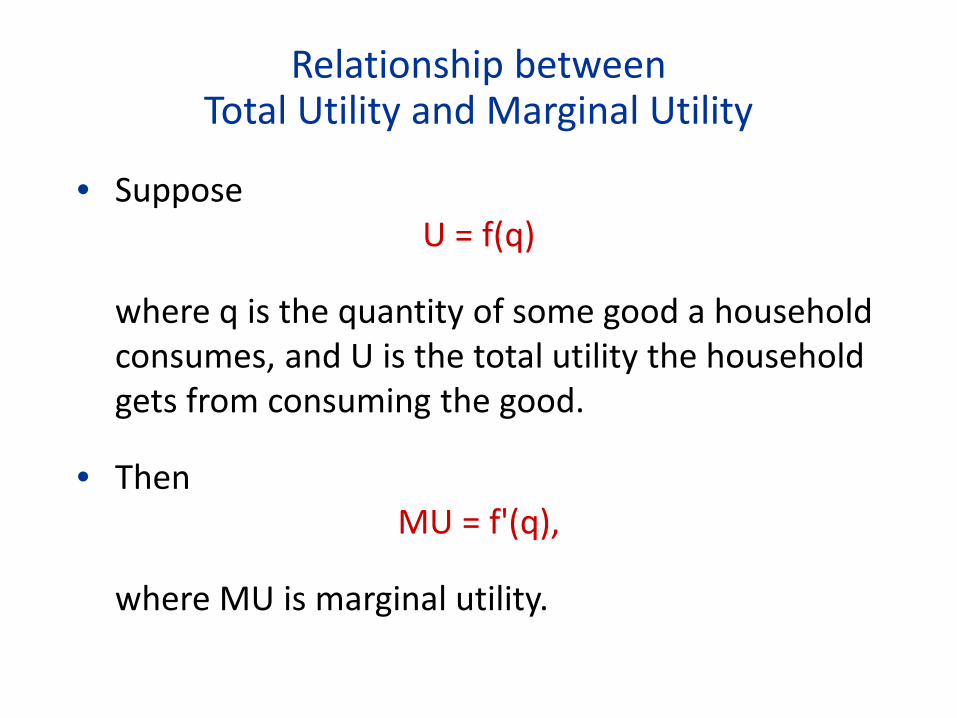
Relationship between Total Utility and Marginal Utility
• Suppose U = f(q)
where q is the quantity of some good a household consumes, and U is the total utility the household gets from consuming the good.
• Then MU = f'(q),
where MU is marginal utility.
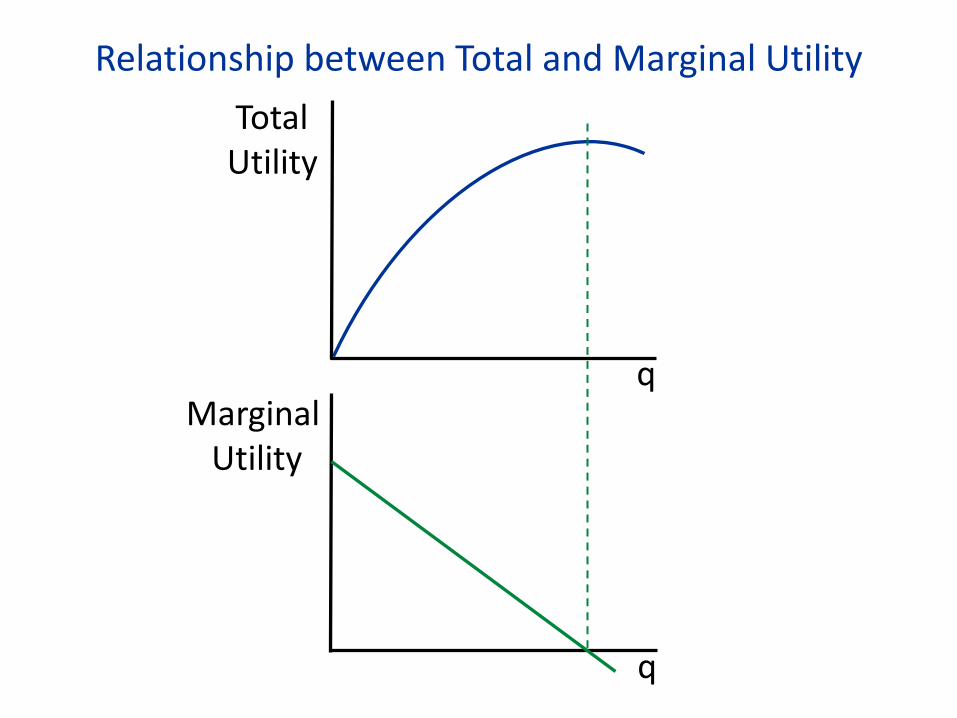
Relationship between Total and Marginal Utility
q
q
Total Utility
Marginal Utility
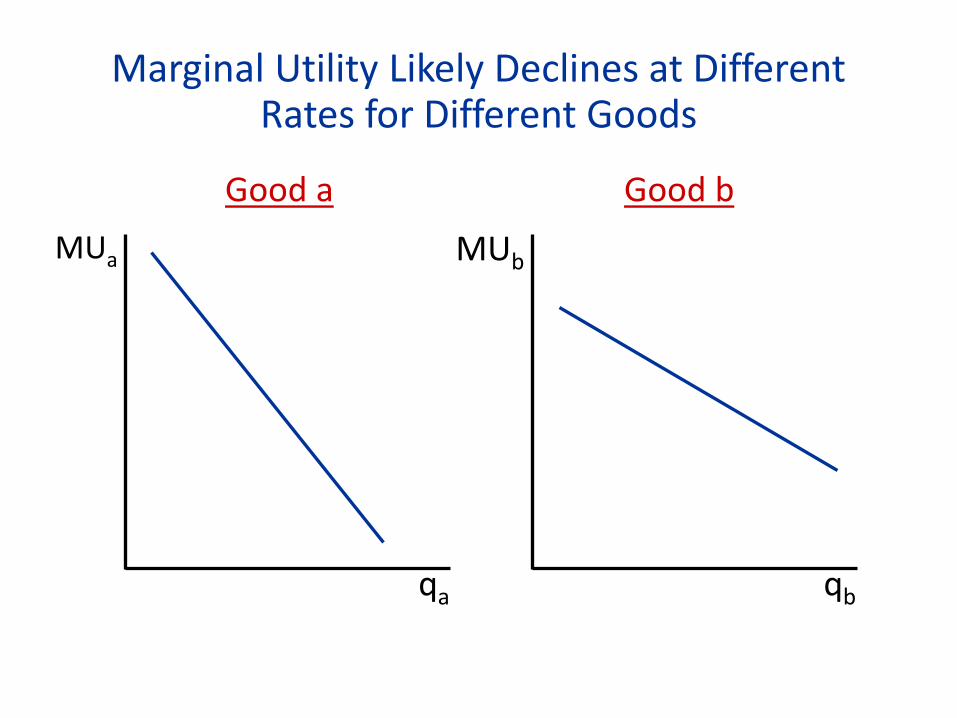
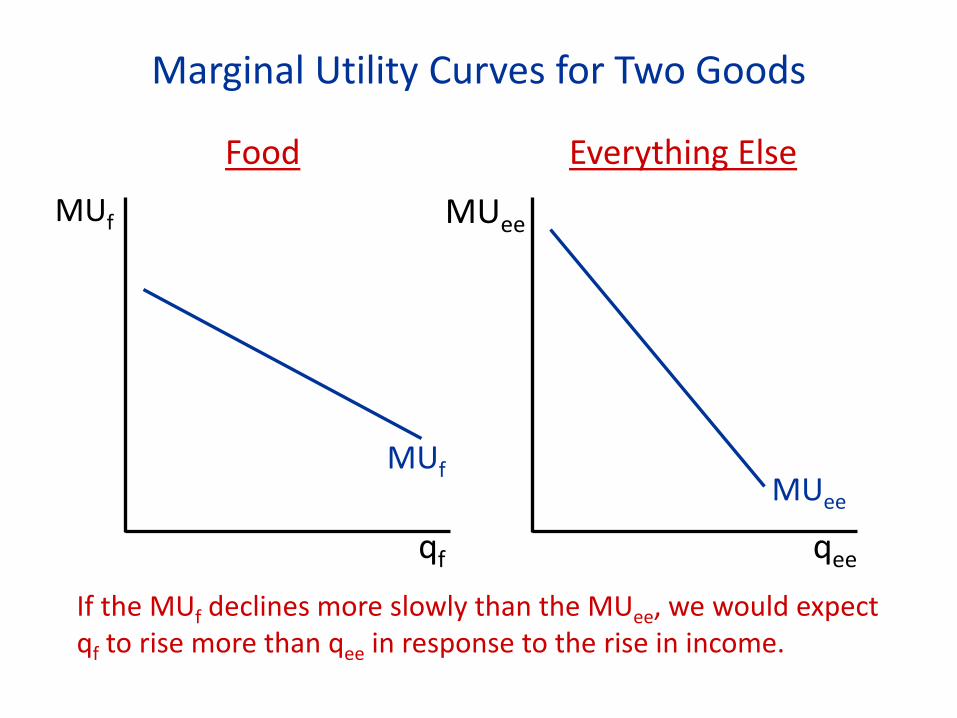
Marginal Utility Likely Declines at Different Rates for Different Goods
qa
MUa
qb
MUb
Good a Good b

The Condition for Utility Maximization (the Rational Spending Rule)
• A household is doing the best that it can—that is, it is maximizing its utility—if:
The marginal utility derived from spending one more dollar on a good is the same for all goods.
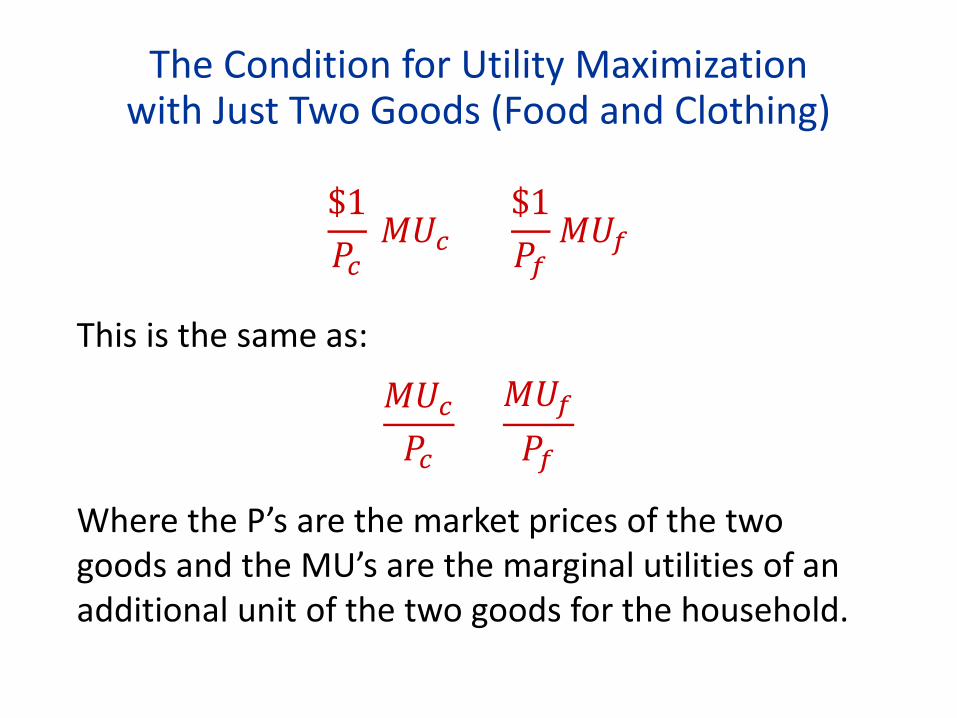
The Condition for Utility Maximization with Just Two Goods (Food and Clothing)
$1𝑃𝑐
𝑀𝑀𝑐 = $1𝑃𝑓
𝑀𝑀𝑓
This is the same as:
𝑀𝑀𝑐𝑃𝑐
=𝑀𝑀𝑓𝑃𝑓
Where the P’s are the market prices of the two goods and the MU’s are the marginal utilities of an additional unit of the two goods for the household.
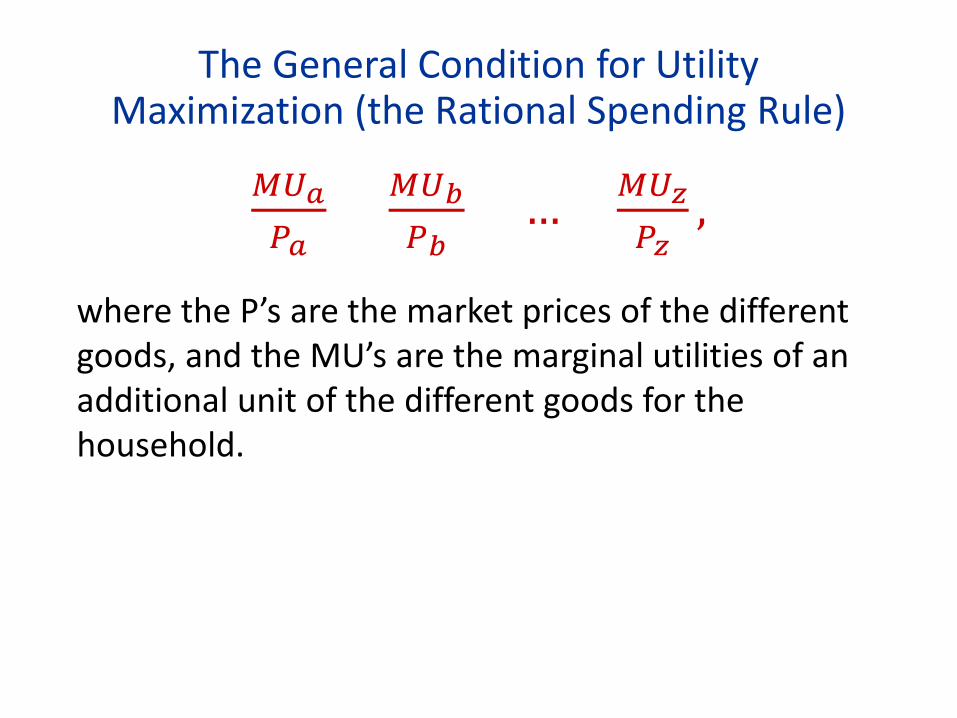
The General Condition for Utility Maximization (the Rational Spending Rule)
𝑀𝑀𝑎𝑃𝑎
= 𝑀𝑀𝑏𝑃𝑏
= … = 𝑀𝑀𝑧𝑃𝑧
,
where the P’s are the market prices of the different goods, and the MU’s are the marginal utilities of an additional unit of the different goods for the household.

IV. WHY DEMAND CURVES SLOPE DOWN

A Rise in the Price of Clothing • Suppose the household starts with:
𝑀𝑀𝑐𝑃𝑐
=𝑀𝑀𝑓𝑃𝑓
• If Pc rises, and the household didn’t change its purchases, then:
𝑀𝑀𝑐𝑃𝑐
<𝑀𝑀𝑓𝑃𝑓
• The household will need to buy less clothing (and more food) until:
𝑀𝑀𝑐𝑃𝑐
=𝑀𝑀𝑓𝑃𝑓
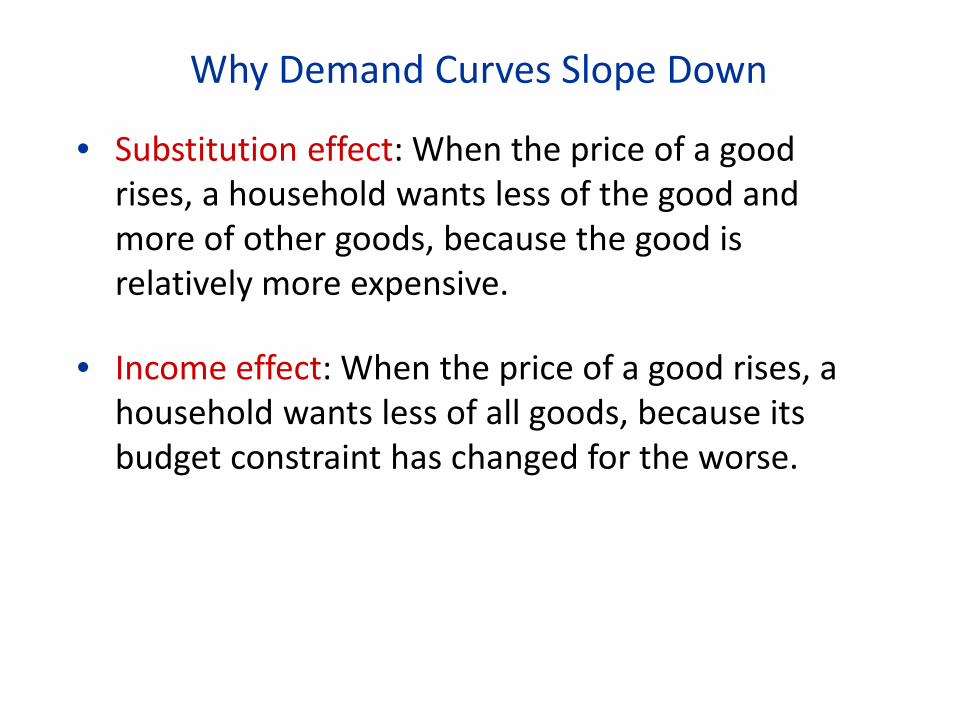
Why Demand Curves Slope Down
• Substitution effect: When the price of a good rises, a household wants less of the good and more of other goods, because the good is relatively more expensive.
• Income effect: When the price of a good rises, a household wants less of all goods, because its budget constraint has changed for the worse.
A Rise in the Price of Clothing
qclothing
qfood
Budget constraint1
Budget constraint2
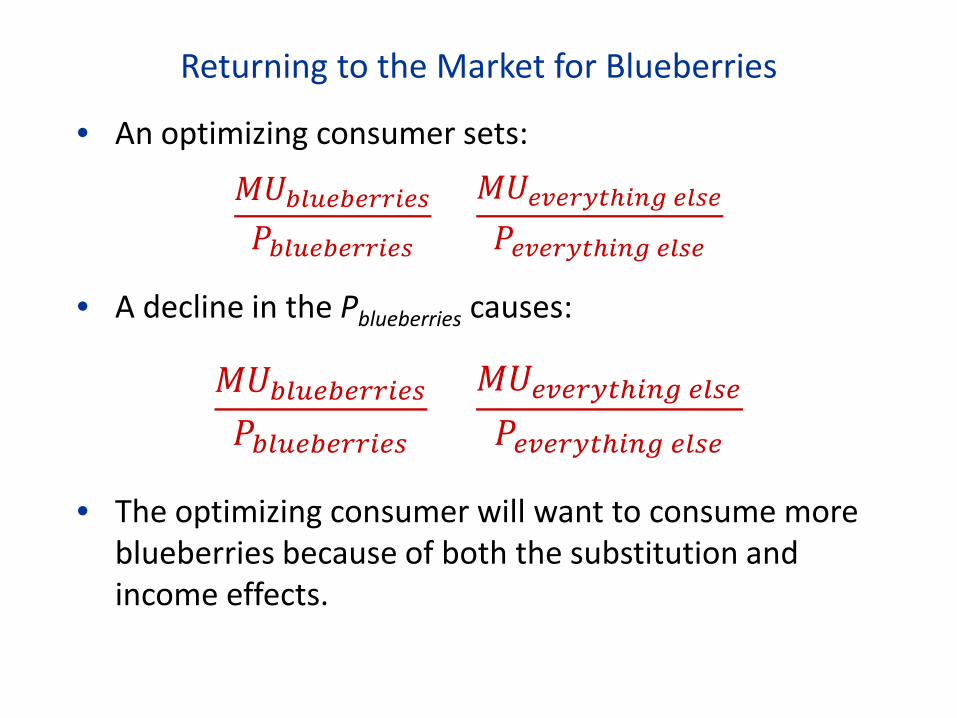
Returning to the Market for Blueberries
• An optimizing consumer sets:
𝑀𝑀𝑏𝑏𝑏𝑏𝑏𝑏𝑏𝑏𝑏𝑏𝑏𝑃𝑏𝑏𝑏𝑏𝑏𝑏𝑏𝑏𝑏𝑏𝑏
=𝑀𝑀𝑏𝑒𝑏𝑏𝑒𝑒𝑒𝑏𝑒𝑒 𝑏𝑏𝑏𝑏
𝑃𝑏𝑒𝑏𝑏𝑒𝑒𝑒𝑏𝑒𝑒 𝑏𝑏𝑏𝑏
• A decline in the Pblueberries causes:
𝑀𝑀𝑏𝑏𝑏𝑏𝑏𝑏𝑏𝑏𝑏𝑏𝑏𝑃𝑏𝑏𝑏𝑏𝑏𝑏𝑏𝑏𝑏𝑏𝑏
>𝑀𝑀𝑏𝑒𝑏𝑏𝑒𝑒𝑒𝑏𝑒𝑒 𝑏𝑏𝑏𝑏
𝑃𝑏𝑒𝑏𝑏𝑒𝑒𝑒𝑏𝑒𝑒 𝑏𝑏𝑏𝑏
• The optimizing consumer will want to consume more blueberries because of both the substitution and income effects.
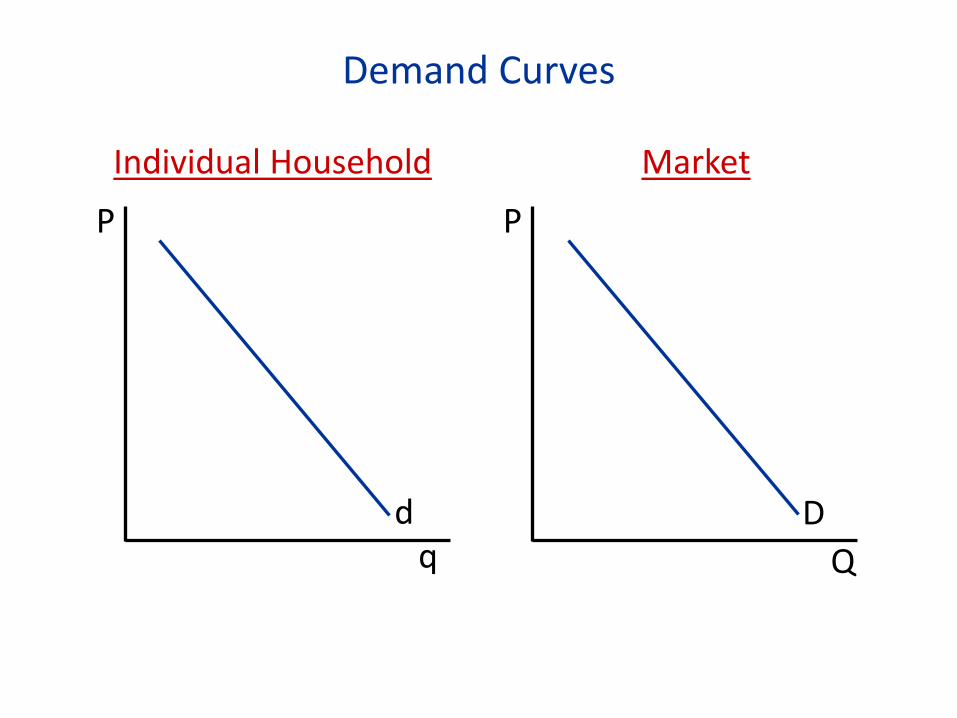
Demand Curves
q
P
Q
P
Individual Household Market
d D
Household and Market Demand Curves
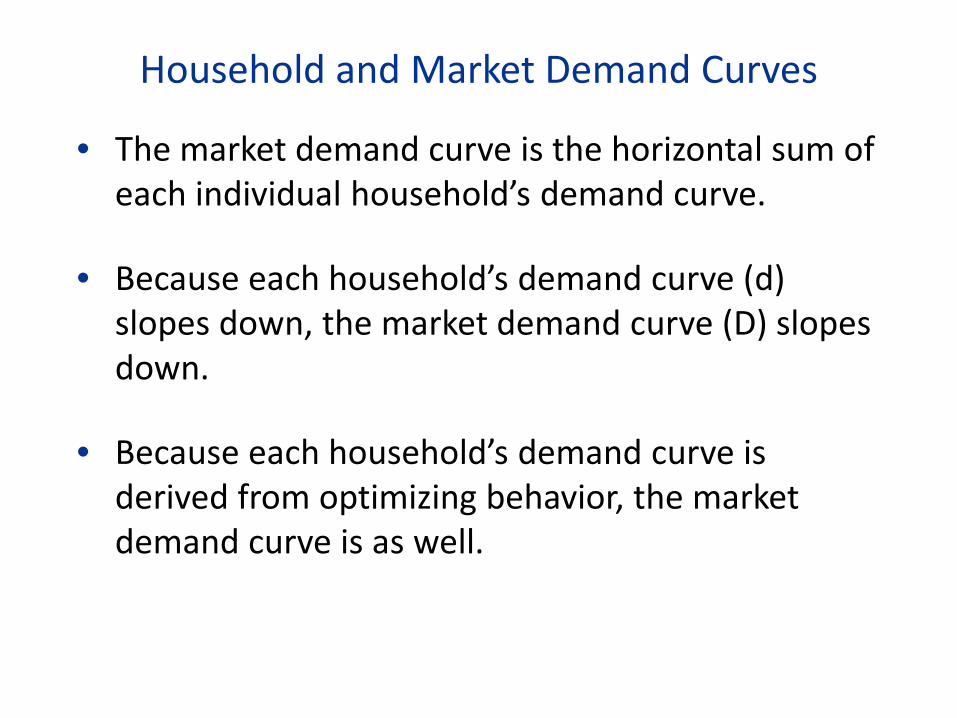
• The market demand curve is the horizontal sum of each individual household’s demand curve.
• Because each household’s demand curve (d) slopes down, the market demand curve (D) slopes down.
• Because each household’s demand curve is derived from optimizing behavior, the market demand curve is as well.

V. WHY DEMAND CURVES SHIFT

Blueberries may help prevent Alzheimer's, new research suggests 4:41PM GMT 13 Mar 2016
Scientists say the fruit is loaded with healthful antioxidants which could help prevent the effects of the increasingly common form of dementia Blueberries, already classified as a “superfruit” for its health boosting properties, could now also help fight dementia, new research suggests. The study shows the berry, which can potentially lower the risk of heart disease and cancer, could also be a weapon in the battle against Alzheimer's disease. Scientists say the fruit is loaded with healthful antioxidants which could help prevent the devastating effects of the increasingly common form of dementia. One study involved 47 adults aged 68 and older, who had mild cognitive impairment, a risk condition for Alzheimer’s disease.
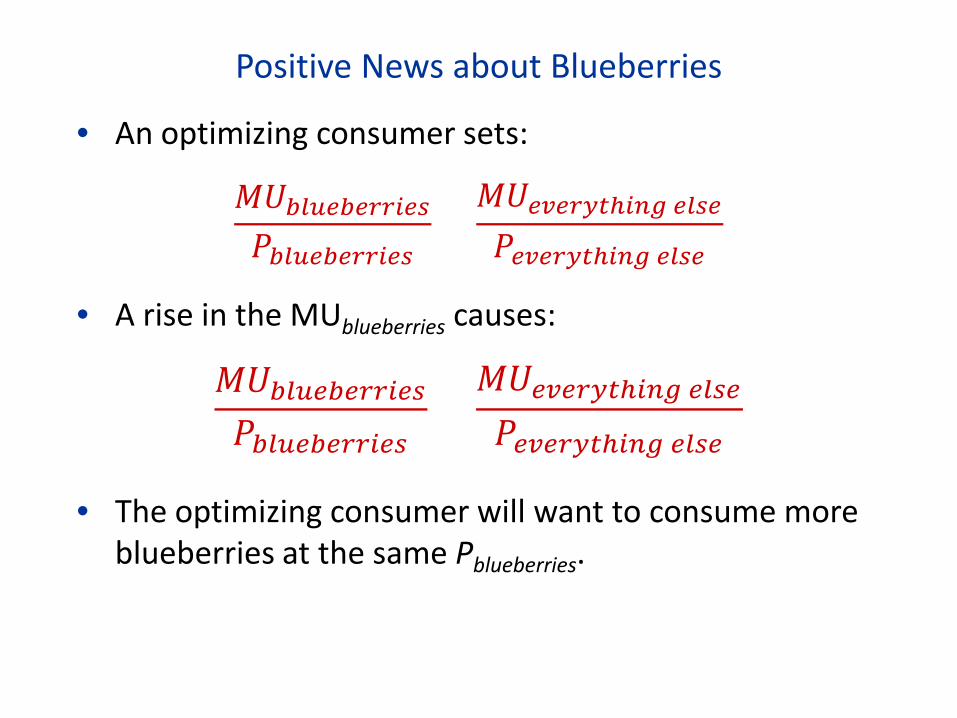
Positive News about Blueberries
• An optimizing consumer sets:
𝑀𝑀𝑏𝑏𝑏𝑏𝑏𝑏𝑏𝑏𝑏𝑏𝑏𝑃𝑏𝑏𝑏𝑏𝑏𝑏𝑏𝑏𝑏𝑏𝑏
=𝑀𝑀𝑏𝑒𝑏𝑏𝑒𝑒𝑒𝑏𝑒𝑒 𝑏𝑏𝑏𝑏
𝑃𝑏𝑒𝑏𝑏𝑒𝑒𝑒𝑏𝑒𝑒 𝑏𝑏𝑏𝑏
• A rise in the MUblueberries causes:
𝑀𝑀𝑏𝑏𝑏𝑏𝑏𝑏𝑏𝑏𝑏𝑏𝑏𝑃𝑏𝑏𝑏𝑏𝑏𝑏𝑏𝑏𝑏𝑏𝑏
>𝑀𝑀𝑏𝑒𝑏𝑏𝑒𝑒𝑒𝑏𝑒𝑒 𝑏𝑏𝑏𝑏
𝑃𝑏𝑒𝑏𝑏𝑒𝑒𝑒𝑏𝑒𝑒 𝑏𝑏𝑏𝑏
• The optimizing consumer will want to consume more blueberries at the same Pblueberries.
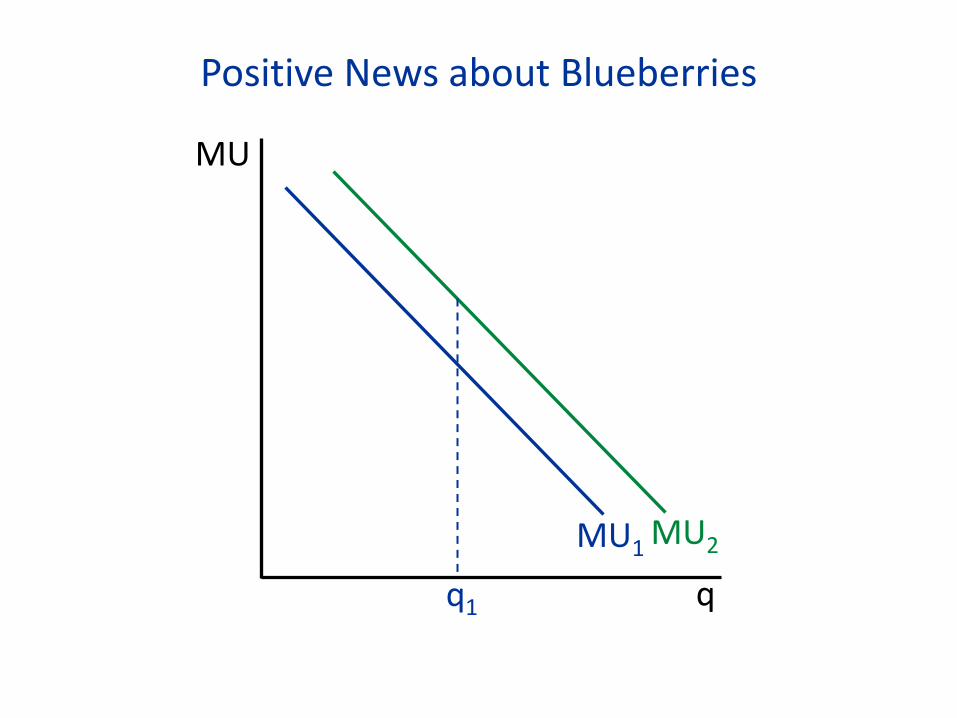
Positive News about Blueberries
q
MU
MU1 MU2
q1
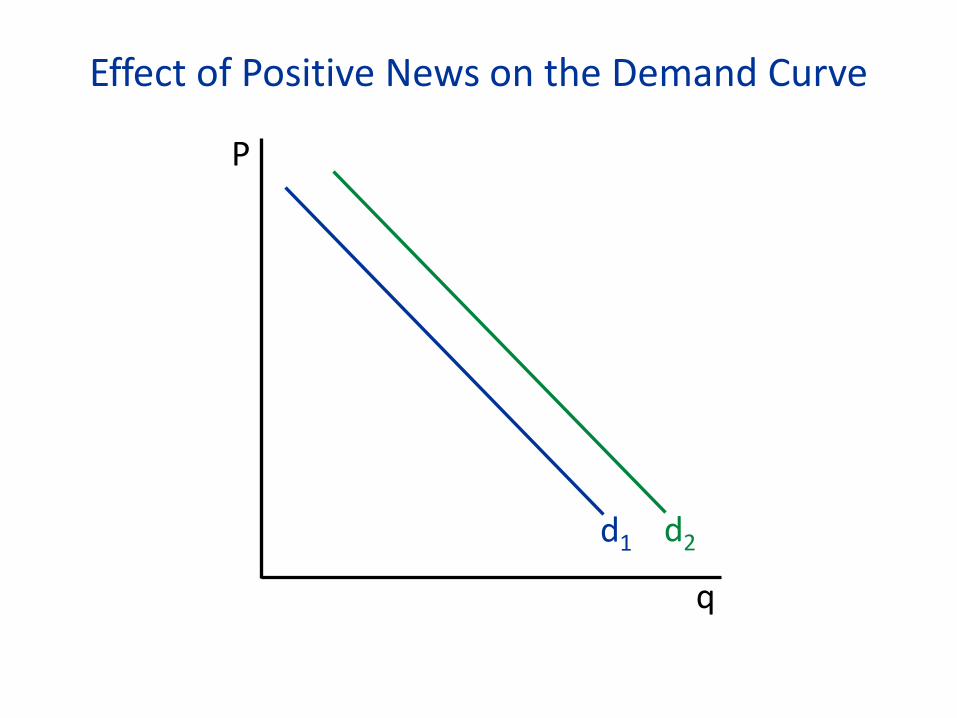
Effect of Positive News on the Demand Curve
q
P
d1 d2
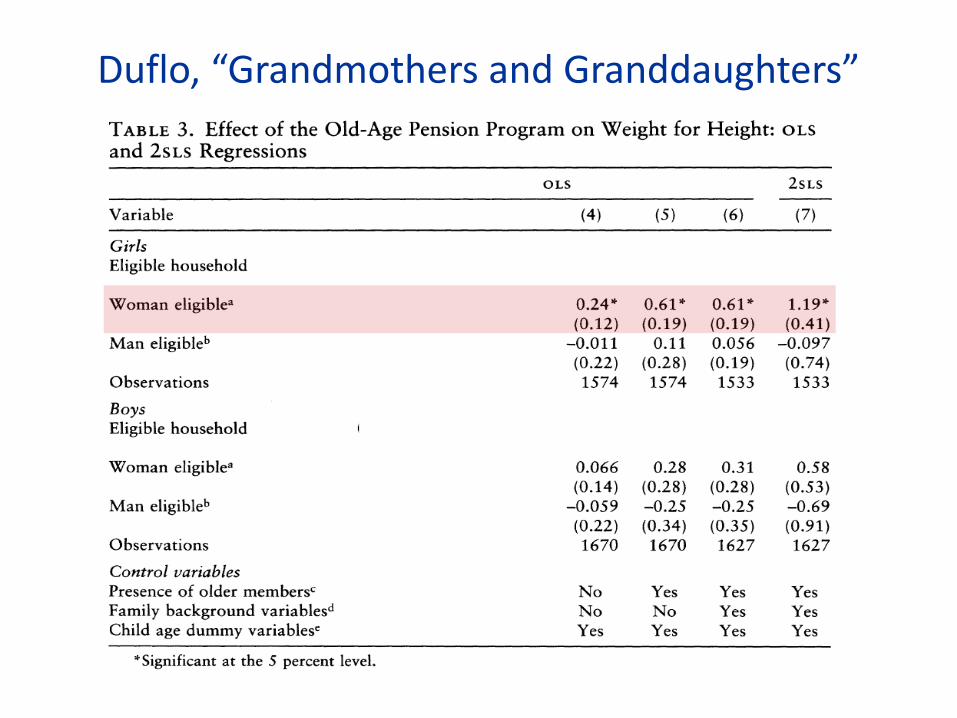
Duflo, “Grandmothers and Granddaughters”
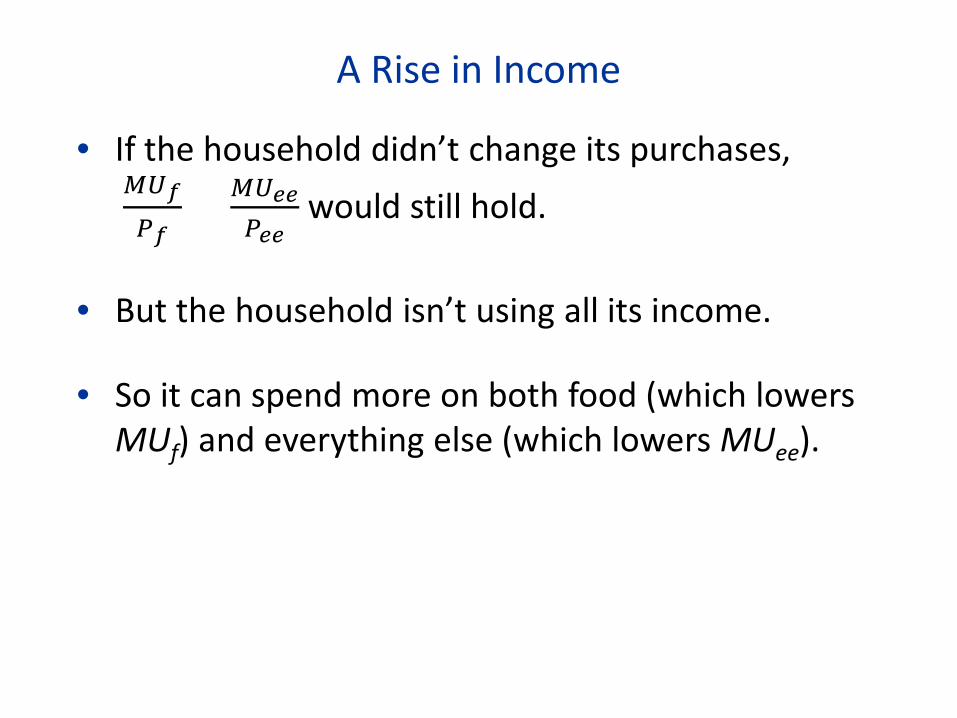
A Rise in Income
• If the household didn’t change its purchases, 𝑀𝑀𝑓𝑃𝑓
= 𝑀𝑀𝑒𝑒𝑃𝑒𝑒
would still hold.
• But the household isn’t using all its income.
• So it can spend more on both food (which lowers MUf) and everything else (which lowers MUee).
Marginal Utility Curves for Two Goods
qf
MUf
qee
MUee
Food Everything Else
MUf MUee
If the MUf declines more slowly than the MUee, we would expect qf to rise more than qee in response to the rise in income.
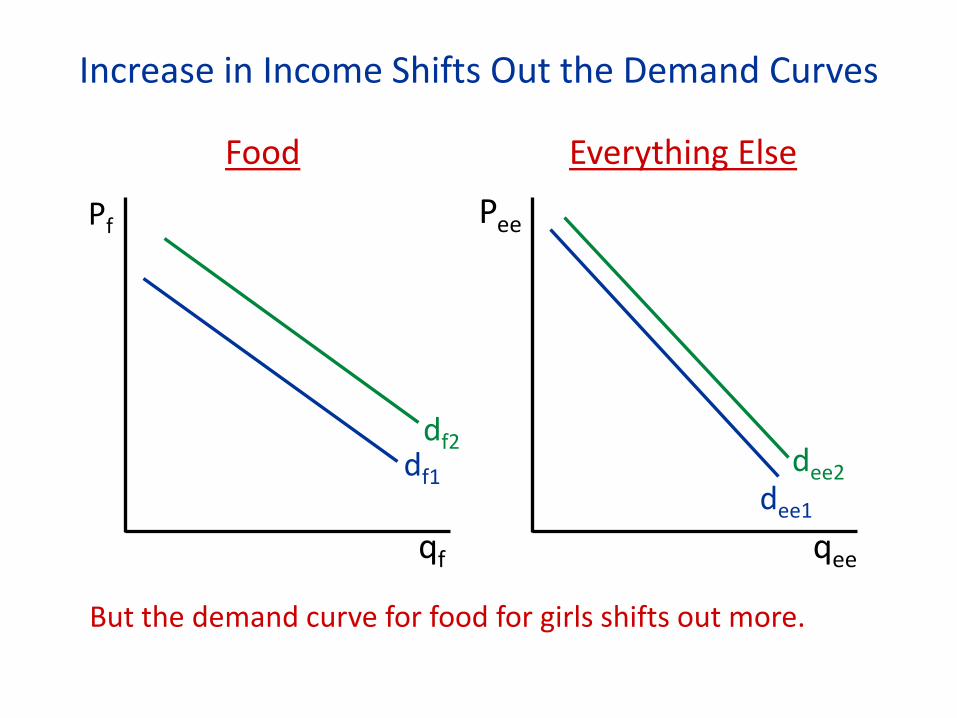
Increase in Income Shifts Out the Demand Curves
qf
Pf
qee
Pee
Food Everything Else
dee1
But the demand curve for food for girls shifts out more.
df2 df1 dee2