Embed Size (px)
Citation preview
8/7/2019 lecture 6- Final Managing Quality
http://slidepdf.com/reader/full/lecture-6-final-managing-quality 1/74
11
Operations ManagementOperations Management
Managing QualityManaging Quality
Muhammad Afaq Mazhar Muhammad Afaq Mazhar

8/7/2019 lecture 6- Final Managing Quality
http://slidepdf.com/reader/full/lecture-6-final-managing-quality 2/74
Group Making ExerciseGroup Making Exercise
andandassignment of projectassignment of project
22

8/7/2019 lecture 6- Final Managing Quality
http://slidepdf.com/reader/full/lecture-6-final-managing-quality 3/74
Ten OM Strategy DecisionsTen OM Strategy Decisions
DesignDesign of Goods and Servicesof Goods and Services
Managing QualityManaging Quality
Process StrategyProcess Strategy
Location StrategyLocation Strategy
Layout StrategyLayout Strategy
HR strategyHR strategy
Supply Chain StrategySupply Chain Strategy Inventory ManagementInventory Management
SchedulingScheduling
MaintenanceMaintenance

8/7/2019 lecture 6- Final Managing Quality
http://slidepdf.com/reader/full/lecture-6-final-managing-quality 4/74
44
OutlineOutline
History of TQMHistory of TQM
QUALITY AND STRATEGYQUALITY AND STRATEGY
DEFINING QUALITYDEFINING QUALITY�� Implications of QualityImplications of Quality
�� Malcolm Baldrige National Quality AwardMalcolm Baldrige National Quality Award
�� Cost of Quality (COQ)Cost of Quality (COQ)
INTERNATIONAL QUALITY STANDARDSINTERNATIONAL QUALITY STANDARDS
�� ISO 9000ISO 9000
�� ISO14000ISO14000
8/7/2019 lecture 6- Final Managing Quality
http://slidepdf.com/reader/full/lecture-6-final-managing-quality 5/74
55
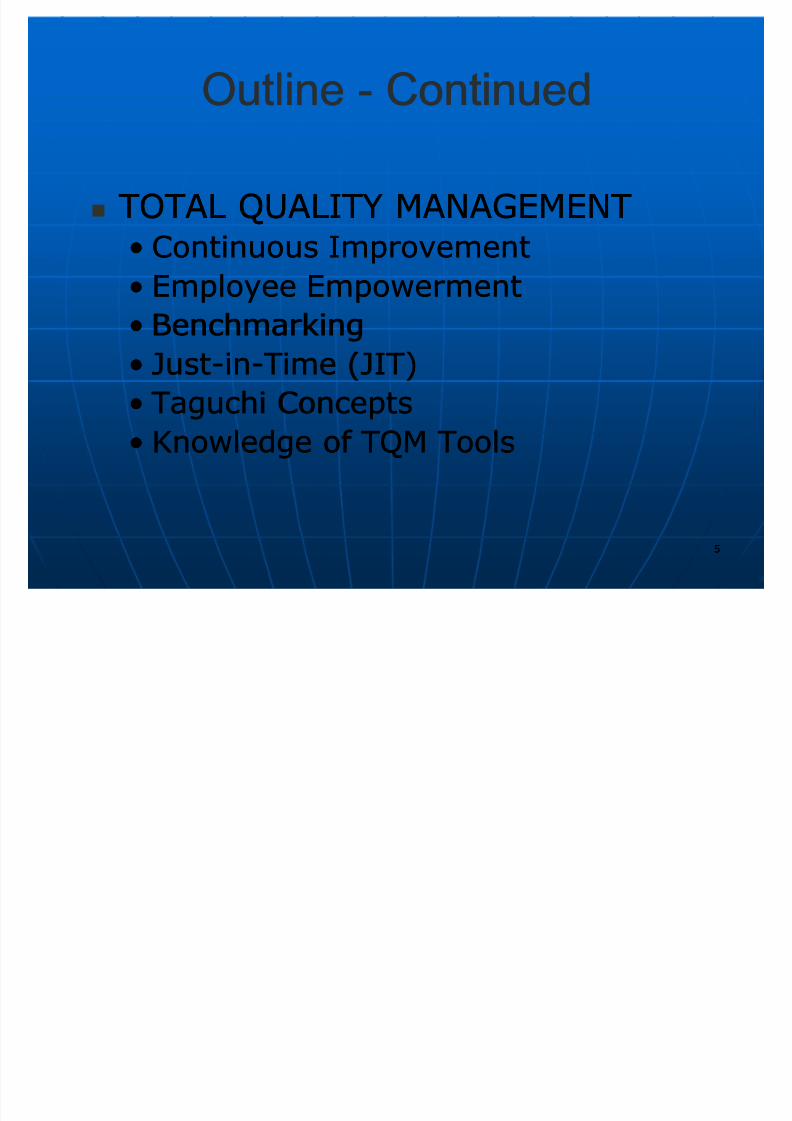
OutlineOutline -- ContinuedContinued
TOTAL QUALITY MANAGEMENTTOTAL QUALITY MANAGEMENT�� Continuous ImprovementContinuous Improvement
�� Employee EmpowermentEmployee Empowerment�� BenchmarkingBenchmarking
�� JustJust--inin--Time (JIT)Time (JIT)
�� Taguchi ConceptsTaguchi Concepts�� Knowledge of TQM ToolsKnowledge of TQM Tools

8/7/2019 lecture 6- Final Managing Quality
http://slidepdf.com/reader/full/lecture-6-final-managing-quality 6/74
66
OutlineOutline -- ContinuedContinued
TOOLS OF TQMTOOLS OF TQM�� Check sheetsCheck sheets
�� Scatter DiagramsScatter Diagrams�� CauseCause--andand--Effect DiagramEffect Diagram
�� Pareto ChartsPareto Charts
�� Flow ChartsFlow Charts
�� HistogramsHistograms
�� Statistical Process Control (SPC)Statistical Process Control (SPC)
8/7/2019 lecture 6- Final Managing Quality
http://slidepdf.com/reader/full/lecture-6-final-managing-quality 7/74
77
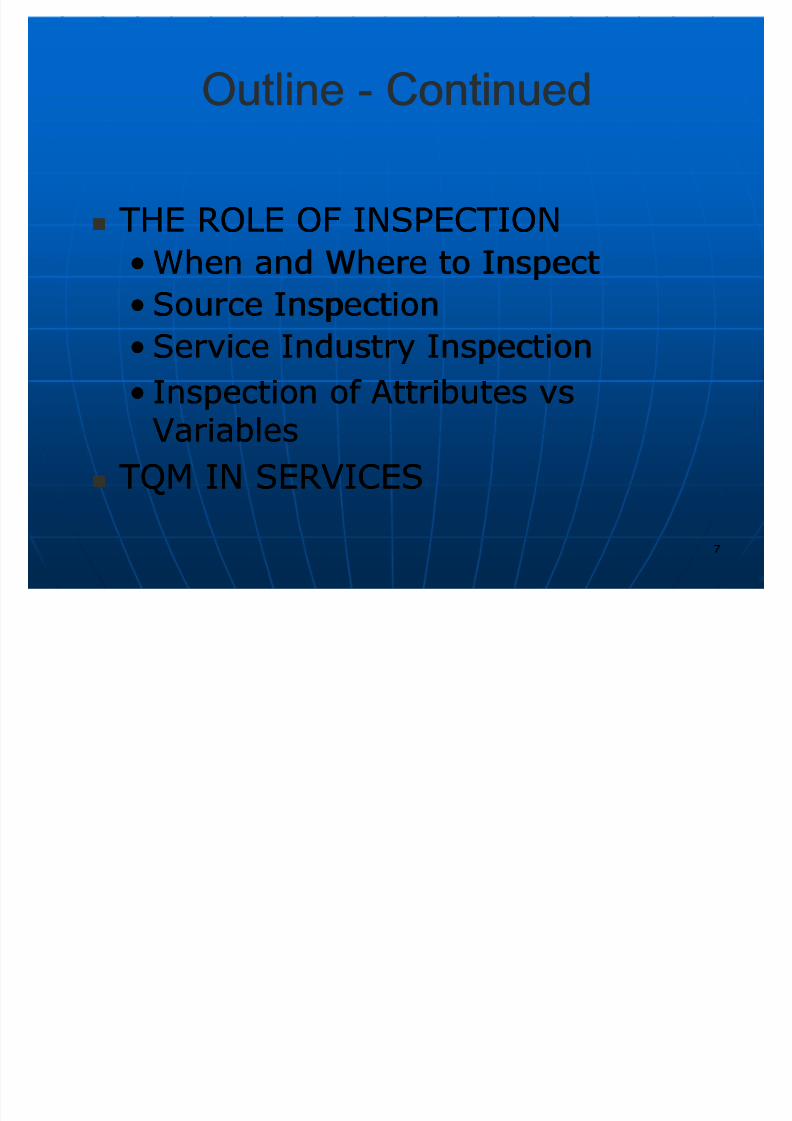
OutlineOutline -- ContinuedContinued
THE ROLE OF INSPECTIONTHE ROLE OF INSPECTION
�� When and Where to InspectWhen and Where to Inspect�� Source InspectionSource Inspection
�� Service Industry InspectionService Industry Inspection
�� Inspection of Attributes vsInspection of Attributes vsVariablesVariables
TQM IN SERVICESTQM IN SERVICES

8/7/2019 lecture 6- Final Managing Quality
http://slidepdf.com/reader/full/lecture-6-final-managing-quality 8/74
88
Learning ObjectivesLearning Objectives
When you complete this chapter, youWhen you complete this chapter, youshould be able to:should be able to:
Identify or DefineIdentify or Define::
�� QualityQuality
�� Malcolm Baldrige National QualityMalcolm Baldrige National Quality
AwardAward�� Taguchi ConceptsTaguchi Concepts

8/7/2019 lecture 6- Final Managing Quality
http://slidepdf.com/reader/full/lecture-6-final-managing-quality 9/74
99
Learning ObjectivesLearning Objectives -- continuedcontinued
When you complete this chapter, youWhen you complete this chapter, youshould be able to :should be able to :
ExplainExplain::�� Why quality is importantWhy quality is important
�� Total Quality Management (TQM)Total Quality Management (TQM)
�� Pareto chartsPareto charts
�� Process chartsProcess charts
�� Quality robust productsQuality robust products
�� InspectionInspection

8/7/2019 lecture 6- Final Managing Quality
http://slidepdf.com/reader/full/lecture-6-final-managing-quality 10/74
Defining QualityDefining Quality
TQM system are driven by identifyingTQM system are driven by identifyingand satisfying customer needsand satisfying customer needs
Adopted by American Society of Adopted by American Society of QualityQuality
�� Totality of features and characteristic of Totality of features and characteristic of production or services that bear on itsproduction or services that bear on its
ability to satisfy stated or impliedability to satisfy stated or impliedneeds.needs.
1010

8/7/2019 lecture 6- Final Managing Quality
http://slidepdf.com/reader/full/lecture-6-final-managing-quality 11/74
History of QualityHistory of Quality Roots of Total Quality Management (TQM) can be traced back toRoots of Total Quality Management (TQM) can be traced back to
early 1920s when statistical theory was first applied to productearly 1920s when statistical theory was first applied to productquality control.quality control.
Concept was further developed in Japan in the 40s led byConcept was further developed in Japan in the 40s led byAmericans, such as Deming,Americans, such as Deming, JuranJuran andand FeigenbaumFeigenbaum
InspectionInspection
�� In 1911, Frederick W. Taylor helped to satisfy this need.PublishedIn 1911, Frederick W. Taylor helped to satisfy this need.PublishedµThe Principles of Scientific Management¶ which provided aµThe Principles of Scientific Management¶ which provided a
framework for the effective use of people in industrial organisations.framework for the effective use of people in industrial organisations.One of Taylor¶s concepts was clearly defined tasks performed underOne of Taylor¶s concepts was clearly defined tasks performed understandard conditions. Inspection was one of these tasks andstandard conditions. Inspection was one of these tasks and
Was intended to ensure that no faulty product left the factory orWas intended to ensure that no faulty product left the factory orworkshopworkshop
Focuses on the product and the detection of problems in theFocuses on the product and the detection of problems in theproductproduct
Involves testing every item to ensure that it complies withInvolves testing every item to ensure that it complies withproduct specificationsproduct specifications
Is carried out at the end of the production process; and relies onIs carried out at the end of the production process; and relies on
specially trained inspectors.specially trained inspectors. 1111

8/7/2019 lecture 6- Final Managing Quality
http://slidepdf.com/reader/full/lecture-6-final-managing-quality 12/74
ContdContd«.«. Quality Control and Statistical TheoryQuality Control and Statistical Theory
�� Dr W.Dr W. ShewhartShewhart developed the application of statisticaldeveloped the application of statisticalmethods to the management of quality during 1920s.methods to the management of quality during 1920s.
�� Made the first modern control chart and demonstratedMade the first modern control chart and demonstratedthat variation in the production process leads tothat variation in the production process leads tovariation in productvariation in product
�� Statistical Quality ControlStatistical Quality Control focuses on product and the detection and control of quality problems;focuses on product and the detection and control of quality problems;
involves testing samples and statistically infers compliance of allinvolves testing samples and statistically infers compliance of allproducts;products;
is carried out at stages through the production process; andis carried out at stages through the production process; and
Relies on trained production personnel and quality controlRelies on trained production personnel and quality controlprofessionalsprofessionals
�� Shewart¶sShewart¶s work was later developed by Deming, Dodgework was later developed by Deming, Dodgeandand RomingRoming.. However, manufacturing companies didHowever, manufacturing companies didnot fully utilise these techniques until the late 1940snot fully utilise these techniques until the late 1940s
��1212

8/7/2019 lecture 6- Final Managing Quality
http://slidepdf.com/reader/full/lecture-6-final-managing-quality 13/74
ContdContd«..«.. Quality in JapanQuality in Japan
�� In 1940 invited a few quality gurus, such as Deming,In 1940 invited a few quality gurus, such as Deming, JuranJuran,,
andand FeigenbaumFeigenbaum to learn how to achieve produce innovativeto learn how to achieve produce innovativehigh quality productshigh quality products
�� In the 1950s, quality control and management developedIn the 1950s, quality control and management developedquickly and became a main theme of Japanese managementquickly and became a main theme of Japanese management
�� Quality circles started in the early 60sQuality circles started in the early 60s
�� A byA by--product of quality circles was employee motivation .product of quality circles was employee motivation .Workers felt that they were involved and heardWorkers felt that they were involved and heard
Total QualityTotal Quality
�� Term µtotal quality¶ was used for the first time in a paper byTerm µtotal quality¶ was used for the first time in a paper byFeigenbaumFeigenbaum at the first international conference on qualityat the first international conference on quality
control in Tokyo in 1969control in Tokyo in 1969�� Ishikawa also discussed µtotal quality control¶ in Japan, whichIshikawa also discussed µtotal quality control¶ in Japan, which
is different from the western idea of total quality. Accordingis different from the western idea of total quality. Accordingto his explanation, it means µcompanyto his explanation, it means µcompany--wide quality control¶ wide quality control¶ that involves all employees, from top management to thethat involves all employees, from top management to theworkers, in quality control.workers, in quality control.
1313

8/7/2019 lecture 6- Final Managing Quality
http://slidepdf.com/reader/full/lecture-6-final-managing-quality 14/74
Contd....Contd.... Total Quality ManagementTotal Quality Management
�� In the 1980s to the 1990s, a new phase of quality control andIn the 1980s to the 1990s, a new phase of quality control and
management began.management began.
�� A typical definition of TQM includes phrases such as: customerA typical definition of TQM includes phrases such as: customerfocus, the involvement of all employees, continuousfocus, the involvement of all employees, continuousimprovement and the integration of quality management intoimprovement and the integration of quality management intothe total organisation. Although the definitions were allthe total organisation. Although the definitions were all
similar, there was confusion. It was not clear what sort of similar, there was confusion. It was not clear what sort of practices, policies, and activities needed to be implemented topractices, policies, and activities needed to be implemented tofit the TQM definitionfit the TQM definition
Quality Awards and Excellence ModelsQuality Awards and Excellence Models
�� In 1988In 1988 development of the Malcolmdevelopment of the Malcolm BaldrigeBaldrige Award in theAward in the
United StatesUnited States�� Developed by the United States government to encourageDeveloped by the United States government to encourage
companies to adopt the model and improve theircompanies to adopt the model and improve theircompetitivenesscompetitiveness
�� Today, hundreds of quality awards and several models existToday, hundreds of quality awards and several models existall over the world. Like 'Excellenceall over the world. Like 'Excellence Models'Models'
14
14

8/7/2019 lecture 6- Final Managing Quality
http://slidepdf.com/reader/full/lecture-6-final-managing-quality 15/74
ContdContd«..«..
Business ExcellenceBusiness Excellence�� TQM models are often called Business ExcellenceTQM models are often called Business Excellence
Models. Also, TQM itself is now often calledModels. Also, TQM itself is now often calledBusiness Excellence. This is to distinguish the ³newBusiness Excellence. This is to distinguish the ³newTQM´ from the past work on TQM.TQM´ from the past work on TQM.
�� There was confusion as to what TQM was in the 80sThere was confusion as to what TQM was in the 80sand early 90s. This was because any businessand early 90s. This was because any businessimprovement programme was becoming calledimprovement programme was becoming calledTQM. Therefore, the name TQM became tarnishedTQM. Therefore, the name TQM became tarnished
�� Business Excellence is really the same as TQM, butBusiness Excellence is really the same as TQM, butwith a more clearly defined approachwith a more clearly defined approach
15
15

8/7/2019 lecture 6- Final Managing Quality
http://slidepdf.com/reader/full/lecture-6-final-managing-quality 16/74
16
16
Ways in Which Quality CanWays in Which Quality CanImprove ProductivityImprove Productivity
Sales GainsSales Gains�� Improved responseImproved response
�� HigherPricesHigherPrices�� Improved reputationImproved reputation
Reduced CostsReduced Costs
�� Increased productivityIncreased productivity�� Lower rework and scrapLower rework and scrap
costscosts�� Lower warranty costsLower warranty costs
Increased
Profits
Improved
Quality

8/7/2019 lecture 6- Final Managing Quality
http://slidepdf.com/reader/full/lecture-6-final-managing-quality 17/74
Flow of Activities for TQMFlow of Activities for TQM
Organizational Practice
Quality Principles
Employee fulfillment
Customer Satisfaction
1717

8/7/2019 lecture 6- Final Managing Quality
http://slidepdf.com/reader/full/lecture-6-final-managing-quality 18/74
1818
Organizational PracticesOrganizational Practices
LeadershipLeadership
Mission statementMission statement
Effective operating procedureEffective operating procedure Staff supportStaff support
TrainingTraining
Y iel ds: What is import ant and what Y iel ds: What is import ant and what is to be acc ompl ished is to be acc ompl ished

8/7/2019 lecture 6- Final Managing Quality
http://slidepdf.com/reader/full/lecture-6-final-managing-quality 19/74
1919
Quality PrinciplesQuality Principles
Customer focusCustomer focus
Continuous improvementContinuous improvement
Employee empowermentEmployee empowerment BenchmarkingBenchmarking
JustJust--inin--timetime
Tools of TQMTools of TQMY iel ds: How to do what is import ant Y iel ds: How to do what is import ant and to be acc ompl ished and to be acc ompl ished

8/7/2019 lecture 6- Final Managing Quality
http://slidepdf.com/reader/full/lecture-6-final-managing-quality 20/74
2020
Employment FulfillmentEmployment Fulfillment
EmpowermentEmpowerment
Organizational commitmentOrganizational commitment
Y iel ds: E mpl oyees¶ attitudes that Y iel ds: E mpl oyees¶ attitudes that they can acc ompl ish what isthey can acc ompl ish what isimport ant and to be acc ompl ished import ant and to be acc ompl ished

8/7/2019 lecture 6- Final Managing Quality
http://slidepdf.com/reader/full/lecture-6-final-managing-quality 21/74
2121
Customer SatisfactionCustomer Satisfaction
Winning ordersWinning orders
Repeat customersRepeat customers
Y iel ds: An effec tive organiz ationY iel ds: An effec tive organiz ationwith a c ompetitive adv ant agewith a c ompetitive adv ant age

8/7/2019 lecture 6- Final Managing Quality
http://slidepdf.com/reader/full/lecture-6-final-managing-quality 22/74
Implications of QualityImplications of Quality
Company ReputationCompany Reputation
Product LiabilityProduct Liability
�� Org held responsible for any defect inOrg held responsible for any defect inproductproduct
Global ImplicationGlobal Implication
�� Inferior products harm firm profitabilityInferior products harm firm profitability
and nation¶s balance of payment.and nation¶s balance of payment.
2222

8/7/2019 lecture 6- Final Managing Quality
http://slidepdf.com/reader/full/lecture-6-final-managing-quality 23/74
2323
OperationOperation
Reliability & durabilityReliability & durability
ConformanceConformance
ServiceabilityServiceability
AppearanceAppearance
Perceived qualityPerceived quality
Quality
Dimensions of Quality for Dimensions of Quality for
Goods
Goods

8/7/2019 lecture 6- Final Managing Quality
http://slidepdf.com/reader/full/lecture-6-final-managing-quality 24/74
2424
Award named at formalAward named at formal secysecy of commerceof commerce MalcomMalcomBaldrige.Baldrige.
Established in 1988 by the U.S. governmentEstablished in 1988 by the U.S. government
Designed to promote TQM practicesDesigned to promote TQM practices
Some criteria of judgingSome criteria of judging�� Senior executive leadership;Senior executive leadership;
�� strategic planning;strategic planning;
�� management. of process qualitymanagement. of process quality
�� Quality results;Quality results;
�� customer satisfactioncustomer satisfaction
Winners in 2002Winners in 2002
�� Motorola.; Xerox; AT&T; Eastman Chemical.Motorola.; Xerox; AT&T; Eastman Chemical.
MalcomMalcom Baldrige NationalBaldrige NationalQuality AwardQuality Award

8/7/2019 lecture 6- Final Managing Quality
http://slidepdf.com/reader/full/lecture-6-final-managing-quality 25/74
2525
Costs of QualityCosts of Quality
Prevention costsPrevention costs -- reducing thereducing thepotential for defectspotential for defects
Appraisal costsAppraisal costs -- evaluatingevaluatingproductsproducts
Internal failureInternal failure -- of producingof producingdefective parts or servicedefective parts or service
External costsExternal costs -- occur afteroccur afterdeliverydelivery

8/7/2019 lecture 6- Final Managing Quality
http://slidepdf.com/reader/full/lecture-6-final-managing-quality 26/74
2626
C osts of poor qual ity ³are huge, but C osts of poor qual ity ³are huge, but the amounts are not known withthe amounts are not known withprec ision. In most c ompanies, theprec ision. In most c ompanies, theacc ounting system provides onl y a acc ounting system provides onl y a
minority of the information needed tominority of the information needed toquantify this c ost of poor qual ity quantify this c ost of poor qual ity
Juran on Quality by DesignJuran on Quality by Design,, The Free PressThe Free Press
(1992), p. 119(1992), p. 119

8/7/2019 lecture 6- Final Managing Quality
http://slidepdf.com/reader/full/lecture-6-final-managing-quality 27/74
International Quality StandardsInternational Quality Standards
ISO 9000ISO 9000
Set of quality standards developed by ISOSet of quality standards developed by ISO
EstbEstb in 1981, 91 member nation published ain 1981, 91 member nation published aseries of quality standards, focusing onseries of quality standards, focusing on
�� Management procedureManagement procedure�� DocumentationDocumentation
�� Work instructionWork instruction
�� record keepingrecord keeping
�� Emphasis on Customer Satisfaction (ISO 9001Emphasis on Customer Satisfaction (ISO 9001-- 2000)2000)
9 to 18 Month process9 to 18 Month process
�� Documenting quality procedureDocumenting quality procedure
�� On site assessmentOn site assessment
�� Audit of product and servicesAudit of product and services2727

8/7/2019 lecture 6- Final Managing Quality
http://slidepdf.com/reader/full/lecture-6-final-managing-quality 28/74
2828
EC Environmental StandardEC Environmental StandardISO 14000ISO 14000
Core Elements:Core Elements:
�� Environmental managementEnvironmental management
�� AuditingAuditing
�� Performance evaluationPerformance evaluation
�� LabelingLabeling
�� LifeLife--cycle assessmentcycle assessment
AdvantagesAdvantages
�� Positive public image, reduce exposure to liabilityPositive public image, reduce exposure to liability
�� Pollution preventionPollution prevention
�� Regulatory requirementRegulatory requirement
�� Reduction in need for multiple auditReduction in need for multiple audit

8/7/2019 lecture 6- Final Managing Quality
http://slidepdf.com/reader/full/lecture-6-final-managing-quality 29/74
2929
International Quality StandardsInternational Quality Standards
Industrial Standard Z8101Industrial Standard Z8101--19811981(Japan)(Japan)
�� Specification for TQMSpecification for TQM ISO 9000 series (Europe/EC)ISO 9000 series (Europe/EC)
�� Common quality standards for productsCommon quality standards for productssold in Europe (even if made in U.S.)sold in Europe (even if made in U.S.)
ISO 14000 series (Europe/EC)ISO 14000 series (Europe/EC)�� Standards for recycling, labeling etc.Standards for recycling, labeling etc.
ASQC Q90 series; MILSTD (U.S.)ASQC Q90 series; MILSTD (U.S.)
8/7/2019 lecture 6- Final Managing Quality
http://slidepdf.com/reader/full/lecture-6-final-managing-quality 30/74
3030
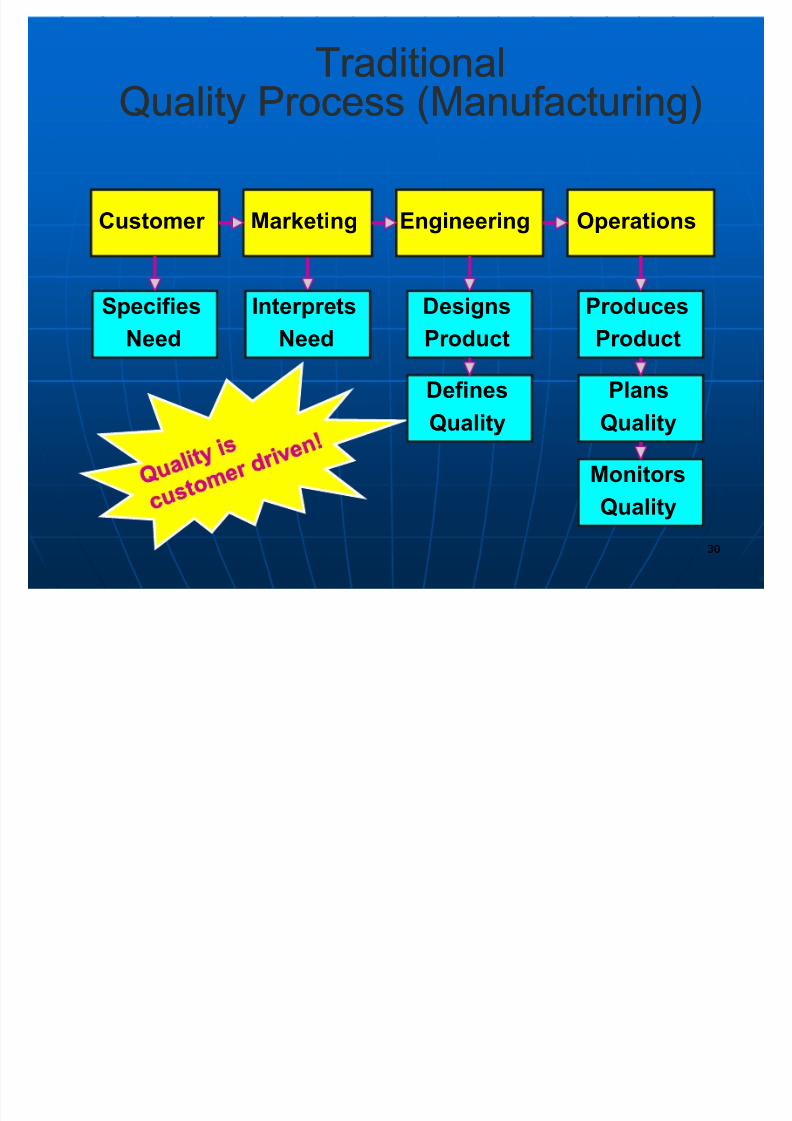
TraditionalTraditionalQuality Process (Manufacturing)Quality Process (Manufacturing)
Specifies
Need
Customer
Interprets
Need
Marketing
Designs
Pr oduct
Defines
Quality
Engineer ing
Pr oduces
Pr oduct
Plans
Quality
Monitors
Quality
Oper ations

8/7/2019 lecture 6- Final Managing Quality
http://slidepdf.com/reader/full/lecture-6-final-managing-quality 31/74
3131
TQMTQM
Encompasses entire organization,Encompasses entire organization,from supplier to customerfrom supplier to customer
Stresses a commitment byStresses a commitment bymanagement to have a continuing,management to have a continuing,companycompany--wide, drive towardwide, drive towardexcellence in all aspects of productsexcellence in all aspects of products
and services that are important toand services that are important tothe customer.the customer.

8/7/2019 lecture 6- Final Managing Quality
http://slidepdf.com/reader/full/lecture-6-final-managing-quality 32/74
3232
Total Quality Management (TQM)Total Quality Management (TQM)
Better to produce item right the firstBetter to produce item right the firsttime than to try to inspect quality intime than to try to inspect quality in
Quality at the sourceQuality at the source --responsibility shifted from qualityresponsibility shifted from qualitycontrol department to workerscontrol department to workers

8/7/2019 lecture 6- Final Managing Quality
http://slidepdf.com/reader/full/lecture-6-final-managing-quality 33/74
3333
Deming¶s Fourteen Points for TQMDeming¶s Fourteen Points for TQM
Create consistency of purposeCreate consistency of purpose
Lead to promote changeLead to promote change
Build quality into the productsBuild quality into the products Build long term relationshipsBuild long term relationships
Continuously improve product,Continuously improve product,
quality, and servicequality, and service Start trainingStart training
Emphasize leadershipEmphasize leadership

8/7/2019 lecture 6- Final Managing Quality
http://slidepdf.com/reader/full/lecture-6-final-managing-quality 34/74
3434
Deming¶s PointsDeming¶s Points -- continuedcontinued
Drive out fearDrive out fear
Break down barriers betweenBreak down barriers betweendepartmentsdepartments
Stop haranguing workersStop haranguing workers Support, help, improveSupport, help, improve
Remove barriers to pride in workRemove barriers to pride in work
Institute a vigorous program of Institute a vigorous program of education and self education and self--improvementimprovement
Put everybody in the company toPut everybody in the company towork on the transformationwork on the transformation
8/7/2019 lecture 6- Final Managing Quality
http://slidepdf.com/reader/full/lecture-6-final-managing-quality 35/74
3535
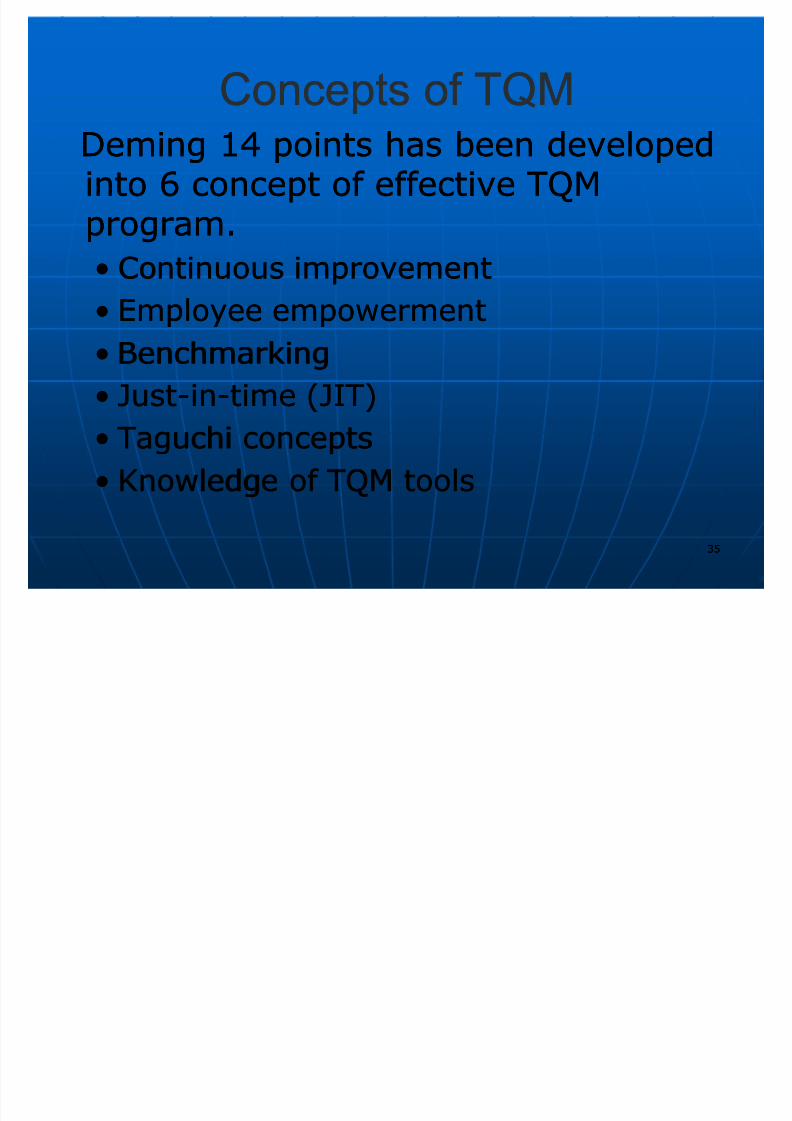
Concepts of TQMConcepts of TQM
Deming 14 points has been developedDeming 14 points has been developedinto 6 concept of effective TQMinto 6 concept of effective TQMprogram.program.
�� Continuous improvementContinuous improvement�� Employee empowermentEmployee empowerment
�� BenchmarkingBenchmarking
�� JustJust--inin--time (JIT)time (JIT)
�� Taguchi conceptsTaguchi concepts
�� Knowledge of TQM toolsKnowledge of TQM tools

8/7/2019 lecture 6- Final Managing Quality
http://slidepdf.com/reader/full/lecture-6-final-managing-quality 36/74
3636
Continuous ImprovementContinuous Improvement
Represents continualRepresents continualimprovement of process & improvement of process & customer satisfactioncustomer satisfaction
Involves all operationsInvolves all operations& work units& work units
Other namesOther names
�� PlanPlan--DoDo--CheckCheck--Act (PDCA)Act (PDCA)
�� Kaizen (Japanese)Kaizen (Japanese)
�� ZeroZero--defectsdefects
�� Six sigmaSix sigma
8/7/2019 lecture 6- Final Managing Quality
http://slidepdf.com/reader/full/lecture-6-final-managing-quality 37/74
3737
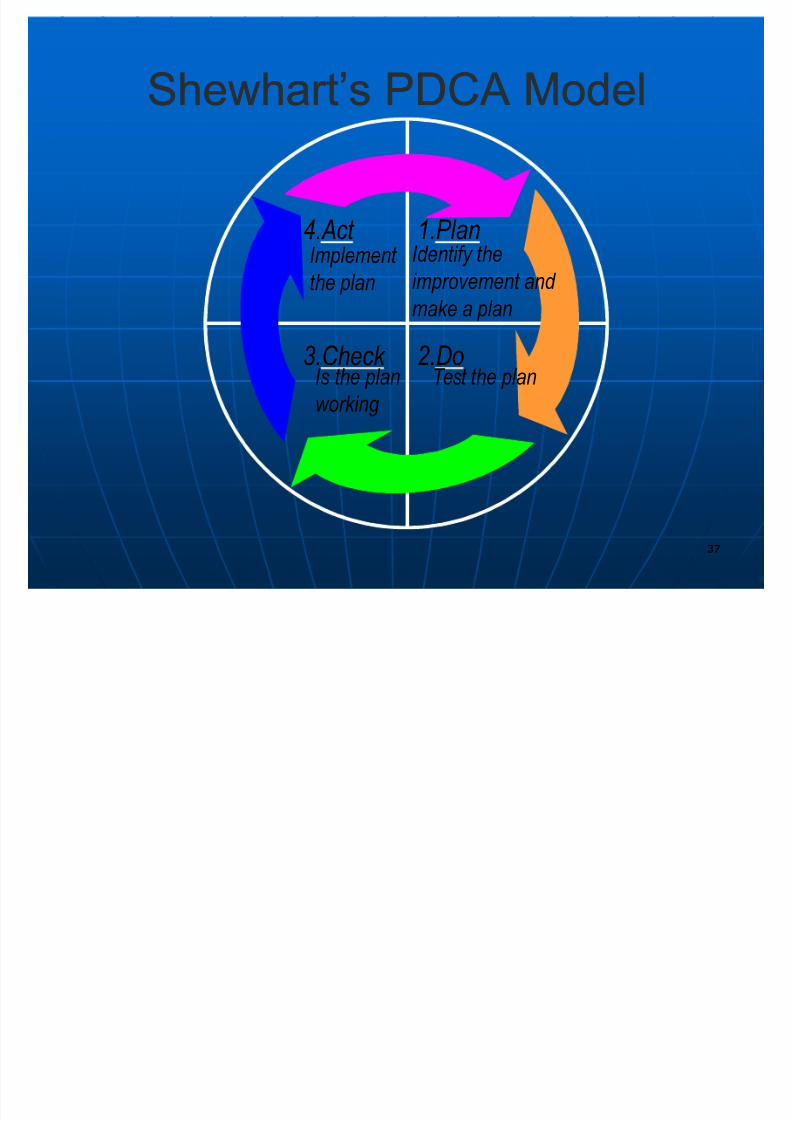
Shewhart¶sShewhart¶s PDCA ModelPDCA Model
4.Act 1.Plan
3.Check 2 .Do
Identify t he
improvement and make a plan
Test t he planIs t he plan
working
Implement
t he plan

8/7/2019 lecture 6- Final Managing Quality
http://slidepdf.com/reader/full/lecture-6-final-managing-quality 38/74
ContdContd«.«.
KaizenKaizen
�� The Japanese word for the ongoingThe Japanese word for the ongoing
process of incremental improvementprocess of incremental improvement
Six sigmaSix sigma
�� A quality program that yields 99.9997% A quality program that yields 99.9997%
accurate products and servicesaccurate products and services
3838

8/7/2019 lecture 6- Final Managing Quality
http://slidepdf.com/reader/full/lecture-6-final-managing-quality 39/74
3939
A Brief History of Six SigmaA Brief History of Six Sigma
The Six Sigma concept was developed byThe Six Sigma concept was developed byBill Smith, a senior engineer at Motorola,Bill Smith, a senior engineer at Motorola,in 1986 as a way to standardize the wayin 1986 as a way to standardize the waydefects were tallied.defects were tallied.
Sigma is the Greek symbol used inSigma is the Greek symbol used instatistics to refer to standard deviationstatistics to refer to standard deviationwhich is a measure of variation.which is a measure of variation.
Adding ³six´ to ³sigma´ combines aAdding ³six´ to ³sigma´ combines a
measure of process performance (measure of process performance (sigmasigma))with the goal of nearly perfect qualitywith the goal of nearly perfect quality((si x si x ).).

8/7/2019 lecture 6- Final Managing Quality
http://slidepdf.com/reader/full/lecture-6-final-managing-quality 40/74
4040
A Brief History of Six SigmaA Brief History of Six Sigma
In the popular bookIn the popular book The Six SigmaThe Six SigmaWay,Way, Six Sigma is defined as:Six Sigma is defined as:
�� a c omprehensive and f l ex ibl e system for a c omprehensive and f l ex ibl e system for
ac hieving, sust aining and max imizingac hieving, sust aining and max imizingbusiness succ ess. Si x Sigma is uniquel y business succ ess. Si x Sigma is uniquel y driven by cl ose underst anding of driven by cl ose underst anding of c ustomer needs, disc i pl ined use of f ac ts,c ustomer needs, disc i pl ined use of f ac ts,
d at a, and st atisti cal anal ysis, and di l igent d at a, and st atisti cal anal ysis, and di l igent attention to managing, improving, and attention to managing, improving, and reinventing business proc esses. ( p. x i)reinventing business proc esses. ( p. x i)

8/7/2019 lecture 6- Final Managing Quality
http://slidepdf.com/reader/full/lecture-6-final-managing-quality 41/74
4141
Employee EmpowermentEmployee Empowerment
Getting employees involved inGetting employees involved inproduct & processproduct & processimprovementsimprovements
�� 85% of quality problems are due85% of quality problems are dueto process & materialto process & material
TechniquesTechniques
�� Support workersSupport workers�� Let workers make decisionsLet workers make decisions
�� Build teams & quality circlesBuild teams & quality circles

8/7/2019 lecture 6- Final Managing Quality
http://slidepdf.com/reader/full/lecture-6-final-managing-quality 42/74
4242
Quality CirclesQuality Circles
Group of 6Group of 6--12 employees from12 employees fromsame work areasame work area
Meet regularly to solve workMeet regularly to solve work--related problemsrelated problems
�� 4 hours/month4 hours/month
Facilitator trains & helpsFacilitator trains & helpswith meetingswith meetings

8/7/2019 lecture 6- Final Managing Quality
http://slidepdf.com/reader/full/lecture-6-final-managing-quality 43/74
4343
BenchmarkingBenchmarking
Benchmarking involves comparing anBenchmarking involves comparing anorganization's processes with the bestorganization's processes with the bestpractices to be found. Benchmarkingpractices to be found. Benchmarkingis used for a variety of purposes,is used for a variety of purposes,including:including:
�� Comparing an organization's processesComparing an organization's processeswith the best organization's processes.with the best organization's processes.
�� Comparing an organization's productsComparing an organization's productsand services with those of otherand services with those of otherorganizations.organizations.

8/7/2019 lecture 6- Final Managing Quality
http://slidepdf.com/reader/full/lecture-6-final-managing-quality 44/74
4444
BenchmarkingBenchmarking
Identifying the best practices toIdentifying the best practices toimplement.implement.
Projecting trends in order to be ableProjecting trends in order to be ableto respond proactively to futureto respond proactively to futurechallenges and opportunities.challenges and opportunities.

8/7/2019 lecture 6- Final Managing Quality
http://slidepdf.com/reader/full/lecture-6-final-managing-quality 45/74
4545
BenchmarkingBenchmarking
How to Benchmark?How to Benchmark?
�� Determine what to benchmarkDetermine what to benchmark
�� Form a benchmark teamForm a benchmark team
�� Identify benchmarking partnersIdentify benchmarking partners�� Collect and analyze benchmarkingCollect and analyze benchmarking
informationinformation
�� Take action to match or exceed theTake action to match or exceed thebenchmarkbenchmark

8/7/2019 lecture 6- Final Managing Quality
http://slidepdf.com/reader/full/lecture-6-final-managing-quality 46/74
4646
Resolving Customer ComplaintsResolving Customer Complaints
Best PracticesBest Practices
Make it easy for clients to complainMake it easy for clients to complain
Respond quickly to complaintsRespond quickly to complaints Resolve complaints on the first contactResolve complaints on the first contact
Use computers to manage complaintsUse computers to manage complaints
Recruit the best for customer serviceRecruit the best for customer servicejobsjobs
8/7/2019 lecture 6- Final Managing Quality
http://slidepdf.com/reader/full/lecture-6-final-managing-quality 47/74
4747
JustJust--inin--Time (JIT)Time (JIT)
Relationship to quality:Relationship to quality:
�� JIT cuts cost of qualityJIT cuts cost of quality
�� JIT improves qualityJIT improves quality
�� Better quality means less inventoryBetter quality means less inventoryand better, easierand better, easier--toto--employ JITemploy JITsystemsystem

8/7/2019 lecture 6- Final Managing Quality
http://slidepdf.com/reader/full/lecture-6-final-managing-quality 48/74
4848
JustJust--inin--Time (JIT)Time (JIT)
µPull¶ system of production/purchasingµPull¶ system of production/purchasing
�� Customer starts production with anCustomer starts production with anorderorder
Involves µvendor partnership programs¶ Involves µvendor partnership programs¶ to improve quality of purchased itemsto improve quality of purchased items
Reduces all inventory levelsReduces all inventory levels
�� Inventory hides process & materialInventory hides process & materialproblemsproblems
Improves process & product qualityImproves process & product quality

8/7/2019 lecture 6- Final Managing Quality
http://slidepdf.com/reader/full/lecture-6-final-managing-quality 49/74
4949
JustJust--InIn--Time (JIT) ExampleTime (JIT) Example
S crapS crap
Work in process inventory level Work in process inventory level
( hides problems)( hides problems)
UnreliableUnreliable
VendorsVendors
C apacity C apacity
ImbalancesImbalances

8/7/2019 lecture 6- Final Managing Quality
http://slidepdf.com/reader/full/lecture-6-final-managing-quality 50/74
5050
JustJust--InIn--Time (JIT) ExampleTime (JIT) Example
S crapS crap
Reducing inventory revealsReducing inventory reveals
problems so t hey can be solved .problems so t hey can be solved .
UnreliableUnreliable
VendorsVendors
C apacity C apacity
ImbalancesImbalances

8/7/2019 lecture 6- Final Managing Quality
http://slidepdf.com/reader/full/lecture-6-final-managing-quality 51/74
5151
Tools for TQMTools for TQM
Quality Function DeploymentQuality Function Deployment�� House of QualityHouse of Quality
Taguchi techniqueTaguchi technique
Quality loss functionQuality loss function
Pareto chartsPareto charts
Process chartsProcess charts
CauseCause--andand--effect diagramseffect diagrams
Statistical process controlStatistical process control

8/7/2019 lecture 6- Final Managing Quality
http://slidepdf.com/reader/full/lecture-6-final-managing-quality 52/74
5252
Taguchi TechniquesTaguchi Techniques
Experimental design methods toExperimental design methods toimprove product & process designimprove product & process design
�� Identify key component & processIdentify key component & process
variables affecting product variationvariables affecting product variation TaguchiTaguchi C onc eptsC onc epts
�� Quality robustnessQuality robustness
�� Quality loss functionQuality loss function�� Target specificationsTarget specifications
8/7/2019 lecture 6- Final Managing Quality
http://slidepdf.com/reader/full/lecture-6-final-managing-quality 53/74
5353
AbilityAbility toto produceproduceproductsproducts uniformlyuniformlyregardlessregardless of of
manufacturingmanufacturingconditionsconditions
PutPut robustnessrobustness ininHouseHouse of of QualityQuality
matricesmatrices besidesbesidesfunctionalityfunctionality
© 1984-1994 T/Maker Co.
© 1995 Corel Corp.
Quality RobustnessQuality Robustness
8/7/2019 lecture 6- Final Managing Quality
http://slidepdf.com/reader/full/lecture-6-final-managing-quality 54/74
5454
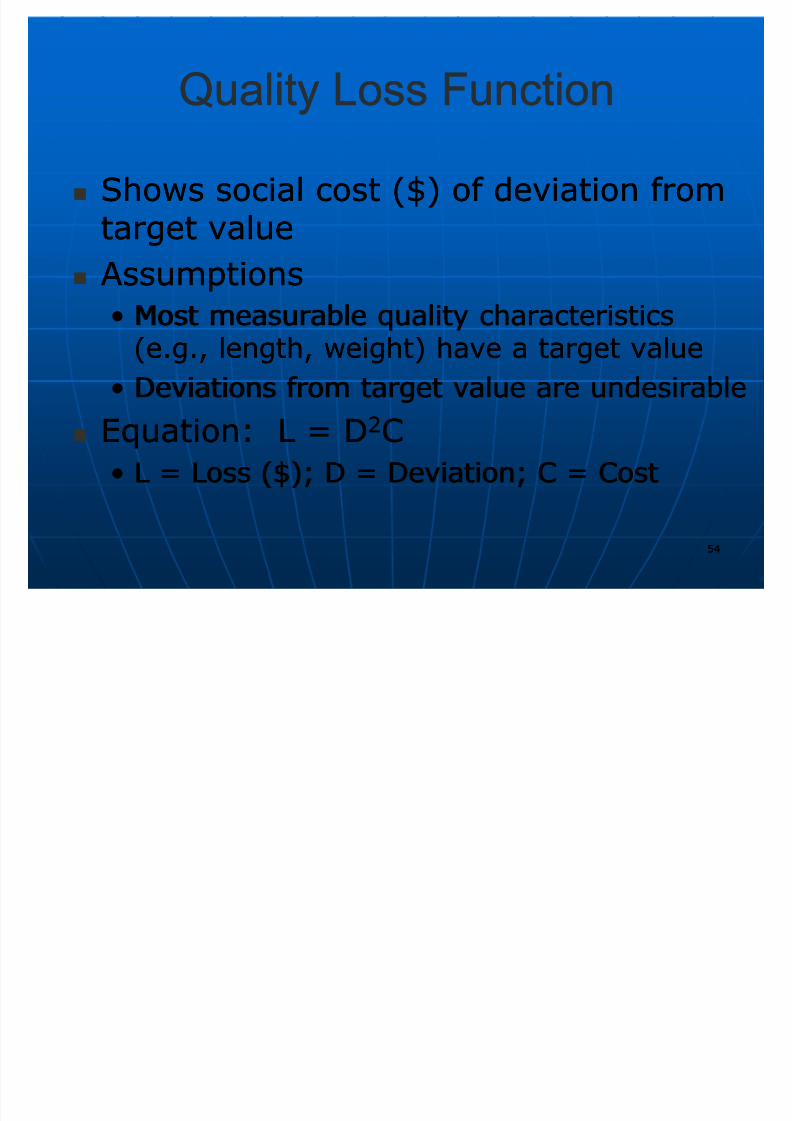
Shows social cost ($) of deviation fromShows social cost ($) of deviation fromtarget valuetarget value
AssumptionsAssumptions�� Most measurable quality characteristicsMost measurable quality characteristics
(e.g., length, weight) have a target value(e.g., length, weight) have a target value
�� Deviations from target value are undesirableDeviations from target value are undesirable
Equation: L = DEquation: L = D22CC�� L = Loss ($); D = Deviation; C = CostL = Loss ($); D = Deviation; C = Cost
Quality Loss FunctionQuality Loss Function
S T l f TQMS T l f TQM

8/7/2019 lecture 6- Final Managing Quality
http://slidepdf.com/reader/full/lecture-6-final-managing-quality 55/74
5555
Seven Tools for TQMSeven Tools for TQM

8/7/2019 lecture 6- Final Managing Quality
http://slidepdf.com/reader/full/lecture-6-final-managing-quality 56/74
5656
Pareto Analysis of Wine GlassPareto Analysis of Wine GlassDefects (Total Defects = 75)Defects (Total Defects = 75)
54
12
5 4 2
72%
88%93% 97% 100%
0
10
20
30
40
50
60
70
Scratches Porosity Nicks Contamination Misc.
Causes, by percent total defects
Frequency (Number)
0%
20%
40%
60%
80%
100%
Cumulative
Percent
72% 16% 5% 4% 3%

8/7/2019 lecture 6- Final Managing Quality
http://slidepdf.com/reader/full/lecture-6-final-managing-quality 57/74
5757
Shows sequence of events inShows sequence of events inprocessprocess
Depicts activity relationshipsDepicts activity relationships Has many usesHas many uses
�� Identify data collection pointsIdentify data collection points
�� Find problem sourcesFind problem sources�� Identify places for improvementIdentify places for improvement
�� Identify where travel distances can beIdentify where travel distances can bereducedreduced
Process ChartProcess Chart

8/7/2019 lecture 6- Final Managing Quality
http://slidepdf.com/reader/full/lecture-6-final-managing-quality 58/74
5858
SUBJECT: Request tool purchase
Dist (f t) Time (min) Symbol Descr iption
D� Wr ite or der
D � On desk
75 D� To buyer
D�
Examine = Operation; = Transport; = Inspect;
D = Delay;� = S torage
Process Chart ExampleProcess Chart Example

8/7/2019 lecture 6- Final Managing Quality
http://slidepdf.com/reader/full/lecture-6-final-managing-quality 59/74
5959
Used to find problem sources/solutionsUsed to find problem sources/solutions
Other namesOther names
�� FishFish--bone diagram, Ishikawa diagrambone diagram, Ishikawa diagram
StepsSteps
�� Identify problem to correctIdentify problem to correct
�� Draw main causes for problem as µbones¶ Draw main causes for problem as µbones
�� Ask µWhat could have caused problems inAsk µWhat could have caused problems inthese areas?¶ Repeat for each subthese areas?¶ Repeat for each sub--area.area.
Cause and Effect DiagramCause and Effect Diagram

8/7/2019 lecture 6- Final Managing Quality
http://slidepdf.com/reader/full/lecture-6-final-managing-quality 60/74
6060
M et hod M anpower
M aterial M ac hinery
Drill Drill Drill Drill OvertimeOvertimeOvertimeOvertime
S teel S teel S teel S teel
Wood Wood Wood Wood
Lat heLat heLat heLat he
Too many
defects
Tired Tired Tired Tired
Old Old Old Old
S low S low S low S low
Cause and Effect DiagramCause and Effect Diagram
ExampleExample
Fishbone ChartFishbone Chart Problems with AirlineProblems with Airline

8/7/2019 lecture 6- Final Managing Quality
http://slidepdf.com/reader/full/lecture-6-final-managing-quality 61/74
6161
Fishbone ChartFishbone Chart -- Problems with AirlineProblems with AirlineCustomer ServiceCustomer Service
S CS C

8/7/2019 lecture 6- Final Managing Quality
http://slidepdf.com/reader/full/lecture-6-final-managing-quality 62/74
6262
Uses statistics & control charts to tellUses statistics & control charts to tellwhen to adjust processwhen to adjust process
Developed by Shewhart in 1920¶sDeveloped by Shewhart in 1920¶s
InvolvesInvolves
�� Creating standards (upper & lower limits)Creating standards (upper & lower limits)
�� Measuring sample output (e.g. meanMeasuring sample output (e.g. mean
wgt.)wgt.)�� Taking corrective action (if necessary)Taking corrective action (if necessary)
Done while product is being producedDone while product is being produced
Statistical Process ControlStatistical Process Control
(SPC)(SPC)

8/7/2019 lecture 6- Final Managing Quality
http://slidepdf.com/reader/full/lecture-6-final-managing-quality 63/74
6363
ControlControl ChartsCharts
Repetitive operation will not produceRepetitive operation will not produceexactly the same outputs.exactly the same outputs.
Pattern of variability often described byPattern of variability often described bynormal distribution.normal distribution.
Random samples that fully represent theRandom samples that fully represent thepopulation being checked are taken.population being checked are taken.
Sample data plotted on control charts toSample data plotted on control charts to
determine if the process is still underdetermine if the process is still undercontrol.control.

8/7/2019 lecture 6- Final Managing Quality
http://slidepdf.com/reader/full/lecture-6-final-managing-quality 64/74
6464
Process Control ChartProcess Control Chart
Plot of Sample Data Over Time
0
20
40
60
80
1 5 9 13 17 21
Time
Sample V
alu Sample
ValueUCL
Average
LCL

8/7/2019 lecture 6- Final Managing Quality
http://slidepdf.com/reader/full/lecture-6-final-managing-quality 65/74
6565
Control Chart with Limits Set at ThreeControl Chart with Limits Set at Three
Standard DeviationsStandard Deviations

8/7/2019 lecture 6- Final Managing Quality
http://slidepdf.com/reader/full/lecture-6-final-managing-quality 66/74
6666
Involves examining items to see if Involves examining items to see if an item is good or defectivean item is good or defective
Detect a defective productDetect a defective product�� Does not correct deficiencies inDoes not correct deficiencies in
process or productprocess or product
IssuesIssues
�� When to inspectWhen to inspect
�� Where in process to inspectWhere in process to inspect
InspectionInspection

8/7/2019 lecture 6- Final Managing Quality
http://slidepdf.com/reader/full/lecture-6-final-managing-quality 67/74
6767
When and Where to InspectWhen and Where to Inspect
At the supplier¶s plant while the supplierAt the supplier¶s plant while the supplieris producingis producing
At your facility upon receipt of goodsAt your facility upon receipt of goodsfrom the supplierfrom the supplier
Before costly or irreversible processesBefore costly or irreversible processes During the stepDuring the step--byby--step productionstep production
processesprocesses When production or service is completeWhen production or service is complete Before delivery from your facilityBefore delivery from your facility At the point of customer contactAt the point of customer contact
8/7/2019 lecture 6- Final Managing Quality
http://slidepdf.com/reader/full/lecture-6-final-managing-quality 68/74
6868
Service quality is more difficult toService quality is more difficult tomeasure than for goodsmeasure than for goods
Service quality perceptions depend onService quality perceptions depend on�� Expectations versus realityExpectations versus reality
�� Process and outcomeProcess and outcome
Types of service qualityTypes of service quality�� Normal: Routine service deliveryNormal: Routine service delivery
�� Exceptional: How problems are handledExceptional: How problems are handled
TQM In ServicesTQM In Services

8/7/2019 lecture 6- Final Managing Quality
http://slidepdf.com/reader/full/lecture-6-final-managing-quality 69/74
6969
Determinants of Service QualityDeterminants of Service Quality
ReliabilityReliability ±± consistency and dependabilityconsistency and dependability
ResponsivenessResponsiveness ±± willingness/readiness of willingness/readiness of employees to provide service; timelinessemployees to provide service; timeliness
CompetenceCompetence ±± possession of skills andpossession of skills andknowledge required to perform serviceknowledge required to perform service
AccessAccess ±± approachability and ease of approachability and ease of contactcontact
CourtesyCourtesy ±± politeness, respect,politeness, respect,consideration, friendliness of contactconsideration, friendliness of contactpersonnelpersonnel
D t i t f S i Q litD t i t f S i Q lit

8/7/2019 lecture 6- Final Managing Quality
http://slidepdf.com/reader/full/lecture-6-final-managing-quality 70/74
7070
Determinants of Service QualityDeterminants of Service Quality
--ContinuedContinued CommunicationCommunication ±± keeping customers informedkeeping customers informed
in languages they understandin languages they understand
CredibilityCredibility ±± trustworthiness, believability,trustworthiness, believability,
honestyhonesty SecuritySecurity ±± freedom from danger, risk or doubtfreedom from danger, risk or doubt
Understanding/knowing the customerUnderstanding/knowing the customer ±±making the effort to understands themaking the effort to understands the
customer¶s needscustomer¶s needs TangiblesTangibles ±± the physical evidence of thethe physical evidence of the
serviceservice

8/7/2019 lecture 6- Final Managing Quality
http://slidepdf.com/reader/full/lecture-6-final-managing-quality 71/74
Process StrategyProcess Strategy
Next Lecture«..Next Lecture«..
Any Question««.?Any Question««.?
7171

8/7/2019 lecture 6- Final Managing Quality
http://slidepdf.com/reader/full/lecture-6-final-managing-quality 72/74
THANKSTHANKS
7272

8/7/2019 lecture 6- Final Managing Quality
http://slidepdf.com/reader/full/lecture-6-final-managing-quality 73/74
7373
History of TQMHistory of TQM
Dr.Dr. ShewartShewart began using statisticalbegan using statisticalcontrol at the Bell Institute in 1930scontrol at the Bell Institute in 1930s
Military standards developed in 1950sMilitary standards developed in 1950s
After World War II, Japanese UnionAfter World War II, Japanese Unionof Scientist and Engineers beganof Scientist and Engineers beganconsulting with Demingconsulting with Deming
Deming Prize introduced in Japan inDeming Prize introduced in Japan in19511951

8/7/2019 lecture 6- Final Managing Quality
http://slidepdf.com/reader/full/lecture-6-final-managing-quality 74/74
7474
History of TQMHistory of TQM continued continued
Quality assurance concept proposed inQuality assurance concept proposed in1952 by1952 by JuranJuran in USin US
JuranJuran makes first trip to Japan in 1954makes first trip to Japan in 1954
Quality becomes Japan¶s national sloganQuality becomes Japan¶s national sloganin 1956in 1956
First quality circles created in 1957First quality circles created in 1957
10,000 quality circles by 196610,000 quality circles by 1966
100,000 quality circles by 1977100,000 quality circles by 1977
First U.S. quality circle 1974First U.S. quality circle 1974