Embed Size (px)
Citation preview

Lecture 6: Space/OrderInformation VisualizationCPSC 533C, Fall 2006
Tamara Munzner
UBC Computer Science
28 September 2006

Readings Covered
The Visual Design and Control of Trellis Display R. A. Becker, W. S.Cleveland, and M. J. Shyu Journal of Computational and StatisticalGraphics, 5:123-155. (1996).http://cm.bell-labs.com/stat/doc/trellis.jcgs.col.ps
Envisioning Information. Edward Tufte. Graphics Press, 1990.Chapter 4: Small Multiples, Chapter 6: Narratives of Space and Time
VisDB: Database Exploration using Multidimensional Visualization,Daniel A. Keim and Hans-Peter Kriegel, IEEE CG&A, 1994http://www.dbs.informatik.uni-muenchen.de/dbs/projekt/papers/visdb.ps

Space and Order
I TrellisI find order automatically: main-effectsI dot plots, matrices of small multiples
I VisDBI choice of spacefilling pixel pattern
I small multiplesI side by side better than comparing to memory
I narratives of space and timeI using spatial position to encode temporal dataI derived spaces

Manual Ordering: Bertin
I reorderable matrices - manually!
[Bertin, Graphics and Graphic Information Processing, p34]

Interactive Ordering: Table Lens
I click to sort by columnsI also, is focus+context approachI demo: www.inxight.com/products/sdks/tl

Interactive Ordering: Rivet
I performance analysis of parallel systemI order: machine name vs. lock acquisition time
overview zoom reorder
[Bosch, Performance Analysis and Visualization of Parallel SystemsUsing SimOS and Rivet: A Case Study, HPCA6, 2000.graphics.stanford.edu/papers/rivet argus]

Automatic Ordering: Trellisalphabetical site,variety use group median
[The Visual Design and Control of Trellis Display. Becker, Cleveland, and Shyu. JCSG5:123-155 1996. cm.bell-labs.com/stat/doc/trellis.jcgs.col.ps]

Trellis Structure
I conditioning/trellising: choose structureI pick how to subdivide into panelsI pick x/y axes for indiv panelsI explore space with different choices
I multiple conditioning
I orderingI large-scale: between panelsI small-scale: within panels
I main-effects: sort by group medianI derived space, from categorical to ordered

Confirming Hypothesis
I dataset error with Morrisswitched?
I old trellis: yield againstvariety given year/site
I new trellis: yield against siteand year given variety
I exploration suggested byprevious main-effectsordering
[The Visual Design and Control of Trellis Display. Becker,Cleveland, and Shyu. JCSG 5:123-155 1996.cm.bell-labs.com/stat/doc/trellis.jcgs.col.ps]

Partial Residuals
I fixed dataset, Morris dataswitched
I explicitly show differencesI take means into accountI line is 10% trimmed mean
(toss outliers)
[The Visual Design and Control of Trellis Display. Becker,Cleveland, and Shyu. JCSG 5:123-155 1996.cm.bell-labs.com/stat/doc/trellis.jcgs.col.ps]

Banking to 45 Degrees
I mentioned but notexplained in thisreading
I perceptualprinciple: mostaccurate anglejudgement at 45degrees
I pick aspect ratio(height/width)accordingly
[www.research.att.com/∼rab/trellis/sunspot.html]

Multiscale Banking to 45I frequency domain analysis
[Multi-Scale Banking to 45 Degrees. Heer and Agrawala, Proc InfoVis 2006vis.berkeley.edu/papers/banking]

Multiscale Banking to 45
[Multi-Scale Banking to 45 Degrees. Heer and Agrawala, Proc InfoVis 2006vis.berkeley.edu/papers/banking]

VisDB: Spacefilling Pixels
I how to draw pixels?I sort, color by relevance
I local ordering
spiral 2D
[VisDB: Database Exploration using Multidimensional Visualization, Keim and Kriegel,IEEE CG&A, 1994 www.dbs.informatik.uni-muenchen.de/dbs/projekt/papers/visdb.ps]
VisDB Windows
grouped dimensions
separate dimensions
[VisDB: Database Exploration using Multidimensional Visualization, Keim and Kriegel,IEEE CG&A, 1994 www.dbs.informatik.uni-muenchen.de/dbs/projekt/papers/visdb.ps]
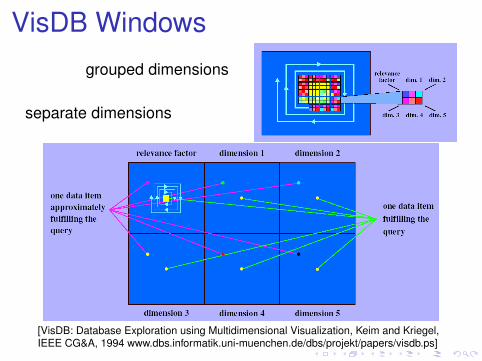
VisDB Results: Separate Dimensions
spiral 2D
[VisDB: Database Exploration using Multidimensional Visualization, Keim and Kriegel,IEEE CG&A, 1994 www.dbs.informatik.uni-muenchen.de/dbs/projekt/papers/visdb.ps]

VisDB Results: Grouped Dimensions
[VisDB: Database Exploration using Multidimensional Visualization, Keim and Kriegel,IEEE CG&A, 1994 www.dbs.informatik.uni-muenchen.de/dbs/projekt/papers/visdb.ps]

Space vs. Time: Showing Changeliteral abstract←− . . . . . . . . . . . . . . . . . . . . . . . . . . . . . . . . . . . . . . . . .−→time for time space for time
I animation: show time using temporalchange
I good: show process
I good: compare by flipping between two thingsI bad: compare between many things
I interference from intermediate frames
[www.geom.uiuc.edu/docs/outreach/oi/evert.mpg]
[www.astroshow.com/ccdpho/pluto.gif]

Space vs. Time: Showing Changeliteral abstract←− . . . . . . . . . . . . . . . . . . . . . . . . . . . . . . . . . . . . . . . . .−→time for time space for time
I animation: show time using temporalchange
I good: show processI good: compare by flipping between two things
I bad: compare between many thingsI interference from intermediate frames
[www.geom.uiuc.edu/docs/outreach/oi/evert.mpg][www.astroshow.com/ccdpho/pluto.gif]

Space vs. Time: Showing Changeliteral abstract←− . . . . . . . . . . . . . . . . . . . . . . . . . . . . . . . . . . . . . . . . .−→time for time space for time
I animation: show time using temporalchange
I good: show processI good: compare by flipping between two thingsI bad: compare between many things
I interference from intermediate frames
[www.geom.uiuc.edu/docs/outreach/oi/evert.mpg][www.astroshow.com/ccdpho/pluto.gif]

Space vs. Time: Showing Changeliteral abstract←− . . . . . . . . . . . . . . . . . . . . . . . . . . . . . . . . . . . . . . . . .−→time for time space for time
I small multiples: show time using spaceI overview: show each time step in arrayI compare: side-by-side easier than temporal
I external cognition instead of internal memory
I general technique, not just for temporalchanges
[Edward Tufte. The Visual Display of Quantitative Information, p 172]

Space vs. Time: Showing Changeliteral abstract←− . . . . . . . . . . . . . . . . . . . . . . . . . . . . . . . . . . . . . . . . .−→time for time space for time
I small multiples: show time using spaceI overview: show each time step in arrayI compare: side-by-side easier than temporal
I external cognition instead of internal memoryI general technique, not just for temporal
changes
[Edward Tufte. The Visual Display of Quantitative Information, p 172]

Space vs. Time: Showing Changeliteral abstract←− . . . . . . . . . . . . . . . . . . . . . . . . . . . . . . . . . . . . . . . . .−→time for time space for time
I small multiples: show time using spaceI also can be good for showing process
[www.geom.uiuc.edu/graphics/pix/Video Productions/Outside In/postcard.comp.html]
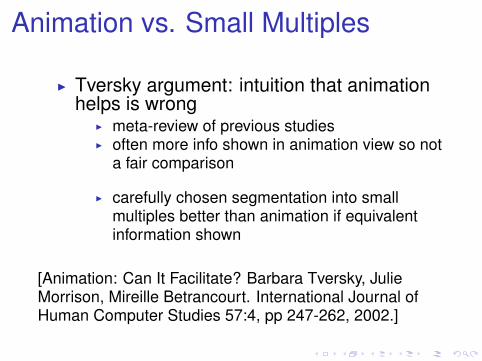
Animation vs. Small Multiples
I Tversky argument: intuition that animationhelps is wrong
I meta-review of previous studiesI often more info shown in animation view so not
a fair comparison
I carefully chosen segmentation into smallmultiples better than animation if equivalentinformation shown
[Animation: Can It Facilitate? Barbara Tversky, JulieMorrison, Mireille Betrancourt. International Journal ofHuman Computer Studies 57:4, pp 247-262, 2002.]
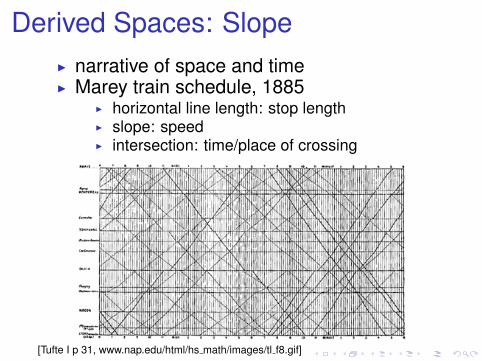
Derived Spaces: SlopeI narrative of space and timeI Marey train schedule, 1885
I horizontal line length: stop lengthI slope: speedI intersection: time/place of crossing
[Tufte I p 31, www.nap.edu/html/hs math/images/tl f8.gif]