Embed Size (px)
Citation preview

Nikolova 2020 1
Lecture 7: Antenna Noise Temperature and System Signal-to-Noise Ratio
(Noise temperature. Antenna noise temperature. System noise temperature.
Minimum detectable temperature. System signal-to-noise ratio.)
1. Noise Temperature of Bright Bodies
The performance of a telecommunication system depends on the signal-to-
noise ratio (SNR) at the receiver’s input. The electronic circuitry of the RF
front end (amplifiers, mixers, etc.) has a significant contribution to the system
noise. However, the antenna itself is sometimes a significant source of noise,
too. The antenna noise can be divided into two types according to its physical
source: noise due to the loss resistance of the antenna and noise, which the
antenna picks up from the surrounding environment.
Any object whose temperature is above the absolute zero radiates EM
energy. Thus, an antenna is surrounded by noise sources, which create noise
power at the antenna terminals. Here, we are not concerned with man-made
sources of noise, which are the subject of the EM interference (EMI) science.
We are also not concerned with intentional sources of EM interference
(jamming). We are concerned with natural sources of EM noise, which is
thermal in nature, such as sky noise and ground noise.
The concept of antenna noise temperature is critical in understanding how the
antenna contributes to the system noise in low-noise receiving systems such as
radio-astronomy and radiometry. It is also important in understanding the
relation between an object’s temperature and the power generates at the
receiving antenna terminals. This thermal power is the signal used in passive
remote sensing (radiometry) and imaging. A radiometer can create temperature
images of objects. Typically, the remote object’s temperature is measured by
comparison with the noise due to background sources and the receiver itself.
Every object (e.g., a resistor R) with a physical temperature above zero (0° K
= 273− ° C) possesses heat energy. The noise power per unit bandwidth ph is
proportional to the object’s temperature and is given by Nyquist’s relation:
h Pp kT= , W/Hz (7.1)
where TP is the physical temperature of the object in K (Kelvin degrees) and k

Nikolova 2020 2
is Boltzmann’s constant ( ≈ 231.38 10− J/K).
In the case of a resistor, this is the noise power, which can be measured at the
resistor’s terminals with a matched load. Thus, a resistor can serve as a noise
generator. Often, we assume that heat energy is evenly distributed in the
frequency band f . Then, the associated heat power in f is
h PP kT f= , W. (7.2)
The noise power radiated by the object depends not only on its physical
temperature but also on the ability of its surface to let the heat leak out. This
radiated heat power (or brightness power PB) is associated with the so-called
equivalent temperature or brightness temperature TB of the body via the
power-temperature relation in (7.2):
B BP kT f= , W. (7.3)
In general, the brightness temperature BT is not the same as the physical
temperature of the body PT . The two temperatures are proportional:
2(1 | | )B s P PT T T= − = , K (7.4)
where
s is the reflection coefficient of the surface of the body; and
is what is called the emissivity of the body.
The brightness power BP relates to the heat power hP the same way as BT
relates to PT , i.e., B hP P= .
2. Antenna Noise Temperature
The power radiated by the body BP , when intercepted by an antenna,
generates noise power AP at its terminals. The equivalent temperature
associated with the received power AP at the antenna terminals is called the
antenna temperature AT of the object, where, again, A AP kT f= . Here, f is a
bandwidth, which falls within the antenna bandwidth and is sufficiently narrow
to ensure constant noise-power spectral density.
2.1. Antenna noise from bright background
Let us first assume that the entire antenna pattern (beam) “sees” a uniformly
“bright” or “warm” object surrounding the antenna from all directions (see the

Nikolova 2020 3
figure below). To simplify matters, we also assume that the antenna is lossless,
i.e., it has no loss resistance, and, therefore, it does not generate noise itself.
Then, certain noise power can be measured at its terminals, which can be
expressed as
A BP kT f= , W. (7.5)
TB is the brightness temperature of the object, see (7.4), as observed at the
antenna.
On the other hand, the antenna temperature is related to the measured noise
power as
A AP kT f= . (7.6)
Thus, in this case (when the solid angle subtended by the noise source B is
much larger than the antenna solid angle A , the object envelops the antenna
from all directions), the antenna temperature AT is equal to the object’s
temperature BT (if the antenna is loss-free):
, ifA B A BT T= . (7.7)
A
B
, KBT
R , K
BT
Nikolova 2020 4
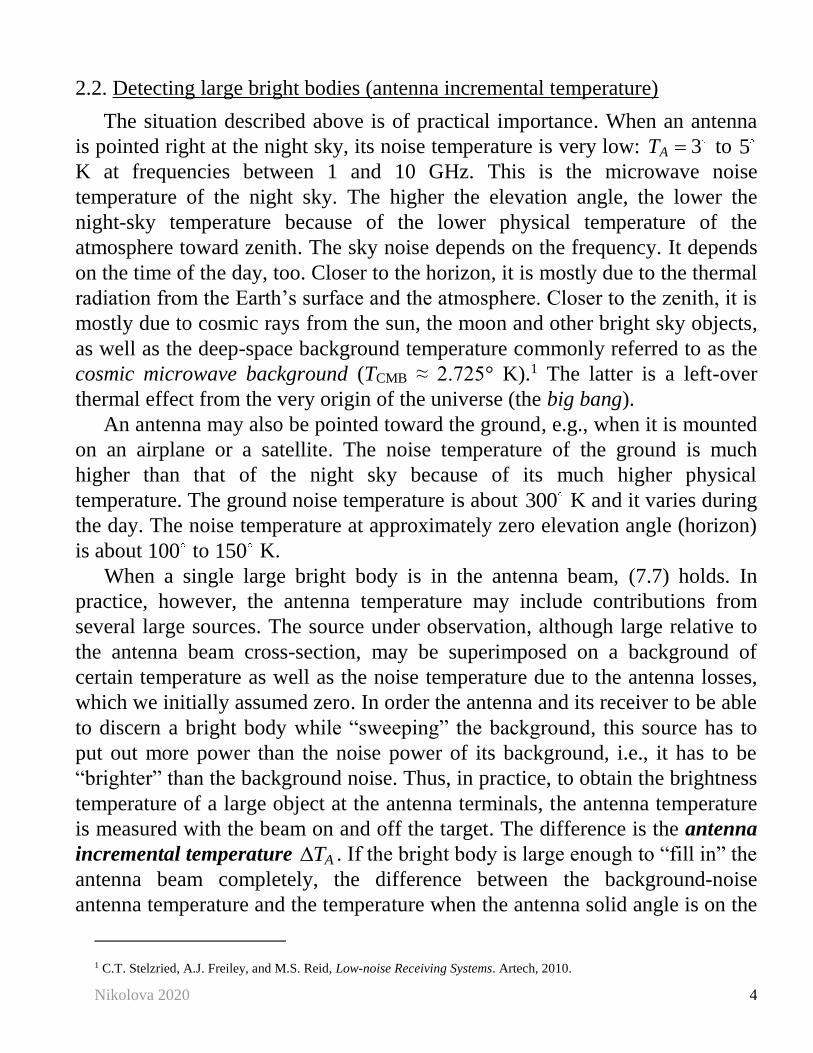
2.2. Detecting large bright bodies (antenna incremental temperature)
The situation described above is of practical importance. When an antenna
is pointed right at the night sky, its noise temperature is very low: 3AT = to 5
K at frequencies between 1 and 10 GHz. This is the microwave noise
temperature of the night sky. The higher the elevation angle, the lower the
night-sky temperature because of the lower physical temperature of the
atmosphere toward zenith. The sky noise depends on the frequency. It depends
on the time of the day, too. Closer to the horizon, it is mostly due to the thermal
radiation from the Earth’s surface and the atmosphere. Closer to the zenith, it is
mostly due to cosmic rays from the sun, the moon and other bright sky objects,
as well as the deep-space background temperature commonly referred to as the
cosmic microwave background (TCMB ≈ 2.725° K).1 The latter is a left-over
thermal effect from the very origin of the universe (the big bang).
An antenna may also be pointed toward the ground, e.g., when it is mounted
on an airplane or a satellite. The noise temperature of the ground is much
higher than that of the night sky because of its much higher physical
temperature. The ground noise temperature is about 300 K and it varies during
the day. The noise temperature at approximately zero elevation angle (horizon)
is about 100 to 150 K.
When a single large bright body is in the antenna beam, (7.7) holds. In
practice, however, the antenna temperature may include contributions from
several large sources. The source under observation, although large relative to
the antenna beam cross-section, may be superimposed on a background of
certain temperature as well as the noise temperature due to the antenna losses,
which we initially assumed zero. In order the antenna and its receiver to be able
to discern a bright body while “sweeping” the background, this source has to
put out more power than the noise power of its background, i.e., it has to be
“brighter” than the background noise. Thus, in practice, to obtain the brightness
temperature of a large object at the antenna terminals, the antenna temperature
is measured with the beam on and off the target. The difference is the antenna
incremental temperature AT . If the bright body is large enough to “fill in” the
antenna beam completely, the difference between the background-noise
antenna temperature and the temperature when the antenna solid angle is on the
1 C.T. Stelzried, A.J. Freiley, and M.S. Reid, Low-noise Receiving Systems. Artech, 2010.

Nikolova 2020 5
object is equal to the object’s brightness temperature,
A BT T = . (7.8)
2.3. Antenna noise from small bright bodies
A different case arises in radiometry and radio astronomy. The bright object
subtends such a small solid angle that it is well inside the antenna solid angle
when the antenna is pointed at it: B A .
BABS
To separate the power received from the bright body from the background
noise, the difference in the antenna temperature AT is measured with the beam
on and off the object. This time, AT is not equal to the bright body
temperature BT , as was the case of a large object. However, both temperatures
are proportional. The relation is derived below.
The noise power intercepted by the antenna depends on the antenna
effective aperture eA and on the power density at the antenna’s location created
by the noise source BW :
BA eP WA= , W. (7.9)
Assuming that the bright body radiates isotropically and expressing the
effective area by the antenna solid angle, we obtain
2
24A
BA
RP
P
=
, W. (7.10)
The distance R between the noise source and the antenna is related to the
effective area of the body SB and the solid angle B it subtends as

Nikolova 2020 6
2 B
B
SR =
, m2 (7.11)
Substituting (7.11) in (7.10) yields
2
4A A B B
B
P PS
= . (7.12)
Next, we notice that
2 1
14 B BS G
= = . (7.13)
Here, BG is the gain of the bright body (viewed as an antenna), which is unity
because we assumed in (7.10) that the body radiates isotropically. In (7.13), we
have used the relationship between gain and effective area; see (4.65) in
Lecture 4); the effective area of the bright body being simply its cross-section
SB. Finally, substituting (7.13) in (7.12) leads to
, ifA A B B B AP P = . (7.14)
Equation (7.14) leads to the relation between the brightness temperature BT of
the bright object and the measured antenna incremental temperature AT :
B
A B
A
T T
=
K, B A . (7.15)
For a large bright body, where B A = , (7.15) reduces to (7.8).
2.4. Source flux density from noise sources and noise PLF
The power at the antenna terminals AP , which corresponds to the antenna
incremental temperature AT , is defined by (7.6). In radio-astronomy and
remote sensing, we use the flux density S of the noise source at the antenna (the
effective area of which is Ae):
2 1, Wm Hzh A
e e
p k TS
A A− −
= = . (7.16)
This way, the source flux density is a characteristic, which is independent of the
antenna used to measure it. Notice that S is not the Poynting vector (power flux
per unit area) but rather the spectral density of the Poynting vector (power flux
per unit area per hertz). In radio-astronomy, the unit for flux density is jansky,

Nikolova 2020 7
261 Jy = 10− 2 1Wm Hz− − .2
From (7.16), we conclude that the measured incremental antenna
temperature AT relates to the source flux density as
1
A eT A Sk
= . (7.17)
This would be the case indeed if the antenna and the bright-body source were
polarization matched. Since the bright-body source is a natural noise source, we
cannot expect perfect match. In fact, an astronomical object is typically
unpolarized, i.e., its polarization is random. Thus, about half of the bright-body
flux density cannot be picked up by the receiving antenna, the polarization of
which is fixed. For this reason, the relation in (7.17) is modified as
1
2
eA
A ST
k
= . (7.18)
The same correction factor should be inserted in (7.15), where the measured
AT would actually correspond only to one-half of the noise temperature of the
bright body:
1
2
BA B
A
T T
=
. (7.19)
2.5. Antenna noise from a nonuniform noisy background
In the case of a small bright body (see previous subsection), we have tacitly
assumed that the gain of the antenna is constant within the solid angle B
subtended by the bright body. This is in accordance with the definition of the
antenna solid angle A , which was used to obtain the ratio between AT and
BT . The solid-angle representation of the directivity of an antenna is actually
quite accurate for high-directivity antennas, e.g., reflector antennas.
In general, however, the antenna gain may be strongly dependent on the
observation angle ( , ) . In this case, the noise signals arriving from different
sectors of space have different contributions to the total antenna temperature.
Those arriving from the direction of the maximum directivity contribute the
most whereas those arriving from the direction of zero directivity will not
2 Karl G. Jansky was the first one to use radio waves for astronomical observations.

Nikolova 2020 8
contribute at all. The differential contribution from a sector of space of solid
angle d should, therefore, be weighed by the antenna normalized power
pattern ( , )F in the respective direction:
( , )
( , )B
A
A
T ddT F
=
. (7.20)
The above expression can be understood by considering (7.15) where AT is
replaced by a differential contribution dTA to the antenna temperature from a
bright body subtending a differential solid angle B d → . The total antenna
noise power is then obtained as
4
1( , ) ( , )A B
A
T F T d
= . (7.21)
The expression in (7.21) is general and the previously discussed special
cases are easily derived from it. For example, assume that the brightness
temperature surrounding the antenna is the same in all directions, i.e.,
0( , )B BT T const = = . Then,
0
0
4
( , )
A
BA B
A
TT F d T
= = . (7.22)
The above situation was already addressed in equation (7.7).
Assume now that 0( , )B BT const T = = but only inside a solid angle B ,
which is much smaller than the antenna solid angle A . Outside B ,
( , ) 0BT = . Since B A , when the antenna is pointed at the noise source,
its normalized power pattern within B is ( , ) 1F . Then,
0 0
4
1 1( , ) ( , ) 1
B
BA B B B
A A A
T F T d T d T
= = = . (7.23)
This case was addressed in (7.15).
The antenna pattern strongly influences the antenna temperature. High-gain
antennas (such as reflector systems), when pointed at elevation angles close to
the zenith at night, have negligible noise level. However, if an antenna has
significant side and back lobes, which are pointed toward the ground or the
horizon, its noise power is much higher. The worst case for an antenna is when

Nikolova 2020 9
its main beam points towards the ground or the horizon, as is often the case
with satellite or airborne antennas that are pointed toward the earth.
Example (modified from Kraus, p. 406): A circular reflector antenna of 500 m2
effective aperture operating at 20 = cm is directed at the zenith. What is the
total antenna temperature assuming the sky temperature close to zenith is equal
to 10◦ K, while at the horizon it is 150◦ K? Take the ground temperature equal
to 300◦ K and assume that one-half of the minor-lobe beam is in the back
direction (toward the ground) and one-half is toward the horizon. The main
beam efficiency (BE = /M A ) is 0.7.
Such a large reflector antenna is highly directive and, therefore, its main
beam “sees” only the sky around the zenith. The main beam efficiency is 70%.
Thus, substituting in (7.23) where B is replaced by M , the noise
contribution of the main beam is
1
(10 0.7 ) 7
M
MBAA
A
T
= =
, K. (7.24)
The contribution from the half back-lobe (which is a half of 30% of the antenna
solid angle) directed toward ground is
( )1
300 0.15 45GBLAA
A
T = =
, K. (7.25)
The contribution from the half back-lobe directed toward the horizon is
( )1
150 0.15 22.5HBLAA
A
T = =
, K. (7.26)
The total antenna noise temperature is
74.5GBLMB HBLA A A AT T T T= + + = K. (7.27)
3. System Noise Temperature
The antenna is a part of a receiving system, which consists of several
cascaded components: antenna, transmission line (or waveguide) assembly and
receiver (see figure below). All these system components, the antenna included,
have their contributions to the system noise. The system noise level is a critical
factor in determining its sensitivity and SNR.

Nikolova 2020 10
BT
LPT
l
RT
referencelocation #1
referencelocation #2
referencelocation #3
( )AP PT T
3.1. Noise Analysis of Cascaded Matched Two-port Networks3
To understand the noise analysis of the radio receiver system, we must first
review the basics of the noise analysis of cascaded two-port networks. For
simplicity, we will assume that all networks are impedance matched, which is
close to what is in fact happening in a realistic receiver system.
In the figure below (case (a)), a generic cascaded network is shown where
the first component on the left is the noise source (e.g., the antenna picking up
noise from the sky) with noise temperature ST . The remaining two-port
components are characterized by their physical temperatures PiT and by their
loss factors (or loss ratios) iL , 1,2i = . In the case of a passive lossy two-port
network (such as a waveguide or a transmission line), L is the inverse of the
efficiency. In some analyses, the antenna can be viewed as a two-port network
as well, such that its “input port” is its aperture receiving the noise signals from
the environment and its output port is its connection to the transmission line.
The efficiency is defined as the output-to-input power ratio ou in/e P P= and
1e for a passive two-port component. In contrast, in ou/L P P= and 1L .
Thus, the loss ratio of an antenna as a two-port component is 1A AL e−= . In noise
theory, any two-port component for which 1L , i.e., it exhibits power loss, is
referred to as “attenuator” although this component does not necessarily need to
3 From T.Y. Otoshi, “Calculation of antenna system noise temperatures at different ports—revisited,” IPN Progress Report,
Aug. 15, 2002.

Nikolova 2020 11
be an attenuator; it could be, for example, the entire antenna-plus-feed
assembly. On the other hand, if 1L , we have a component which exhibits
gain and it is referred to as an “amplifier”. In this case, the efficiency is
replaced by the gain G, which, just like the efficiency, is the output-to-input
power ratio ou in/P P but it is greater than 1. As with the efficiency, the
relationship 1L G−= holds.
ST 1 1, PL T 2 2, PL T 3 3, PL T
1 2 3 4
(a) original network
2 2, PL T 3 3, PL T
2 3 4
(b) equivalent source noise temperature at location 2
ST
3 3, PL T
3 4
ST
4
ST
(c) equivalent source noise temperatures at locations 3 and 4
Figure (a) above shows a cascaded network of 2-port components, each
characterized by its loss factor iL , 1,2,3i = , and by its physical temperature
PiT , 1,2,3i = . The first component of the cascaded network is a noise source
with temperature ST . Figure (b) shows a network where an equivalent source of
temperature ST replaces the original source plus its neighboring 2-port network
( 1 1, PL T ). The equivalent source ST at location 2 is
1 111 1(1 )S S PT L T L T− − = + − . (7.28)
From (7.28), it is evident that in addition to the usual “attenuated” source noise-

Nikolova 2020 12
power term 11 SL T− , there is a contribution due to the physical temperature of the
1st two-port network. This contribution is referred to as the device equivalent
noise temperature at its output,
ou 111 1(1 ) PDT L T−= − . (7.29)
This contribution is entirely determined by the device physical temperature and
its loss factor, i.e., it does not depend on the source.
To understand where (7.28) comes from, we can re-write it as
1
1
1
S P
S P
T TL
T T
−=
−. (7.30)
This is indeed the ratio of input-to-output noise power for the 1st network. ST
represents the power traveling toward the device input while its own noise
power, represented by 1PT travels away from it. Thus, the total power at the
input is represented by 1S PT T− .4 At the same time, at the output, as per figure
(b), the total noise power incident toward network #2 is given by ST . However,
the portion that relates to the attenuation 1L (i.e., the power at the network #1
input) does not include the intrinsic device noise power 1PT , which is always
present at the device output regardless of whether there is a noise source at the
input or not. Thus, 1PT has to be subtracted from ST .
Using the same methodology, we can find the equivalent source noise
temperature ST at location 3 as
1 122 2(1 )S S PT L T L T− − = + − (7.31)
where
ou 122 2(1 ) PDT L T−= − (7.32)
is the 2nd device equivalent noise temperature at its output.
We can repeat this step for the network location 4 where we obtain the
equivalent source noise temperature ST . In each case, in addition to the
“attenuated” source power we have to add the respective network equivalent
output device noise temperature,
ou 1(1 )i PiDiT L T−= − , 1,2,i = . (7.33)
As an illustration of the general procedure, we show the the equivalent
source noise temperature ST at location 4:
4 Remember the expression 2 2| | | |a b− for the total power at the input of a microwave network where a and b are the incident
and the scattered (outgoing) root-power waves, respectively. 2| |a represents the incoming power whereas 2| |b represents the
outgoing power.

Nikolova 2020 13
1 1 1 1 1 11 2 3 1 2 3 2 31 2 3 3( ) (1 ) ( ) (1 ) (1 )S S P P PT T L L L L T L L L T L L T− − − − − −= + − + − + − . (7.34)
3.2. Transferring System Noise Temperature along Lossy Networks
The rule of transferring noise temperature from the output port of a lossy
network to its input port (or vice versa) is simple:
in ou ou /T LT T e= = (7.35)
where e is the device efficiency (or gain). This rule, while simple, is not
immediately obvious. A formal proof can be found in the Appendix of
B.L. Seidel and C.T. Stelzried, “A radiometric method for measuring the
insertion loss of radome materials,” IEEE Trans. Microw. Theory Thech., vol.
MTT-16, No. 9, Sep. 1968, pp. 625−628.
We can now define the equivalent noise temperature of a lossy component
at its input (also known as equivalent input device noise temperature) by
substituting ouDiT from (7.33) as ouT in (7.35):
in ou ( 1)i i PiDi DiT LT L T= = − . (7.36)
It is worth noting that (7.36) suggests that inDiT could be much larger than the
physical temperature PiT if the device is very lossy, i.e., if 1iL ( 1ie ).
Finally, we discuss the physical meaning of the equivalent input device
noise temperature through an alternative way of deriving the relationship in
(7.36). We omit the subscript i hereafter. Consider a noise source of
temperature ST at the device input. Its noise power is then SkT f . To find the
output noise power of the device, we add the two input contributions − that of
the noise source and that due to the equivalent input device noise temperature,
and then multiply the result by the device efficiency:
inN,ou ( )S DP e kT f kT f= + . (7.37)
To find the relation between the equivalent input device noise temperature inDT
and its physical temperature TP, we consider the particular case when the
temperature of the source ST is equal to the physical temperature PT of the
device. In this case, the output noise power must be N,ou PP kT f= because the
whole system of the lossy device plus the source is at the physical temperature
PT . Substituting S PT T= in (7.37) results in
inN,ou ( )P D PP e kT f kT f kT f= + = (7.38)
which, when solved for inDT , produces (7.36). Note that we have not imposed
any restrictions on the actual values of ST and PT but have only required that

Nikolova 2020 14
inDT depends solely on TP (i.e., it is independent of the noise source at the input)
and that (7.37) holds in the special case of S PT T= .
3.3. The atmosphere as an “attenuator”
An illustration of the above concepts in noise analysis is the impact of the
atmosphere on the sky noise, e.g., the cosmic microwave background (TCMB ≈
2.725° K). The atmosphere, depending on the time of the day and the weather
conditions, exhibits loss, which we describe by the loss factor atmL . atmL can be
calculated if we know the averaged attenuation constant in the atmosphere atm
and its thickness H, e.g., atm atmexp(2 )L H . This atmospheric “attenuator”
lies between the cosmic microwave background noise source and the antenna.
Therefore, the actual external noise temperature perceived by the antenna is
1 1sky atm CMB atm atm,(1 ) PT L T L T− −= + − (7.39)
where atm,PT is the physical temperature of the atmosphere, as per (7.28). The
1st term in (7.39) is the space noise whereas the 2nd one is the atmospheric
noise. The impact of the atmosphere is often considered negligible. For a
pencil-beam antenna pointed at the sky, skyAT T= .
3.4. Antenna noise due to the antenna physical temperature
If the antenna has losses, the noise temperature at its terminals includes not
only the antenna temperature AT due to the environment surrounding the
antenna (the external antenna temperature) but also the antenna equivalent
noise temperature APT due to its physical temperature PT . Here, we note that
the antenna acts as an “attenuator” in the cascaded network consisting of the
external noise, the antenna, the waveguide and the receiver; see Figure on p. 10.
We first describe the antenna noise contribution at reference location #1, the
antenna aperture, or, equivalently, its “input”. Here, we view the antenna as a
lossy two-port component. Its equivalent input noise temperature APT is
1
1l
AP P P
A r
RT T T
e R
= − =
, K (7.40)
where Ae is the radiation efficiency (0 1)Ae , Rl is the antenna loss
resistance and Rr is its radiation resistance. Eq. (7.40) is essentially an
application of Eq. (7.36) to the case of an antenna. It describes the thermal
noise contribution of the antenna due to its physical temperature PT referred to

Nikolova 2020 15
its “input” (the antenna aperture). APT must be added to AT in order to obtain
the system operating noise temperature at location #1. In fact, additional terms
exist due to the noise contributions of the lossy TL (or waveguide) and the
receiver electronics.
3.5. Noise due to the physical temperature of the transmission line
We now consider the transmission line (TL) as a source of noise when it has
conduction losses. In a manner analogous to the one applied to the antenna, the
TL is considered as a two-port “attenuator”. Thus, its noise contribution at the
antenna terminals (the input to the TL or reference location #2) is
2
11L LP
L
T Te
= −
, K. (7.41)
Here, 2 lLe e −= is the line thermal efficiency (0 1)Le , LPT is the physical
temperature of the TL, (Np/m) is the attenuation constant of the TL, and l is
its length.
To transfer the TL noise contribution to the reference location #1, we use
(7.35) which leads to
2
1
1 11
LL LP
A A L
TT T
e e e
= = −
. (7.42)
Together with APT , 1LT must be added to AT in order to obtain the system
operating noise temperature at location #1.
3.6. System noise referred to the antenna aperture (location #1)
The system temperature referred to the antenna aperture includes the
contributions of the antenna (external noise temperature plus equivalent input
antenna thermal noise temperature), the transmission line and the receiver as
antennaexternal receiver, antenna internal TL internal
1 1 1 11 1
AP
Asys A P LP R
A A L A L
T
T T T T Te e e e e
= + − + − +
. (7.43)
Here, AT is the external temperature that corresponds to the antenna
temperature provided the antenna is loss-free, as discussed in Section 2. RT is
the receiver noise temperature (at its input, reference location #3). It is given by

Nikolova 2020 16
2 3
1
1 1 2
R
T TT T
G G G= + + + , K. (7.44)
Here,
1T is the noise temperature of the first amplifying stage;
1G is the gain of the first amplifying stage ( 11 1G L−= , see (7.35));
2T is the noise temperature of the second amplifying stage;
2G is the gain of the second amplifying stage ( 12 2G L−= ).
Notice that RT is divided by the efficiencies Le and Ae in order to refer it to the
TL input (location #2) and on to the antenna aperture (location #1); see (7.35).
3.7. System noise referred to the antenna terminals (TL input, location #2)
The reference location is changed by considering the efficiency of the
antenna. As per (7.35), we have
TL Asys sys AT T e= (7.45)
since TLsysT is the system noise temperature at the antenna “output” and A
sysT is
that at its “input”. Substituting (7.43) into (7.45) produces
( )antenna antennaexternal receiverinternal TL internal
1 11 1TL
sys A A P A LP R
L L
T T e T e T Te e
= + − + − +
. (7.46)
3.8. System noise referred to the receiver input (location #3)
The reference location is changed once again by considering the efficiency
of the TL:
R TLsys sys LT T e= . (7.47)
Therefore,
( ) ( )receiverantenna antenna TL
external internal
1 1Rsys A A L P A L LP L RT T e e T e e T e T= + − + − + , K. (7.48)
Example (from Kraus, p. 410, modified): A receiver has an antenna with an
external noise temperature 50° K, a physical temperature of 300° K, and an
efficiency of 99%. Its transmission line has a physical temperature of 300° K

Nikolova 2020 17
and an efficiency of 90%. The first three stages of the receiver all have 80° K
noise temperature and 13 dB gain (13 dB is about 20 times the power). Find the
system temperature at: (a) the antenna aperture, (b) the antenna terminals, and
(c) the receiver input.
The receiver noise temperature is
2
80 8080 84.2
20 20RT = + + = °K. (7.49)
(a) Then, the system temperature at the antenna aperture is
1 1 1 11 1 ,
1 300 1 84.250 300 1 1 181.2009 K.
0.99 0.99 0.9 0.99 0.9
Asys A P LP R
A A L A L
Asys
T T T T Te e e e e
T
= + − + − +
= + − + − +
(7.50)
(b) The system temperature at the antenna terminals is
181.2009 0.99 180.3889TL Asys sys AT T e= °K.
(c) The system temperature at the receiver input is
180.3889 0.9 162.35R TLsys sys LT T e= = °K.
4. Minimum Detectable Temperature (Sensitivity) of the System
The minimum detectable temperature, or sensitivity, of a receiving system
minT is the RMS noise temperature of the system rmsT , which, when referred
to the antenna aperture (reference location #1), is
min rms
Asysk T
T Tf
= =
, (7.51)
where
k is a system constant (commensurate with unity), dimensionless;
f is the pre-detection bandwidth of the receiver, Hz;
τ is the post-detection time constant, s.
The post-detection time constant τ is mostly determined by the averaging (or
the observation) time. As per the Nyquist–Shannon sampling theorem, the
temporal length of the observation determines the minimum frequency

Nikolova 2020 18
bandwidth as min max1/ (2 )f T = . If we set maxT = and minf f = , we see that
the denominator in (7.51) is 1 / 2f = . This explains why the system
constant k is commensurate with unity.
The RMS noise temperature rmsT is determined experimentally by pointing
the antenna at a uniform bright object and recording the signal for a sufficiently
long time. Assume the output of the receiver is in the form of real-positive
numbers proportional to the received noise power. Modern receivers are digital
and their output is actually in the form of integers. Then, the RMS deviation
Drms of the numbers produced by the receiver represents (is proportional to) the
RMS noise temperature at the receiver:
2rms rms
1
1( )
NR
n av
n
D a a TN
=
= − = where 1
1 N
av n
n
a aN =
= . (7.52)
Here, is a known constant converting the integers to noise-temperature
values. rmsT (at reference location #1) can be obtained from rmsRT by
rms
rms min
R
A L
TT T
e e
= = . (7.53)
This is the sensitivity of the system in terms of noise temperature.
In order a source to be detected, it has to create an incremental antenna
temperature AT which exceeds minT , minAT T . The minimum detectable
power Pmin is thus
min min min0.5 eP A p k T f= = (7.54)
where Ae is the effective antenna area, pmin is the power-flux density
(magnitude of Poynting vector) due to the source at the location of the antenna,
and the factor of 0.5 accounts for the randomness of the wave polarization. It
follows that the minimum detectable power-flux density is
min
min
2
e
k T fp
A
= . (7.55)
The signal-to-noise ratio (SNR) for a signal source of incremental antenna
temperature AT is given by
min
ATSNR
T
=
. (7.56)
This SNR is used in radio-astronomy and remote sensing.

Nikolova 2020 19
In the previous example, we found that the system temperature at the antenna
aperture is 181.2009 KAsysT . Assume that the receiver bandwidth is 100f =
Hz, that the system constant is 1k = and that the post-detection constant is
1 = s. Find the minimum detectable power at the antenna aperture minP .
min min
23 20
1.38 10 100 181.2009 2.5 10 W
Asys A
sys
k T fP k T f k f k k T
f − −
= = =
5. System Signal-to-Noise Ratio (SNR) in Communication Links
The system noise power at the antenna terminals (location #2) is
TLN sys rP kT f= , W. (7.57)
Here, rf is the bandwidth of the receiver and TL Asys A sysT e T= . From Friis’
transmission equation, we can express the received power at the antenna
terminals as
2
2 2(1 | | )(1 | | )PLF ( , ) ( , )4
r t r t t t r r r tP G G PR
= − −
. (7.58)
Finally, the SNR becomes
2
2 2(1 | | )(1 | | )PLF4
t r t r tr
TLN sys
G G PP R
SNRP kT f
− −
= =
. (7.59)
The above equation is fundamental in the design of telecommunication
systems. More specifically, if the SNR necessary for the adequate operation of
the receiver is known, Eq. (7.59) allows for determining the maximum range
over which the communication link is stable.