Embed Size (px)
Citation preview
Lecture 8: Sampling Methods
Donglei Du([email protected])
Faculty of Business Administration, University of New Brunswick, NB Canada FrederictonE3B 9Y2
Donglei Du (UNB) ADM 2623: Business Statistics 1 / 30
Table of contents
1 Sampling MethodsWhy SamplingProbability vs non-probability sampling methodsSampling with replacement vs without replacementRandom Sampling Methods
2 Simple random sampling with and without replacementSimple random sampling without replacementSimple random sampling with replacement
3 Sampling error vs non-sampling error
4 Sampling distribution of sample statisticHistogram of the sample mean under SRR
5 Distribution of the sample mean under SRR: The central limit theorem
Donglei Du (UNB) ADM 2623: Business Statistics 2 / 30
Layout
1 Sampling MethodsWhy SamplingProbability vs non-probability sampling methodsSampling with replacement vs without replacementRandom Sampling Methods
2 Simple random sampling with and without replacementSimple random sampling without replacementSimple random sampling with replacement
3 Sampling error vs non-sampling error
4 Sampling distribution of sample statisticHistogram of the sample mean under SRR
5 Distribution of the sample mean under SRR: The central limit theorem
Donglei Du (UNB) ADM 2623: Business Statistics 3 / 30

Why sampling?
The physical impossibility of checking all items in the population,and, also, it would be too time-consuming
The studying of all the items in a population would not be costeffective
The sample results are usually adequate
The destructive nature of certain tests
Donglei Du (UNB) ADM 2623: Business Statistics 4 / 30
Sampling Methods
Probability Sampling: Each data unit in the population has a knownlikelihood of being included in the sample.
Non-probability Sampling: Does not involve random selection;inclusion of an item is based on convenience
Donglei Du (UNB) ADM 2623: Business Statistics 5 / 30
Sampling Methods
Sampling with replacement: Each data unit in the population isallowed to appear in the sample more than once.
Sampling without replacement: Each data unit in the population isallowed to appear in the sample no more than once.
Donglei Du (UNB) ADM 2623: Business Statistics 6 / 30
Random Sampling Methods
Most commonly used probability/random sampling techniques are
Simple random samplingStratified random samplingCluster random sampling
Donglei Du (UNB) ADM 2623: Business Statistics 7 / 30

Simple random sampling
Each item(person) in the population has an equal chance of beingincluded.
Index
●
●●
●
●●
●
●
●
●
●
●
●
● ●
●
●
●
●
●
●
● ●
●
●
●
●
●
●●
●
●
●
●
●
●●
●
●
●
●
●
●
●
●
●
●
●
●
●
●
●
●
●
●
●
●●
●
●
●
●
●
●
●
●
●
●
●
●
●
●
●
●
●
●
●
●
●
●
●
●
●
●
●
●
●
●
●
●
●
●
●
●
●
●
●
●
●
●
●
●
●
●
●
●
●
●
●
●
●
●
●
●
●
●
●
●
●
●
●
●
●
●
●
●
●
●
●
●●
●●
●
●
●
●●
●
●
●●
●
●
Index
●
●
●
●
●
●
●
●
●
●●
●
●●
●
●●
●
●
●
●
●
●
●
●
●
●●
●●
●
●
● ●
●
●
●
●
●
●
●
●
●●
●
●
●●
●
●
●
●
●
●
●
●
●
●
●
●
●
●
●
●
●
●
●
●
●
●
●
●
●
●
●
●
●
●
●
●
●
●
●
●
●
●
●
●
●
●
●●
●
●
●
●
●
●
●●
●
●
●
●
●
●
●
●●
●●
●
●●
●
●
●
●
●●
●
●
●
●
●●
●
●
●
●
●
●
●
●
●
●
●
● ●
●
●
●
●
●
●
●
●
●
●
●
●
●
●
●
●
●
●
●
●
●
●
●
●
●●
●
●
● ●
●
●
Stratum 1
Stratum 2
Stratum 3
Stratum 4
Stratum 5
Stratum 6
●
●
●
●
●
●
●●
●
●
●
●
●
●
●
●●
●
●
●
●
●
●
●●
●
●
●
●
●
●
●
●
●
●
●
●
●
●
●
●
●
●
●
●
●
●
●
●●
●
●●
●
●
●
●
●
●
●
●
●
●
●
●
●●
●
●
●
●
●
●
●
●
●
●
●
●
●●
●●
●
●
●
●
●
●
●
●
●●●
●
●
●
●
●
●
●
●
●
●
●
●
●
●
●
●
●
●
●
●
●
●
●●
●●
●
●
●
●
●
●
●●
●●
●
●
●
●
●
●
●
●
●
●
●
●
●
●
●
●
●
●
●
●●
●
●
●
● ●
●
●
●
●
●
●
●
Cluster 1
Cluster 2
Cluster 3
Cluster 4
Cluster 5
Cluster 6
Cluster 7
Cluster 8
Cluster 9
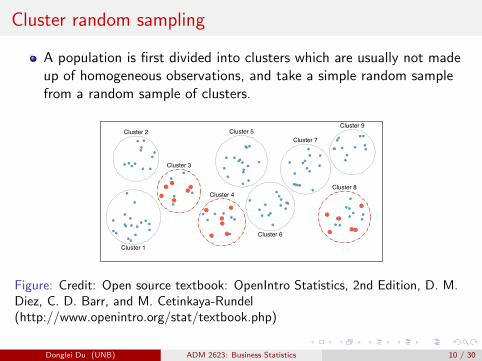
Figure: Credit: Open source textbook: OpenIntro Statistics, 2nd Edition, D. M.Diez, C. D. Barr, and M. Cetinkaya-Rundel(http://www.openintro.org/stat/textbook.php)
Donglei Du (UNB) ADM 2623: Business Statistics 8 / 30

Stratified random sampling
A population is first divided into strata which are made up of similarobservations. Take a simple random sample from each stratum.
Index
●
●●
●
●●
●
●
●
●
●
●
●
● ●
●
●
●
●
●
●
● ●
●
●
●
●
●
●●
●
●
●
●
●
●●
●
●
●
●
●
●
●
●
●
●
●
●
●
●
●
●
●
●
●
●●
●
●
●
●
●
●
●
●
●
●
●
●
●
●
●
●
●
●
●
●
●
●
●
●
●
●
●
●
●
●
●
●
●
●
●
●
●
●
●
●
●
●
●
●
●
●
●
●
●
●
●
●
●
●
●
●
●
●
●
●
●
●
●
●
●
●
●
●
●
●
●
●●
●●
●
●
●
●●
●
●
●●
●
●
Index
●
●
●
●
●
●
●
●
●
●●
●
●●
●
●●
●
●
●
●
●
●
●
●
●
●●
●●
●
●
● ●
●
●
●
●
●
●
●
●
●●
●
●
●●
●
●
●
●
●
●
●
●
●
●
●
●
●
●
●
●
●
●
●
●
●
●
●
●
●
●
●
●
●
●
●
●
●
●
●
●
●
●
●
●
●
●
●●
●
●
●
●
●
●
●●
●
●
●
●
●
●
●
●●
●●
●
●●
●
●
●
●
●●
●
●
●
●
●●
●
●
●
●
●
●
●
●
●
●
●
● ●
●
●
●
●
●
●
●
●
●
●
●
●
●
●
●
●
●
●
●
●
●
●
●
●
●●
●
●
● ●
●
●
Stratum 1
Stratum 2
Stratum 3
Stratum 4
Stratum 5
Stratum 6
●
●
●
●
●
●
●●
●
●
●
●
●
●
●
●●
●
●
●
●
●
●
●●
●
●
●
●
●
●
●
●
●
●
●
●
●
●
●
●
●
●
●
●
●
●
●
●●
●
●●
●
●
●
●
●
●
●
●
●
●
●
●
●●
●
●
●
●
●
●
●
●
●
●
●
●
●●
●●
●
●
●
●
●
●
●
●
●●●
●
●
●
●
●
●
●
●
●
●
●
●
●
●
●
●
●
●
●
●
●
●
●●
●●
●
●
●
●
●
●
●●
●●
●
●
●
●
●
●
●
●
●
●
●
●
●
●
●
●
●
●
●
●●
●
●
●
● ●
●
●
●
●
●
●
●
Cluster 1
Cluster 2
Cluster 3
Cluster 4
Cluster 5
Cluster 6
Cluster 7
Cluster 8
Cluster 9
Figure: Credit: Open source textbook: OpenIntro Statistics, 2nd Edition, D. M.Diez, C. D. Barr, and M. Cetinkaya-Rundel(http://www.openintro.org/stat/textbook.php)
Donglei Du (UNB) ADM 2623: Business Statistics 9 / 30
Cluster random sampling
A population is first divided into clusters which are usually not madeup of homogeneous observations, and take a simple random samplefrom a random sample of clusters.
Index
●
●●
●
●●
●
●
●
●
●
●
●
● ●
●
●
●
●
●
●
● ●
●
●
●
●
●
●●
●
●
●
●
●
●●
●
●
●
●
●
●
●
●
●
●
●
●
●
●
●
●
●
●
●
●●
●
●
●
●
●
●
●
●
●
●
●
●
●
●
●
●
●
●
●
●
●
●
●
●
●
●
●
●
●
●
●
●
●
●
●
●
●
●
●
●
●
●
●
●
●
●
●
●
●
●
●
●
●
●
●
●
●
●
●
●
●
●
●
●
●
●
●
●
●
●
●
●●
●●
●
●
●
●●
●
●
●●
●
●
Index
●
●
●
●
●
●
●
●
●
●●
●
●●
●
●●
●
●
●
●
●
●
●
●
●
●●
●●
●
●
● ●
●
●
●
●
●
●
●
●
●●
●
●
●●
●
●
●
●
●
●
●
●
●
●
●
●
●
●
●
●
●
●
●
●
●
●
●
●
●
●
●
●
●
●
●
●
●
●
●
●
●
●
●
●
●
●
●●
●
●
●
●
●
●
●●
●
●
●
●
●
●
●
●●
●●
●
●●
●
●
●
●
●●
●
●
●
●
●●
●
●
●
●
●
●
●
●
●
●
●
● ●
●
●
●
●
●
●
●
●
●
●
●
●
●
●
●
●
●
●
●
●
●
●
●
●
●●
●
●
● ●
●
●
Stratum 1
Stratum 2
Stratum 3
Stratum 4
Stratum 5
Stratum 6
●
●
●
●
●
●
●●
●
●
●
●
●
●
●
●●
●
●
●
●
●
●
●●
●
●
●
●
●
●
●
●
●
●
●
●
●
●
●
●
●
●
●
●
●
●
●
●●
●
●●
●
●
●
●
●
●
●
●
●
●
●
●
●●
●
●
●
●
●
●
●
●
●
●
●
●
●●
●●
●
●
●
●
●
●
●
●
●●●
●
●
●
●
●
●
●
●
●
●
●
●
●
●
●
●
●
●
●
●
●
●
●●
●●
●
●
●
●
●
●
●●
●●
●
●
●
●
●
●
●
●
●
●
●
●
●
●
●
●
●
●
●
●●
●
●
●
● ●
●
●
●
●
●
●
●
Cluster 1
Cluster 2
Cluster 3
Cluster 4
Cluster 5
Cluster 6
Cluster 7
Cluster 8
Cluster 9
Figure: Credit: Open source textbook: OpenIntro Statistics, 2nd Edition, D. M.Diez, C. D. Barr, and M. Cetinkaya-Rundel(http://www.openintro.org/stat/textbook.php)
Donglei Du (UNB) ADM 2623: Business Statistics 10 / 30
Layout
1 Sampling MethodsWhy SamplingProbability vs non-probability sampling methodsSampling with replacement vs without replacementRandom Sampling Methods
2 Simple random sampling with and without replacementSimple random sampling without replacementSimple random sampling with replacement
3 Sampling error vs non-sampling error
4 Sampling distribution of sample statisticHistogram of the sample mean under SRR
5 Distribution of the sample mean under SRR: The central limit theorem
Donglei Du (UNB) ADM 2623: Business Statistics 11 / 30
Simple random sampling without replacement (SRN)
Repeat the following process until the requested sample is obtained:
Randomly (with equal probability) select an item, record it, and discarditExample: draw cards one by one from a deck without replacement.
This technique is the simplest and most often used samplingtechnique in practice.
Donglei Du (UNB) ADM 2623: Business Statistics 12 / 30
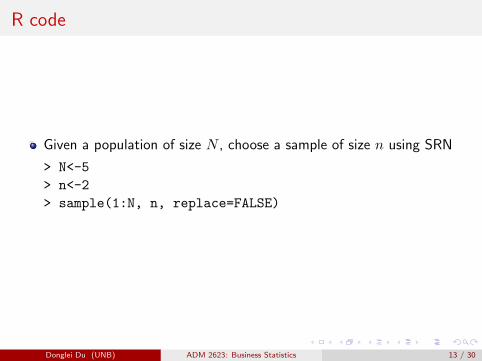
R code
Given a population of size N , choose a sample of size n using SRN
> N<-5
> n<-2
> sample(1:N, n, replace=FALSE)
Donglei Du (UNB) ADM 2623: Business Statistics 13 / 30
Simple random sampling with replacement (SRR)
Repeat the following process until the requested sample is obtained:
Randomly (with equal probability) select an item, record it, and replaceitExample: draw cards one by one from a deck with replacement.
This is rarely used in practice, since there is no meaning to includethe same item more than once.
However, it is preferred from a theoretical point of view, since
It is easy to analyze mathematically.Moreover, SRR is a very good approximation for SRN when N is large.
Donglei Du (UNB) ADM 2623: Business Statistics 14 / 30
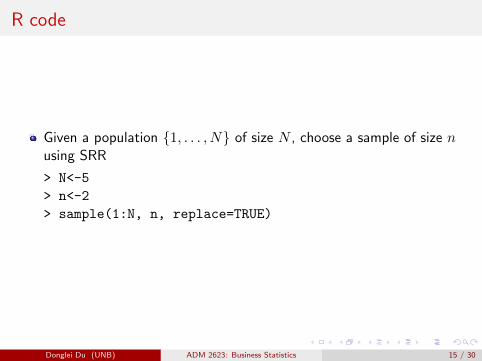
R code
Given a population {1, . . . , N} of size N , choose a sample of size nusing SRR
> N<-5
> n<-2
> sample(1:N, n, replace=TRUE)
Donglei Du (UNB) ADM 2623: Business Statistics 15 / 30
Layout
1 Sampling MethodsWhy SamplingProbability vs non-probability sampling methodsSampling with replacement vs without replacementRandom Sampling Methods
2 Simple random sampling with and without replacementSimple random sampling without replacementSimple random sampling with replacement
3 Sampling error vs non-sampling error
4 Sampling distribution of sample statisticHistogram of the sample mean under SRR
5 Distribution of the sample mean under SRR: The central limit theorem
Donglei Du (UNB) ADM 2623: Business Statistics 16 / 30

Sampling error vs non-sampling error
Sampling error: the difference between a sample statistic and itscorresponding population parameter. This error is inherent in
The sampling process (since sample is only part of the population)The choice of statistics (since a statistics is computed based on thesample).
Non-sample Error: This error has no relationship to the samplingtechnique or the estimator. The main reasons are human-related
data recordingnon-responsesample selection
Donglei Du (UNB) ADM 2623: Business Statistics 17 / 30
Layout
1 Sampling MethodsWhy SamplingProbability vs non-probability sampling methodsSampling with replacement vs without replacementRandom Sampling Methods
2 Simple random sampling with and without replacementSimple random sampling without replacementSimple random sampling with replacement
3 Sampling error vs non-sampling error
4 Sampling distribution of sample statisticHistogram of the sample mean under SRR
5 Distribution of the sample mean under SRR: The central limit theorem
Donglei Du (UNB) ADM 2623: Business Statistics 18 / 30
Sampling distribution of sample statistic
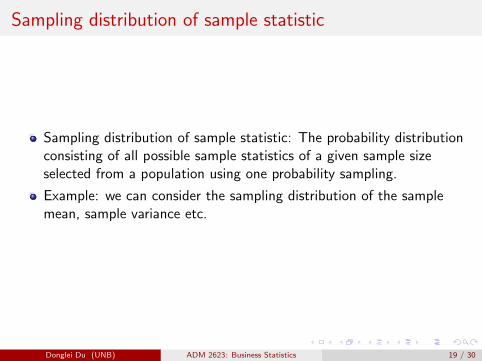
Sampling distribution of sample statistic: The probability distributionconsisting of all possible sample statistics of a given sample sizeselected from a population using one probability sampling.
Example: we can consider the sampling distribution of the samplemean, sample variance etc.
Donglei Du (UNB) ADM 2623: Business Statistics 19 / 30
An example of the sampling distribution of sample meanunder SRR
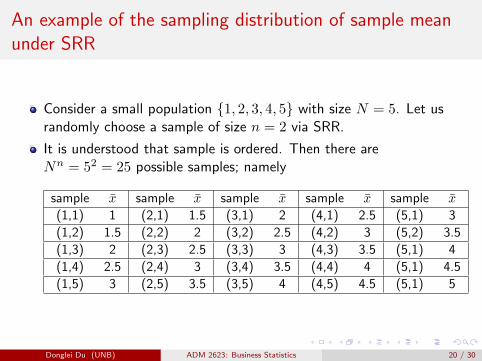
Consider a small population {1, 2, 3, 4, 5} with size N = 5. Let usrandomly choose a sample of size n = 2 via SRR.
It is understood that sample is ordered. Then there areNn = 52 = 25 possible samples; namely
sample x̄ sample x̄ sample x̄ sample x̄ sample x̄
(1,1) 1 (2,1) 1.5 (3,1) 2 (4,1) 2.5 (5,1) 3
(1,2) 1.5 (2,2) 2 (3,2) 2.5 (4,2) 3 (5,2) 3.5
(1,3) 2 (2,3) 2.5 (3,3) 3 (4,3) 3.5 (5,1) 4
(1,4) 2.5 (2,4) 3 (3,4) 3.5 (4,4) 4 (5,1) 4.5
(1,5) 3 (2,5) 3.5 (3,5) 4 (4,5) 4.5 (5,1) 5
Donglei Du (UNB) ADM 2623: Business Statistics 20 / 30
An example of the sampling distribution of sample meanunder SRR
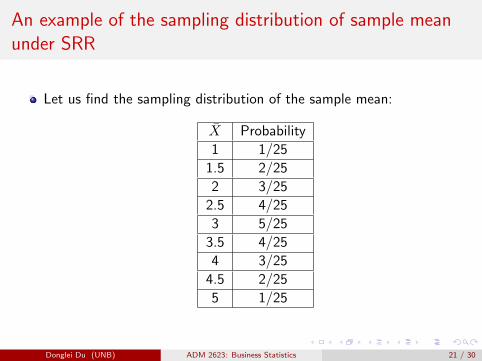
Let us find the sampling distribution of the sample mean:
X̄ Probability
1 1/25
1.5 2/25
2 3/25
2.5 4/25
3 5/25
3.5 4/25
4 3/25
4.5 2/25
5 1/25
Donglei Du (UNB) ADM 2623: Business Statistics 21 / 30

The mean and variance of the sample mean under SRR
Let us find the mean and variance of the sampling distribution of thesample mean:
X̄ P (X̄) X̄P (X̄) X̄2P (X̄)
1 1/25 1/25 1/25
1.5 2/25 3/25 4.5/25
2 3/25 6/25 12/25
2.5 4/25 10/25 25/25
3 5/25 15/25 45/25
3.5 4/25 14/25 49/25
4 3/25 12/25 48/25
4.5 2/25 9/25 40.5/25
5 1/25 5/25 25/25
75/25=3 250/25=10
Donglei Du (UNB) ADM 2623: Business Statistics 22 / 30

The mean and variance of the sample mean under SRR
So the mean and variance of the sample mean are given as
x̄ = 3
s2 = 10− 32 = 1
On the other hand, the population mean and variance are given as
µ =1 + 2 . . .+ 5
5= 3
σ2 =55− 152
5
5= 2
Donglei Du (UNB) ADM 2623: Business Statistics 23 / 30
Relationship between sample and population mean andvariance under SRR
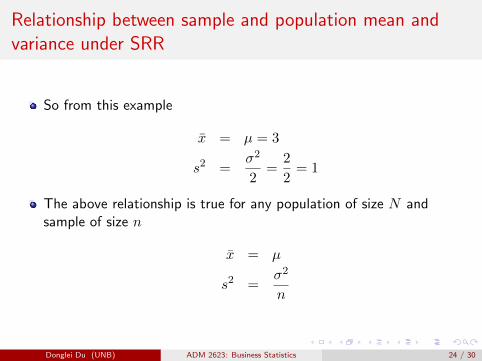
So from this example
x̄ = µ = 3
s2 =σ2
2=
2
2= 1
The above relationship is true for any population of size N andsample of size n
x̄ = µ
s2 =σ2
n
Donglei Du (UNB) ADM 2623: Business Statistics 24 / 30
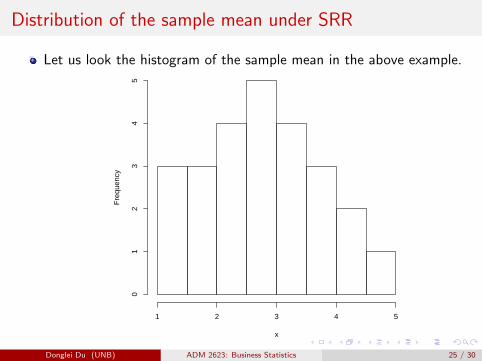
Distribution of the sample mean under SRR
Let us look the histogram of the sample mean in the above example.Histogram of x
x
Fre
quen
cy
1 2 3 4 5
01
23
45
Donglei Du (UNB) ADM 2623: Business Statistics 25 / 30
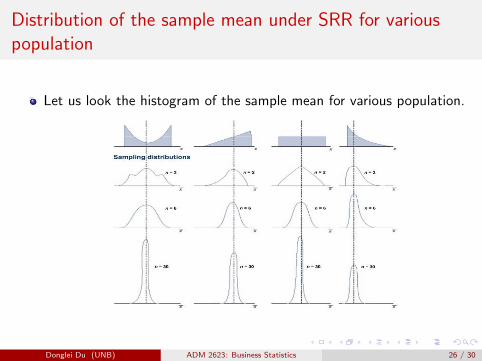
Distribution of the sample mean under SRR for variouspopulation
Let us look the histogram of the sample mean for various population.
Donglei Du (UNB) ADM 2623: Business Statistics 26 / 30
Layout
1 Sampling MethodsWhy SamplingProbability vs non-probability sampling methodsSampling with replacement vs without replacementRandom Sampling Methods
2 Simple random sampling with and without replacementSimple random sampling without replacementSimple random sampling with replacement
3 Sampling error vs non-sampling error
4 Sampling distribution of sample statisticHistogram of the sample mean under SRR
5 Distribution of the sample mean under SRR: The central limit theorem
Donglei Du (UNB) ADM 2623: Business Statistics 27 / 30
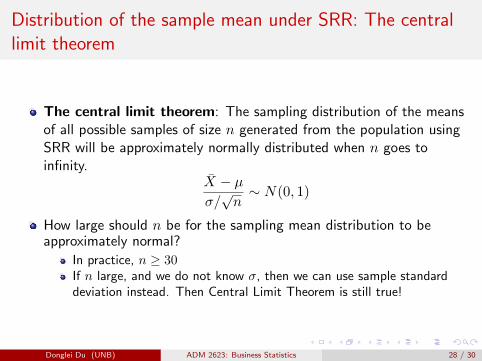
Distribution of the sample mean under SRR: The centrallimit theorem
The central limit theorem: The sampling distribution of the meansof all possible samples of size n generated from the population usingSRR will be approximately normally distributed when n goes toinfinity.
X̄ − µσ/√n∼ N(0, 1)
How large should n be for the sampling mean distribution to beapproximately normal?
In practice, n ≥ 30If n large, and we do not know σ, then we can use sample standarddeviation instead. Then Central Limit Theorem is still true!
Donglei Du (UNB) ADM 2623: Business Statistics 28 / 30
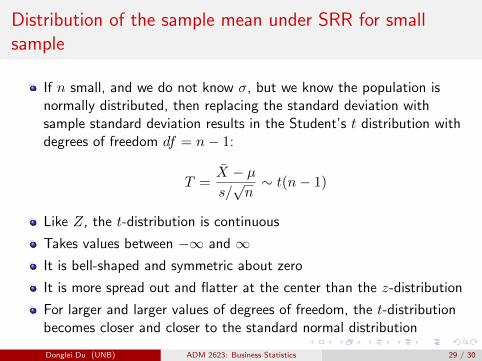
Distribution of the sample mean under SRR for smallsample
If n small, and we do not know σ, but we know the population isnormally distributed, then replacing the standard deviation withsample standard deviation results in the Student’s t distribution withdegrees of freedom df = n− 1:
T =X̄ − µs/√n∼ t(n− 1)
Like Z, the t-distribution is continuous
Takes values between −∞ and ∞It is bell-shaped and symmetric about zero
It is more spread out and flatter at the center than the z-distribution
For larger and larger values of degrees of freedom, the t-distributionbecomes closer and closer to the standard normal distribution
Donglei Du (UNB) ADM 2623: Business Statistics 29 / 30
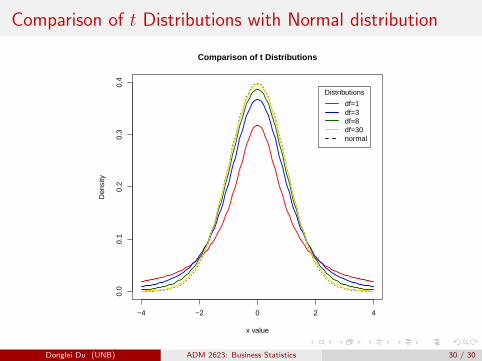
Comparison of t Distributions with Normal distribution
−4 −2 0 2 4
0.0
0.1
0.2
0.3
0.4
Comparison of t Distributions
x value
Den
sity
Distributions
df=1df=3df=8df=30normal
Donglei Du (UNB) ADM 2623: Business Statistics 30 / 30