Embed Size (px)
Citation preview

Lecture 8: Soils and Percolation
Key Questions1. How does grain size control percolation?
2. What is hydraulic conductivity?
3. How do soils affect runoff?
4. How does rain on snow affect runoff?
New Western logo
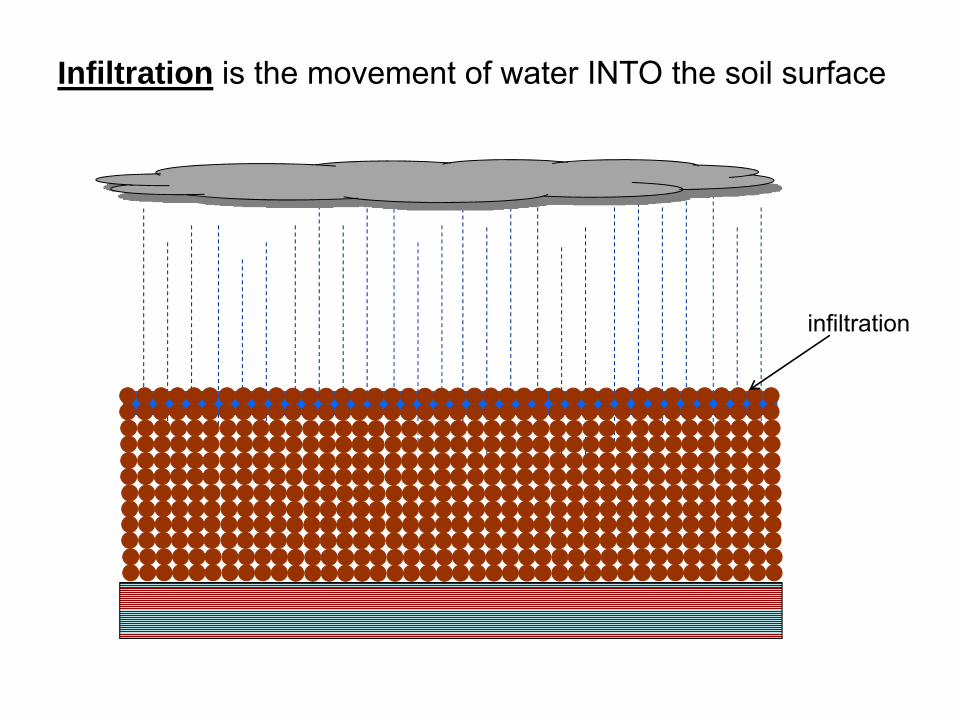
Infiltration is the movement of water INTO the soil surface
infiltration

percolation
Percolation is the movement of water WITHIN the soil matrix.

percolation
Percolation rate controls the infiltration rate
infiltration

Percolation in soils is primarily due to gravity pulling the water vertically downward
gravity “pulls”

The rate of percolation is controlled by grain size

friction along the grain surfaces will resist water flow

The drag force (Fd) acting on a grain falling through liquid is initiated by the frictional interaction between the fluid and the grain.
the grain reaches a constant velocity

The drag force acting on a falling raindrop tends to flatten it into a disc shape
raindrop
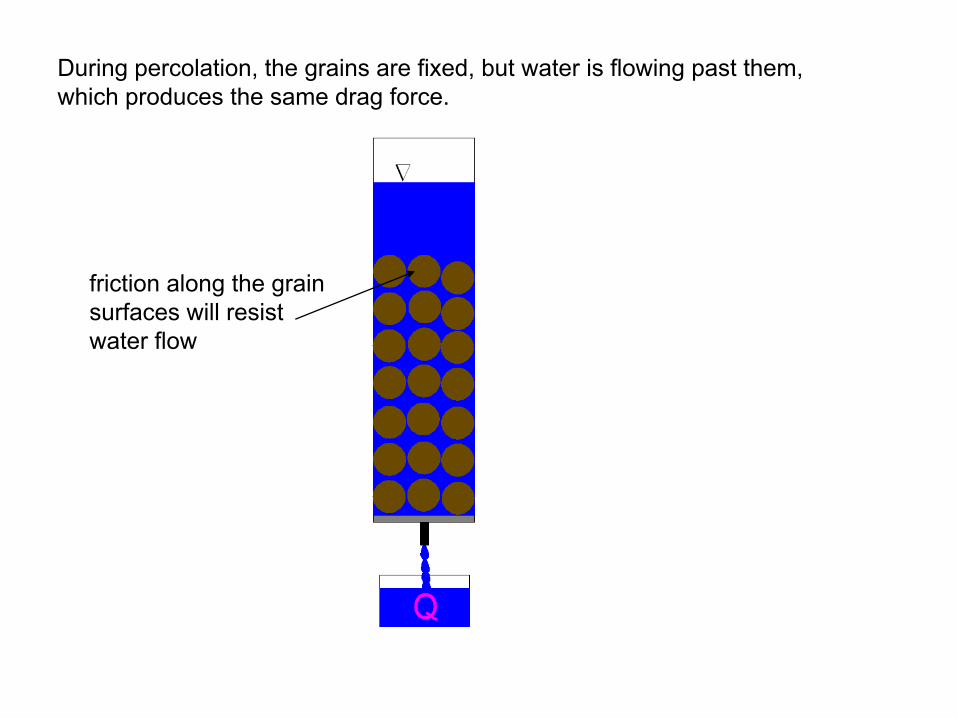
friction along the grain surfaces will resist water flow
During percolation, the grains are fixed, but water is flowing past them, which produces the same drag force.

Stream-Flow Analogy
highest stream velocity
lowest stream velocity
energy lost due to friction along the stream channel

Stream-Flow Analogy
Equivalent stream-channel volumes.
Which one has the lower velocity? Why?

Pipe Flow
high velocity
low velocity
energy lost due to friction along the pipe surface
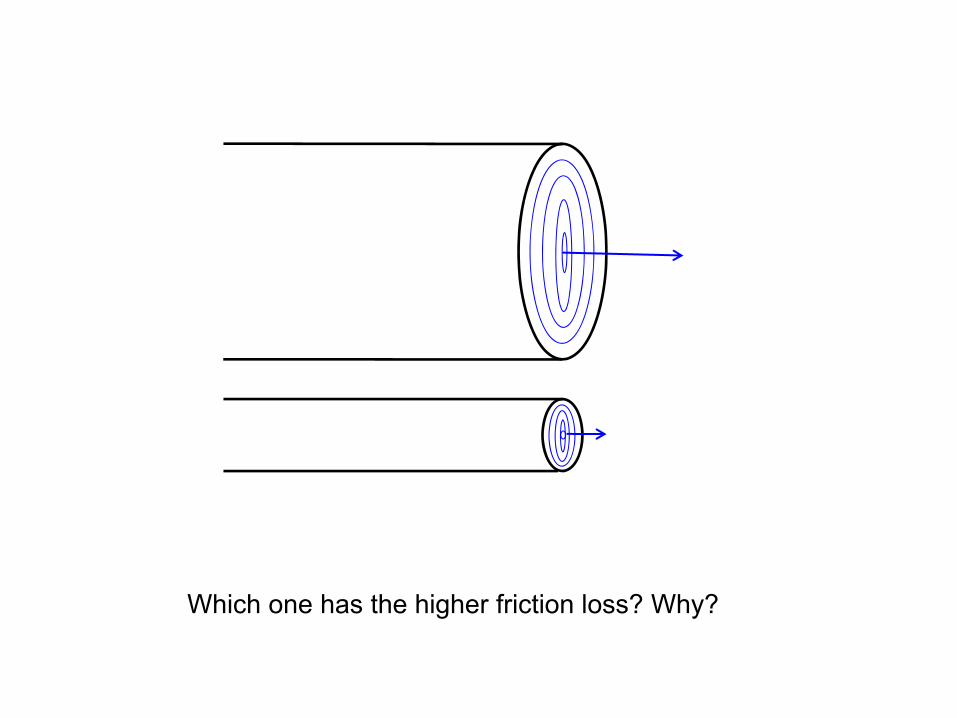
Which one has the higher friction loss? Why?

graingrainfriction along grain
higher water velocity lower water velocity
Pore space between grains
Water Flow in Porous Media

The amount of friction along grain boundaries depends on the surface area of the sediment
reducing a grains diameter (D) by half, increases surface area by four
surface area of a sphere = πD2

Assuming spherical sediments, the surface area per a 1 cm3 volume of spheres is given as
SAv = 6/D
where D = grain diameter
1 cm3

gravel having grain diameters of 4.0 mm
SAv = 15 cm2 per cm3

sand having grain diameters of 0.4 mm
SAv = 150 cm2 per cm3

silt having grain diameters of 0.04 mm
SAv = 1500 cm2 per cm3
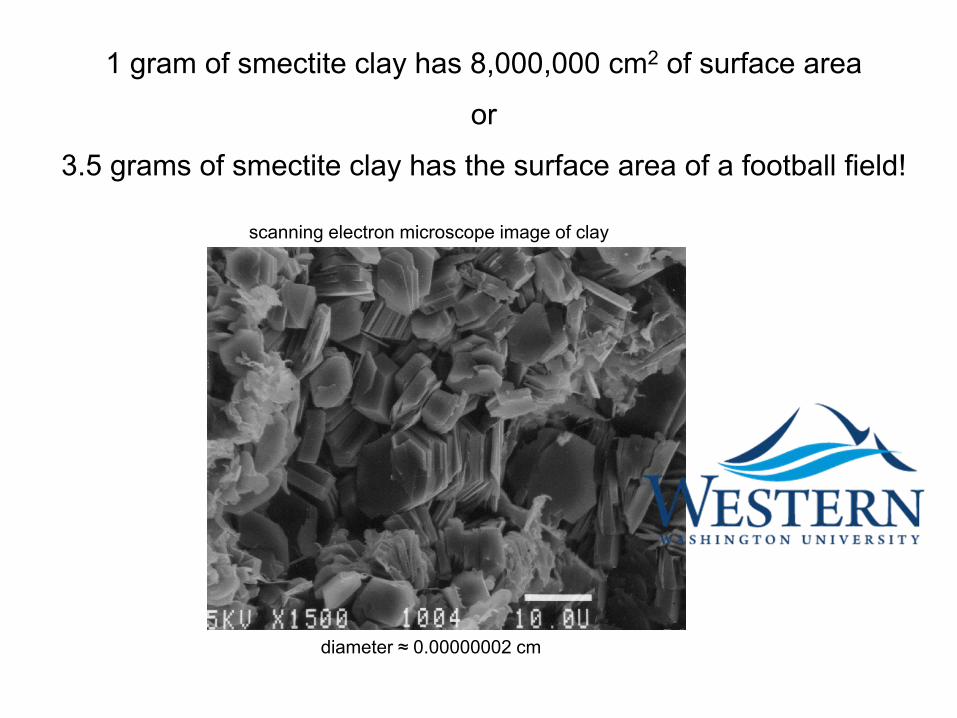
1 gram of smectite clay has 8,000,000 cm2 of surface area
or
3.5 grams of smectite clay has the surface area of a football field!
scanning electron microscope image of clay
diameter ≈ 0.00000002 cm

The hydraulic conductivity (K) is a measure of the sediments abilityto transmit fluid.
It’s magnitude is controlled by the grain size (or pore size) whichdetermines the amount of frictional resistance and the areaavailable for flow.
The units of hydraulic conductivity are length per time (e.g., cm/s)

Smaller grains, means smaller pores, more frictional resistance, and lower hydraulic conductivity

Sand
K ≈ 1 x 10⁻³ cm/s
Silt
K ≈ 1 x 10⁻⁶ cm/s
lower hydraulic conductivity means lower percolation rate

low hydraulic conductivity means low infiltration rate
infiltration
percolation

percolation
high hydraulic conductivity means high infiltration rate
infiltration

Soils with smaller clasts also have greater water holding capacity (stronger capillary forces)
sand
clay
silt

watershed
Q = stream discharge
Q
Time
HydrographQ
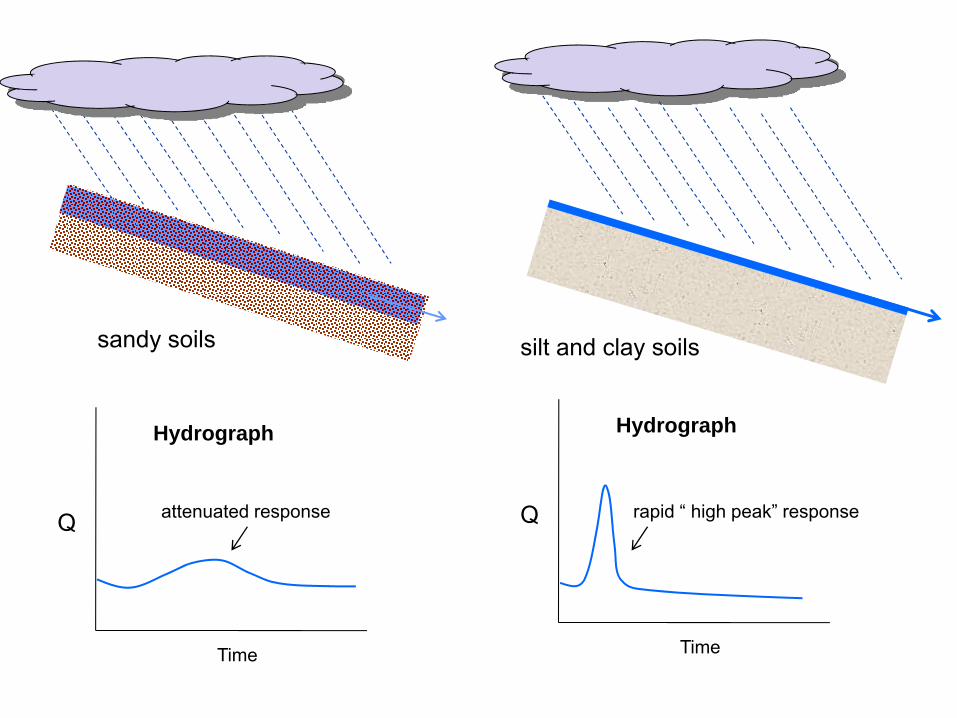
sandy soils silt and clay soils
Q
Time
Hydrograph
Q
Time
Hydrograph
attenuated response rapid “ high peak” response

Impervious surfaces in urban settings don’t allow any infiltration, hence very rapid surface runoff
Q
Time
Hydrograph
very rapid “high peak” response

Water flows to both sides and across Squalicum Parkway near the intersection with Roeder Avenue on Wednesday, January 7, 2009

Frozen soils don’t allow any infiltration, hence very rapid surface runoff
Q
Time
Hydrograph
very rapid “high peak” response
The frost line is 4 to 6 feet in Minnesota

http://www.ndsu.edu/fargo_geology/fldphotos2010.htm
Fargo North Dakota: March 13, 2010

thick, dry soils can store a lot of rain, hence produce less runoff (if they are dry to begin with)
Q
Time
Hydrograph

thin soils saturate quicker, hence produce more runoff
Q
Time
Hydrograph

soils near saturation produce more runoff
Q
Time
Hydrograph

water can flow through the soils toward a stream
Q
Time
Hydrograph

bedrock surfaces in mountain settings have low infiltration rates, hence very rapid surface runoff
Q
Time
Hydrograph
very rapid response

Flood Statistics
Up to 15 inches of rain fell with an average of 10 inches over 60 square miles.
Peak flow on Rapid Creek 50,600 cubic feet per second...more than 10 times greater than the previous flood of record.
During the flood, water rose as fast as 3.5 feet in 15 minutes.
238 people killed.
3,000 people injured.
1,335 homes destroyed.
5,000 automobiles destroyed.
$160 million in total damages (1972 dollars, $644 million in 2002 dollars).
15 of the 23 bridges over Rapid Creek were destroyed.
http://sd.water.usgs.gov/projects/1972flood/photos.html
Rapid City South Dakota, 1972
Flash Flood

Rain on Snow
Early winter snow packs are relatively warm. Warm rains release heat into the snowapck causing some snow to melt, which will produce more runoff.
Q
Time
Hydrograph
runoff

Q
Time
Hydrograph
Q
Time
Hydrograph
snow packno snow pack so rain falls on exposed bedrock and thin, wet soils
more volume, longer duration, but less peaked
Q Q

Soil Coverage (USDA)

Soil Depth (estimated)

Smith Creek Stream Gauge
North Shore MET Station

Smith Creek Hydrograph, May 8--16, 2000
0
10
20
30
40
50
0 50 100 150 200 250
Time (hr)
Dis
char
ge (c
fs)
1.2 inches of rain in 24 hours

1.2 inches of rain in 24 hours
Smith Creek Hydrograph, Sept 7--22, 2000
0
10
20
30
40
50
0 50 100 150 200 250
Time (hr)
Dis
char
ge (c
fs)

Smith Creek Hydrograph, Sept 7--22, 2000
0
10
20
30
40
50
0 50 100 150 200 250
Time (hr)
Dis
char
ge (c
fs)
Smith Creek Stream Gauge
Smith Creek Hydrograph, May 8--16, 2000
0
10
20
30
40
50
0 50 100 150 200 250
Time (hr)
Dis
char
ge (c
fs)
1.2 inches of rain in 24 hours