Embed Size (px)
Citation preview

Lecture 9
Raster Data Analysis
Tomislav Sapic GIS Technologist
Faculty of Natural Resources Management Lakehead University

• The GIS raster data model represents datasets in which square cells of the same size hold numeric values representing features or phenomena within a geographic area. Raster datasets’ extents are of a square or a rectangle shape in which the cells form horizontal (east-west) rows and vertical (north-south) columns. • The structure of the raster and its cells allow for the cell positions to be calculated by knowing the position (x, y coordinates) of one of the raster corners.
Raster Data Model
• Raster cells can hold only numeric values, either integer or decimal. • Raster’s data type and data depth are set for the entire raster – cannot be changed in totality or partially. • Tables attached to integer rasters can hold text attributes as well. • Because of a complete and continuous coverage of a geographic area raster data model lends itself to topological analyses.

Selected Raster File Formats in ArcGIS GRID
• Proprietary ESRI raster file format • Composite files that are structured on a principle of
a workspace and have part of their content stored in their own folder and part of it in the INFO folder.
• Can contain either integers decimal numbers (floating points) at 32-bit.
GRID folder, containing parts (cell values, etc.) of the grid file.
INFO folder, containing parts (statistics, etc.) of all GRIDs in the same workspace (folder)

Selected Raster File Formats in ArcGIS
TIFF
• Tagged Image File Format • Supports 1-bit unsigned and 4-, 8-, 16-, 32-bit signed/unsigned integer, and 32-bit floating point. • 8- and 16-bit unsigned integer files allow for multiple bands.
IMG
• ERDAS IMAGINE remote sensing software proprietary file format. • Supports 1-, 2-, and 4-bit unsigned integer , 8-, 16-, 32-bit signed/unsigned integer, 32- and 64-bit
decimal numbers. • Multiple bands supported at all data depths.

TIFF IMG
GRID
• ArcGIS raster dataset properties of the same dataset in three different formats.

Raster Data Analysis
• Analysis and manipulation of rasters can be divided along different lines, depending on which aspect of the raster use is considered:
o Per-cell versus multiple cells analysis.
o Single raster versus multiple rasters analysis.
o Raster only analysis versus an analysis with a combination of a raster and a vector dataset.
o Mathematical raster operations versus logical operations.
o Generic versus applied algorithms.

Cell Statistics (per-cell, multiple rasters, generic math. algorithm)
Raster Function
Block Statistics (multiple cells, single raster, generic math. algorithm)
Learn more about the functions by searching for them at http://desktop.arcgis.com/en/arcmap/10.3/tools/spatial-analyst-toolbox/zonal-statistics.htm
Zonal Statistics (multiple cells, multiple rasters, generic math. algorithm)
Available operations: minimum, maximum mean, median, range, sum, standard deviation, majority, etc.

Reclassify (per-cell, single raster, value sorting)
Raster Function
Learn more about the functions by searching for them at http://desktop.arcgis.com/en/arcmap/10.3/tools/spatial-analyst-toolbox/con-.htm l
Con (per-cell, single or multiple rasters, logical algorithm) Con (in_conditional_raster, in_true_raster_or_constant, {in_false_raster_or_constant}, {where_clause})

Raster Calculator (per-cell, single or multiple rasters, generic math. algorithm)
Raster Function
Learn more about the functions by searching for them at http://desktop.arcgis.com/en/arcmap/10.3/tools/spatial-analyst-toolbox/raster-calculator.htm
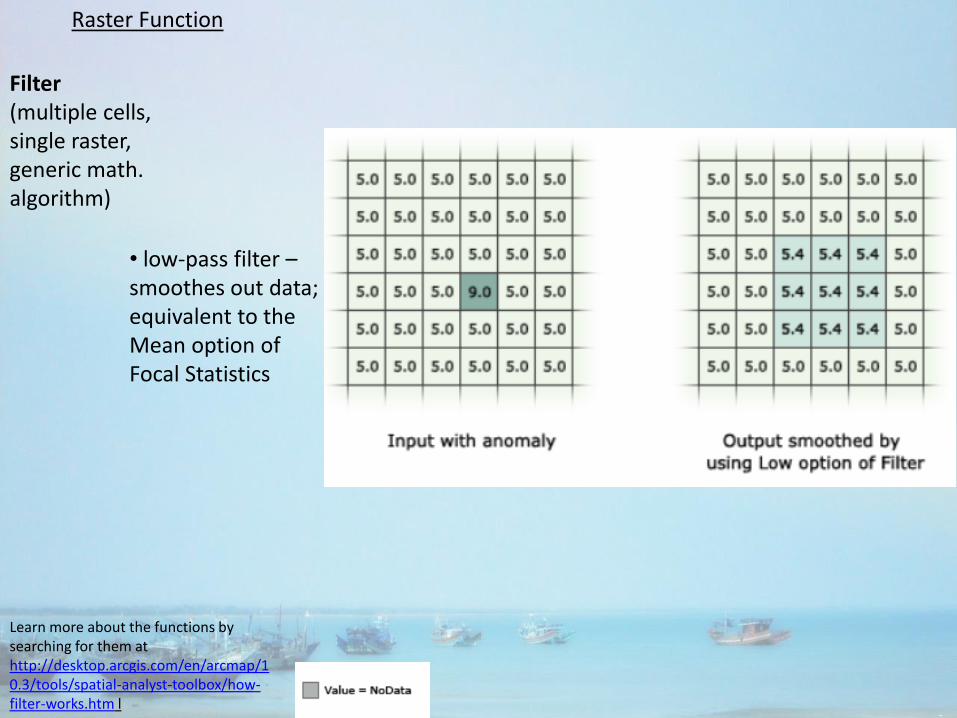
Filter (multiple cells, single raster, generic math. algorithm)
Raster Function
Learn more about the functions by searching for them at http://desktop.arcgis.com/en/arcmap/10.3/tools/spatial-analyst-toolbox/how-filter-works.htm l
• low-pass filter – smoothes out data; equivalent to the Mean option of Focal Statistics

• high-pass filter – accentuates edges in data.
Filter (cont’d)
Raster Function
The filter The data
The calculation for the processing cell (number 8)
Raster example:
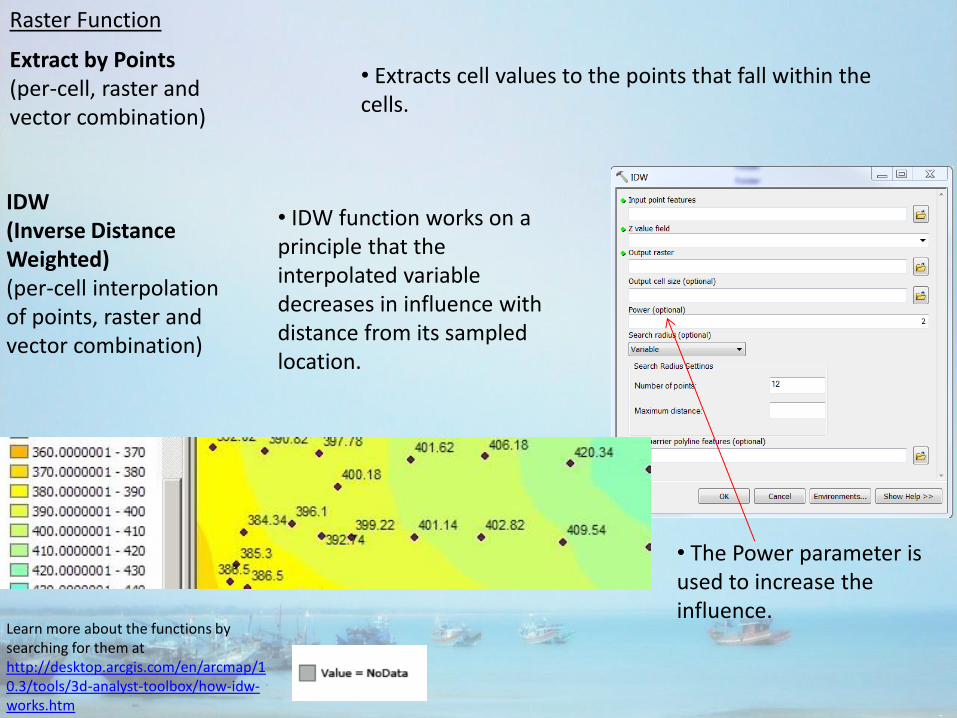
Extract by Points (per-cell, raster and vector combination)
Raster Function
• Extracts cell values to the points that fall within the cells.
Learn more about the functions by searching for them at http://desktop.arcgis.com/en/arcmap/10.3/tools/3d-analyst-toolbox/how-idw-works.htm
IDW (Inverse Distance Weighted) (per-cell interpolation of points, raster and vector combination)
• IDW function works on a principle that the interpolated variable decreases in influence with distance from its sampled location.
• The Power parameter is used to increase the influence.

Different Interpolations Methods Topo to Raster
• Should be used to interpolate terrain if contours, rivers and lakes datasets are available. • Ensures that lakes are ‘flat’ and that rivers have a continuous downward slope in the direction of the flow.
Spline
• Creates smooth surfaces, however, • Continues interpolated trends outside of the range of observed values.
IDW (Inverse Distance Weighted)
• Applies the IDW technique, the assumption of which is that the interpolated values is more close to the observed value, the more closer it is to it geographically, and vice versa. • Should be only used on dense and evenly distributed observed (sample) values – otherwise, tends to create visible ‘rings’ of interpolated values.
Radial Basis Function (Completely Regularized Spline version)
• Can be found in the Geostatistical Analyst extension in ArcGIS • Creates smooth surfaces but that stay within the observed values range.
Kriging
• Geostatistical method – others above are deterministic interpolation methods. • As such, it can produce a prediction surface and provide some measure of the certainty or accuracy of the predictions.

Fill (multiple cells, single raster, generic math. algorithm)
Raster Function • Fills out sinks in the DEM raster, commonly created due to the resolution of the data or rounding of elevations to the nearest integer value. • A sink is a cell surrounded by cells with higher values. • Should be used to rectify a DEM raster and create a new one ready for hydrology tools such as Flow Direction.
ArcGIS 10.1 Help File
120 122 123 122
123 119 123 120
122 122 123 120
121 121 120 120
Sink 120 122 123 122
123 120 123 120
122 122 123 120
121 121 120 120
Filled sink

Cost Path (multiple cells, multiple rasters, generic math. algorithm)
Raster Function
Learn more about the functions by searching for them at http://help.arcgis.com/en/arcgisdesktop/10.0/help/index.html
• Calculates the least-cost path from a source to a destination. • The calculation is based on the values (costs) assigned to cells between the source(s) and the destination. • The size of the cell and the side or diagonal position with respect to the direction of the cost calculation are also included in the calculation. • There can be more than one source cell. • The costs can be additionally weighted.

• one of the inputs for Cost Path is Cost Distance
Cost Distance
Raster Function
• Diagonal movement is increased by the proportional increase in distance versus the side movement, based on the Pythagoras’ theorem: 1.4142 = sq.rt. (1 + 1) Learn more about the functions by
searching for them at http://help.arcgis.com/en/arcgisdesktop/10.0/help/index.html

Cost Distance
Final Cost Distance raster
• The final Cost Distance raster is calculated by spreading, through iterations, with distance costs, cell by cell, between the source (destination) cells and across the cost raster.
Learn more about the functions by searching for them at http://help.arcgis.com/en/arcgisdesktop/10.0/help/index.html

Flow Direction (multiple cells, single raster, applied to hydrology)
Raster Function
Learn more about the functions by searching for them at http://help.arcgis.com/en/arcgisdesktop/10.0/help/index.html
• Working on a terrain (elevation) raster, creates a new raster with cell values indicating flow direction from each cell to its steepest downslope neighbour. • Directions are indicated through codes based on a binary increment. • The drop in the diagonal direction is divided by 1.4142. This affects the calculated steepness of a slope – since it depends on height and distance (rise and run) – and therefore the final direction (e.g. check the direction for the cell with the value of 47, in row 5, column 3).
Flow directions
• Outside of the main flow directions, additional codes are used to indicate directions where there are multiple cell neighbours with the same slope steepness.

Flow Accumulation (multiple cells, single raster, applied to hydrology)
Raster Function
Learn more about the functions by searching for them at http://help.arcgis.com/en/arcgisdesktop/10.0/help/index.html
• Based on the Flow Direction raster, a Flow Accumulation raster is created in which cell values indicate the number of cells that ‘flow’ in that particular cell. • Flow accumulation values can then be used to identify, e.g., streams (areas with high accumulation).
Flow directions

Viewshed (multiple cells, multiple rasters or a combination of a raster and a vector file, applied to viewscaping)
Raster Function
Learn more about the functions by searching for them at http://help.arcgis.com/en/arcgisdesktop/10.0/help/index.html
• Based on the terrain (elevation, surface) raster and observer points (raster cells), a new raster is created in which cell values indicate whether particular cells can be seen from the observer points or not.
• The output values indicate whether the particular cell is visible from any of the observer points or not (Value = 0) and if it is, from how many (Value > 0) – not possible to tell, though, from which observer points.