Embed Size (px)
Citation preview

LECTURE 9Tuesday, 24 FEBRUARY
STA291Fall 2008

Administrative
4.2 Measures of Variation (Empirical Rule)
4.4 Measures of Linear Relationship• Suggested Exercises: 4.27, 4.28, 4.56, 4.58 in the
textbook
2
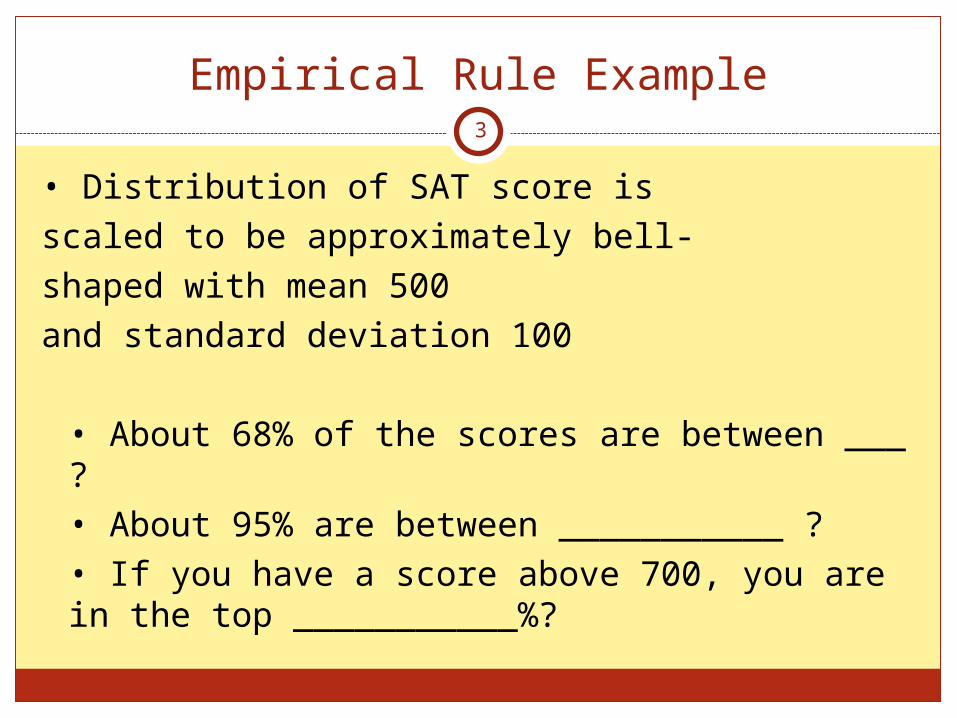
Empirical Rule Example3
• Distribution of SAT score isscaled to be approximately bell-shaped with mean 500and standard deviation 100
• About 68% of the scores are between ___ ?• About 95% are between ___________ ?• If you have a score above 700, you are in the top ___________%?

Example Data Sets
• One Variable Statistical Calculator (link on web page)
• Modify the data sets and see how mean and median, as well as standard deviation and interquartile range change
• Look at the histograms and stem-and-leaf plots – does the empirical rule apply?
• Make yourself familiar with the standard deviation
• Interpreting the standard deviation takes experience
4

Analyzing Linear RelationshipsBetween Two Quantitative Variables
• Is there an association between the two variables?
• Positive or negative?
• How strong is the association?
• Notation– Response variable: Y– Explanatory variable: X
5

Sample Measures of Linear Relationship
• Sample Covariance:
• Sample Correlation Coefficient:
• Population measures: Divide by N instead of n-1
6
iiii
iixy yx
nyx
nn
yyxxs
1
1
1
1
yx
xy
ss
sr
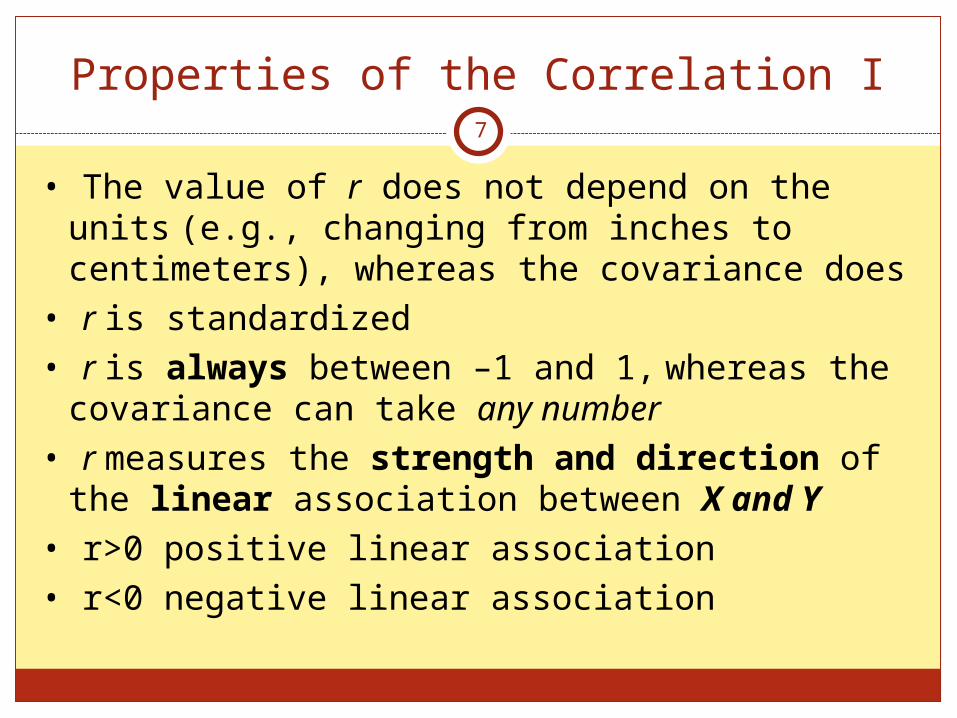
Properties of the Correlation I
• The value of r does not depend on the units (e.g., changing from inches to centimeters), whereas the covariance does
• r is standardized• r is always between –1 and 1, whereas the
covariance can take any number• r measures the strength and direction of
the linear association between X and Y• r>0 positive linear association• r<0 negative linear association
7

Properties of the Correlation II
• r = 1 when all sample points fall exactly on a line with positive slope (perfect positive linear association)
• r = – 1 when all sample points fall exactly on a line with negative slope (perfect negative linear association)
• The larger the absolute value of r, the stronger is the degree of linear association
8

Properties of the Correlation III
• If r is close to 0, this does not necessarily mean that the variables are not associated
• It only means that they are not linearly associated
• The correlation treats X and Y symmetrically• That is, it does not matter which variable isexplanatory (X) and which one is response (Y),the correlation remains the same
9
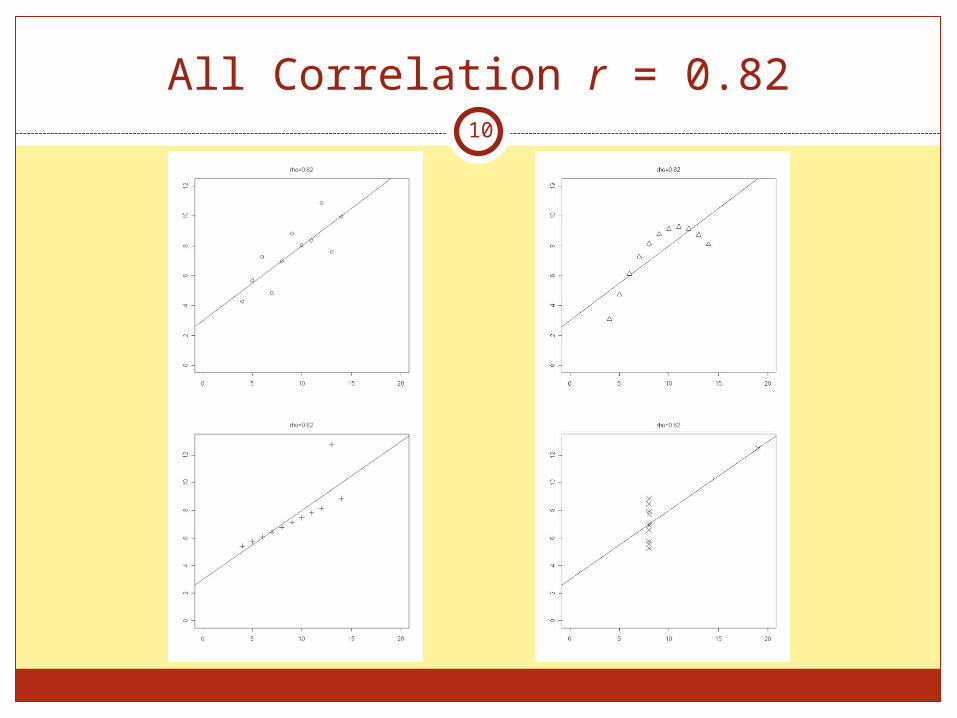
All Correlation r = 0.8210

Scatter Diagram of Murder Rate (Y) andPoverty Rate (X) for the 50 States
11
r = 0.63 Correlation andScatterplot Applet
Correlation by EyeApplet
Simple RegressionAnalysis Tool

r Measures Fit Around Which Line?
• As you’ll see in the applets, putting the “best” line in is, uh, challenging—at least by eye.
• Mathematically, we choose the line that minimizes error as measured by vertical distance to the data
• Called the “least squares method”• Resulting line: • where the slope,
• and the intercept,
12
xbby 10ˆ
21x
xy
s
sb
xbyb 10

13
What line?
• r measures “closeness” of data to the “best” line. How best? In terms of least squared error:

14
“Best” line: least-squares, or regression line
• Observed point: (xi, yi)
• Predicted value for given xi :
(How? Interpretation?)
• “Best” line minimizes , the sum of the squared errors.
ii xbby 10ˆ
2ˆii yy
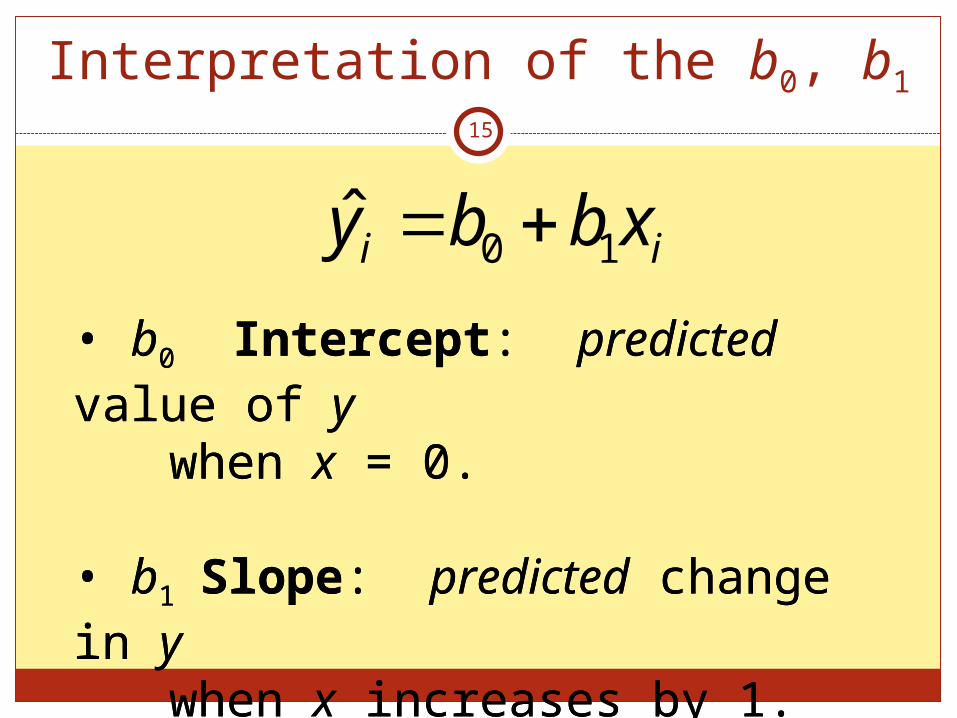
15
Interpretation of the b0, b1
ii xbby 10ˆ
• b0 Intercept: predicted value of y
when x = 0.
• b1 Slope: predicted change in y
when x increases by 1.
• b0 Intercept: predicted value of y
when x = 0.
• b1 Slope: predicted change in y
when x increases by 1.

16
Interpretation of the b0, b1,
ˆ 9.95 2.25i iy x
In a fixed and variable costs model:
• b0 =9.95? Intercept: predicted value of y when x = 0.
• b1 =2.25? Slope: predicted change in y when x increases by 1.
ˆiy

17
Properties of the Least Squares Line
• b1, slope, always has the same sign as r, the correlation coefficient—but they measure different things!
• The sum of the errors (or residuals), , is always 0 (zero).
• The line always passes through the point .
ii yy ˆ
yx,

Attendance Survey Question 918
• On a your index card:– Please write down your name and section number– Today’s Question: