Embed Size (px)
Citation preview

Lecture Materials
RETAIL BANKING
Jack Hubbard Chairman and Chief Sales Officer
St. Meyer & Hubbard Elgin, Illinois
[email protected] 847-717-4328
August 2, 2016


1
1 © 2016 St. Meyer & Hubbard, Inc.
Maximizing Relationship Development through Sales and Service Leadership
Jack Hubbard Chairman and Chief Sales Officer
[email protected] 847-717-4328
2 © 2016 St. Meyer & Hubbard, Inc.
5 Cs of Trust-Based Leadership 1. C________________________________
2. C________________________________
3. C________________________________
4. C________________________________
5. C________________________________
2
3 © 2016 St. Meyer & Hubbard, Inc.
4 © 2016 St. Meyer & Hubbard, Inc.
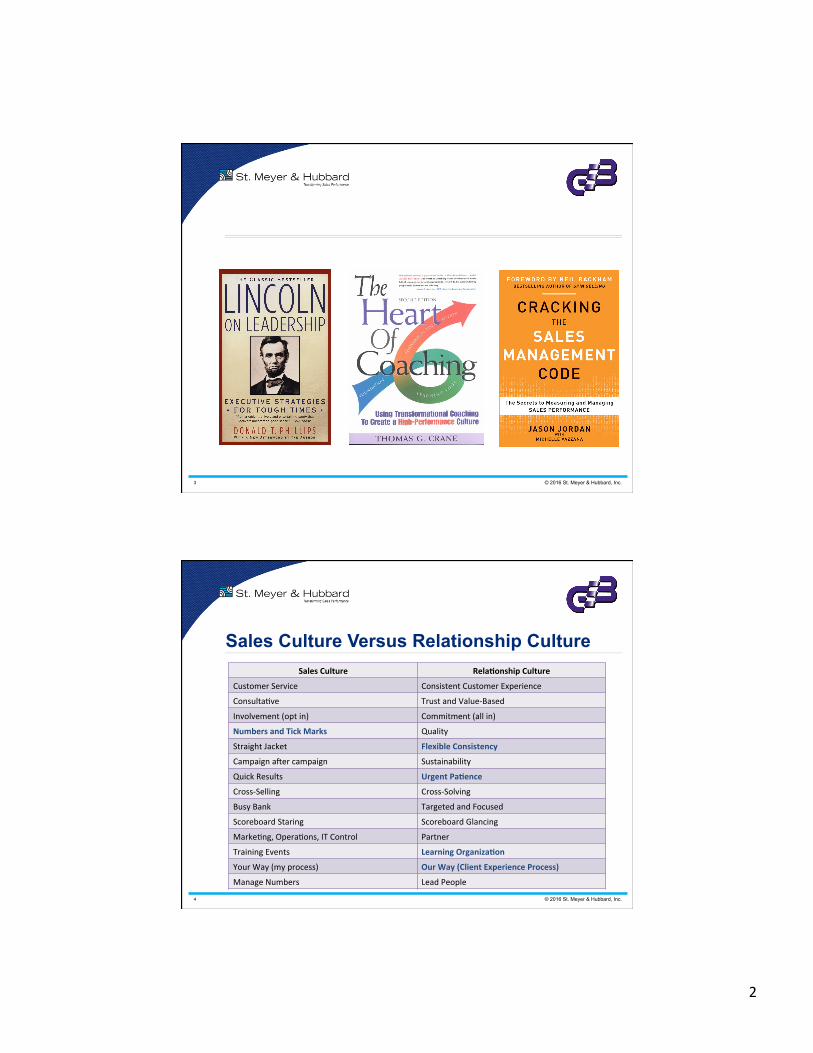
Sales Culture Versus Relationship Culture SalesCulture Rela,onshipCulture
CustomerService ConsistentCustomerExperience Consulta6ve TrustandValue-Based Involvement(optin) Commitment(allin) NumbersandTickMarks Quality StraightJacket FlexibleConsistency CampaignaEercampaign Sustainability QuickResults UrgentPa,ence Cross-Selling Cross-Solving BusyBank TargetedandFocused ScoreboardStaring ScoreboardGlancing Marke6ng,Opera6ons,ITControl Partner TrainingEvents LearningOrganiza,on YourWay(myprocess) OurWay(ClientExperienceProcess) ManageNumbers LeadPeople
3
5 © 2016 St. Meyer & Hubbard, Inc.
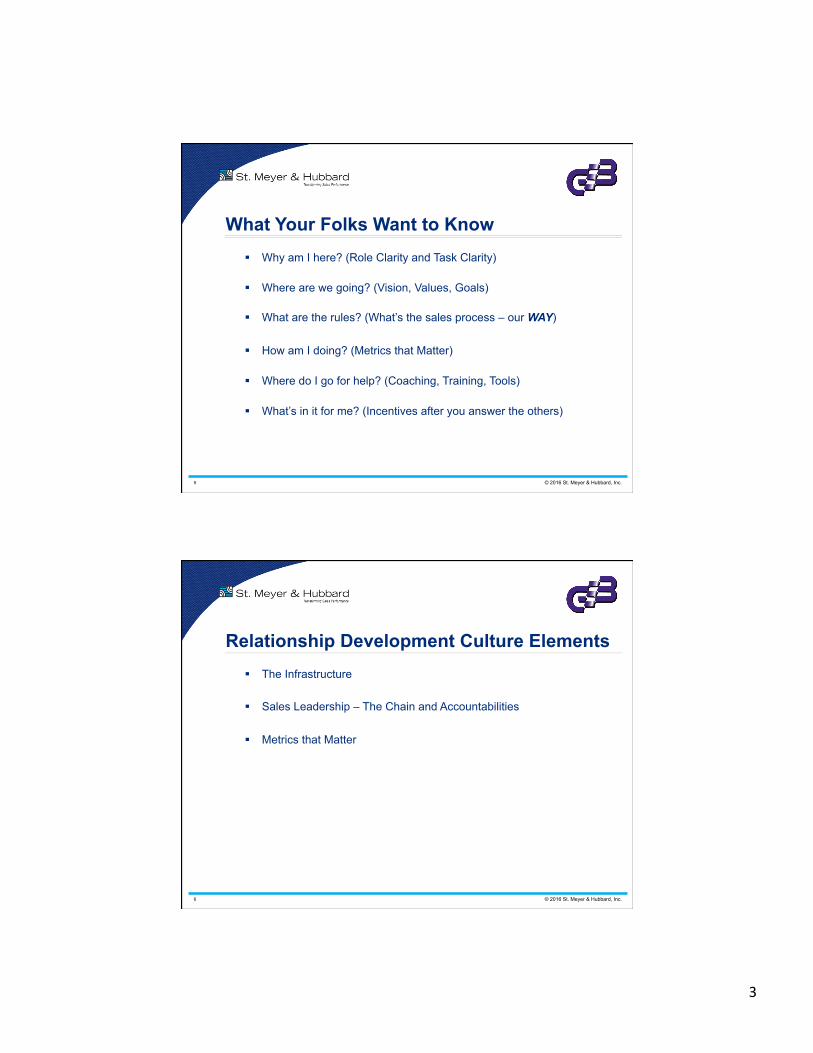
What Your Folks Want to Know § Why am I here? (Role Clarity and Task Clarity)
§ Where are we going? (Vision, Values, Goals)
§ What are the rules? (What’s the sales process – our WAY)
§ How am I doing? (Metrics that Matter)
§ Where do I go for help? (Coaching, Training, Tools)
§ What’s in it for me? (Incentives after you answer the others)
6 © 2016 St. Meyer & Hubbard, Inc.
Relationship Development Culture Elements § The Infrastructure § Sales Leadership – The Chain and Accountabilities
§ Metrics that Matter
4
7 © 2016 St. Meyer & Hubbard, Inc.
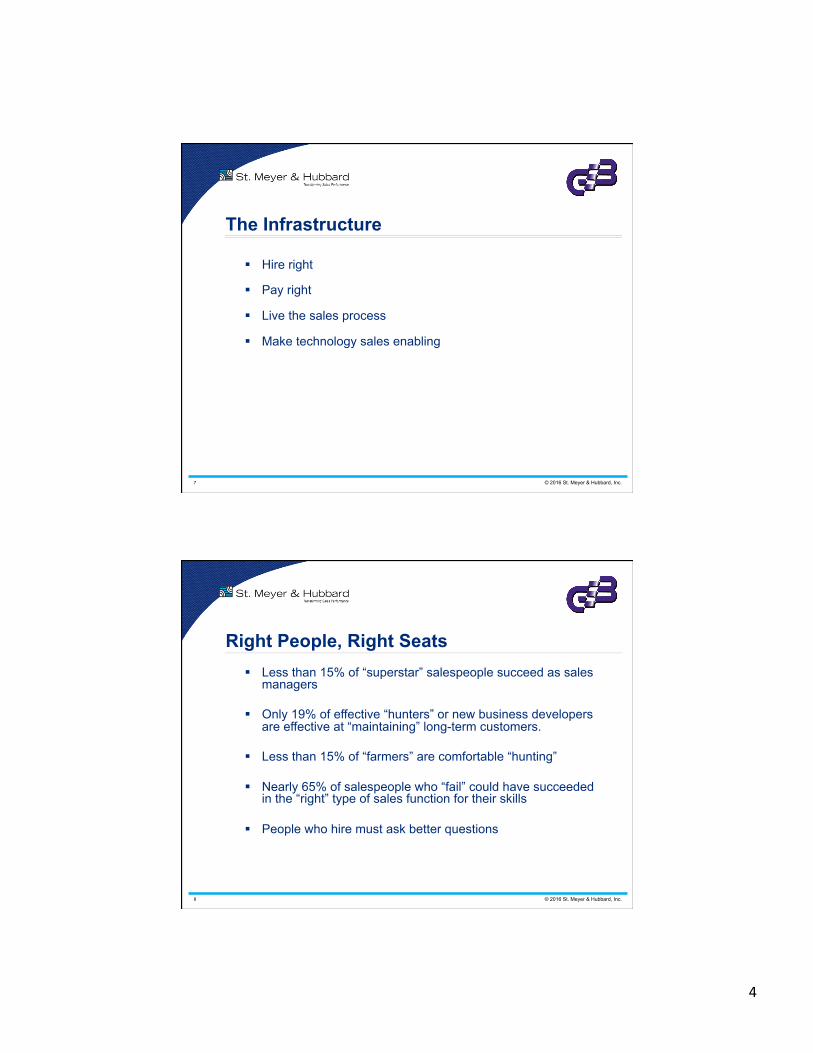
The Infrastructure
§ Hire right
§ Pay right
§ Live the sales process
§ Make technology sales enabling
8 © 2016 St. Meyer & Hubbard, Inc.
Right People, Right Seats § Less than 15% of “superstar” salespeople succeed as sales
managers
§ Only 19% of effective “hunters” or new business developers are effective at “maintaining” long-term customers.
§ Less than 15% of “farmers” are comfortable “hunting”
§ Nearly 65% of salespeople who “fail” could have succeeded in the “right” type of sales function for their skills
§ People who hire must ask better questions
5
9 © 2016 St. Meyer & Hubbard, Inc.
Sourcing, Assessing, OnBoarding § What strategies are in place to source top candidates? § Sales managers sourcing candidates? (War Board) § What behaviors do top performer’s exhibit and how do candidates
mirror those? § What behavioral interview questions are asked? § What role plays are done during the interview process? § What sales testing is in place? § Where are your Sales Managers coming from? § What retention strategies are in place to keep top performers? § What sales related skills and competencies are expected and are
they built into job descriptions from the top down? § How are new employees Onboarded when they join the bank?
10 © 2016 St. Meyer & Hubbard, Inc.
One Bank’s Acquisition Questions § How much of your current business has come through your
direct sales efforts versus the amount you inherited from other portfolios?
§ How do you source and prospect ?
§ How do you secure telephone appointments with prospects?
§ How and when do you bring in partners?
§ How do you find new referral sources and how do you keep mind share with your COIs?
6
11 © 2016 St. Meyer & Hubbard, Inc.
One Bank’s Retention Questions § Talk about portfolio retention rates.
§ Give me an example of how you specifically add value to
clients in your portfolio.
§ What words would your clients use to describe their relationship with you?
§ How do your stay current with Share of Heart events?
§ How likely is it that you know the COIs and trusted advisors of your top 10 clients?
12 © 2016 St. Meyer & Hubbard, Inc.
One Bank’s Intangibles Questions
§ Describe your pre-call planning process.
§ A prospect has suggested they will become your client if you lower your price. What do you say and do?
§ Describe how you use CRM.
§ Describe your post-call follow-up.
§ Discuss how you use LinkedIn as a value and connecting tool.
7
13 © 2016 St. Meyer & Hubbard, Inc.
Pay for Performance
§ Some Keys to Success • Make it easy to understand
• Let me see how I’m doing
• Tweak don’t change
• Pay often
• Manager overrides improve coaching
• Avoid the Flea Test
14 © 2016 St. Meyer & Hubbard, Inc.
The Relationship Development Process Level 1 – Random Process
• Anti-process where bankers do their own thing their own way Level 2 – Informal Process
• Expectation to use the process but no monitoring or measurement Level 3 – Formal Process
• Bank regularly enforces the use of a defined process. Periodic reviews of the process done to see how effective it is and changes made based on the analysis
Level 4 – Dynamic Process
• Bank dynamically monitors and provides continuous feedback on use of its formal process. The process is proactively modified when key changes in market conditions are detected
8
15 © 2016 St. Meyer & Hubbard, Inc.
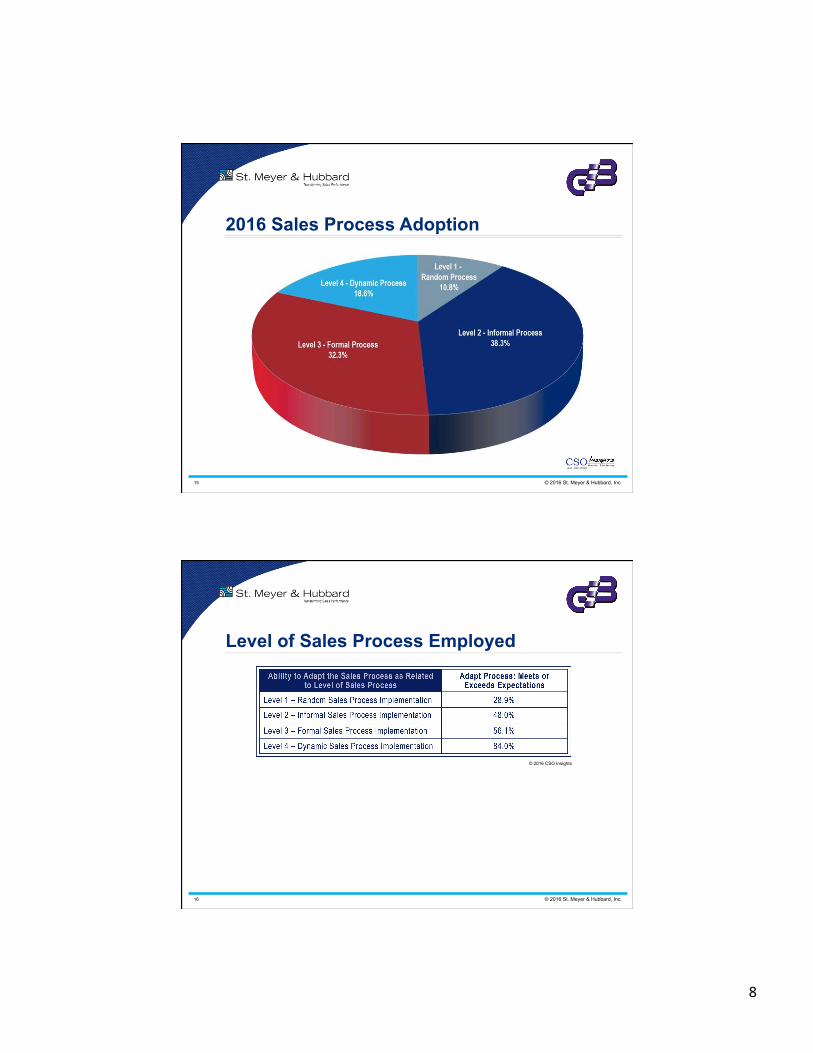
2016 Sales Process Adoption
16 © 2016 St. Meyer & Hubbard, Inc.
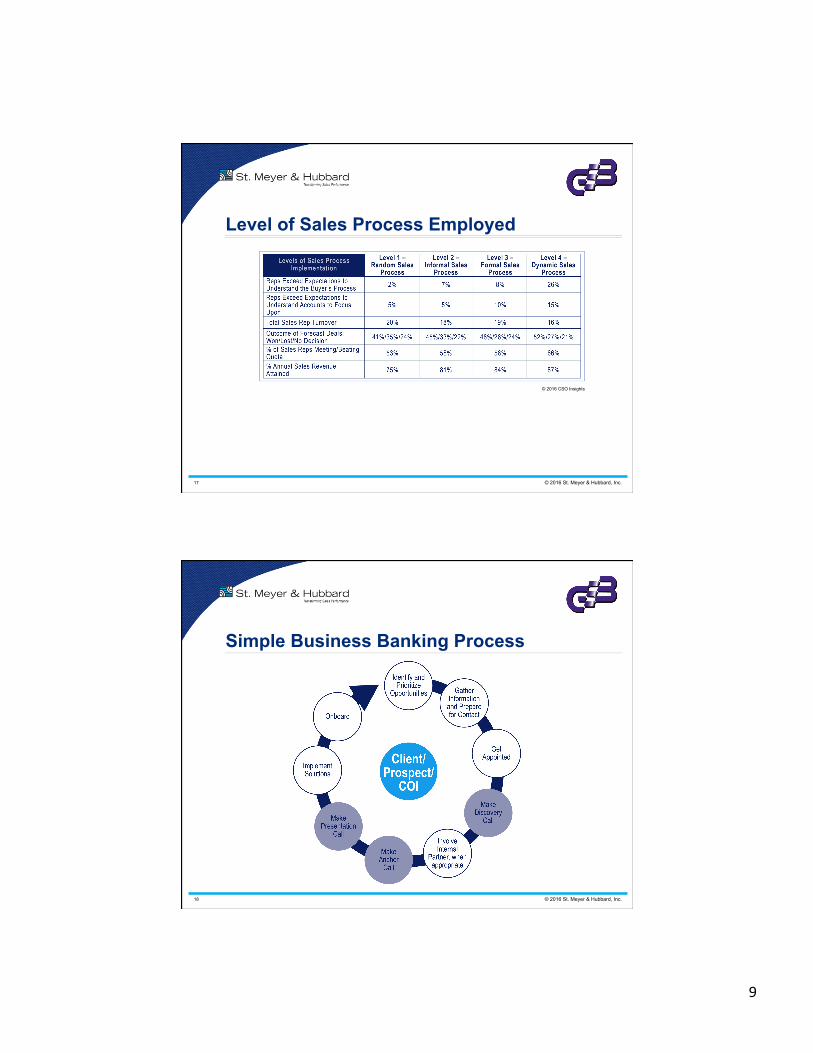
Level of Sales Process Employed
© 2016 CSO Insights
9
17 © 2016 St. Meyer & Hubbard, Inc.
Level of Sales Process Employed
© 2016 CSO Insights
18 © 2016 St. Meyer & Hubbard, Inc.
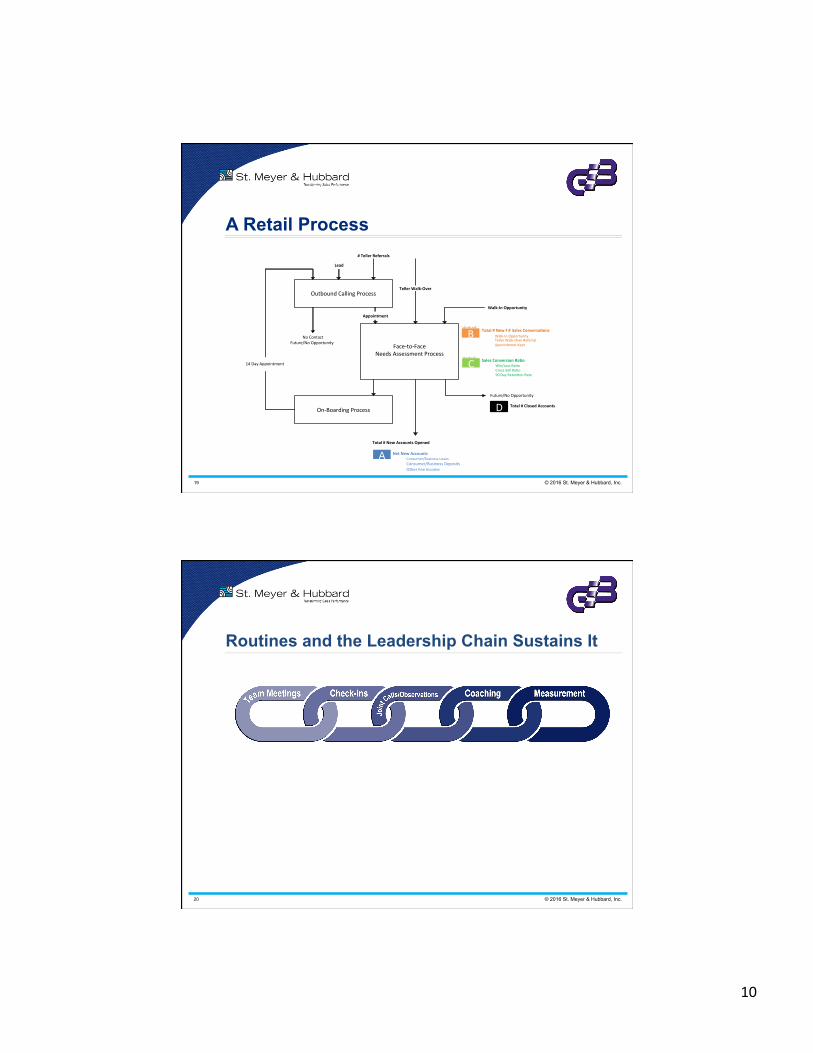
Simple Business Banking Process
10
19 © 2016 St. Meyer & Hubbard, Inc.
A Retail Process
Face-to-FaceNeedsAssessmentProcess
On-BoardingProcess
#TellerReferrals
Walk-InOpportunity
TellerWalk-Over OutboundCallingProcess
Total#NewAccountsOpened
Future/NoOpportunity
Lead
14DayAppointment
Total#NewF:FSalesConversa,ons Walk-InOpportunity TellerWalk-OverReferral AppointmentKept
SalesConversionRa,o Win/LossRa6o Cross-SellRa6o 90DayReten6onRate
Appointment
NoContact Future/NoOpportunity
NetNewAccounts Consumer/BusinessLoansConsumer/BusinessDepositsOtherFeeIncome
D Total#ClosedAccounts
A
D
C
B
20 © 2016 St. Meyer & Hubbard, Inc.
Routines and the Leadership Chain Sustains It

11
21 © 2016 St. Meyer & Hubbard, Inc.
Get To Go Meetings/Group Coaching § Huddle: 15 Minute pre/de brief
§ Pipeline: 45 Minute strategic view of activities and team results
§ Skill Builder: 45 Minute meeting for specific skill
22 © 2016 St. Meyer & Hubbard, Inc.
The Huddle
§ Identify overall gap to goal § Recognize individual successes (outcomes and activities) § Identify improvement opportunities § Strategize improvement action plans § Determine specific outcome and activity goals for the coming
week
15-Minute Branch Check Up to:
12
23 © 2016 St. Meyer & Hubbard, Inc.
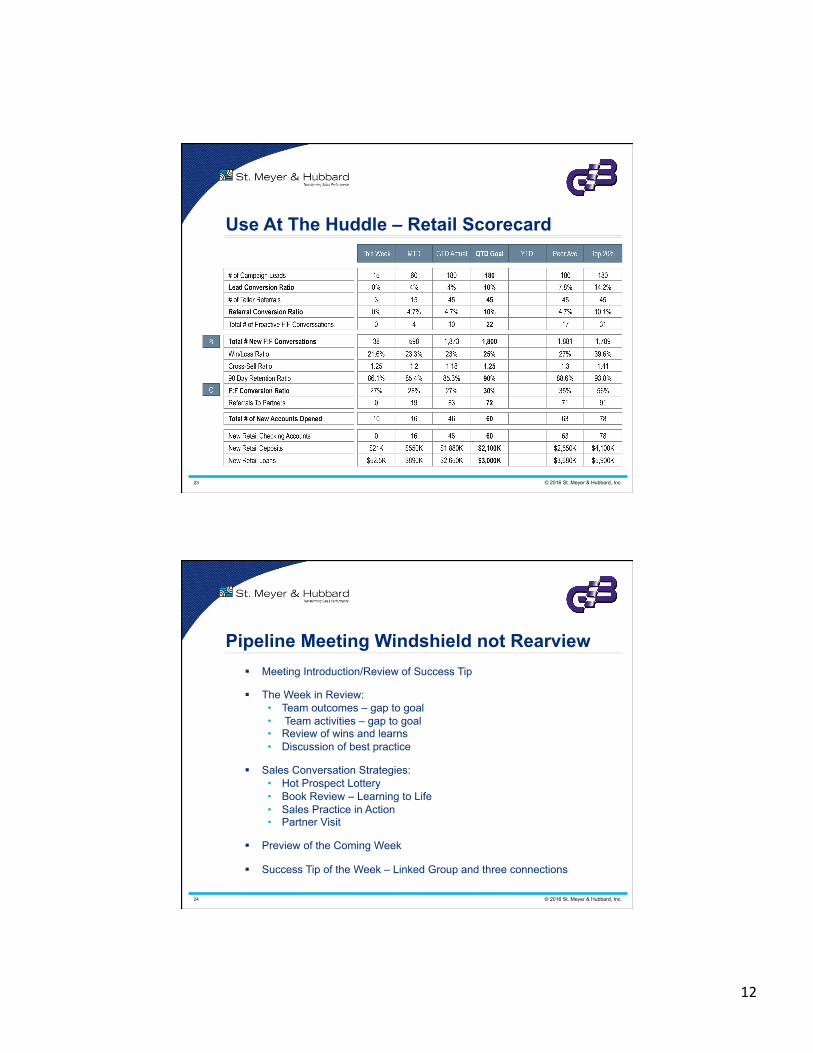
Use At The Huddle – Retail Scorecard
24 © 2016 St. Meyer & Hubbard, Inc.
Pipeline Meeting Windshield not Rearview § Meeting Introduction/Review of Success Tip
§ The Week in Review:
• Team outcomes – gap to goal • Team activities – gap to goal • Review of wins and learns • Discussion of best practice
§ Sales Conversation Strategies:
• Hot Prospect Lottery • Book Review – Learning to Life • Sales Practice in Action • Partner Visit
§ Preview of the Coming Week
§ Success Tip of the Week – Linked Group and three connections
13
25 © 2016 St. Meyer & Hubbard, Inc.
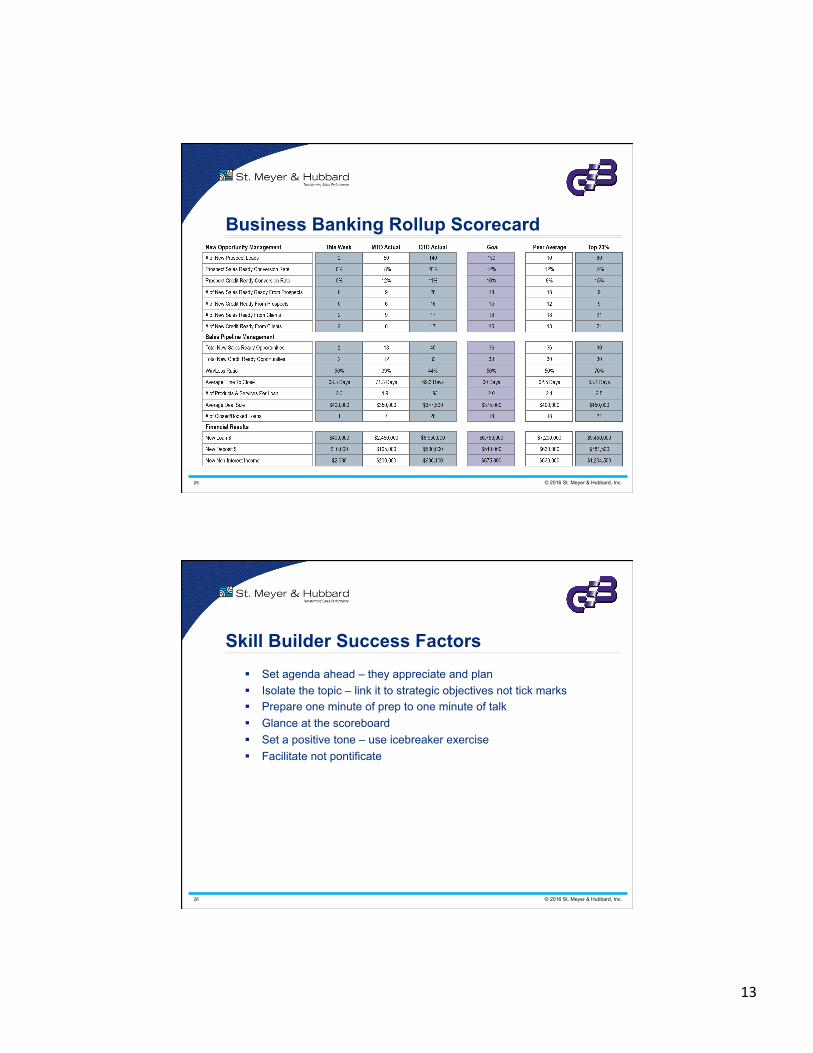
Business Banking Rollup Scorecard
26 © 2016 St. Meyer & Hubbard, Inc.
Skill Builder Success Factors § Set agenda ahead – they appreciate and plan § Isolate the topic – link it to strategic objectives not tick marks § Prepare one minute of prep to one minute of talk § Glance at the scoreboard § Set a positive tone – use icebreaker exercise § Facilitate not pontificate
14
27 © 2016 St. Meyer & Hubbard, Inc.
Skill Builder Success Factors § Skill drills let you see it – nobody likes it – So? § Be inclusive § Prepare your partners § Videos enhance but they are not a “babysitter” § Give an assignment § Distribute evaluation § Follow-up – connect to other routines
28 © 2016 St. Meyer & Hubbard, Inc.
Team Meeting Questions. Ask Yourself… § How does this meeting connect to our strategic, revenue, and
customer experience objectives? § What is everyone’s role in the meeting? § What do I need to prepare to make the meeting successful? § How will participants prepare effectively? § How does time invested in attending this meeting compare to other
ways we could use our time? § When partners attend the meeting, how am I working with them to get
them best prepared for an effective interaction with my people? § What follow-up will I expect my people to do as a result of this
meeting? § How will I link this meeting to my other coaching responsibilities? § How can I continue to make this a “get to” versus a “have to?” § What would I lose and the team not get if we did not have this
meeting?
15
29 © 2016 St. Meyer & Hubbard, Inc.
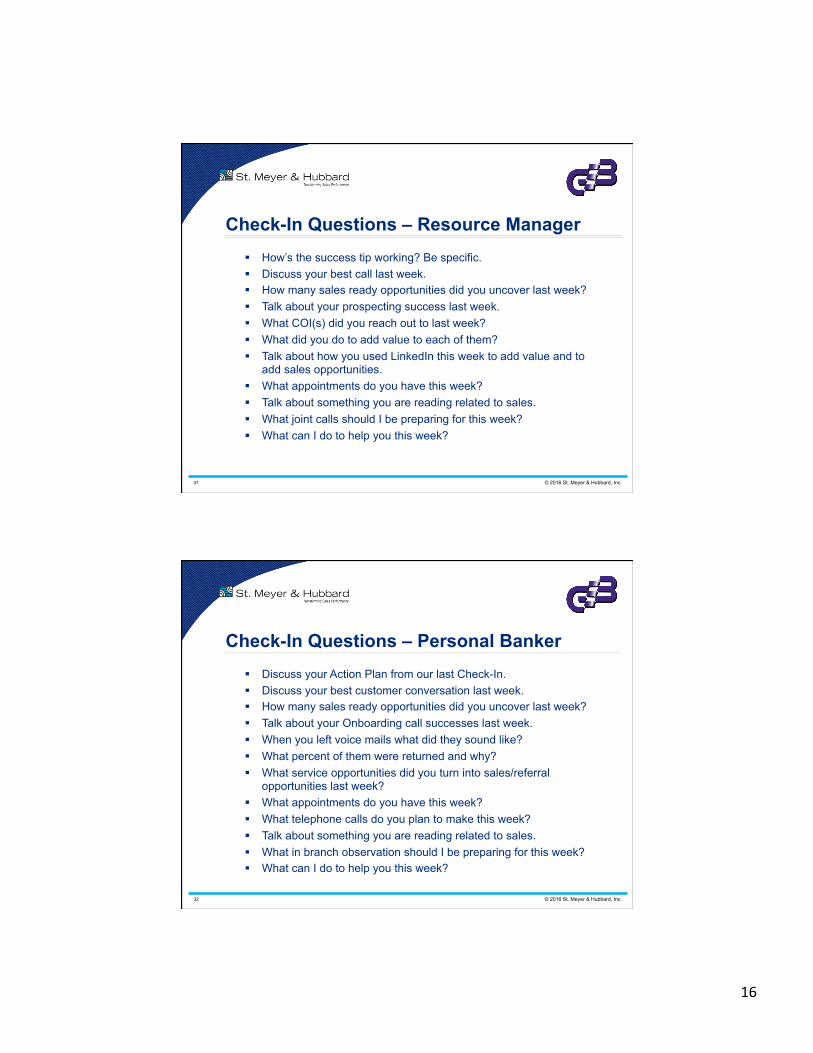
The Check-In Process
I N F O R M A T I O N
Q U E S T I O N S
EVPRetail
President
TheBoardofDirectors
EVPCommercial
EVPMortgage
EVPTrust
BranchManager
HeadTeller Personal
Banker
Teller
Rela,onshipManager
Originator TrustOfficer
Rela,onshipManager
Rela,onshipManager
Originator
Originator
TrustOfficer
TrustOfficer
30 © 2016 St. Meyer & Hubbard, Inc.
Check-In Guidelines § Schedule in advance and make schedule consistent
§ In person (first), on the phone (second) – never via e-mail
§ Prepare in advance
§ Keep to 15-20 minutes
§ Balance the conversation (You talk 20% - they 80%)
§ Discuss activities, behaviors, and outcomes (use the scorecard)
§ Link to all other sales management routines - ”During our last
coaching session”
§ Take good notes and create brief action plan
§ Focus on the future, touch on the past
16
31 © 2016 St. Meyer & Hubbard, Inc.
Check-In Questions – Resource Manager § How’s the success tip working? Be specific. § Discuss your best call last week. § How many sales ready opportunities did you uncover last week? § Talk about your prospecting success last week. § What COI(s) did you reach out to last week? § What did you do to add value to each of them? § Talk about how you used LinkedIn this week to add value and to
add sales opportunities. § What appointments do you have this week? § Talk about something you are reading related to sales. § What joint calls should I be preparing for this week? § What can I do to help you this week?
32 © 2016 St. Meyer & Hubbard, Inc.
Check-In Questions – Personal Banker § Discuss your Action Plan from our last Check-In. § Discuss your best customer conversation last week. § How many sales ready opportunities did you uncover last week? § Talk about your Onboarding call successes last week. § When you left voice mails what did they sound like? § What percent of them were returned and why? § What service opportunities did you turn into sales/referral
opportunities last week? § What appointments do you have this week? § What telephone calls do you plan to make this week? § Talk about something you are reading related to sales. § What in branch observation should I be preparing for this week? § What can I do to help you this week?
17
33 © 2016 St. Meyer & Hubbard, Inc.
A Simple Coaching Process § Isolate
§ Discriminate
§ Observe
§ Communicate (Ask then Tell)
§ Simple Action Plan
§ Connect back to other routines
34 © 2016 St. Meyer & Hubbard, Inc.
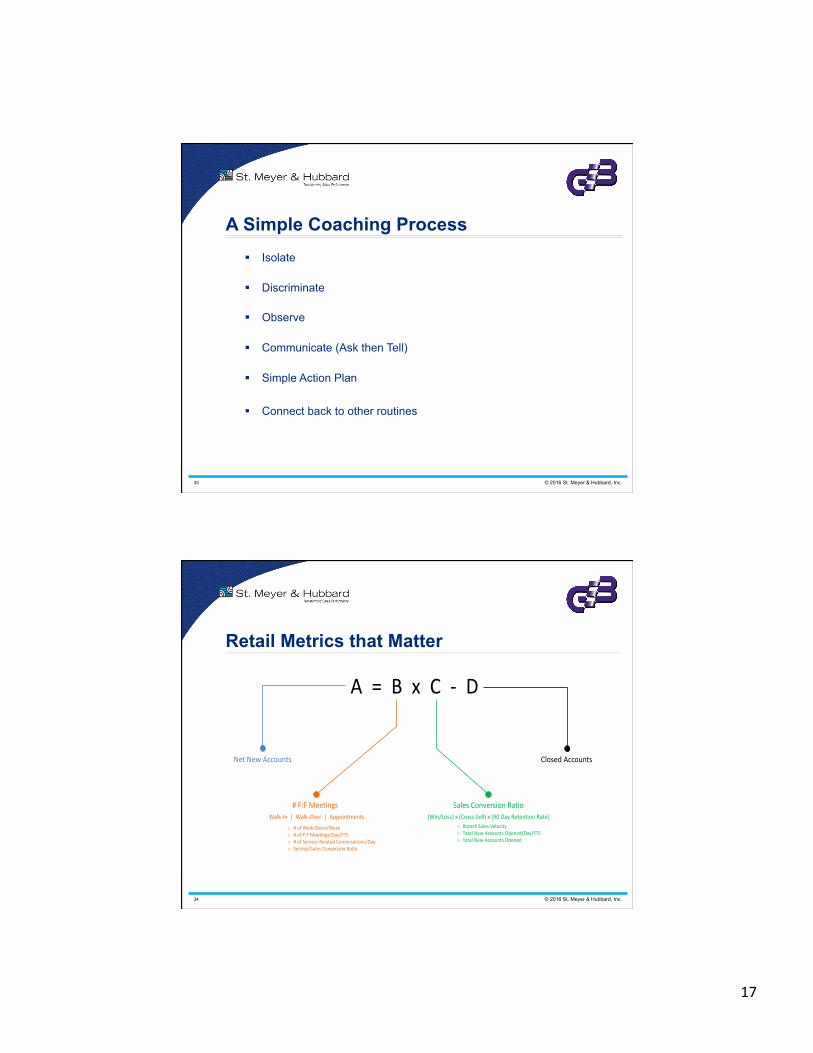
A=BxC- D
RetailSalesMetricsThatMatter
#F:FMeetings
NetNewAccounts
SalesConversionRatio
ClosedAccounts
(Win/Loss)x(Cross-Sell)x(90DayRetentionRate)o BranchSalesVelocityo TotalNewAccountsOpened/Day/FTEo TotalNewAccountsOpened
Walk-In|Walk-Over|Appointments
o #ofWalk-Overs/Weeko #ofF:FMeetings/Day/FTEo #ofService-RelatedConversations/Dayo Service/SalesConversionRatio
Retail Metrics that Matter
18
35 © 2016 St. Meyer & Hubbard, Inc.
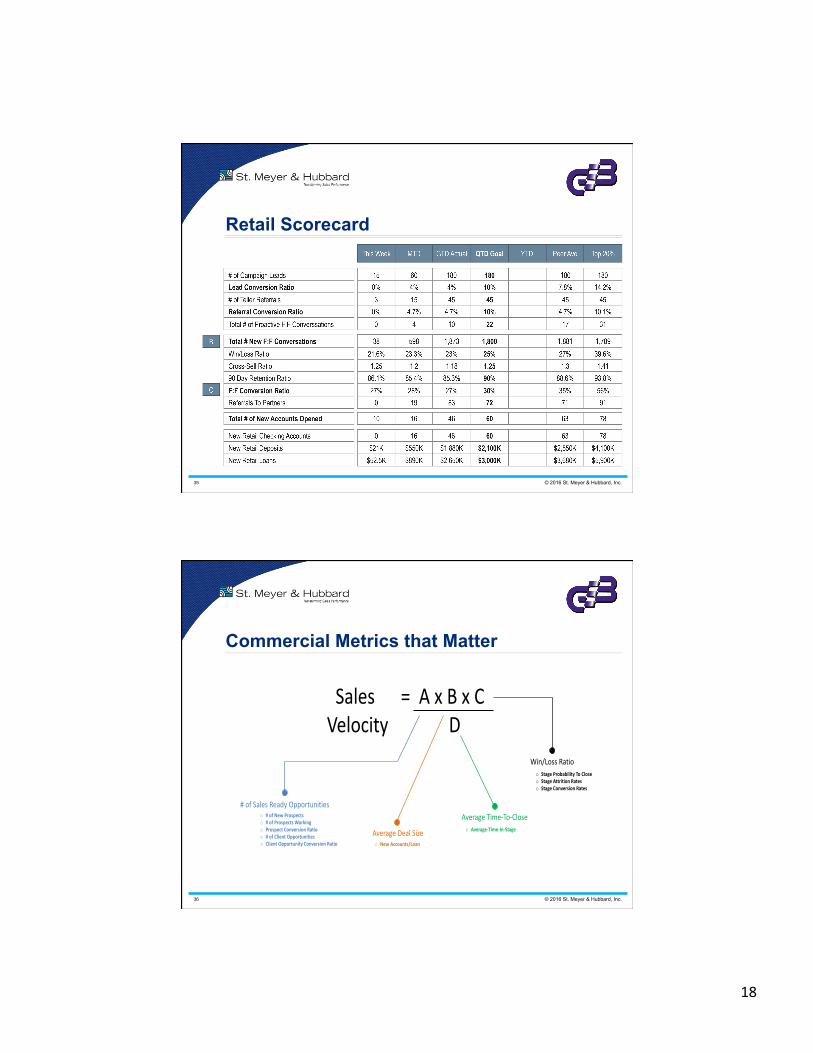
Retail Scorecard
36 © 2016 St. Meyer & Hubbard, Inc.
Sales=AxBxCVelocityD
CommercialSalesMetricsThatMatter
AverageDealSize
#ofSalesReadyOpportunitiesAverageTime-To-Close
Win/LossRatio
o Average-Time-In-Stage
o StageProbabilityToCloseo StageAttritionRateso StageConversionRates
o NewAccounts/Loan
o #ofNewProspectso #ofProspectsWorkingo ProspectConversionRatioo #ofClientOpportunitieso ClientOpportunityConversionRatio
Commercial Metrics that Matter

19
37 © 2016 St. Meyer & Hubbard, Inc.
Business Banking Rollup Scorecard
38 © 2016 St. Meyer & Hubbard, Inc.
Business Banking Coaching Scorecard
20
39 © 2016 St. Meyer & Hubbard, Inc.
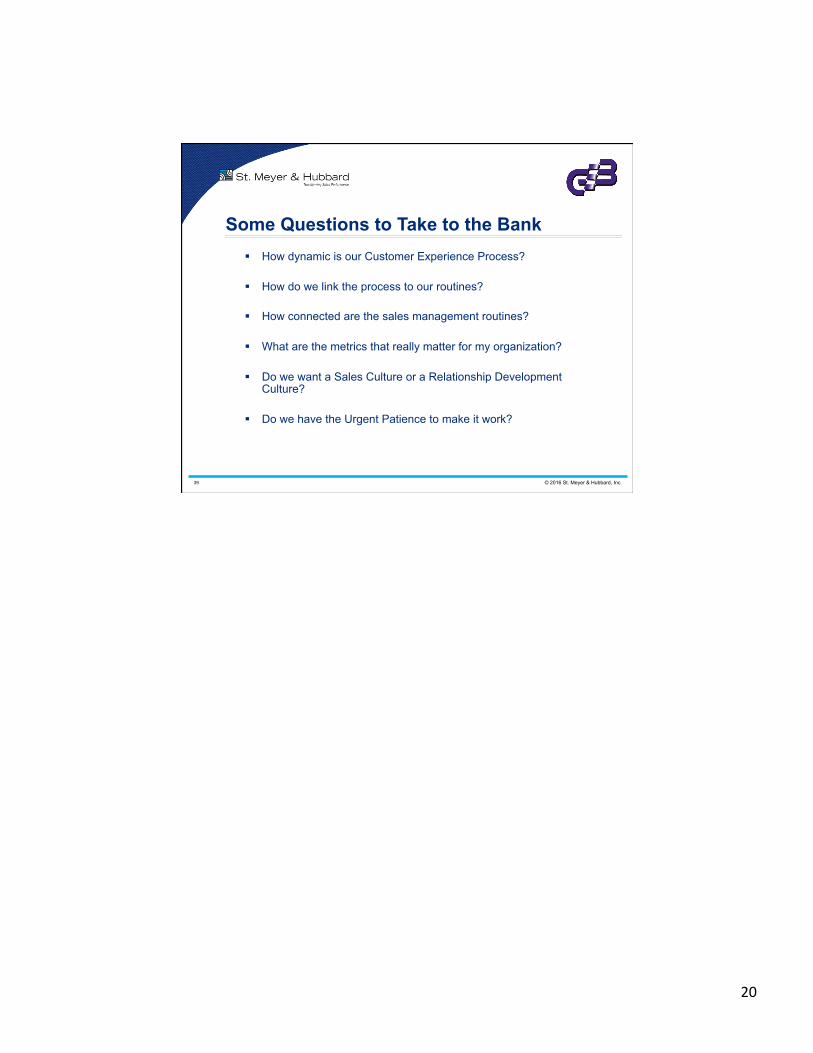
Some Questions to Take to the Bank § How dynamic is our Customer Experience Process?
§ How do we link the process to our routines? § How connected are the sales management routines?
§ What are the metrics that really matter for my organization?
§ Do we want a Sales Culture or a Relationship Development Culture?
§ Do we have the Urgent Patience to make it work?
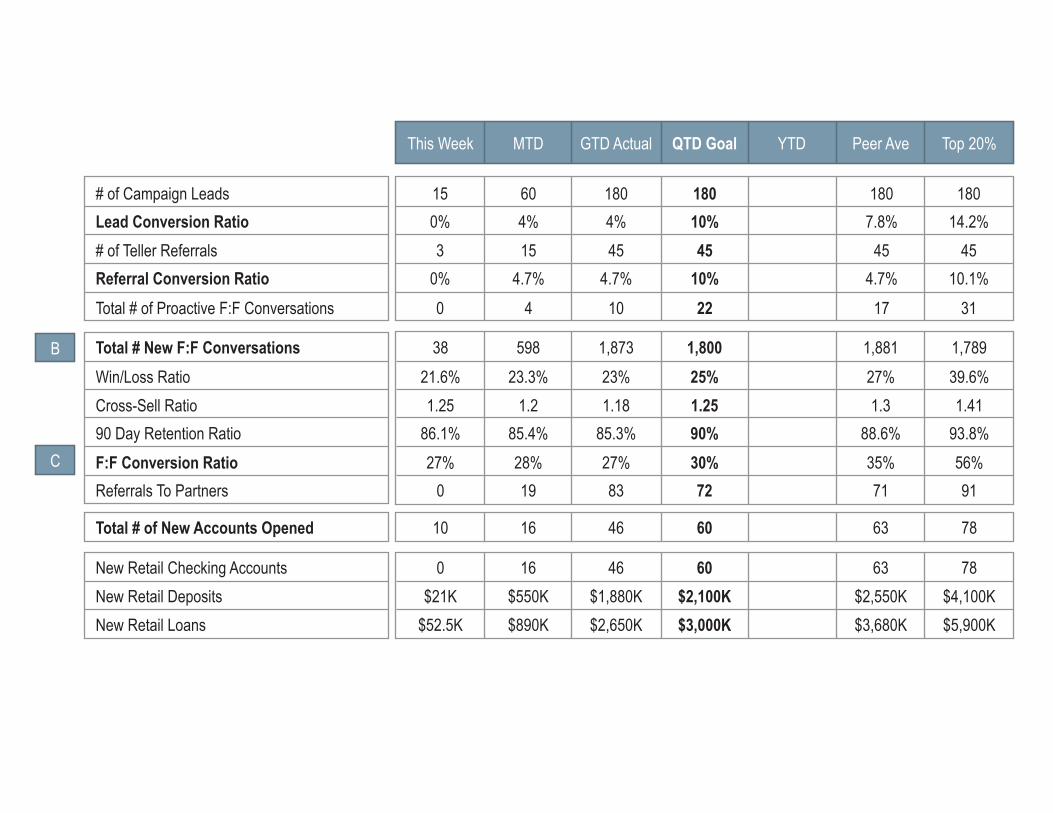
# of Campaign Leads 15
New Retail Checking AccountsNew Retail DepositsNew Retail Loans
Referrals To Partners
90 Day Retention RatioCross-Sell RatioWin/Loss Ratio
Total # of Proactive F:F Conversations
# of Teller ReferralsLead Conversion Ratio
F:F Conversion Ratio
Total # New F:F Conversations
0
86.1%1.25
21.6%
27%
38
19
85.4%1.2
23.3%
28%
598
91
93.8%1.41
39.6%
56%
1,789
71
88.6%1.3
27%
35%
1,881
72
90%1.2525%
30%
1,800
83
0 16 78636046$21K $550K $4,100K$2,550K$2,100K$1,880K
$52.5K $890K $5,900K$3,680K$3,000K$2,650K
10 16 78636046
85.3%1.1823%
27%
1,873
104.7%
454%180
Total # of New Accounts Opened
Referral Conversion Ratio0
30%
0%
60
4
154%
4.7%
180
22
4510%
10%
180
17
457.8%
4.7%
180
31
4514.2%
10.1%
This Week MTD Top 20%Peer AveYTDQTD GoalGTD Actual
B
C
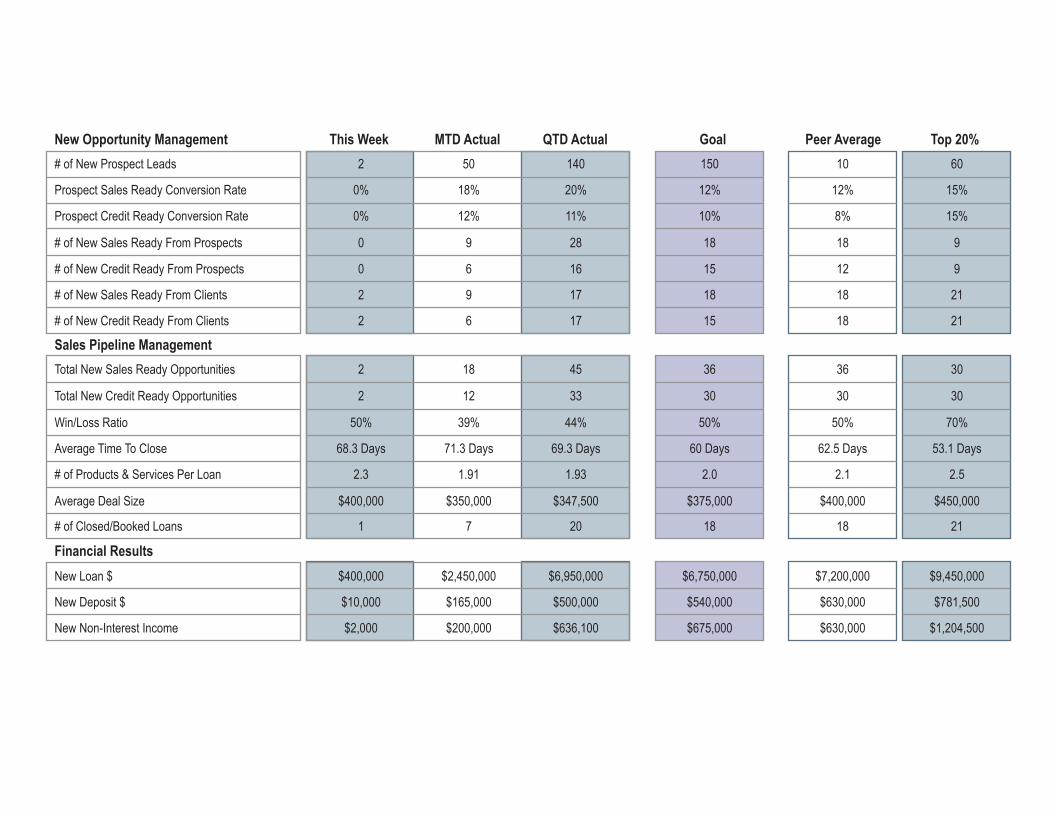
# of New Credit Ready From Prospects
# of Closed/Booked Loans
Average Deal Size
# of Products & Services Per Loan
Average Time To Close
Win/Loss Ratio
Total New Credit Ready Opportunities
Total New Sales Ready Opportunities
New Loan $
New Deposit $
New Non-Interest Income
# of New Credit Ready From Clients
# of New Sales Ready From Clients
# of New Sales Ready From Prospects
Prospect Credit Ready Conversion Rate
Prospect Sales Ready Conversion Rate
# of New Prospect Leads
0
2
2
0
0%
0%
2
6
6
9
9
12%
18%
50
16
17
17
28
11%
20%
140
New Opportunity Management This Week MTD Actual QTD Actual Goal Peer Average Top 20%
Sales Pipeline Management
Financial Results
2.3
1
$400,000
68.3 Days
50%
2
2
1.91
7
$350,000
71.3 Days
39%
12
18
1.93
20
$347,500
69.3 Days
44%
33
45
$2,000
$10,000
$400,000
$200,000
$165,000
$2,450,000
$636,100
$500,000
$6,950,000
15
15
18
18
10%
12%
150
2.0
18
$375,000
60 Days
50%
30
36
$675,000
$540,000
$6,750,000
12
18
18
18
8%
12%
10
2.1
18
$400,000
62.5 Days
50%
30
36
$630,000
$630,000
$7,200,000
9
21
21
9
15%
15%
60
2.5
21
$450,000
53.1 Days
70%
30
30
$1,204,500
$781,500
$9,450,000
# of New Credit Ready From Prospects
# of New Credit Ready From Clients
# of New Sales Ready From Clients
# of New Sales Ready From Prospects
Prospect Credit Ready Conversion Rate
Prospect Sales Ready Conversion Rate
# of New Prospect Leads
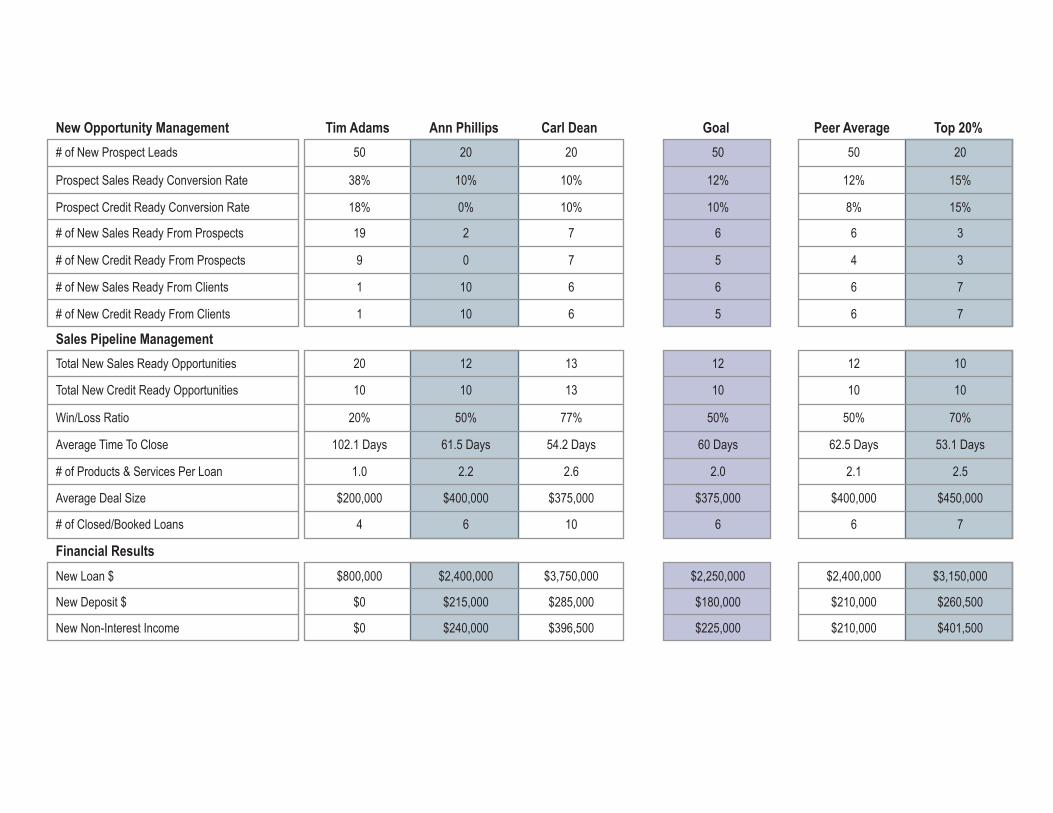
New Opportunity Management
7
6
6
7
10%
10%
20
Carl Dean
2.6
10
$375,000
54.2 Days
77%
13
13
$396,500
$285,000
$3,750,000
0
10
10
2
0%
10%
20
Ann Phillips
2.2
6
$400,000
61.5 Days
50%
10
12
$240,000
$215,000
$2,400,000
9
1
1
19
18%
38%
50
Tim Adams
1.0
4
$200,000
102.1 Days
20%
10
20
$0
$0
$800,000
# of Closed/Booked Loans
Average Deal Size
# of Products & Services Per Loan
Average Time To Close
Win/Loss Ratio
Total New Credit Ready Opportunities
Total New Sales Ready Opportunities
Sales Pipeline Management
New Loan $
New Deposit $
New Non-Interest Income
Financial Results
3
7
7
3
15%
15%
20
Top 20%
2.5
7
$450,000
53.1 Days
70%
10
10
$401,500
$260,500
$3,150,000
4
6
6
6
8%
12%
50
Peer Average
2.1
6
$400,000
62.5 Days
50%
10
12
$210,000
$210,000
$2,400,000
5
5
6
6
10%
12%
50
Goal
2.0
6
$375,000
60 Days
50%
10
12
$225,000
$180,000
$2,250,000