Embed Size (px)
Citation preview
BSP‐UP Professorial Chair Lectures 28 – 29 May 2012
Bangko Sentral ng Pilipinas Malate, Manila
Lecture No. 1
Credit, Credit Derivatives, and Credit Default Swaps
by
Dr. Sergio S. Cao BSP UP Centennial Professor
of Accounting

Credit, Credit Derivatives, and Credit Default Swaps
by Sergio S. Cao, PhD1
College of Business Administration University of the Philippines
Abstract: Credit derivatives are financial instruments that have had tremendous impacts on capital markets by allowing the transfer and trading of credit risks. They comprise a significant percentage of the very big derivatives market. It is important therefore to have an understanding of these types of derivatives, their characteristics, uses, even pricing. This paper discusses these about the most common type of credit derivatives, credit default swaps. It also explains how they figured in the 2008 financial crisis and in the present situation in Greece. There is also a discussion of credit linked notes.
Introduction
On March 9, 2012, the EMEA2 Determination Committee (EMEA DC3) resolved that a Restructuring Credit Event has occurred under Section 4.7 of the ISDA4 2003 Credit Derivatives Definitions after Greece pulled off a massive restructuring of debt where a vast majority of private sector lenders agreed to swap $77 billion in Greek debt for new bonds worth as much as 75 percent less. This development is what has been feared for a while now, with the European Central Bank trying to prevent a trigger for pay offs of credit default swaps on Greek bonds, mindful that a Greek default may lead to another financial crisis, similar to what the world experienced following the subprime crisis in 2008.
In connection with the EMEA DC announcement, the DC also announced an auction with respect to the settlement of standard CDS for which Greece is the reference entity. This auction is part of standard procedures to determine how much value has been lost on the debt and to determine how much settlement is due to the protection buyers. This massive Greek debt restructuring is said to be the first by a developed country in 60 years, and the biggest in history.
This event highlights the role of CDS in a financial crisis situation; something that was also brought to the fore during the 2008 subprime crisis particularly in the experience of AIG. In fact, one of the concerns raised in the Greek situation is whether there is also a single entity, or a few entities only, that have insured investors holding Greek debt, similar to the situation in 2008 with AIG. It should be recalled that following the downgrade by Standard & Poor's, and Moody's Investor
1 On leave as Professor of Finance from the University of the Philippines Diliman; this lecture is part of the 2012 BSP-UP Centennial Professorial Chairs requirement 2 EMEA refers to Europe, Middle East and Africa 3 A Credit Derivatives Determinations Committee ("DC") currently exists in each of the following regions: the Americas, Asia excluding Japan, Australia-New Zealand, EMEA (Europe), and Japan. Each DC deliberates issues involving Reference Entities traded under Transaction Types that relate to the relevant region, including Credit Events, CDS Auctions, Succession Events and other issues. The determinations made by the DCs are governed by the Determinations Committees Rules. ISDA acts as a non-voting secretary to each DC and endeavors to co-ordinate this process in a transparent and operationally efficient manner. 4 International Swaps and Derivatives Association, which represents participants in the privately negotiated derivatives industry, is among the world’s largest global financial trade associations as measured by number of member firms. It was chartered in 1985, and today has over 800 member institutions from 56 countries on six continents. For information, see www.isda.org.
Page 1 of 26
Service of AIG from triple A (AAA) to single A (A) rating, collateral calls were made on AIG's CDS collateralization requirements, requiring the world's biggest insurance firm to produce approximately $100 billion of funds. While the general view was that AIG's collapse was due to its exposure to mortgage backed securities (MBS) backed by subprime loans, it was really largely due to its CDS exposures. At the time of the collateral call, AIG's CDS contracts were estimated at $450 billion; and AIG did not have the funds on hand and had to be bailed out.
What are credit default swaps or CDS? How do they figure in the financial crisis of 2008 and in the present situation in Greece and Europe? This paper discusses credit derivatives, particularly credit default swaps, CDS, their characteristics and uses, and gives examples of pricing of CDS. It describes briefly the development and growth of the market and the role they play in the European financial crisis and in the 2008 subprime crisis. There will also be a discussion of structured products with embedded CDS like credit linked notes or CLNs.
Credit derivatives
CDS belong to the general class of instruments called credit derivatives5. Credit derivatives are instruments that allow the transfer of credit risk, like in a bond, from the holder of the bond to another party without necessarily transferring, or selling, the bond itself. The value of a credit derivative is derived from the credit performance of the reference entity or reference asset which may be a corporate bond, a sovereign debt, or other debt obligations. Credit derivatives allow credit risk to be stripped from loans and bonds and placed in a different market; they can be traded on a stand-alone basis or embedded in some other structured products. The credit derivatives market includes the more common credit default swaps or CDS, total return swaps, credit spread forwards, and options.
Credit default swaps Consider Company A that extends a debt to Company C that issues a bond for the debt. Company A then buys protection from Company B such that when Company C defaults on the bond, Company A has the right to sell the bond to Company B; that is, Company B will compensate Company A by buying the bond at face value. In return, Company A pays premium to Company B. These are the basic terms in a credit default swap or CDS. Company A is said to be a “buyer of protection” while Company B is said to be a “seller of protection” in this CDS. Company C is called the “reference entity”, the face value of the bond is called “notional principal”, and a default by Company C is called a “credit event”. In a later section, we will see that reference entities for CDS include banks, companies and sovereigns. A key aspect of a CDS contract is the definition of a credit event. The following example taken from Hull illustrates the basic structure of a CDS6.
Suppose that two parties enter in to a 5-year credit default swap on March 1, 2009. Assume that the notional principal is $100 million and the buyer agrees to pay 90 basis points annually for protection against default by the reference entity.
5 Taken from Financial Risk Management Handbook (FRMH), 4th Edition, Philippe Jorion, Global Association of Risk Professionals; p. 500 6 Options, Futures, and Other Derivatives,7th Edition, John Hull, Pearson Prentice Hall, 2009; Sec. 23.1
Page 2 of 26
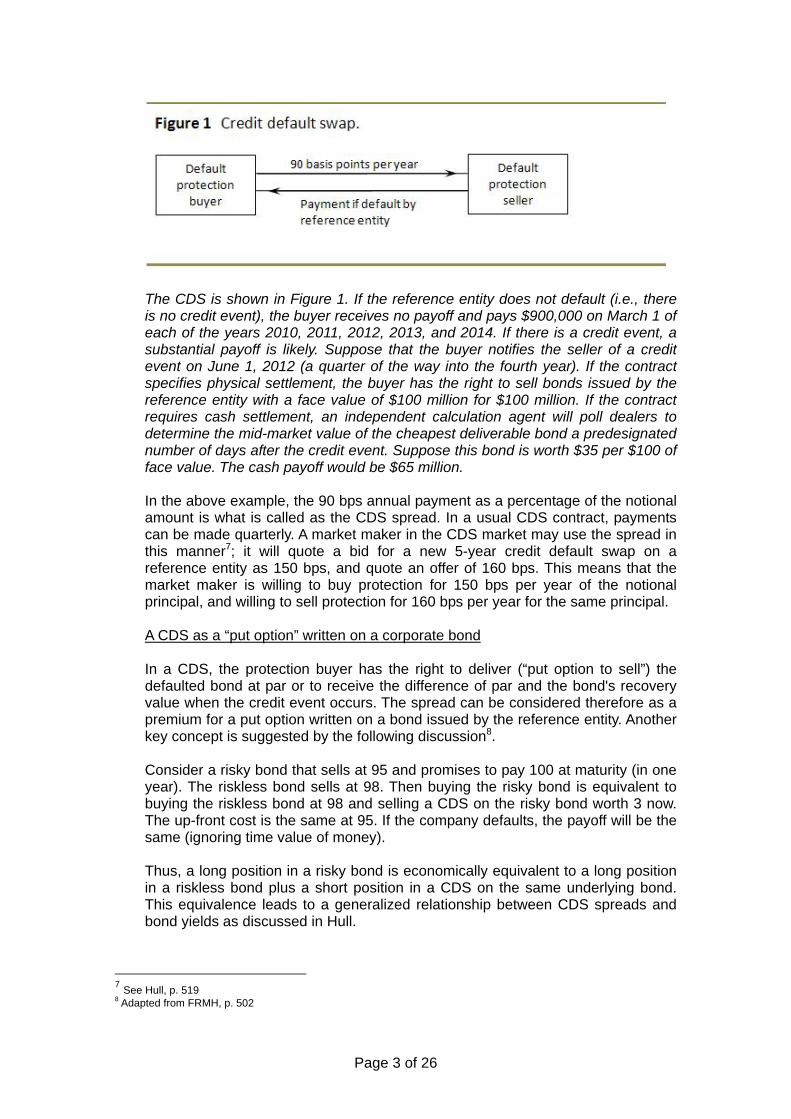
The CDS is shown in Figure 1. If the reference entity does not default (i.e., there is no credit event), the buyer receives no payoff and pays $900,000 on March 1 of each of the years 2010, 2011, 2012, 2013, and 2014. If there is a credit event, a substantial payoff is likely. Suppose that the buyer notifies the seller of a credit event on June 1, 2012 (a quarter of the way into the fourth year). If the contract specifies physical settlement, the buyer has the right to sell bonds issued by the reference entity with a face value of $100 million for $100 million. If the contract requires cash settlement, an independent calculation agent will poll dealers to determine the mid-market value of the cheapest deliverable bond a predesignated number of days after the credit event. Suppose this bond is worth $35 per $100 of face value. The cash payoff would be $65 million.
In the above example, the 90 bps annual payment as a percentage of the notional amount is what is called as the CDS spread. In a usual CDS contract, payments can be made quarterly. A market maker in the CDS market may use the spread in this manner7; it will quote a bid for a new 5-year credit default swap on a reference entity as 150 bps, and quote an offer of 160 bps. This means that the market maker is willing to buy protection for 150 bps per year of the notional principal, and willing to sell protection for 160 bps per year for the same principal.
A CDS as a “put option” written on a corporate bond
In a CDS, the protection buyer has the right to deliver (“put option to sell”) the defaulted bond at par or to receive the difference of par and the bond's recovery value when the credit event occurs. The spread can be considered therefore as a premium for a put option written on a bond issued by the reference entity. Another key concept is suggested by the following discussion8. Consider a risky bond that sells at 95 and promises to pay 100 at maturity (in one year). The riskless bond sells at 98. Then buying the risky bond is equivalent to buying the riskless bond at 98 and selling a CDS on the risky bond worth 3 now. The up-front cost is the same at 95. If the company defaults, the payoff will be the same (ignoring time value of money). Thus, a long position in a risky bond is economically equivalent to a long position in a riskless bond plus a short position in a CDS on the same underlying bond. This equivalence leads to a generalized relationship between CDS spreads and bond yields as discussed in Hull.
7 See Hull, p. 519 8 Adapted from FRMH, p. 502
Page 3 of 26

Credit Default Swaps and Bond Yields9. A CDS can be used to hedge a position in a corporate bond. Suppose that an investor buys a 5-year corporate bond yielding 7% per year for its face value and at the same time enters into a 5-year CDS to buy protection against the issuer of the bond defaulting. Suppose that the CDS spread is 200 basis points, or 2%, per annum. The effect of the CDS is to convert the corporate bond to a risk-free bond (at least approximately). If the bond issuer does not default the investor earns 5% per year when the CDS spread is netted against the corporate bond yield. If the bond does not default the investor earns 5% up to the time of the default. Under the terms of the CDS, the investor is then able to exchange the bond for its face value. This face value can be invested at the risk-free rate for the remainder of the 5 years.
The n-year CDS spread should be approximately equal to the excess of the par yield on an n-year corporate bond over the par yield on an n-year risk-free bond. If it is markedly less than this an investor can earn more than the risk-free rate by buying the corporate bond and buying protection. If it is markedly greater than this, an investor can borrow at less than the risk-free rate by shorting the corporate bond and selling CDS protection. These are not perfect arbitrages. But they are close to perfect and do give a good guide to the relationship between CDS spreads and bond yields. CDS spreads can be used to imply the risk-free rates used by market participants. The average implied risk-free rate appears to be approximately equal to the LIBOR/swap rate minus 10 basis points.10
The above discussion suggests that the CDS market may provide a better mechanism for assessing a company’s credit risk than the market for the company’s bonds. The spread for a CDS on a reference company actually reflects only the default risk associated with the company, unlike bond pricing which may be affected by factors like coupons, tenor, debt covenants, and so on. Moreover, studies show that the credit default swap market for corporate is often more liquid than the market for the corporate bonds. In a study by Coudert and Gex, they analized the links between credit default swaps and bonds and tried to determine which leads in the price discovery process. In the study, they compared CDS spread with spreads on a generic 5-year bond. Their results show that the CDS market has a lead over the bond market for corporates. The same conclusion holds for sovereigns, although not for low-yield reference sovereigns11.
Does a CDS completely eliminate credit risk? The question is does entering into a CDS completely eliminate credit risk? The answer is no; while the CDS protection buyer decreases exposure to credit risk of the reference entity, it is exposed to the credit risk of the protection seller, or what is called counterparty credit risk12. The European Central Bank released a study on CDS and counterparty credit risk in 200913. Other credit derivatives
9 Taken as is from Hull, Sec. 23.1 10 This formula is quoted by Hull as coming from the article “The Relationship between Credit Default Swap Spreads, Bond Yields, and Credit Rating Announcements,” J. Hull, M. Predescu, and A. White, Journal of Banking and Finance, 28 (November 2004); 2789-2811 11 Credit default swap and bond markets: which leads the other? , Virginie Coudert and Mathieu Gex, Banque de France, Financial Stability Review, No. 14, July 2010 12 Table 22.1, p. 503, FRMH, illustrates the effect of counterparty credit rating in pricing CDS 13 See Credit Default Swaps and Counterparty Risk, European Central Bank, August 2009
Page 4 of 26

We will now discuss briefly other common credit derivatives. Total return swaps A total return swap14 (TRS) is an agreement where one party, “total return payer” or “protection buyer”, agrees to make a series of payments linked to a reference asset (e.g. a bond), and another party, “total return receiver” or “protection seller”, makes a series of payments tied to a reference rate, usually LIBOR plus a spread. The TRS is an agreement therefore to exchange returns on a reference asset and a reference rate. It is a way to protect against credit risk when valuation of the underlying reference asset is marked-to-market; that is, the TRS is tied up to changes in the market value of the reference asset; the protection buyer is able to remove market risk without disposing the reference asset. A TRS, unlike a CDS, is affected by both credit risk and market risk. This example from Hull describes clearly the structure and mechanics of a TRS15.
An example of a total return swap is a 5-year agreement with a notional principal of $100 million to exchange the total return on a corporate bond for LIBOR plus 25 basis points. This is illustrated in Figure 2. On a coupon payment dates the payer pays the coupons earned on an investment of $100 million in the bond. The receiver pays interest at a rate of LIBOR plus 25 basis points on a principal of $100 million. (LIBOR is set on one coupon date and paid on the next as in a plain vanilla interest rate swap.) At the end of the life of the swap there is a payment reflecting the change in value of the bond. For example, if the bond increases in value by 10% over the life of the swap, the payer is required to pay $10 million (=10% of $100 million) at the end of the 5 years. Similarly, if the bond decreases in value by 15%, the receiver is required to pay $15 million at the end of the 5 years. If there is a default on the bond, the swap is usually terminated and the receiver makes a final payment equal to the excess of $100 million over the market value of the bond.
Collateralized debt obligations Personal home mortgages can be converted to Mortgage-Backed Securities (MBS). MBS are backed by loan payments; as the loans paid off, the mortgage payments are passed on to the MBS holders. Lenders can pool the mortgages into groups with similar characteristics and sell them; or lenders can sell the loan
14 Taken from FRMH, Se. 22.2.2, p. 506 15 Hull, Sec. 23.6
Page 5 of 26

individually to be pooled by the purchasers. MBS issuance began in 1970. These are theoretically higher yield investments than other types of high-quality fixed income securities and are often given high credit ratings by credit rating agencies. Subsequently, collateralized mortgage obligations (CMOs) brought MBS to general investors by repackaging their cash flows into tranches with different characteristics16. This repackaging mechanism can be applied to create collateralized debt obligations (CDOs), which are securities backed by a pool of debt. Similarly, collateralized loan obligations (CLOs) are backed by bonds and loans, respectively. Figure 3 illustrates a typical CDO structure17.
The first step is to place a package of corporate bonds in a special-purpose vehicle (SPV). Assume that we have a total of $1,000 million, representing exposures of $10 million to 100 entities, or “names.” Multiple tranches are then issued by the SPV, with a specified waterfall structure, or priority of payments to the various tranches. Tranches are categorized by senior, mezzanine, and subordinated or equity. In the simplest structure, the SPV is ideally a passive entity. It redistributes cash flows according to well-defined rules. There is no need for other management action.
In this example, 80% of the capital structure is apportioned to tranche A, which has the highest credit rating of Aaa, using Moody’s rating, or AAA. Other tranches have lower priority and rating. These intermediate, mezzanine, tranches are typically rated A, Baa, Ba, or B (A, BBB, BB, B, using S&P’s ratings). Due to leverage, the return can be very high if there is no default. In exchange, the equity is exposed to the first dollar loss in the portfolio.
16 Taken from FRMH, Sec. 22.4.3, p. 515 17 FRMH, Sec. 22.4.3
Page 6 of 26

Like CMOs, CDOs are structured so that most of the tranches have less risk than the collateral. Inevitably, the remaining residual tranche is more risky. This is sometimes called “toxic waste.” If this residual is cheap enough, however, some investors should be willing to buy it. Oftentimes, the institution sponsoring the CDO will retain the most subordinate equity tranche, to convince investors of the quality of the pool. Credit investors have developed sophisticated trading strategies that involved going long and short different tranches of the capital structure.
CDS variants and CDS indices
CDS have several variants18. In a first-of-basket-to-default swap, the protection buyer has the right to sell one and only one reference asset out of a basket of selected reference assets. In general, this swap is more expensive than the regular CDS. In an Nth-to-default swap, payment is triggered only after N defaults in the underlying basket of reference assets. There are indices on CDS markets that track the performance of these markets and are also traded. There are indices that track CDS for corporate in Europe, (iTraxx Europe), the United States (CDX North America), as well as other regions. For example, the iTraxx Europe index represents a basket of 125 CDS. The CDX.NA.IG index is composed of 125 investment-grade reference entities in North America. The CDX.NA.HY index covers 100 non-investment-grade (high yield) borrowers, while borrowers from emerging markets are covered by CDX.EM.
What triggers payment in a CDS? For CDS contracts with European countries as reference entities restructuring is typically considered a credit event; the same cannot be said necessarily for CDS on North American reference entities. When is a credit event said to have actually occurred and therefore trigger pay off? A credit event is a discrete state; either it occurs or not. There should be no ambiguity as to when a credit event has occurred. Otherwise, there is legal risk involved. In the case of bonds, the state of default is defined by credit rating agencies, say Standard and Poor’s. For CDS, the occurrence of a credit event is decided by a Determination Committee (DC) of the ISDA. The ISDA has defined what constitutes a credit event; the list is summarized below19:
• Bankruptcy is a situation involving either of
o The dissolution of the obligor (other than merger) o The insolvency, or inability to pay its debt o The assignment of claims o The institution of bankruptcy proceeding o The appointment of receivership o The attachment of substantially all assets by a third party
• Failure to pay is a failure of the creditor to make due payment. This is
usually triggered after an agreed-upon grace period and when the payment due is above a certain amount.
18 Taken from a discussion in FRMH, p. 504 19 Taken from a discussion in FRMH, Sec. 19.1
Page 7 of 26

• Obligation/cross default is the occurrence of a default (other than failure to make a payment) on any other similar obligation.
• Obligation/cross acceleration is the occurrence of a default (other than
failure to make a payment) on any other similar obligation, resulting in that obligation becoming due immediately.
• Repudiation/moratorium means that the counterparty is rejecting, or
challenging, the validity of the obligation.
• Restructuring is a waiver, deferral, or rescheduling of the obligation with the effect that the terms are less favorable than before.
In addition, other events sometimes included are
• Downgrading means the credit rating is lower than previously, or is
withdrawn.
• Currency inconvertibility means the imposition of exchange controls or other currency restrictions by a governmental or associated authority.
• Governmental actions is either (1) declarations or actions by a
government or regulatory authority that impair the validity of the obligation, or (2) the occurrence of war or other armed conflict that impairs the functioning of the government or banking activities.
The ISDA definitions were meant to minimize legal risk by giving common definitions of when a credit event occurs. In this connection, two cases are worth mentioning here. In the case of Argentina20, its default was the largest sovereign default recorded in terms of external debt. In November of 2001, Argentina announced a restructuring of its local debt that was less favorable to holders of credit. Holders of sovereign CDS with Argentina as reference entity argued that this was a “credit event” and therefore called on the swap sellers for payments. The swap sellers, on the other hand, did not agree that the restructuring constituted default. Of course, Argentina actually announced the following December that it would default on its interest payments on its $135 billion foreign debt leaving no more doubt as to the occurrence of a credit event that should trigger payment. When Offsetting pairs of CDS do not offset21
The second case illustrates when an offsetting pair of CDS does not offset. Bear Stearns loaned $10 million to a development in the Philippines which was backed by a Philippines government agency (GSIS). Bear Stearns bought protection, call it CDS1, from AON for $425,000. AON was then short exposure to the GSIS, and so then bought protection (call it CDS2) from Societe Generale for $328,000. (These offsetting CDS transactions apparently gave AON an easy $97,000 as ‘spread.’)
20 Taken from FRMH, Sec. 19.1, p. 429 21 Taken from the details of the case; see Sutherland Legal Alert, February 27, 2007
Page 8 of 26
The project did not push though and the developer did not pay the loan. GSIS also withdrew its guarantee on the loan. Bear Stearns called the CDS1 it bought from AON and was paid $10 million. AON then called on the CDS2 it bought from SocGen, arguing that since the CDS1 had been resolved it should automatically lead to a resolution of CDS2. SocGen did not want to pay and AON sued. After different levels of the court system ruled on the case, AON lost their case, and lost $10 million. This is a good example of when CDS, meant to be offsetting CDS, turn out to be non-offsetting. The final court ruling was that the language in CDS1 and CDS2 were not identical and that the risk was not purely offset. The conclusion of the Court in the case is worth repeating here:
The Court of Appeals concluded that SocGen was not liable under the CDS as there had been no Credit Event with reference to the Republic of Philippines. The court declined to look outside the “four corners” of the AON/SocGen CDS, a contract whose terms the court unanimously found to be unambiguous. Where contractual terms are clear, there is no reason why they should not be strictly construed and applied. If the unambiguous provisions of credit default swaps are not honored, it would be difficult, if not impossible, to fairly price such agreements. The court obviously agreed with the amicus position of ISDA that such uncertainty would undermine the growing credit derivatives market.
For participants in the credit derivatives markets, the Second Circuit
decision is a strong reminder of the importance of both legal documentation and operational issues. Parties to CDS and other credit derivative contracts must pay careful attention to the terms contained “within the four corners” of the contract and should not rely simply on a general description of the trade or market practice. “Documentation risk,” the risk that market, credit and legal risk will be exacerbated by deficiencies in documentation, can only be avoided by careful drafting and paying attention to the intent of the parties. Similarly, “operational risk” issues, including specifically those associated with providing proper and timely Credit Event Notices and settling CDS contracts following the occurrence of a Credit Event, must be carefully addressed by market participants.
Who “invented” credit default swaps? CDs are generally considered to have been invented by J.P. Morgan in 1994. The company had billions of dollars exposure to corporations and foreign governments and had to keep large capital reserves at the same time. J.P. Morgan designed an instrument where in exchange for regular premium payments a third party assumes the risk of a loan going bad. Thus, J.P. Morgan was able to transfer the risks without transferring the loans. One of the first CDS was when J.P. Morgan bought protection from the European Bank for Reconstruction and Development for its exposure to Exxon. J. P. Morgan built up a "swaps" desk in the mid 1990's. The market doubled in size every year after that and covered all grades of corporate and emerging market debt.
How big is the CDS market? There are varying reports about the size of the global CDS market. What the
varying figures suggest is that nobody really knows how big the CDS market is.
Page 9 of 26
Since CDS are privately negotiated contracts between two counterparties, they are difficult to regulate. The large CDS market has been for the most part unregulated.
According to ISDA, the notional value of CDS outstanding in June 2008 was $54.62 trillion, up to more than 58% from the notional amount of $34.5 trillion by end of 2006. The increase is driven largely by speculation in the market. The more recent results of the ISDA 2010 mid-year market survey show that the notional amount outstanding of credit default swaps (CDS) was $26.3 trillion at mid-year 2010, a decrease of 13.7 percent from $30.4 trillion at year-end 2009. (The $26.3 trillion notional amount was approximately evenly divided between bought and sold protection: bought protection notional amount was approximately $13.3 trillion and sold protection was about $13.0 trillion, with a net bought notional amount of $359.0 billion.) CDS notional outstanding for the past twelve months was down 15.9 percent from $38.6 trillion at mid-year 2009. Credit default swaps are 5.6 percent of the total of all derivatives reported to the ISDA Market Survey22.
Data from the Depository Trust & Clearing Corporation23 (DTCC) that keeps a record of outstanding CDS involving major dealers as counterparties show that the size of the CDS market was $29 trillion by mid 2009. Data from the Bank for International Settlements (BIS) show that the total notional amount of CDS was $6 trillion in 2004, $28 trillion in 2006, $57 trillion in 2008. In 2009, total notional amount was $32 trillion and $28 trillion by end of 201124.
Sovereign CDS
The paper by Packer and Suthiphongchai25 on sovereign CDS is worth mentioning here, mainly to reflect the growth and development of the CDS market.
The paper reports the results of the 2002 Credit Derivatives Report of the British Bankers Association that show the growth and development of the CDS market since they were introduced in late 1990s. The report said that the market grew from $40 billion outstanding notional value in 1996 to $1.2 trillion at the end of 2001, and expected to reach $4.8 trillion by the end of 2004. The same report indicates that single name CDS accounted for 45% of the overall credit derivatives market. Sovereign CDSs, i.e., CDS where the reference entity is a bond issued by a sovereign, are considered the most liquid credit derivative instruments in emerging markets.
22 ISDA Market Survey, www.isda.org 23 DTCC, through its subsidiaries, provides clearing, settlement and information services for equities, corporate and municipal bonds, government and mortgage-backed securities, money market instruments and over-the-counter derivatives. In addition, DTCC is a leading processor of mutual funds and insurance transactions, linking funds and carriers with their distribution networks. See www.dtcc.com 24 As reported in Credit Default Swaps and the Credit Crisis, Journal of Economic Perspectives, Vol. 24, Number 1, Winter 2010, pp. 73-92 25 Sovereign credit default swaps by Frank Packer & Chamaree Suthiphongchai, BIS Quarterly Review, December 2003, pp. 79-88
Page 10 of 26
Page 11 of 26
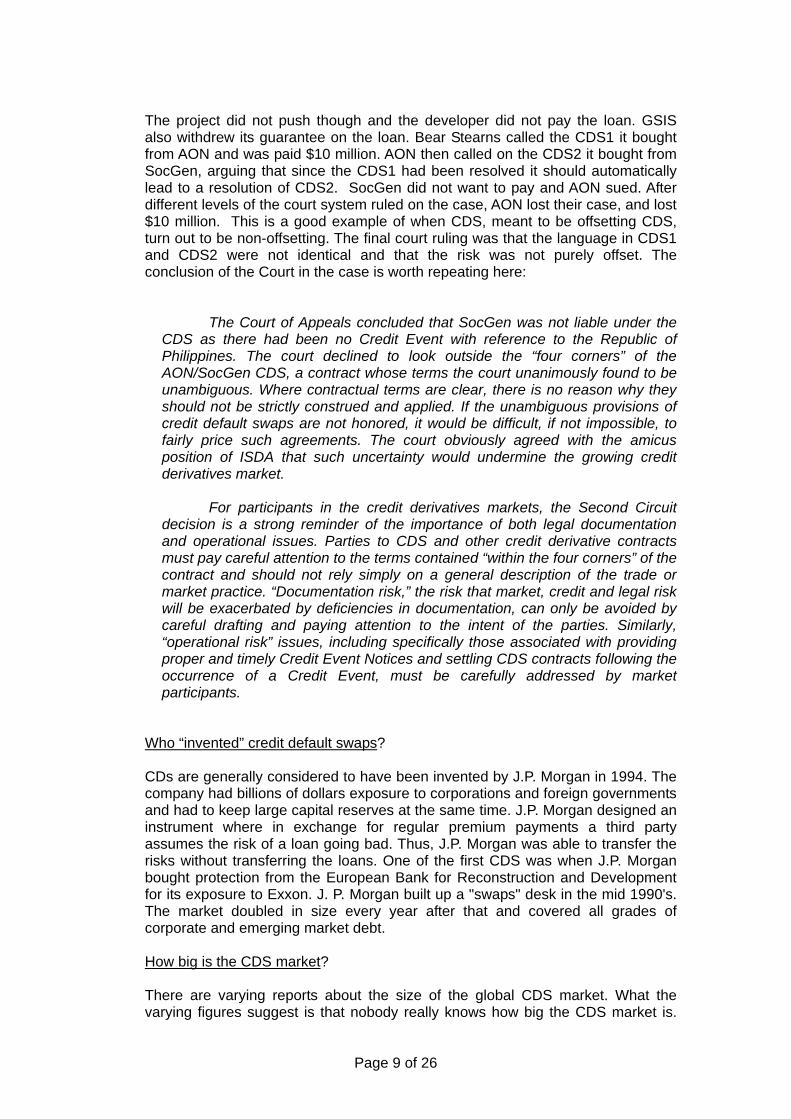
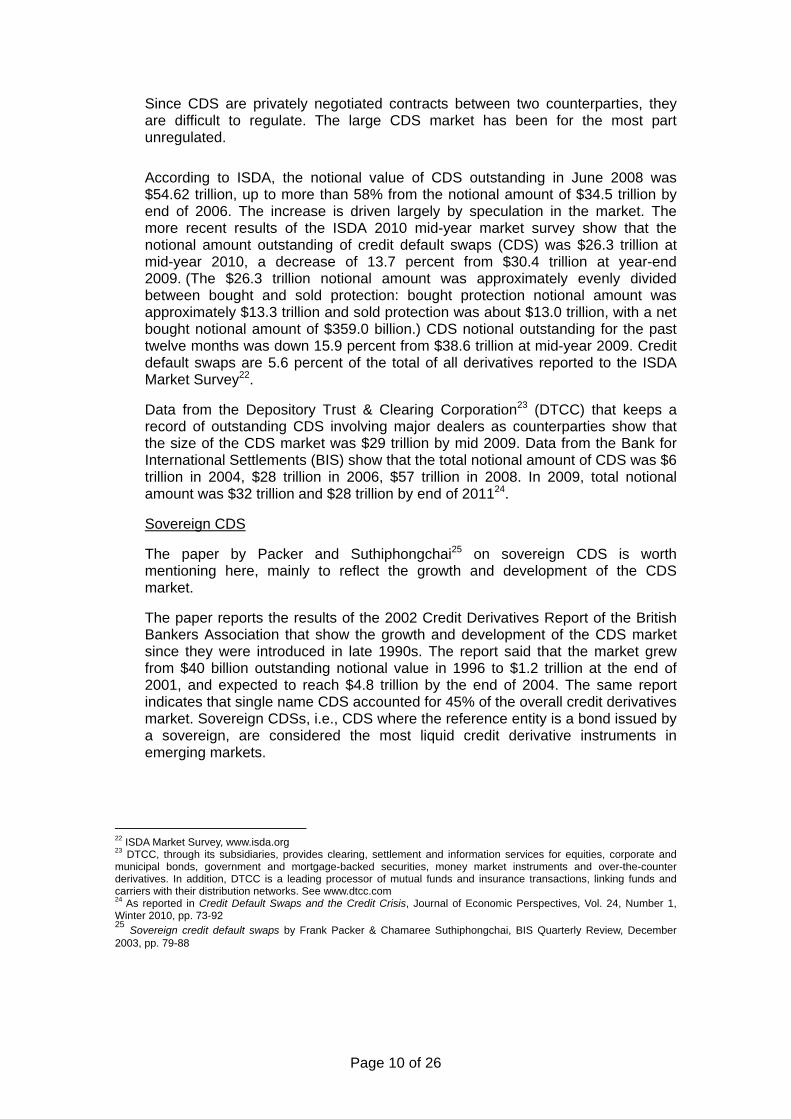
Table 1 above provides some information on CDS from January 1997 to June 2003 with 400,000 quotes on 1,662 different entities with 1,292 corporate names, 293 are banks and 77 are sovereign. The table lists the overall number of quotes on CDSs classified by category of the reference asset, i.e. corporate, bank or sovereign. Sovereign CDSs accounted for around 7.4% of all quotes in 2002 and 2003. It should be noted that the share of sovereign as reference entities declined from over 50% in 1997 to less than 10% in 2003; on the other hand, corporate reference entities have accounted for over 70% of all reference entities in 2003, reflecting the rapid growth of the corporate bond market after the mid-1990s. Table 2 lists the concentration of quotes on Sovereign CDSs. The table shows that the five leading names are Brazil, Mexico, Japan, the Philippines and South Africa, which together account for more than 40% of listed quotes on sovereign names. It should be noted that there were no more quotes with Argentina as reference entity in 2002, understandably so following Argentina’s default in 2001. OTC Credit Default Swaps Data From DTCC’s Trade Information Warehouse
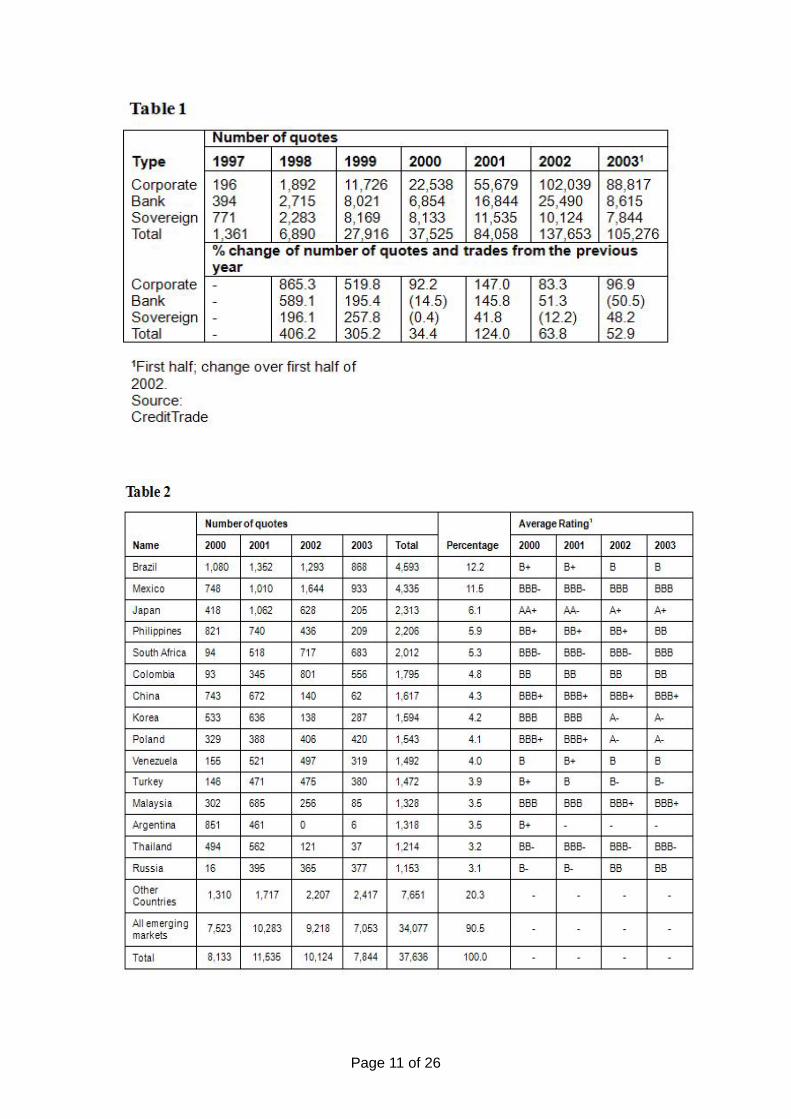
The following chart from more recent data from DTCC shows the top ten single-name reference entities26. Note that of the ten, only one is not a sovereign. It should also be noted that of the top ten sovereign references in Table 2 above, only Brazil, Mexico, Japan, and China, remain in the top ten as reflected in the DTCC data. The European countries France, Italy, Germany, Spain, and the United Kingdom, have entered the top single-name reference entities for CDS. Note that Greece is not in the top ten list.
26 http://www.dtcc.com/news/newsletters/dtcc/2012/feb/otc-credit-default-swaps-data.php
Page 12 of 26
Net Positions of Major Players in CDS Market. As earlier mentioned ISDA reports that the notional amount outstanding of credit
default swaps (CDS) was $26.3 trillion at mid-year 2010. This was approximately evenly divided between bought and sold protection: bought protection notional amount was approximately $13.3 trillion and sold protection was about $13.0 trillion, with a net bought notional amount of $359.0 billion.
This information leads to the question of who bears the credit risks. Looking at the
“net bought positions” and the “net sold positions”, who have been net buyers and net sellers of protection in the CDS market?
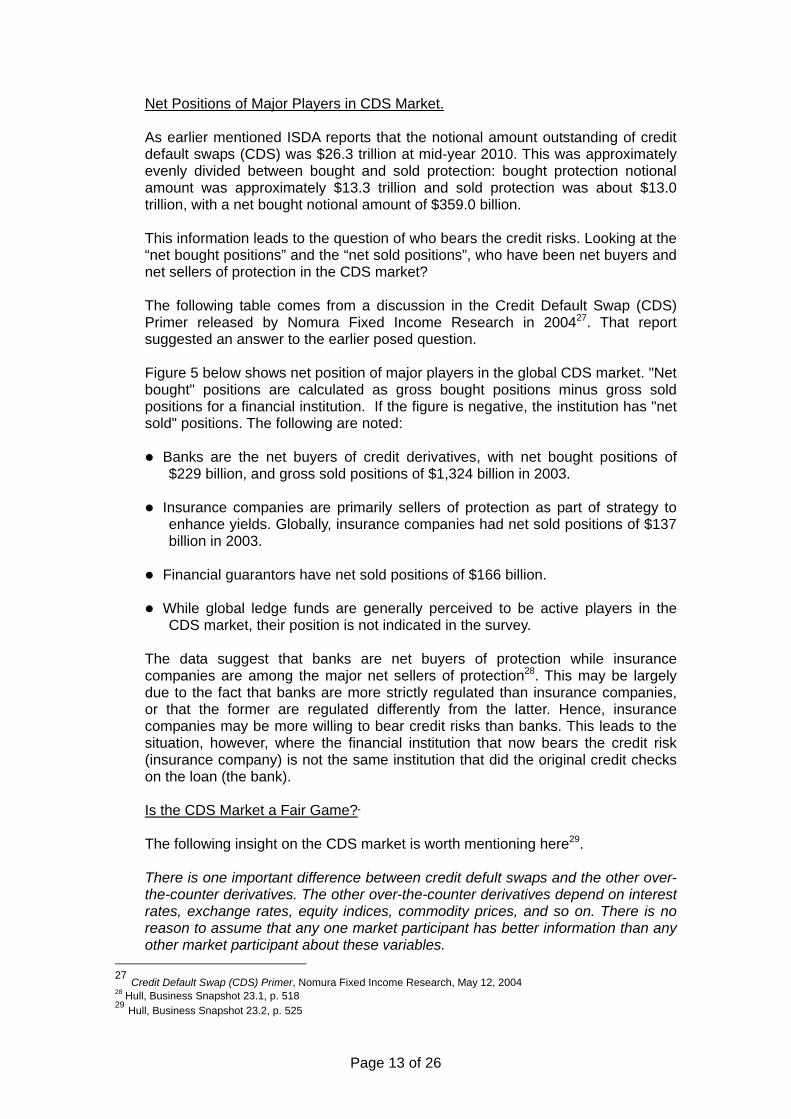
The following table comes from a discussion in the Credit Default Swap (CDS) Primer released by Nomura Fixed Income Research in 200427. That report suggested an answer to the earlier posed question. Figure 5 below shows net position of major players in the global CDS market. "Net bought" positions are calculated as gross bought positions minus gross sold positions for a financial institution. If the figure is negative, the institution has "net sold" positions. The following are noted:
Banks are the net buyers of credit derivatives, with net bought positions of $229 billion, and gross sold positions of $1,324 billion in 2003.
Insurance companies are primarily sellers of protection as part of strategy to enhance yields. Globally, insurance companies had net sold positions of $137 billion in 2003.
Financial guarantors have net sold positions of $166 billion.
While global ledge funds are generally perceived to be active players in the
CDS market, their position is not indicated in the survey. The data suggest that banks are net buyers of protection while insurance
companies are among the major net sellers of protection28. This may be largely due to the fact that banks are more strictly regulated than insurance companies, or that the former are regulated differently from the latter. Hence, insurance companies may be more willing to bear credit risks than banks. This leads to the situation, however, where the financial institution that now bears the credit risk (insurance company) is not the same institution that did the original credit checks on the loan (the bank).
Is the CDS Market a Fair Game?
The following insight on the CDS market is worth mentioning here29. There is one important difference between credit defult swaps and the other over-
the-counter derivatives. The other over-the-counter derivatives depend on interest rates, exchange rates, equity indices, commodity prices, and so on. There is no reason to assume that any one market participant has better information than any other market participant about these variables.
27 Credit Default Swap (CDS) Primer, Nomura Fixed Income Research, May 12, 2004 28 Hull, Business Snapshot 23.1, p. 518 29 Hull, Business Snapshot 23.2, p. 525
Page 13 of 26
Credit default swaps spreads depend on the probability that a particular company will default during a particular period of time. Arguably some market participants have more information to estimate this probability than others. A financial institution that works closely with a particular company by providing advice, making loans, and handling new issues of securities is likely to have more information about the creditworthiness of the company than another financial institution that has no dealings with the company. Economists refer to this as an asymmetric information problem.
Whether asymmetric information will curtail the expansion of the credit default swap market remains to be seen. Financial institutions emphasize that the decision to buy protection from risk of default by a company is normally made by a risk manager and is not based on any special information that may exist elsewhere in the financial institution about the company.
Before we proceed with the discussion of CDS and the financial crisis brought about by the subprime crisis, let us discuss briefly some valuation or pricing examples for CDS.
Page 14 of 26
Valuation of CDS This part is taken from Nomura30. It illustrates an approach to valuation of a CDS. At the time it is negotiated, a CDS, like most other swaps, is worth close to zero. Later it may have positive or negative value, as illustrated in the example. A typical CDS contract usually specifies two potential cash flow streams – a fixed leg and a contingent leg. On the fixed leg side, the buyer of protection makes a series of fixed, periodic payments of CDS premium until maturity, or until the reference credit defaults. On the contingent leg side, the protection seller makes one payment only if the reference credit defaults. The amount of a contingent payment is usually the notional amount multiplied by (1 – R), where R is the recovery rate, as a percentage of the notional. Hence, the value of the CDS contract to the protection buyer at any given point of time is the difference between the present value of the contingent leg, which the protection buyer expects to receive, and that of the fixed leg, which the protection buyer expects to pay, or,
Value of CDS (to the protection buyer)=
PV [contingent leg] – PV [fixed (premium) leg]
In order to calculate these values, one needs information about the default probability (i.e. credit curve) of the reference credit, the recovery rate in a case of default, and risk-free discount factors (i.e. yield curve). A less obvious contributing factor is the counterparty risk. For simplicity, we assume that there is no counterparty risk and the notional value of the swap is $1 million.
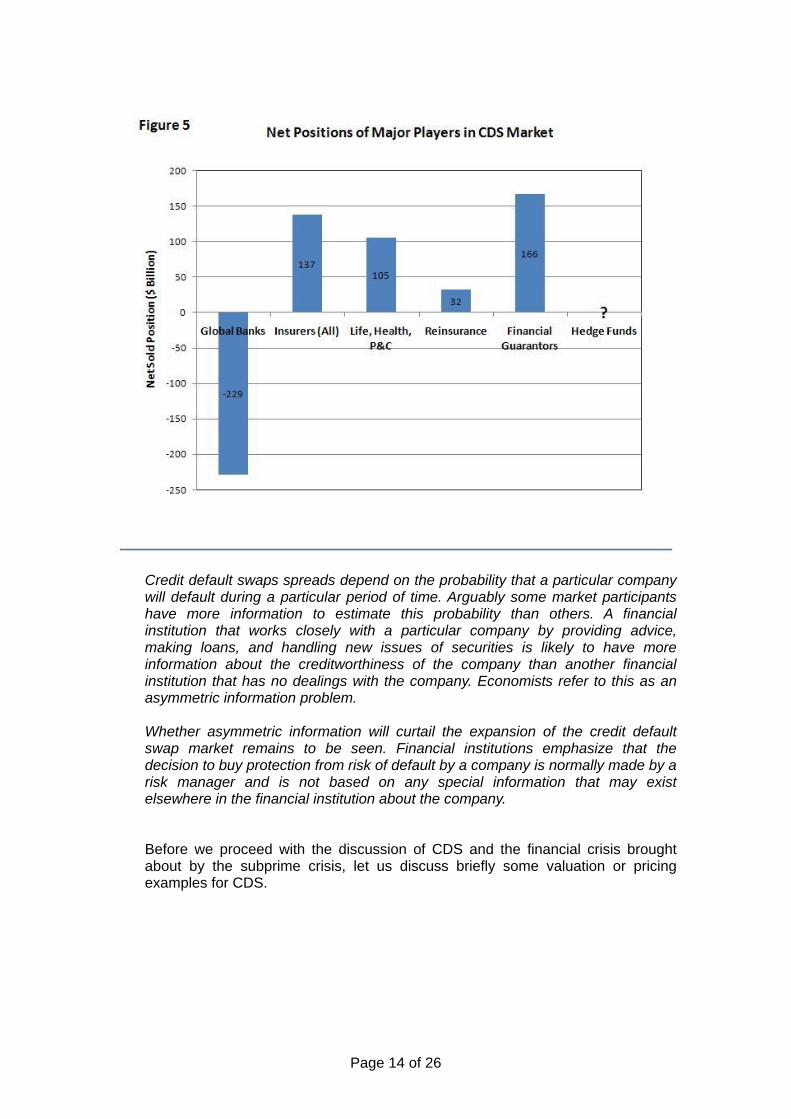
First, let’s look at the fixed leg. On each payment date, the periodic payment is calculated as the annual CDS premium, S, multiplied by di, the accrual days (expressed in a fraction of one year) between payment dates. For example, if the CDS premium is 160 bps per annum and payments are made quarterly, the periodic payment will be:
di S= 0.25 (160)=40bps
However, this payment is only going to be made when the reference credit has NOT defaulted by the payment date. So, we have to take into account the survival probability, or the probability that the reference credit has not defaulted on the payment date. For instance, if the survival probability of the reference credit in the first three months is 90%, the expected payment at t1, or 3 months later, is:
q(ti) diS = 0.9 (.25)(160) =36bps
where q(t) is the survival probability at time t. Then, using the discount factor for the particular payment date, D(ti), the present value for this payment is D(t )q(t )Sdi. Summing up PVs for all these payments, we get i i
--(1)
30 Taken from Credit Default Swap (CDS) Primer, Nomura Fixed Income Research, May 12, 2004
Page 15 of 26
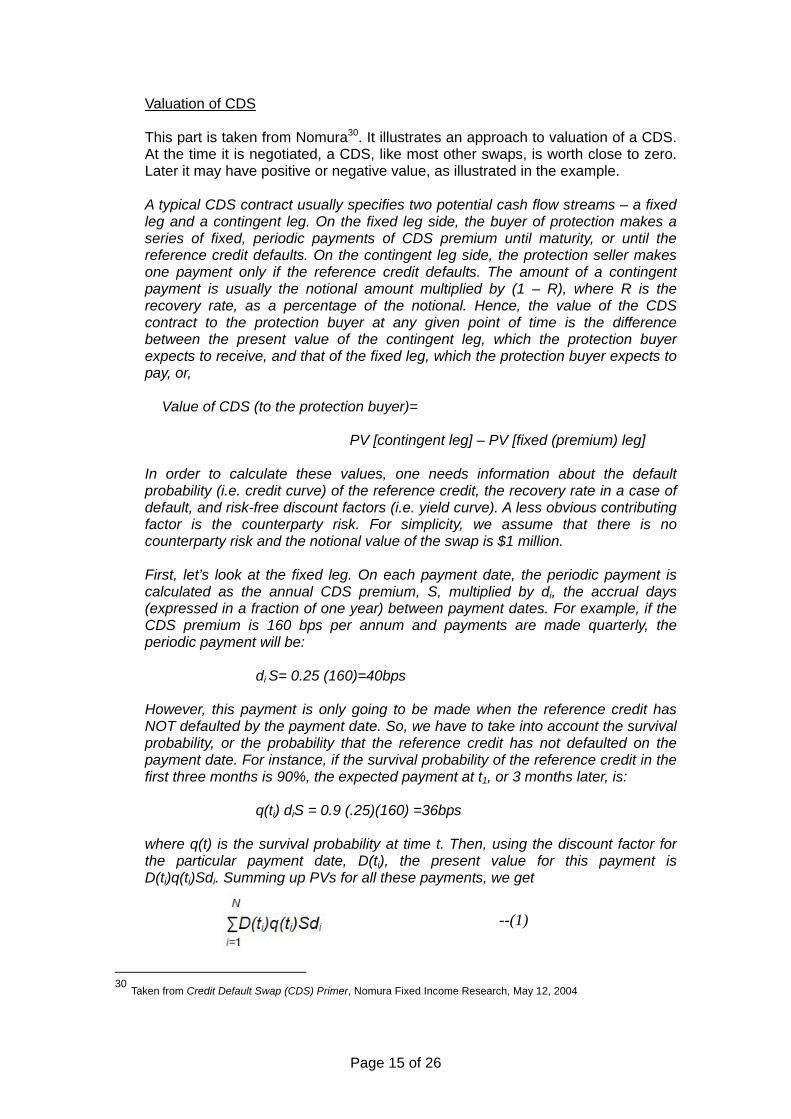
However, there is another piece in the fixed leg – the accrued premium paid up to the date of default when default happens between the periodic payment dates. The accrued payment can be approximated by assuming that default, if it occurs, occurs at the middle of the interval between consecutive payment dates. Then, when the reference entity defaults between payment date t(i-1) and payment date ti, the accrued payment amount is S.di/2. This accrued payment has to be adjusted by the probability that the default actually occurs in this time interval. In other words, the reference credit survived through payment date t(i-1) but NOT to next payment date, ti. This probability is given by
{q(ti -1)-q(ti)}
Accordingly, for a particular interval, the expected accrued premium payment is
{q(ti-1)-q(ti)}Sdi /2
Therefore, present value of all expected accrued payments is given by
--(2)
Now we have both components of the fixed leg. Adding (1) and (2), we get the present value of the fixed leg:
--(3)
Next, we compute the present value of the contingent leg. Assume the reference entity defaults between payment date t(i-1) and payment date ti. The protection buyer will receive the contingent payment of (1-R), where R is the recovery rate. This payment is made only if the reference credit defaults, and, therefore, it has to be adjusted by {q(ti -1)-q(ti)}, the probability that the default actually occurs in this time period. Discounting each expected payment and summing up over the term of a contract, we get
--(4)
Plugging equation (3) and (4) into the equation in the beginning, we arrive at a formula for calculating value of a CDS transaction.
When the two parties enter a CDS trade, the CDS spread is set so that the value of the swap transaction is zero (i.e. the value of the fixed leg equals that of the contingent leg). Hence, the following equality holds:
Page 16 of 26
Given all the parameters, S, the annual premium payment is set as:
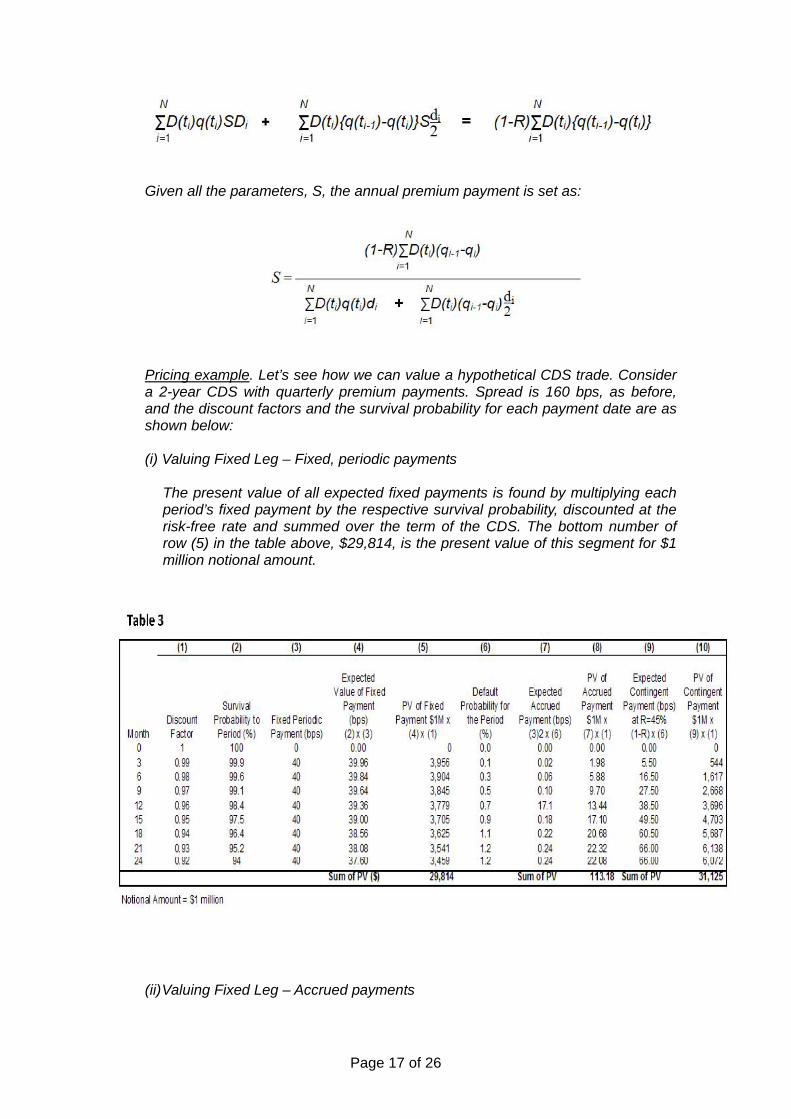
Pricing example. Let’s see how we can value a hypothetical CDS trade. Consider
a 2-year CDS with quarterly premium payments. Spread is 160 bps, as before, and the discount factors and the survival probability for each payment date are as shown below:
(i) Valuing Fixed Leg – Fixed, periodic payments
The present value of all expected fixed payments is found by multiplying each period’s fixed payment by the respective survival probability, discounted at the risk-free rate and summed over the term of the CDS. The bottom number of row (5) in the table above, $29,814, is the present value of this segment for $1 million notional amount.
(ii) Valuing Fixed Leg – Accrued payments
Page 17 of 26
Assuming that default occurs, if any, at the middle of time interval between two payment dates, the value of the accrued premium payment if a default occurs is a half of 40 bps, or 20 bps. Then, the expected value of the accrued payment for each period is 20 bps multiplied by the probability of default for that period, as in column (7) in the table above. Discount these values for all periods and summing them up over the term of the CDS, we get a value of $113.18 (see the bottom of column (8)), which is the present value of expected accrued fixed payments. Apparently, this is a very small number, but this is as expected because these are products of the default probability for each period and the accrued payment if a default occurs is 20 bps, which are both small numbers. From above, we can see that the present value of the fixed leg, or the present value of the expected payments by the protection buyer over the 2-year term, is (29,814 + 113.18) = $29,927.18 for the notional value of $1 million.
(iii) The Contingent Leg Finally, we can calculate the value of the contingent leg. The expected value of the contingent payment if a default occurs during each period is (1-R) multiplied by the probability of default for that period (column (9) in the table). Assuming a recovery rate of 45%, the expected contingent payment is 0.55 multiplied by the each period’s default probability. Discount this for each period and summing over the whole term of the CDS, we get a value of $31,125, as in column (10), which is the present value of expected contingent payments. Hence, we can find the value of this CDS to the protection buyer (or the fixed payer) when the spread is 160 bps per annum as: Value of CDS = PV[expected contingent payment] – PV[fixed leg] = $31,125 - $29,927 = $1,198 For the notional value of $1 million.
To see this result intuitively, the average default probability over the term of the CDS is 3% per year (because the survival rate after 2 years is 94%), and with recovery rate of 45%, the average expected loss per year is: (1-0.45) x 3% = 1.65%. The CDS spread is 160 bps per year, which means that in this example the protection buyer gets protection buyer gets protection for credit risk with the expected loss of 165 bps for a premium of only 160 bps! Not at all surprisingly, this is a valuable transaction for the CDS buyer, with a positive CDS value to the protection buyer, calculated above to be $1,198, or 11.98 bps, for $1 million notional.
Estimating Default Probabilities The difficulty in the valuation or pricing approach illustrated above is in the
estimates of survival probabilities and probabilities of default31. In options pricing, probabilities used are risk neutral probabilities. The default probabilities used to value a CDS should also be risk-neutral default probabilities. Risk-neutral default probabilities can be estimated from bond prices or asset swaps32. An alternative is
31 See for example FRMH, Chapter 19, Measuring Actuarial Default Risk 32 See Hull, Chapter 22
Page 18 of 26
to imply them from CDS quotes similar to the practice of using prices of actively traded options to compute implied volatilities.
How did CDS figure in the 2008 financial crisis?
There was earlier reference to mortgage backed securities or MBS. What if borrowers default on their payments? Is there some form of insurance to protect buyers of MBS in case of default on mortgage payments?
By the end of May 2007, 16.3 percent of all subprime borrowers in the US were more than 60 days past due, up from just 7.3 percent a decade before. Moreover, by the end of June 2007, the past due rate had further risen to over 17 percent.33 As of November 2007, credit rating agencies had downgraded over $50 billion in highly-rated collateralized debt obligations, while Standard & Poor's Corp., Moody's Investors Service Inc. and Fitch Ratings have come under fire for being slow to lower their ratings on securities backed by US subprime borrowers.34
Since most CDS were sold as protection to cover exotic financial instruments that
created and spread the subprime housing crisis, massive defaults on mortgage payments rendered those mortgage-backed-securities or MBS virtually worthless; banks and other institutions selling CDS had to pay out. By their nature, many institutions are closely linked by CDS. The default of one counterparty starts a chain reaction that raises the risk of others losing money. This "counter party risk" is what has triggered investors to sell off assets and a credit crunch among lenders.
The case of Lehman Brothers should be highlighted here. Lehman sold more than $700 billion worth of CDS. Investors who bought CDS from Lehman were left without protection and had to buy new CDS from other institutions at a higher price. This highlights the fact that a default may cause losses much more than simply the amount of debt and equity issued by a company.
What went wrong with AIG? As an earlier example showed, some institutions would buy CDS on the one land
and sell CDS to another institution at the same time. When there is a default on the (same) reference bond, the institution may have to pay an amount but will also be getting an amount from the CDS it bought. It is now quite apparent that AIG was selling CDS protection but not necessarily buying offsetting CDS for protection.
While AIG’s big exposure to CDS did play a big part in AIG’s failure, the fall of AIG is said to be the result of the following sequence of events35:
• In the wake of the decline in real estate prices, the market value of MBS 33 As reported in Subprime and Securitization, Professorial Chair Paper, Prof. Roy Ybanez, 2007 34 As reported in “The Subprime Lending Crisis: Causes and Effects of the Mortgage Meltdown”, CCH, 2008 35 Taken from “CDS, the Collapse of AIG and Addressing the Crisis of Confidence” by David Paul, The Huffington Post, November 24, 2008
Page 19 of 26
declined. • Under accounting rules that were established after the downfall of Enron –
implemented to require rapid disclosure of investment losses – AIG marked down the value of its MBS portfolio.
• These investment losses resulted in a reduction of AIG’s capital reserves – the
core measure of its financial strength.
• As a result of the decline in AIG’s capital reserves, Standard & Poor’s and Moody’s Investors Service downgraded AIG from triple-A to single-A level.
• These rating downgrades to the single-A level triggered collateralization
requirements under AIG’s CDS contracts.
• The amount of the collateral that AIG had to produce under its estimated $450 billion of CDS contracts approximated $100 billion.
And AIG did not have $100 billion in available funds. This collateral call was the main reason for the downfall of AIG.
Credit linked notes We now proceed with a discussion of credit linked structures. What are CLNs and
other credit linked structures? CLNs are structured to combine a credit derivative with a regular bond36. In a
CLN, the buyer of protection transfers credit risk to an investor through an intermediary which can be the buyer itself or a special purpose vehicle, SPV. An example of the first case is a bank with an exposure to say ROP. The bank issues a note with an embedded CDS on ROP. The note pays a high yield but will lose some (or all) of its principal if ROP defaults on its debt.
An example of a SPV structure is shown using Figure 637. In the example, the
investor’s initial funds are placed in a top-rated investment that pays LIBOR plus a spread of Y bps. The SPV takes a short position in a CDS, for an additional annual receipt of X bps. The investor then gets an annual payment of (LIBOR + Y bps + X bps). In return for this higher yield, the investor must be willing to lose some (or all) of its principal should a credit event occur.
36 Taken from FRMH, Sec. 22.4.2, p. 514 37 FRMH, Sec. 22.4.2, Figure 22.4, p. 514
Page 20 of 26
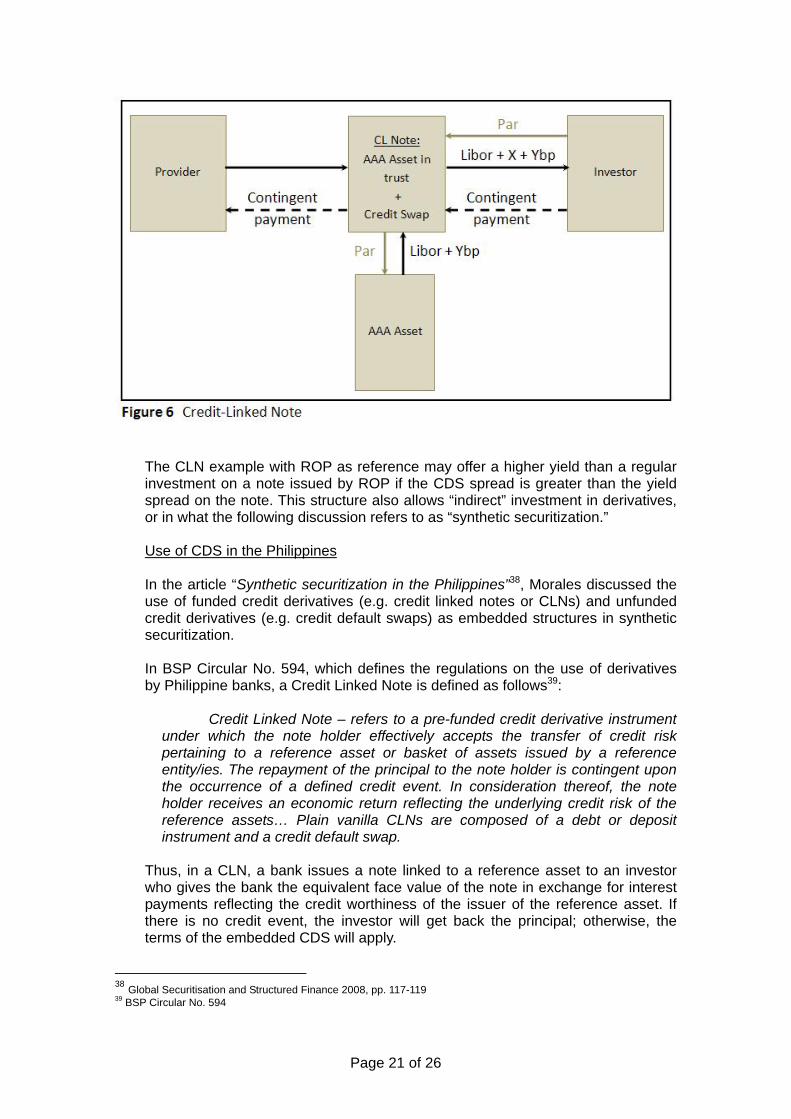
The CLN example with ROP as reference may offer a higher yield than a regular
investment on a note issued by ROP if the CDS spread is greater than the yield spread on the note. This structure also allows “indirect” investment in derivatives, or in what the following discussion refers to as “synthetic securitization.”
Use of CDS in the Philippines In the article “Synthetic securitization in the Philippines”38, Morales discussed the
use of funded credit derivatives (e.g. credit linked notes or CLNs) and unfunded credit derivatives (e.g. credit default swaps) as embedded structures in synthetic securitization.
In BSP Circular No. 594, which defines the regulations on the use of derivatives
by Philippine banks, a Credit Linked Note is defined as follows39:
Credit Linked Note – refers to a pre-funded credit derivative instrument under which the note holder effectively accepts the transfer of credit risk pertaining to a reference asset or basket of assets issued by a reference entity/ies. The repayment of the principal to the note holder is contingent upon the occurrence of a defined credit event. In consideration thereof, the note holder receives an economic return reflecting the underlying credit risk of the reference assets… Plain vanilla CLNs are composed of a debt or deposit instrument and a credit default swap.
Thus, in a CLN, a bank issues a note linked to a reference asset to an investor who gives the bank the equivalent face value of the note in exchange for interest payments reflecting the credit worthiness of the issuer of the reference asset. If there is no credit event, the investor will get back the principal; otherwise, the terms of the embedded CDS will apply.
38 Global Securitisation and Structured Finance 2008, pp. 117-119 39 BSP Circular No. 594
Page 21 of 26

Regulations on the Use of Credit Derivatives There has been an increasing use of credit derivatives by local banks particularly
as high-yield investment instruments, where short CDS positions were embedded in notes issued by foreign banks or SPVs.
The Bangko Sentral ng Pilipinas (BSP) issued BSP Circular No. 417, Series of
2004, laying down the guidelines on credit linked notes (CLNs), credit linked deposits (CLDs), and credit linked loans (CLLs). These regulations were approved by the Monetary Board per its Resolution No. 1845 dated 18 December 2003.
The increasing investment by Philippine local banks in CLNs with Philippine sovereign debt as underlying reference assets has raised concerns about domestic banks’ rising exposure to risk through these credit derivatives. The BSP has expressed concerns that banks are taking on increasing amounts of credit linked derivatives and not making adequate provisions against the risks.
In relation to the above discussion, the BSP, as early as 2004, has issued a reminder to banks that
“In principle, these (sovereign debts) should have been issued overseas
and held onto by outside investors, but if you follow the cycle, the risk is actually turned around and returned to us by way of credit derivatives being sold to local banks. It is a complication that we are now tracking very closely,” said Assistant BSP Governor Nestor Espenilla, who heads the BSP’s supervision, reports and studies office.40
BSP reviews banks’ derivatives activities41
A Philippine bank can be on either side of a CLN transaction, as buyer or seller of protection. However, the bank must obtain a license from the BSP in order to do this. Universal banks and commercial banks may apply for a Type 1 authority from the BSP; otherwise, they can only invest in CLNs where the reference asset is an RoP issued or guaranteed asset.
In an article reported in the Manila Bulletin, the BSP is said to be reviewing the
derivatives activities of 17 banks that were given derivatives licenses. Of the 17, seven have “Type 1” authority, or expanded dealer authority; that is they are allowed to distribute, broker and transact as end-user any kind of derivative products. The seven banks are Citibank N.A., HSBC Ltd. Philippines, ING Bank, Standard Chartered Bank, JP Morgan Chase Bank, ANZ Banking Group, and Deutsche Bank AG.
On the other hand, ten banks have “Type 2” authority; that is they can transact as end-user and dealer of derivatives such as forward, swap or option products with specific underlying reference such as interest rates, equity, or commodity. The ten banks are Bank of the Philippine Islands, BDO Unibank, BDO Private Bank, Metrobank, Rizal Commercial Banking Corp., Security Bank Corp., Union Bank of the Philippines, Bank of Mareica, Bank of Tokyo, and Mizuho Corporate Bank.
40 As reported in The Manila Bulletin, April 19, 2004 41 As reported in The Manila Bulletin, January 16, 2012
Page 22 of 26

Meantime, three thrift banks with additional derivatives authority are HSBC Savings Bank, Philippine Savings Bank, and Sterling Bank of Asia. The review is part of the effort to update the existing BSP circulars on derivatives activities of banks, as embodied in BSP Circular No. 594 for banks and BSP Circular No. 668 for non-banks with quasi-banking authority.
Greek debt and credit default swaps In an article in The New York Times42, Louise Story says “It’s the $616 billion
question: Does the euro crisis have a hidden AIG?” The figure comes from the estimate that the exposure to CDS of the most financially pressed European Union countries – Portugal, Italy, Ireland, Greece and Spain – is about $616 billion. In the case of Greece, the estimate is about $78.7 billion are currently outstanding CDS on Greek debt.
The question as to whether the risk on these billions of dollars of European debt is
concentrated on a few companies, and whether defaults by these countries would trigger another world financial crisis, has been in the minds of market players since the European crisis came to the fore. And the decision by the ISDA through its EMEA DC mentioned in the introduction that Greece’s debt restructuring should trigger CDS payouts should provide some answers to the question. It is not the first time that the ISDA has ruled that CDS on sovereign debts should pay out; Argentina defaulted on its bonds in 2001 triggering payouts, followed by Ecuador in 2008.
Some investors entered into CDS on Greece to protect themselves against a
Greek default. There were also those who entered CDS contracts for speculation purposes. Before Greeks capacity to pay became doubtful, the CDS were cheap to buy. It is reported that at the start of 2008, it cost only $22,000 annually to buy a 5-year CDS on $10 million of Greek debt43. Before the ISDA ruling, the same CDS cost $7.68 million upfront and $100,000 annually44.
Earlier in March 2012, ISDA ruled that a credit event has not occurred with
Greece’s debt restructuring. But when Greece invoked what are called collective action clauses that forced private bondholders to forgive more than 100 billion euros in debt, the ISDA ruled that a credit event has occurred triggering payments on the CDS.
The decision to invoke the collective action clauses was a signal that European
policy makers became confident that triggering CDS payoffs would not put the financial system under stress as was feared. While CDS played a major role in the widespread financial crisis in 2008, the lessons learned by financial institutions and regulators have led to mechanisms to ensure that insurers can pay then the swaps are called. These mechanisms, crafted through the ISDA, include legally binding procedures, better definitions of what credit events can trigger pay outs, and better collateralization requirements. For example, it is reported that about 90 percent of CDS transactions are now collateralized, and that fifty-eight credit events have triggered payouts without much fanfare45.
42 Derivatives Cloud the Possible Fallout From a Greek Default, Louise Story, The New York Times, June 22, 2011 43 From “Debt Insurance in Greece Must Pay Out, Ruling Says”, The New York Times, March 9, 2012 44 As reported in Bloomberg, March 9, 2012; http://www.bloomberg.com/news/print/2012-03-09/ 45 As reported in Bloomberg, March 12, 2012; http://www.bloomberg.com/news/print/2012-03-12/
Page 23 of 26

Of the estimated more than $70 billion outstanding CDS on Greek debt, only an estimated $3.2 billion remains after buyers and sellers net out their positions. According to the DTCC, CDS on Greek debt cover only $3.16 billion of debt, down from about $6 billion last year. ISDA Chief Executive Officer Robert Pickel is reported to have said that “the actual payout will be much smaller than the net amount reported by DTCC” 46. Another report quotes Pickel saying “we saw today that the credit default swap market worked. Market participants expected it to work”47.
Market players will have to wait for the outcome of the auction that will be held to
determine the recovery prices of the defaulted bonds. ISDA has set the auction for March 19, 2012. But the Greek situation has clearly set the stage for a serious assessment of the effectiveness of credit default swaps to protect buyers of sovereign debt.
Conclusions and recommendations
What lessons can be drawn here? CDS are largely over-the-counter instruments; one bank just agrees with another bank to do a CDS deal. It is difficult to know how exposed a bank is in terms of its CDS positions. And it is more difficult for the bank to know how exposed the counterparty bank is in its CDS positions. The collapse of AIG raises the question: How does one institution trust its exposure to another? The bigger question is: If one bank has a derivatives contract (e.g. CDS) with another institution, how confident can it be about the soundness of the counterparty institution’s financial position?
Warren Buffet, in the 2002 annual report of Berkshire hatchway, wrote this opinion of his about derivatives48:
‘The derivatives genie is now well out of the bottle, and these instruments
will almost certainly multiply in variety and number until some event makes their toxicity clear. Central banks and governments have so far found no effective way to control, or even monitor, the risks posed by these contracts. In my view, derivatives are financial weapons of mass destruction, carrying dangers that, while now latent, are potentially lethal.’
At that time, the term “weapons of mass destruction” had become popular at the start of the Iraq War. With the experiences in the 2008 global financial crisis and the European situation, that fear does not seem to be unfounded.
But maybe it is not that derivatives are “evil” but the wrong use of derivatives is. As previously mentioned, financial institutions and regulators have learned a lot from the 2008 experience and have instituted changes to strengthen the derivatives market, particularly the market for credit derivatives. (See for example the European Central Bank’s published monograph on counterparty risk49.) These changes have benefitted participants in the CDS market on Greek debt. Although as previously pointed out, it remains to be seen if this “strengthening” is sufficient to avoid a “meltdown” in the event that other European countries follow the experience of Greece.
46 As reported in Bloomberg, March 9, 2012; http://www.bloomberg.com/news/print/2012-03-09/ 47As reported in “Debt Insurance in Greece Must Pay Out, Ruling Says”, The New York Times, March 9, 2012 48 http://www.fintools.com/docs/Warren Buffet on Derivatives.pdf 49 Credit Default Swaps and Counterparty Risk, European Central Bank, August 2009
Page 24 of 26

These lessons should help financial institutions in the Philippines and the BSP better handle the increasing availability of complex and mostly opaque financial products that have stand alone or embedded credit derivatives, or derivatives in general, and the corresponding risks that are associated with these products. While some structured products are attractive to investors who desire higher yield instruments, it is necessary to have an understanding and assessment, and measurement, of the risks inherent in these instruments or on the derivatives embedded in them. While derivatives, and credit default swaps, have been associated with big losses in the 2008 financial crisis, and in the uncertainty being faced in the European situation, they have also been used successfully by market participants to hedge against losses and reduce the impact of the crisis. The introduction in the Philippines by complex derivatives products should be viewed therefore as a means to introduce useful information and experiences for market participants to better understand, and therefore better manage, these products, while maximizing economic benefits from such investments. The BSP, on the other hand, while ensuring that banks exercise caution and strictly comply with BSP requirements before dealing with structured derivatives products, should also allow enough room for participation in the markets for derivatives product as experiences from these participation will help achieve the proper degrees and levels of control, monitoring, and regulation. Finally, the insight from the G20 is worth repeating here. In the Summit on Financial Markets and the World Economy held on November 15, 2008, the Leaders of the Group of Twenty stated the “Root Causes of the Current Crisis” as follows50:
• During a period of strong global growth, growing capital flows, and
prolonged stability earlier this decade, market participants sought higher yields without an adequate appreciation of the risks and failed to exercise proper due diligence.
• At the same time, weak underwriting standards, unsound risk management practices, increasingly complex and opaque financial products, and consequent excessive leverage combined to create vulnerabilities in the system.
• Policy-makers, regulators and supervisors, in some advanced countries, did
not adequately appreciate and address the risks building up in financial markets, keep pace with financial innovation, or take into account the systematic ramifications of domestic regulatory actions
The above declaration suggests we should go back to basics.
E N D
The author acknowledges with thanks the insights shared by Mr. Eduardo V. Francisco, Executive Vice President and President of BDO Capital & Investment of Banco De Oro Universal Bank; and Ms. Angelica S. Reyes, Senior Vice President and Head, Sales and Structuring Division, Treasury Group of Metropolitan Bank & Trust Co., on the use of CDS and derivatives in the Philippines.
50 “Declaration of the Summit on Financial Markets and the World Economy,” White House News, November 15, 2008
Page 25 of 26

References Aragon, Bienvenido. (2008) Credit Derivatives, Professorial Chair Paper, College of
Business Administration, UP Diliman, 3rd April 2008. Cao, Sergio. (2008) Credit, Derivatives, and the Global Financial Crisis, Professorial
Chair Paper, College of Business Administration, UP Diliman, 6th December 2007.
European Central Bank. (2009, August) Credit Default Swaps and Counterparty Risk.
Retrieved from European Central Bank Eurosystem Website: http://www.ecb.europa.eu/home/html/index.en.html
Finnerty, John D. (1998) The PricewaterhouseCoopers Credit Derivatives Primer. LLP,
New York. Hull, John. (2009).Options, Futures, and Other Derivatives. (7th ed.).Pearson
International Edition. New Jersey: Pearson Prentice Hall. 9780135009949 IntercontinentalExchange: Creditex, ICE Link, ICE Trust U.S., ICE Clear Europe CDS.
(March 2010). Global Credit Derivatives Markets Overview: Evolution, Standardization and Clearing.
Jorion, Philippe. Global Association of Risk Professionals (2007). Financial Risk
Management Handbook. (4th ed.). New Jersey:Wiley. 9780470126301 Mengle, David. (2007). Credit Derivatives: An Overview. Federal Reserve Bank of
Atlanta Economic Review, Fourth Quarter 2007 Nomura Fixed Income Research. (2004, May 12) Credit Default Swap (CDS) Primer. The J.P. Morgan Guide to Credit Derivatives with contributions from the RiskMetrics
Group (1999). London: Risk Ybanez, Roy (2007) Subprime and Securitization, Professorial Chair Paper, College of
Business Administration, UP Diliman, 12th December 2007.
Page 26 of 26