Embed Size (px)
Citation preview
Lecture Outline
© 2015 Pearson Education, Inc.
Chapter 12: Surveying the Stars
© 2015 Pearson Education, Inc.
12.1 Properties of Stars
Our goals for learning:• How do we measure stellar luminosities?• How do we measure stellar temperatures?• How do we measure stellar masses?
© 2015 Pearson Education, Inc.
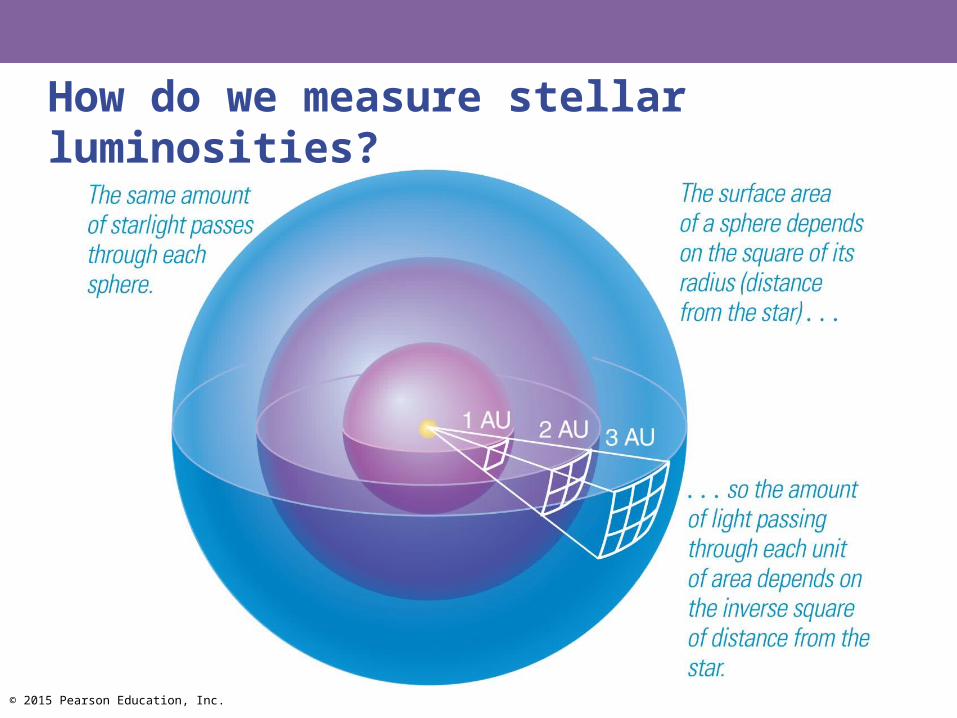
How do we measure stellar luminosities?

© 2015 Pearson Education, Inc.
Brightness of a star depends on both distance and luminosity.
© 2015 Pearson Education, Inc.
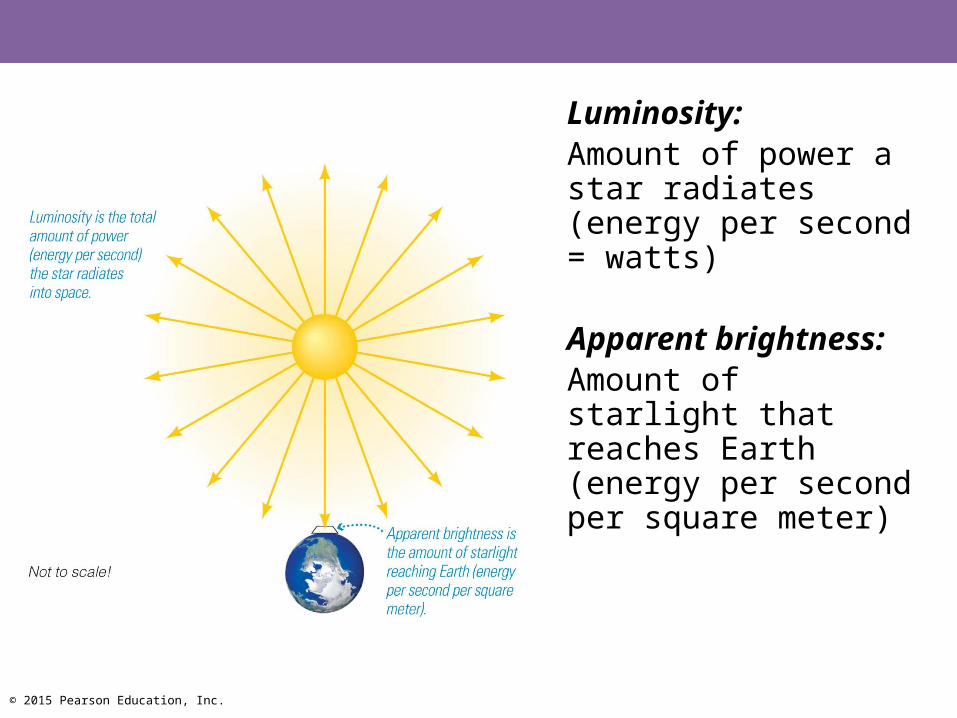
Luminosity: Amount of power a star radiates (energy per second = watts)
Apparent brightness: Amount of starlight that reaches Earth (energy per second per square meter)
© 2015 Pearson Education, Inc.
Thought Question
These two stars have about the same luminosity— which one appears brighter?
A. Alpha Centauri
B. The Sun
© 2015 Pearson Education, Inc.
Thought Question
These two stars have about the same luminosity— which one appears brighter?
A. Alpha Centauri
B. The Sun
© 2015 Pearson Education, Inc.
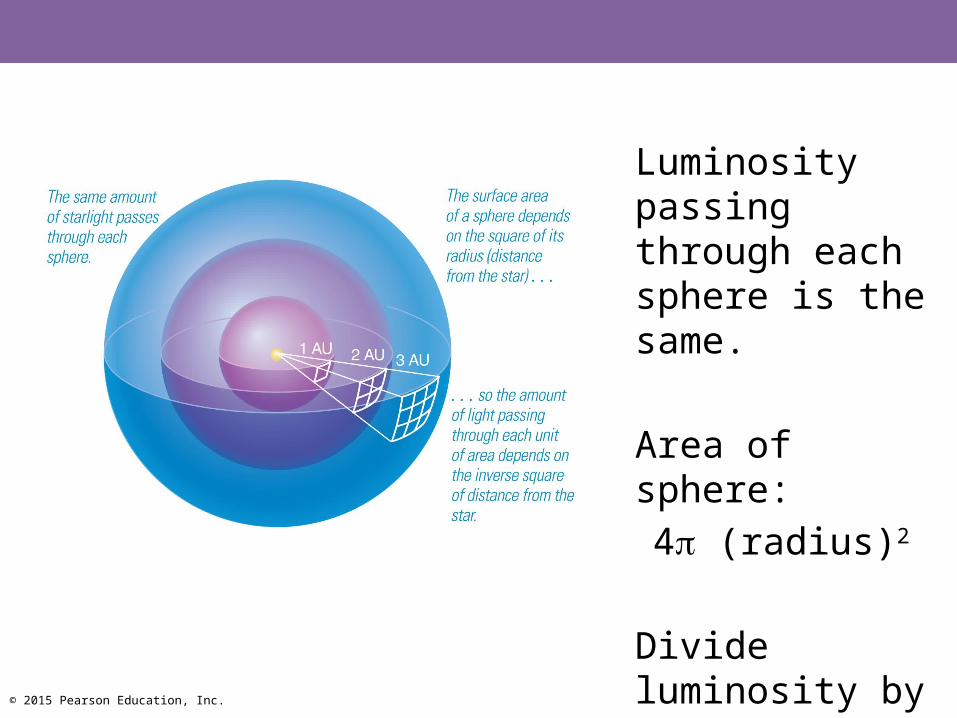
Luminosity passing through each sphere is the same.
Area of sphere:
4 (radius)2
Divide luminosity by area to get brightness.
© 2015 Pearson Education, Inc.
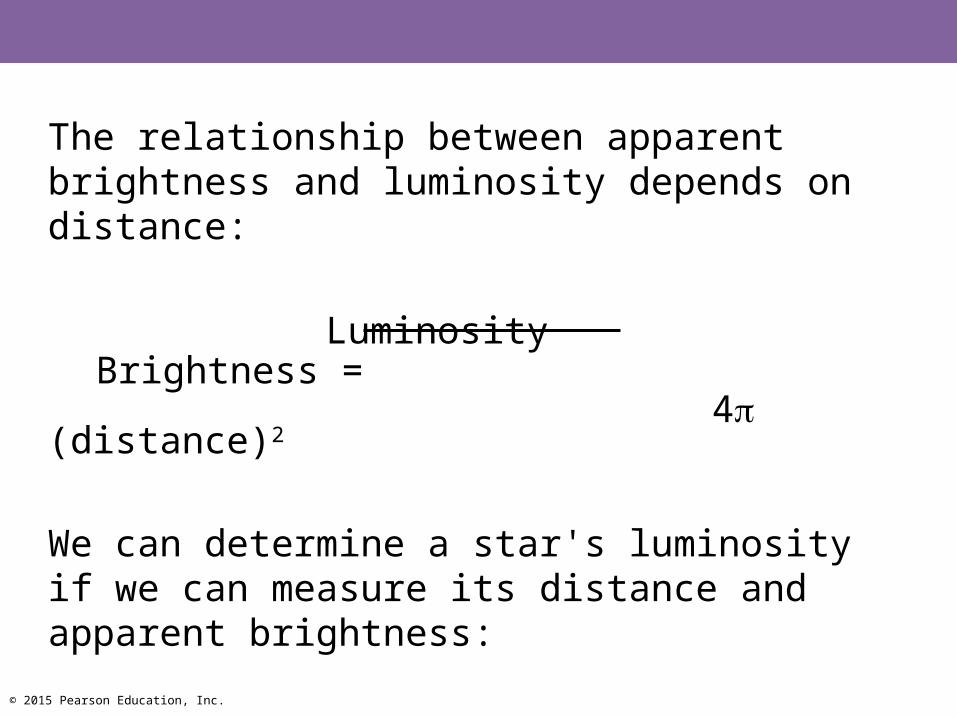
The relationship between apparent brightness and luminosity depends on distance:
Luminosity Brightness = 4 (distance)2
We can determine a star's luminosity if we can measure its distance and apparent brightness:
Luminosity = 4 (distance)2 (Brightness)

© 2015 Pearson Education, Inc.
Thought Question
How would the apparent brightness of Alpha Centauri change if it were three times farther away?
A. It would be only 1/3 as bright.
B. It would be only 1/6 as bright.
C. It would be only 1/9 as bright.
D. It would be three times as bright.
© 2015 Pearson Education, Inc.
Thought Question
How would the apparent brightness of Alpha Centauri change if it were three times farther away?
A. It would be only 1/3 as bright.
B. It would be only 1/6 as bright.
C. It would be only 1/9 as bright.
D. It would be three times as bright.

© 2015 Pearson Education, Inc.
So how far away are these stars?
© 2015 Pearson Education, Inc.
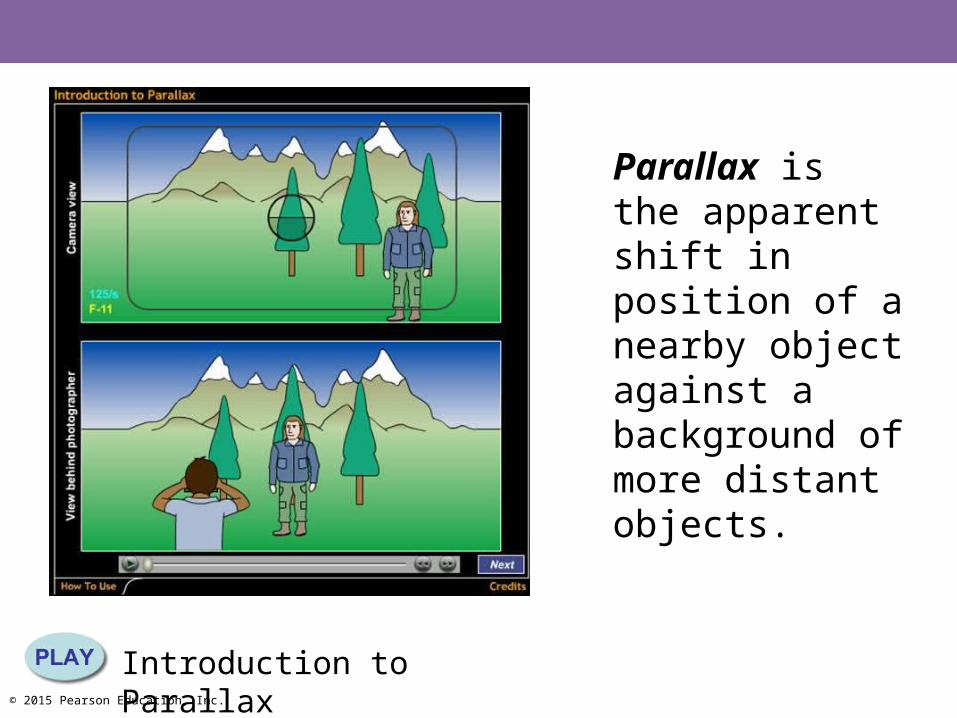
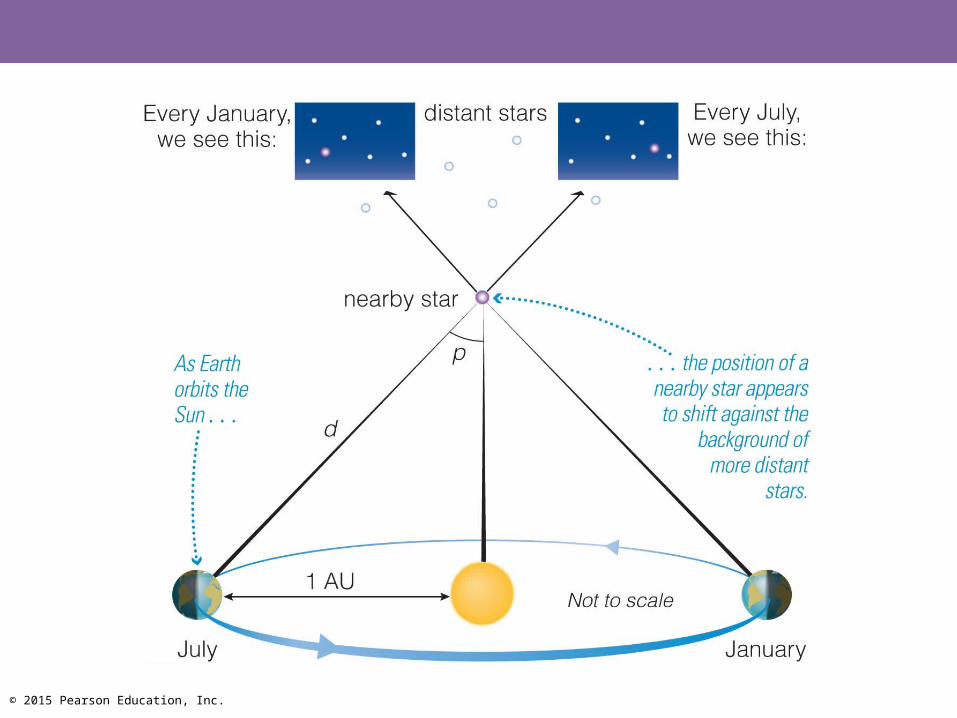
Introduction to Parallax
Parallax is the apparent shift in position of a nearby object against a background of more distant objects.
© 2015 Pearson Education, Inc.
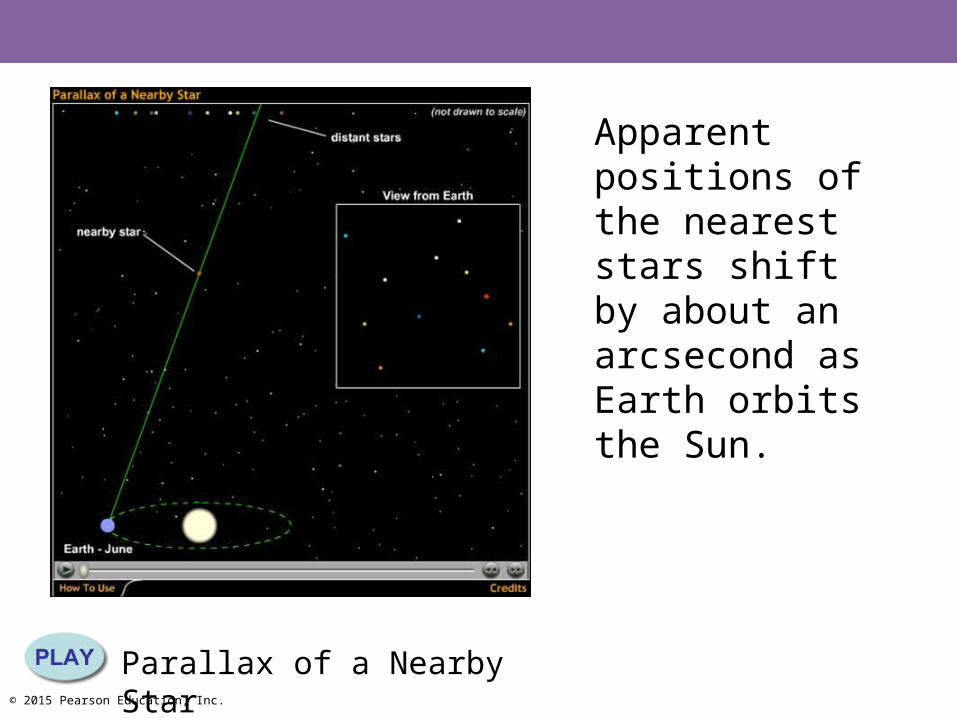
Parallax of a Nearby Star
Apparent positions of the nearest stars shift by about an arcsecond as Earth orbits the Sun.
© 2015 Pearson Education, Inc.
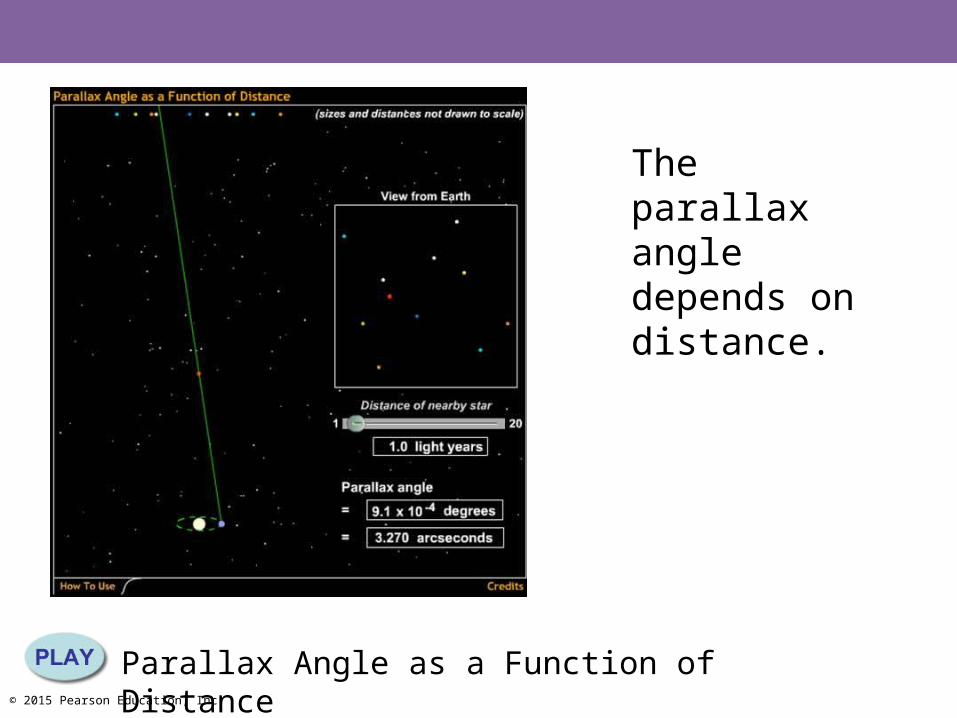
Parallax Angle as a Function of Distance
The parallax angle depends on distance.
© 2015 Pearson Education, Inc.
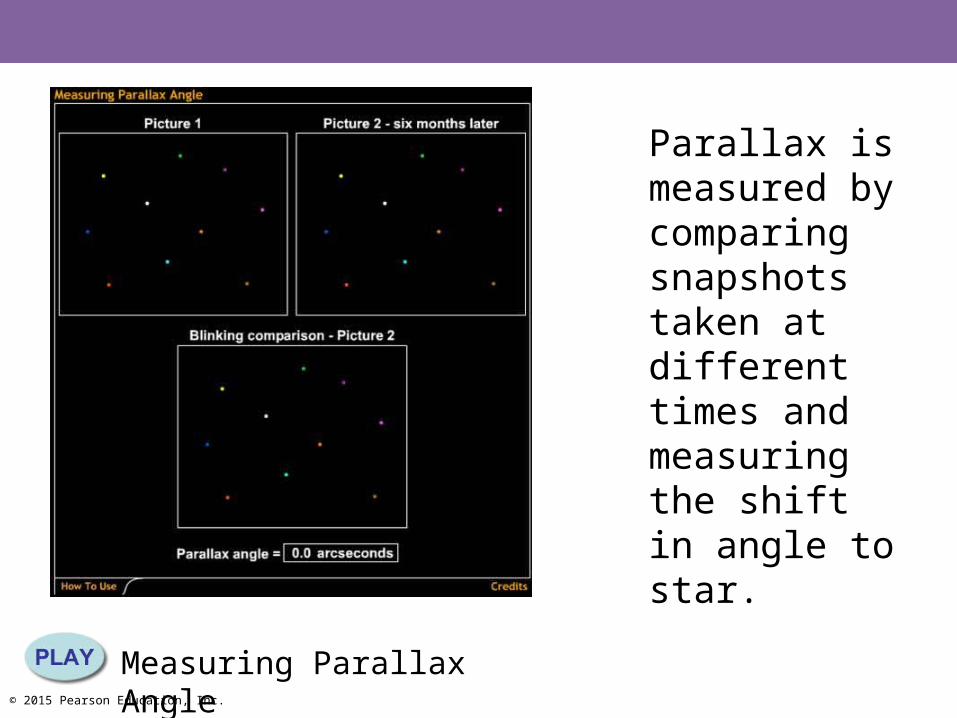
Measuring Parallax Angle
Parallax is measured by comparing snapshots taken at different times and measuring the shift in angle to star.
© 2015 Pearson Education, Inc.
© 2015 Pearson Education, Inc.
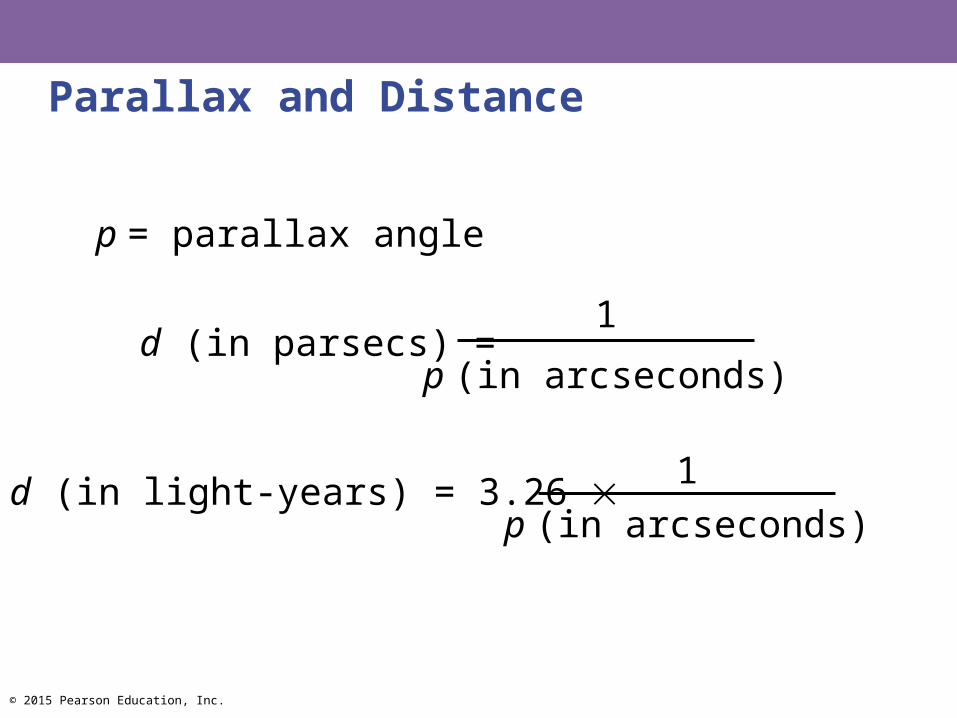
Parallax and Distance
p = parallax angle
d (in parsecs) =p (in arcseconds)
1
d (in light-years) = 3.26 p (in arcseconds)
1
© 2015 Pearson Education, Inc.
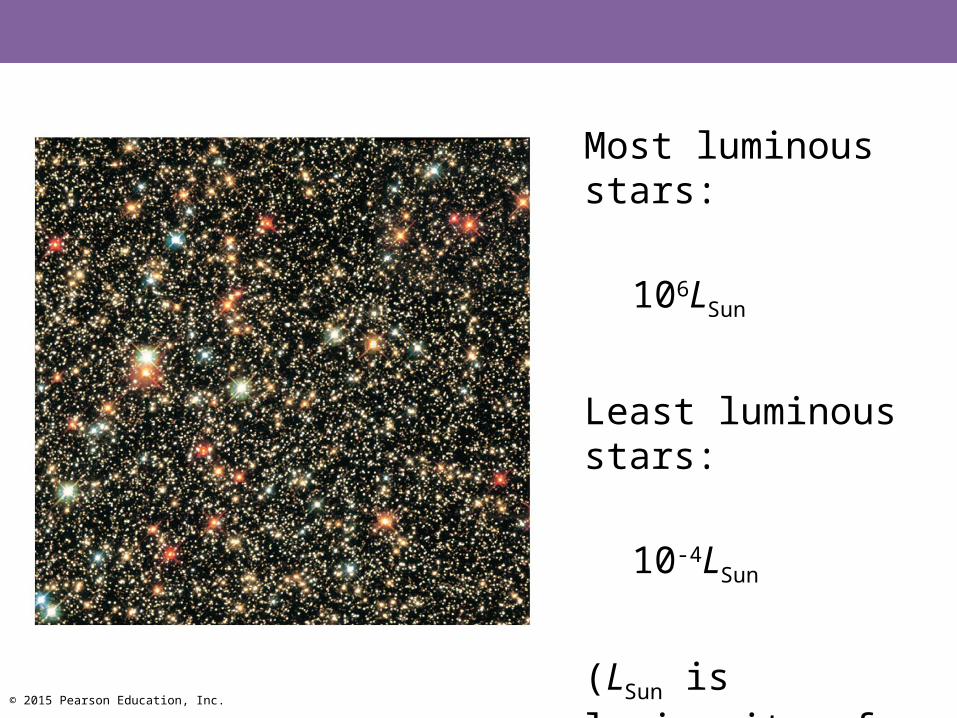
Most luminous stars:
106LSun
Least luminous stars:
10-4LSun
(LSun is luminosity of the Sun)

© 2015 Pearson Education, Inc.
The Magnitude Scale
m = apparent magnitude M = absolute magnitude
apparent brightness of Star 1
apparent brightness of Star 2= (1001/5)m1–m2
luminosity of Star 1
luminosity of Star 2= (1001/5)M1–M2
© 2015 Pearson Education, Inc.
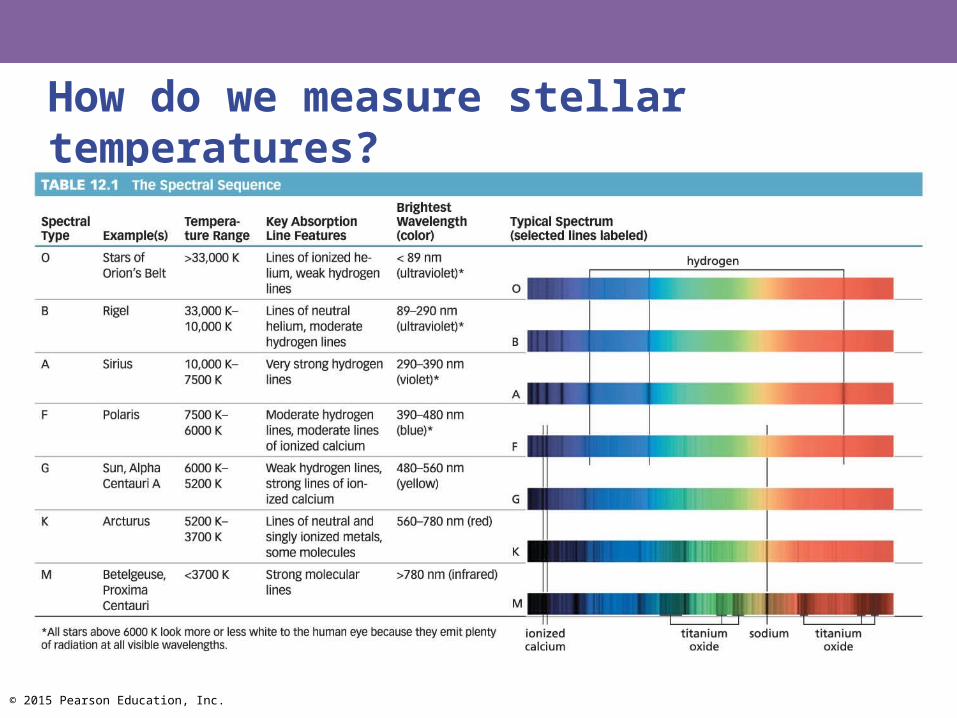
How do we measure stellar temperatures?

© 2015 Pearson Education, Inc.
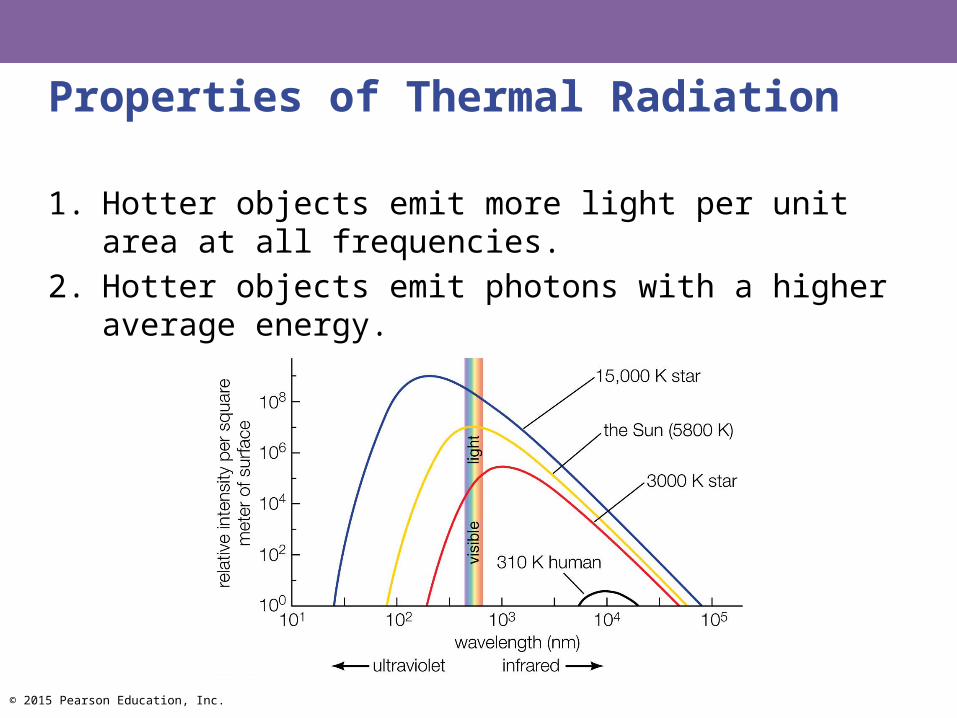
Every object emits thermal radiation with a spectrum that depends on its temperature.

© 2015 Pearson Education, Inc.
Relationship Between Temperature and Luminosity
An object of fixed size grows more luminous as its temperature rises.
© 2015 Pearson Education, Inc.
Properties of Thermal Radiation
1. Hotter objects emit more light per unit area at all frequencies.
2. Hotter objects emit photons with a higher average energy.
© 2015 Pearson Education, Inc.
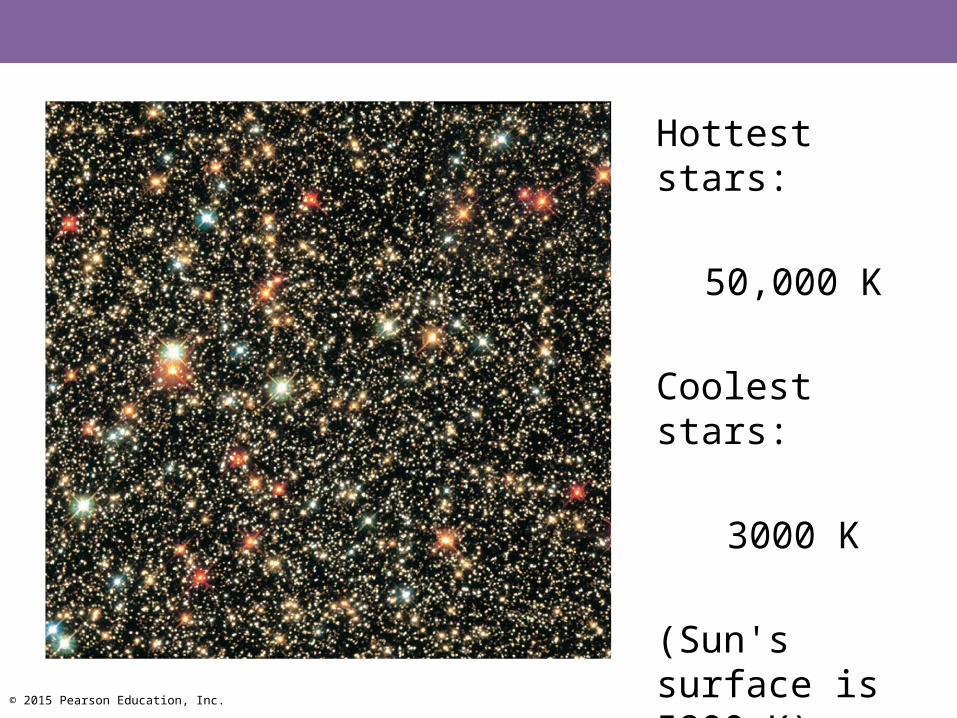
Hottest stars:
50,000 K
Coolest stars:
3000 K
(Sun's surface is 5800 K)

© 2015 Pearson Education, Inc.
Level of ionization also reveals a star's temperature.
Solid
Molecules
Neutral Gas
IonizedGas(Plasma)
10 K
102 K
103 K
104 K
105 K
106 K

© 2015 Pearson Education, Inc.
Absorption lines in a star's spectrum tell us its ionization level.

© 2015 Pearson Education, Inc.
Lines in a star's spectrum correspond to a spectral type that reveals its temperature:
(Hottest) O B A F G K M (Coolest)

© 2015 Pearson Education, Inc.
Remembering Spectral Types
(Hottest) O B A F G K M (Coolest)
• Oh, Be A Fine Girl/Guy, Kiss Me
(Traditional Mnemonic)
© 2015 Pearson Education, Inc.
Thought Question
Which of the stars below is hottest?
A. M star
B. F star
C. A star
D. K star
© 2015 Pearson Education, Inc.
Thought Question
Which of the stars below is hottest?
A. M star
B. F star
C. A star
D. K star
© 2015 Pearson Education, Inc.
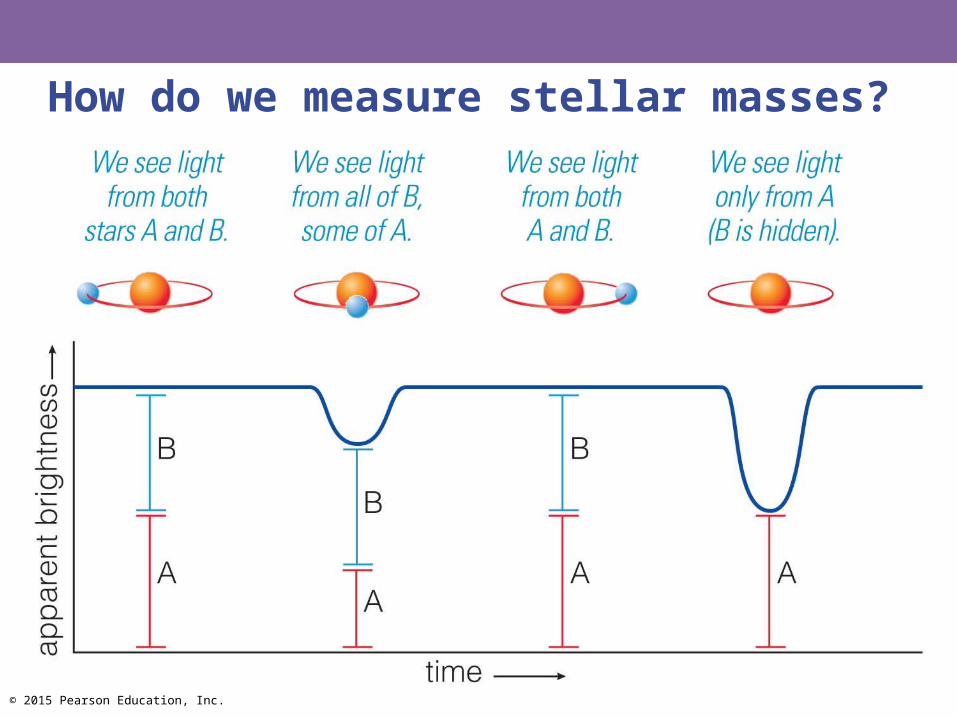
How do we measure stellar masses?
© 2015 Pearson Education, Inc.
Binary Star Orbits
Orbit of a binary star system depends on the strength of gravity.
© 2015 Pearson Education, Inc.
Types of Binary Star Systems
• Visual binary• Eclipsing binary• Spectroscopic binary
About half of all stars are in binary systems.
© 2015 Pearson Education, Inc.
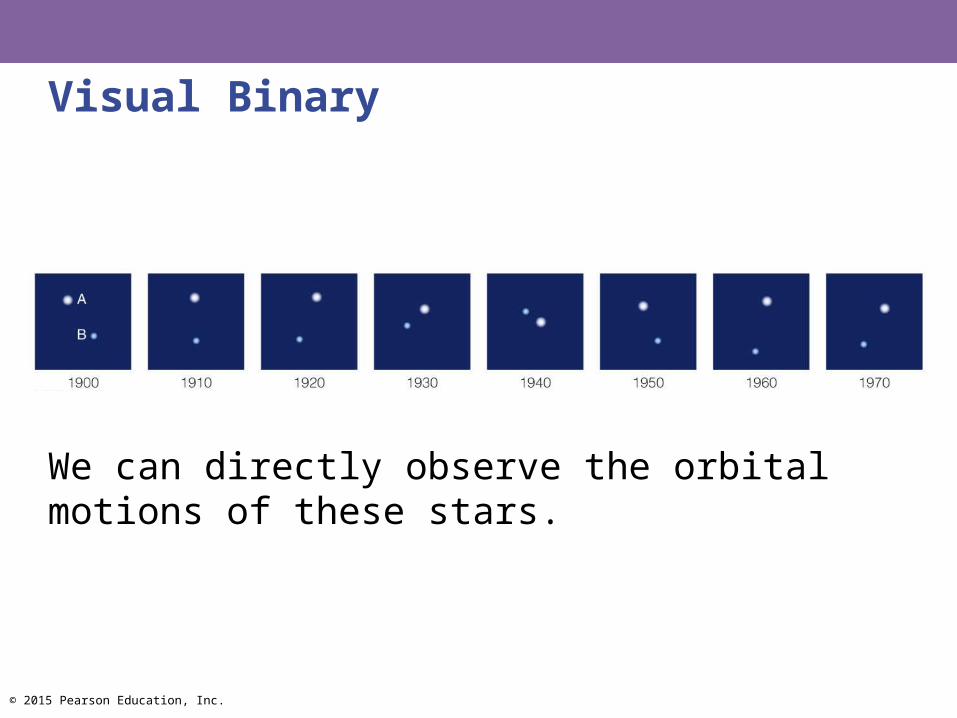
Visual Binary
We can directly observe the orbital motions of these stars.
© 2015 Pearson Education, Inc.
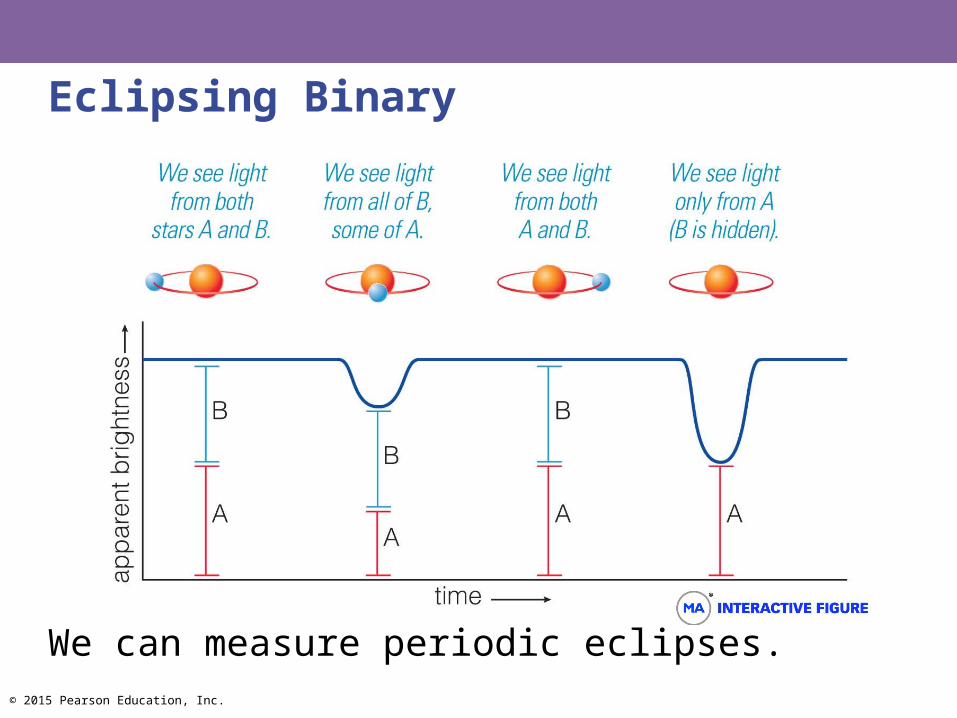
Eclipsing Binary
We can measure periodic eclipses.

© 2015 Pearson Education, Inc.
Spectroscopic Binary
We determine the orbit by measuring Doppler shifts.
© 2015 Pearson Education, Inc.
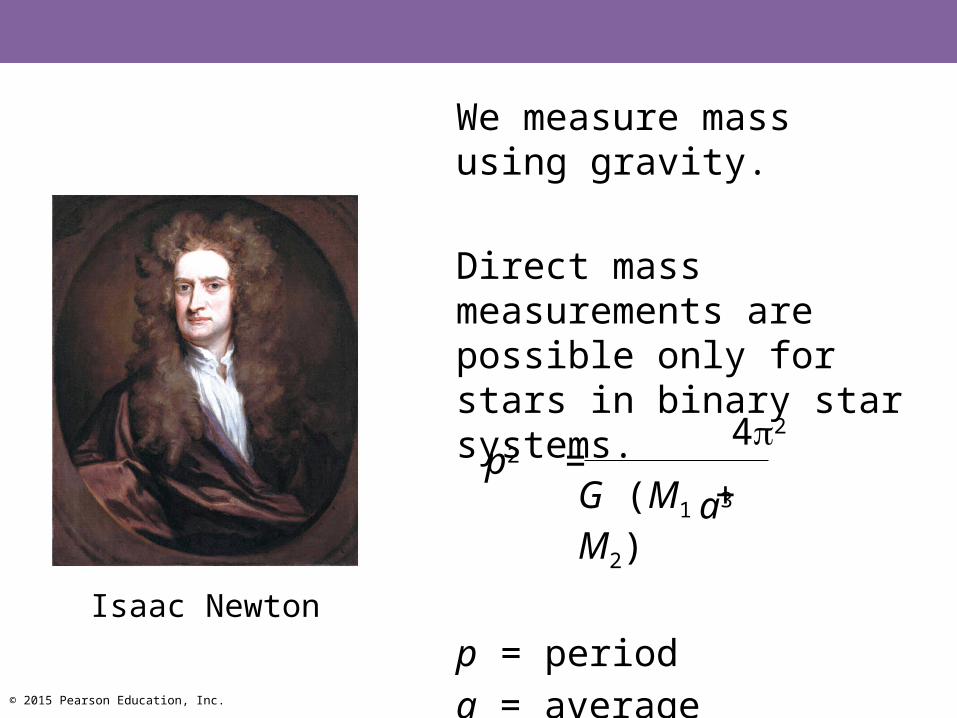
We measure mass using gravity.
Direct mass measurements are possible only for stars in binary star systems.
p = period
a = average separationIsaac Newton
p2 = a3 42
G (M1 + M2)
© 2015 Pearson Education, Inc.
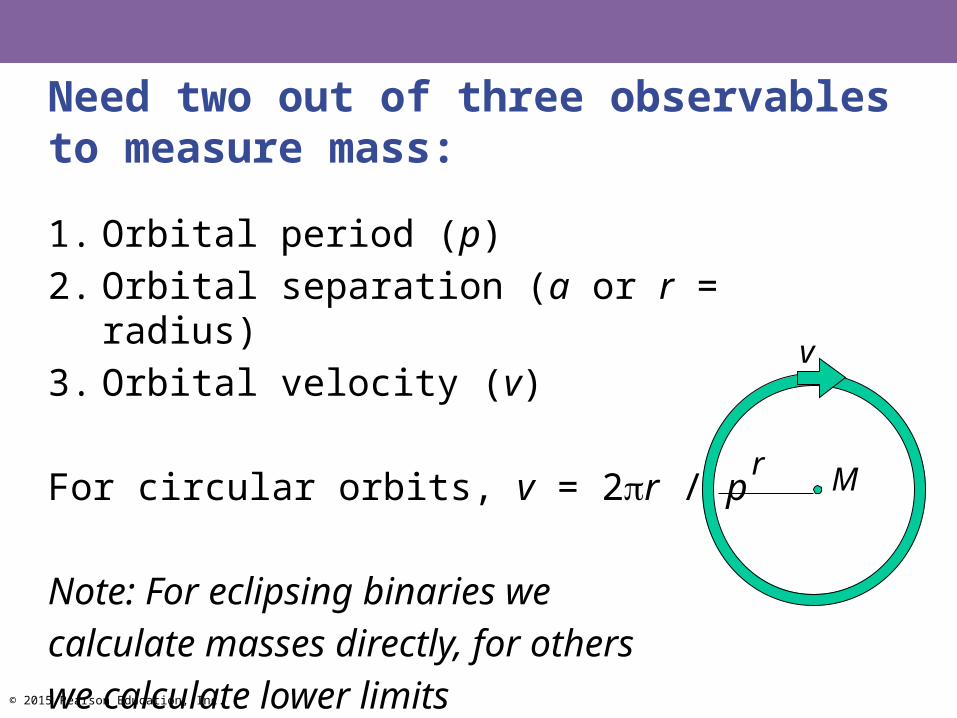
Need two out of three observables to measure mass:
1. Orbital period (p)
2. Orbital separation (a or r = radius)
3. Orbital velocity (v)
For circular orbits, v = 2r / p
Note: For eclipsing binaries we
calculate masses directly, for others
we calculate lower limits
r M
v
© 2015 Pearson Education, Inc.
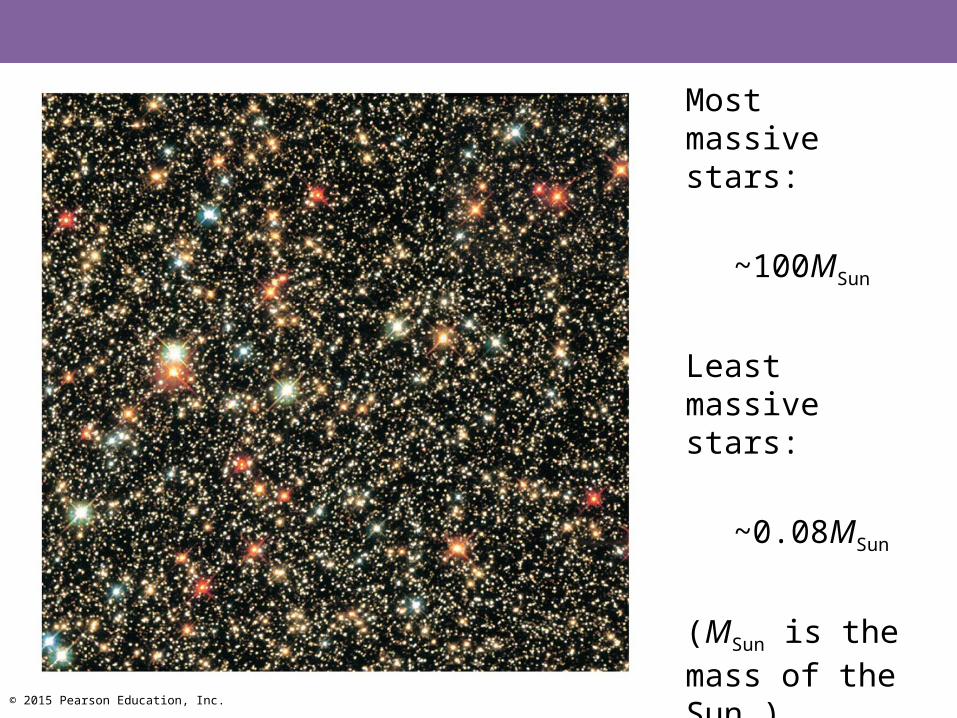
Most massive stars:
~100MSun
Least massive stars:
~0.08MSun
(MSun is the mass of the Sun.)
© 2015 Pearson Education, Inc.
12.2 Patterns Among Stars
Our goals for learning:• What is a Hertzsprung–Russell diagram?• What is the significance of the main sequence?• What are giants, supergiants, and white dwarfs?
© 2015 Pearson Education, Inc.
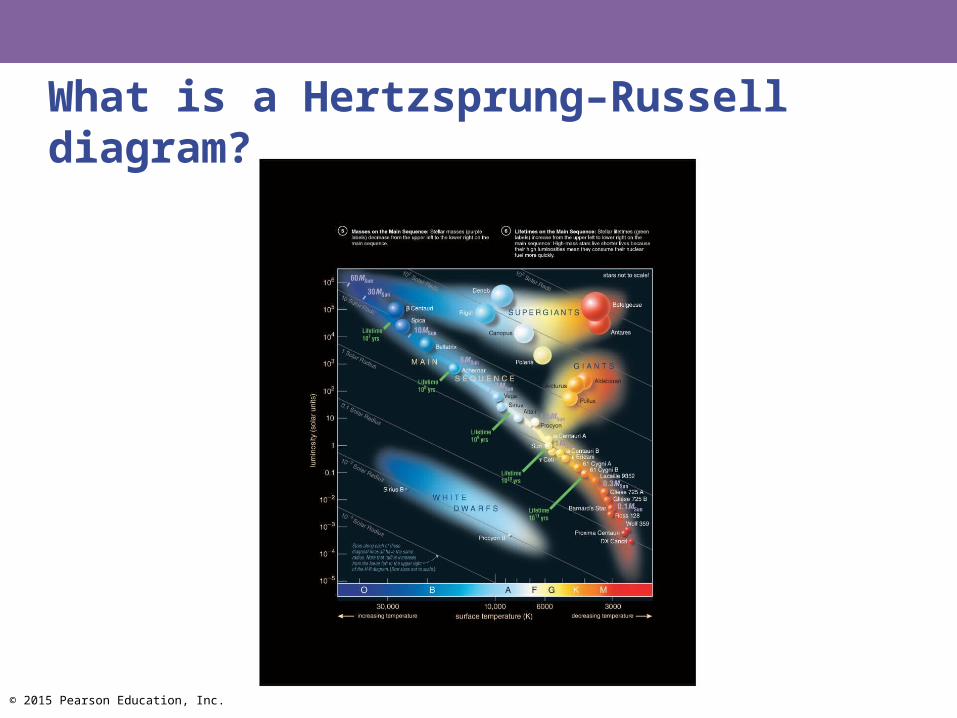
What is a Hertzsprung–Russell diagram?
© 2015 Pearson Education, Inc.
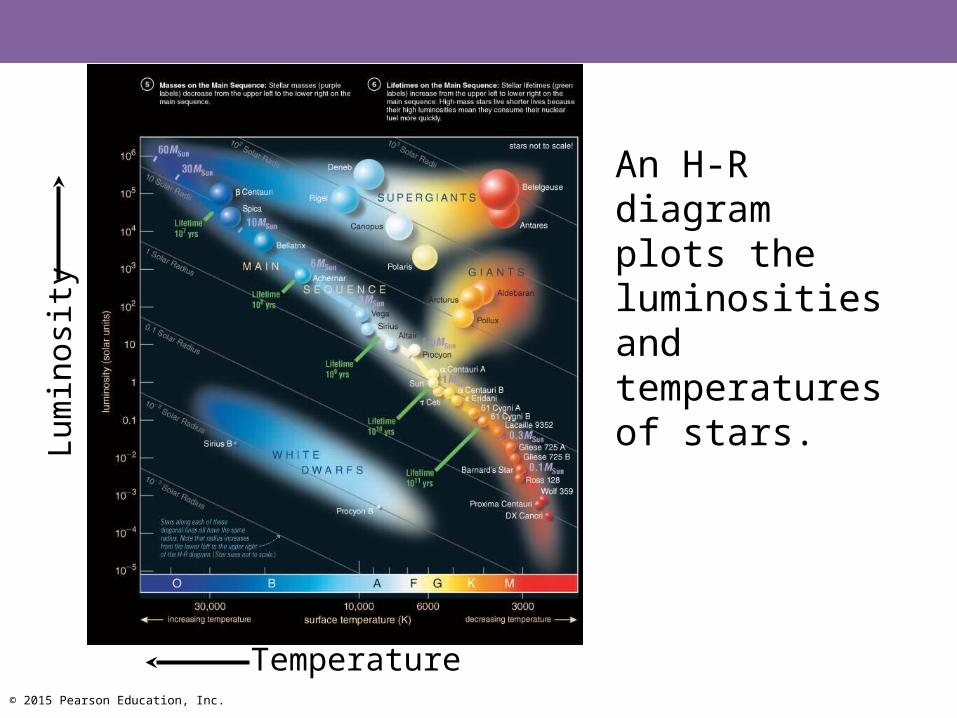
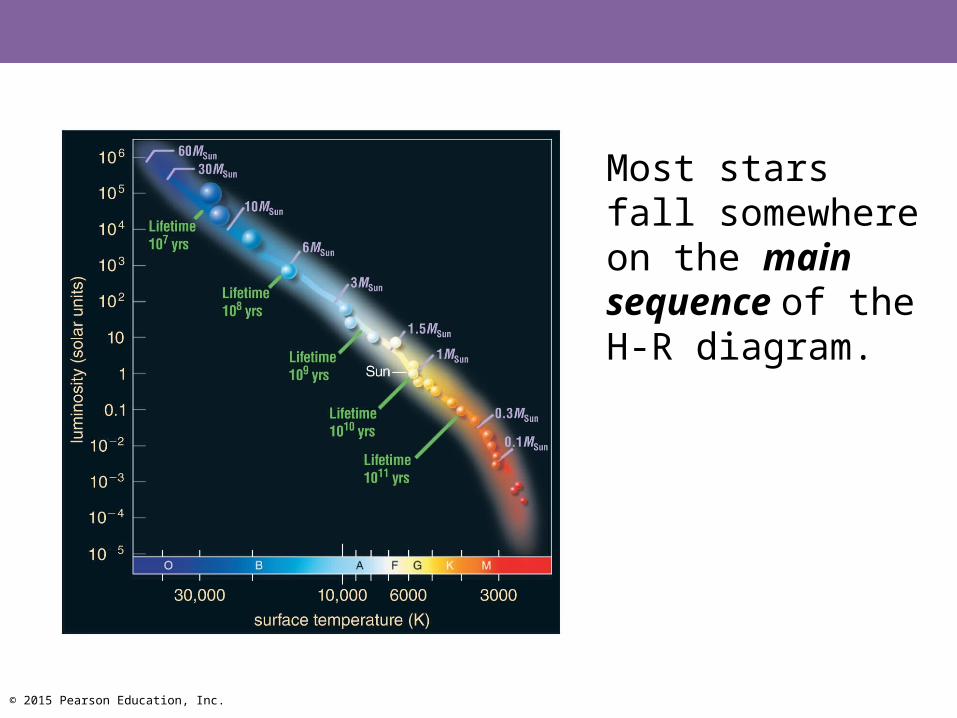
An H-R diagram plots the luminosities and temperatures of stars.
Lum
inos
ity
Temperature
© 2015 Pearson Education, Inc.
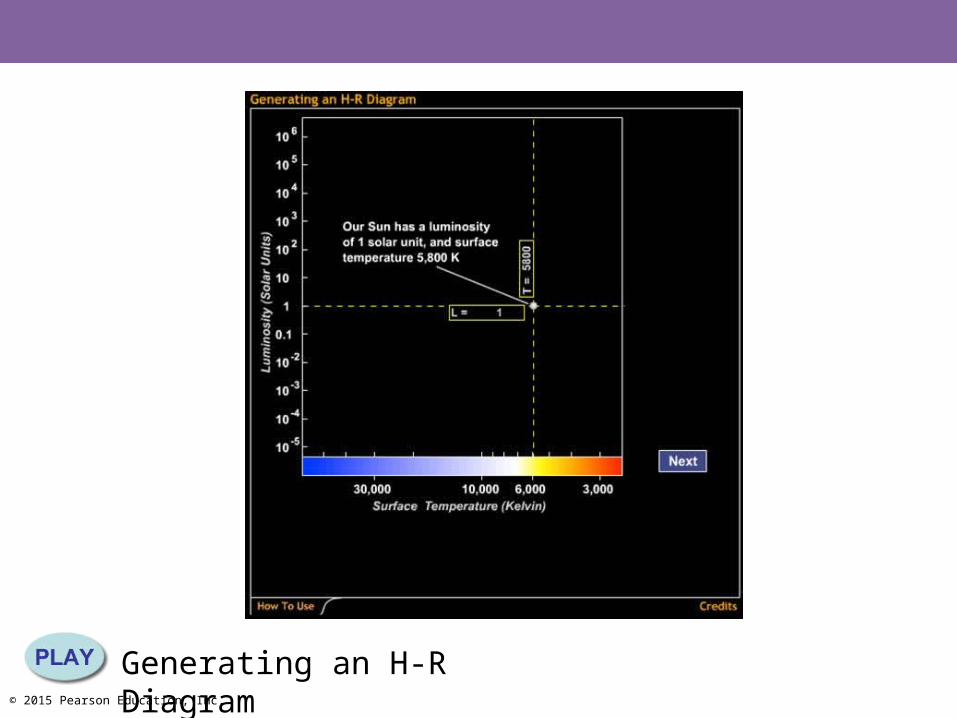
Generating an H-R Diagram
© 2015 Pearson Education, Inc.
Most stars fall somewhere on the main sequence of the H-R diagram.
© 2015 Pearson Education, Inc.
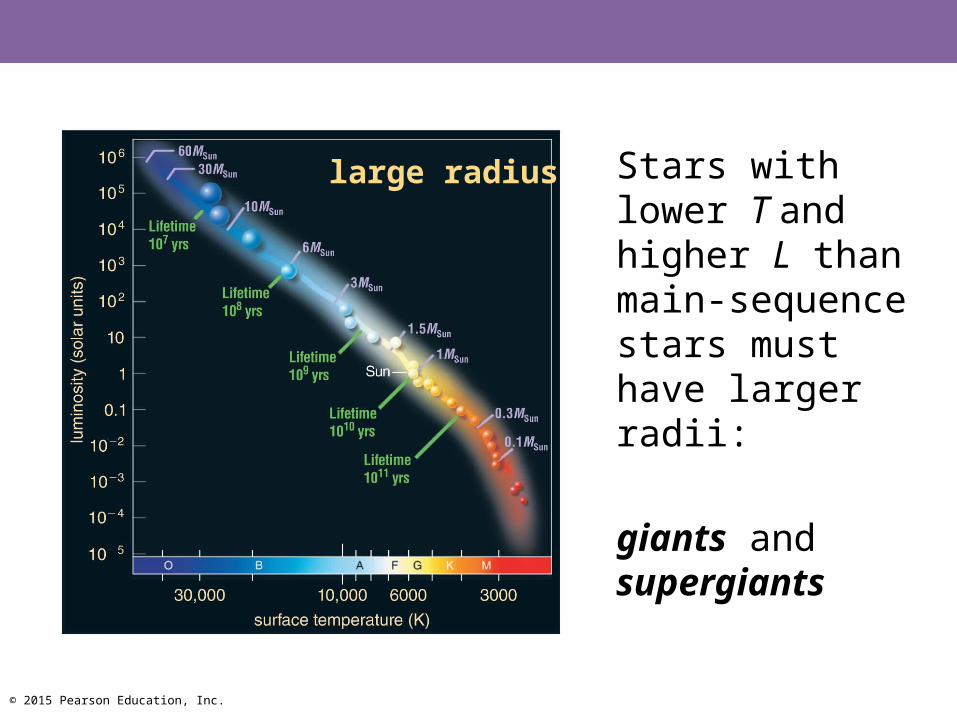
Stars with lower T and higher L than main-sequence stars must have larger radii:
giants and supergiants
large radius
© 2015 Pearson Education, Inc.
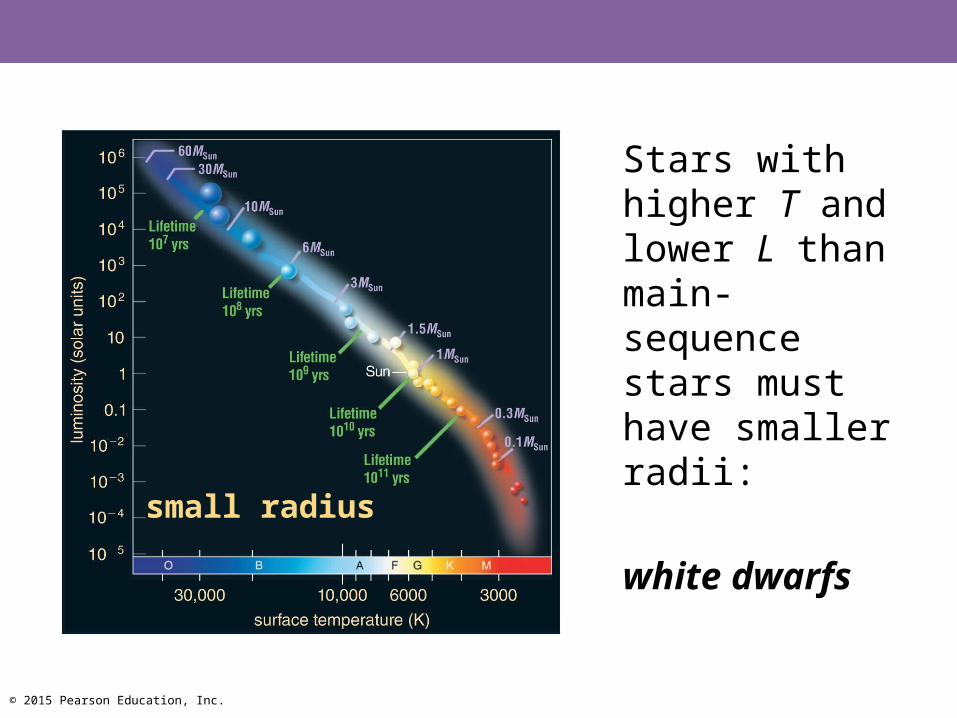
Stars with higher T and lower L than main-sequence stars must have smaller radii:
white dwarfssmall radius

© 2015 Pearson Education, Inc.
A star's full classification includes spectral type (line identities) and luminosity class (line shapes, related to the size of the star): I — supergiant II — bright giant III — giant IV — subgiant V — main sequence
Examples: Sun — G2 VSirius — A1 VProxima Centauri — M5.5 VBetelgeuse — M2 I

© 2015 Pearson Education, Inc.
H-R diagram depicts:
Temperature
Color
Spectral type
Luminosity
Radius
Lum
inos
ity
Temperature

© 2015 Pearson Education, Inc.
A
BC
D
Which star is the hottest?

© 2015 Pearson Education, Inc.
Which star is the hottest?
A
BC
D
A
© 2015 Pearson Education, Inc.
A
BC
D
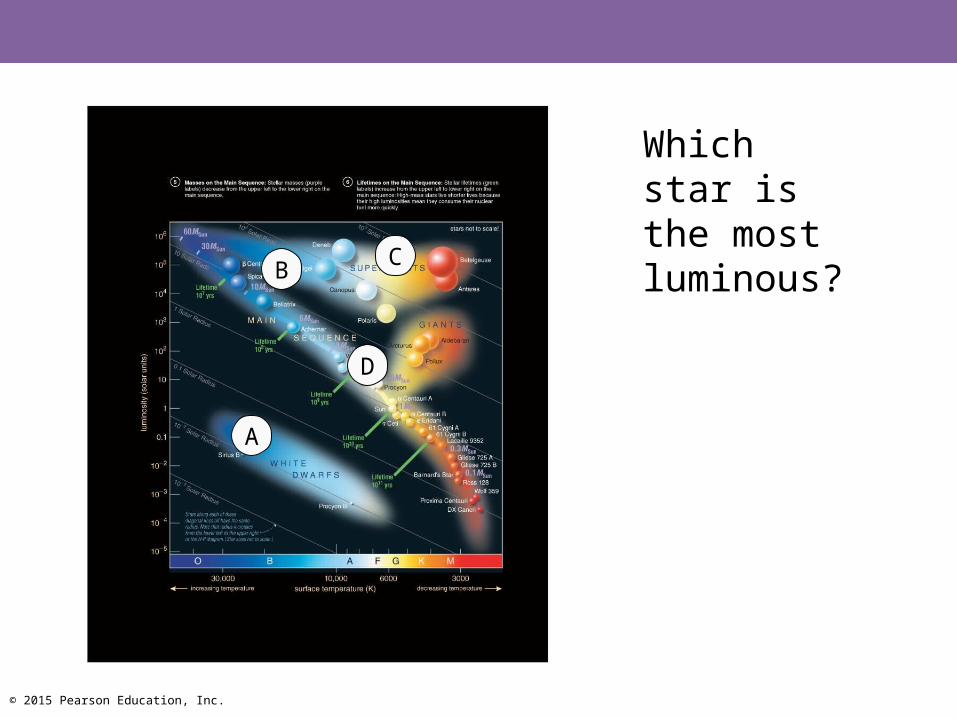
Which star is the most luminous?

© 2015 Pearson Education, Inc.
A
BC
D
C
Which star is the most luminous?

© 2015 Pearson Education, Inc.
A
BC
D
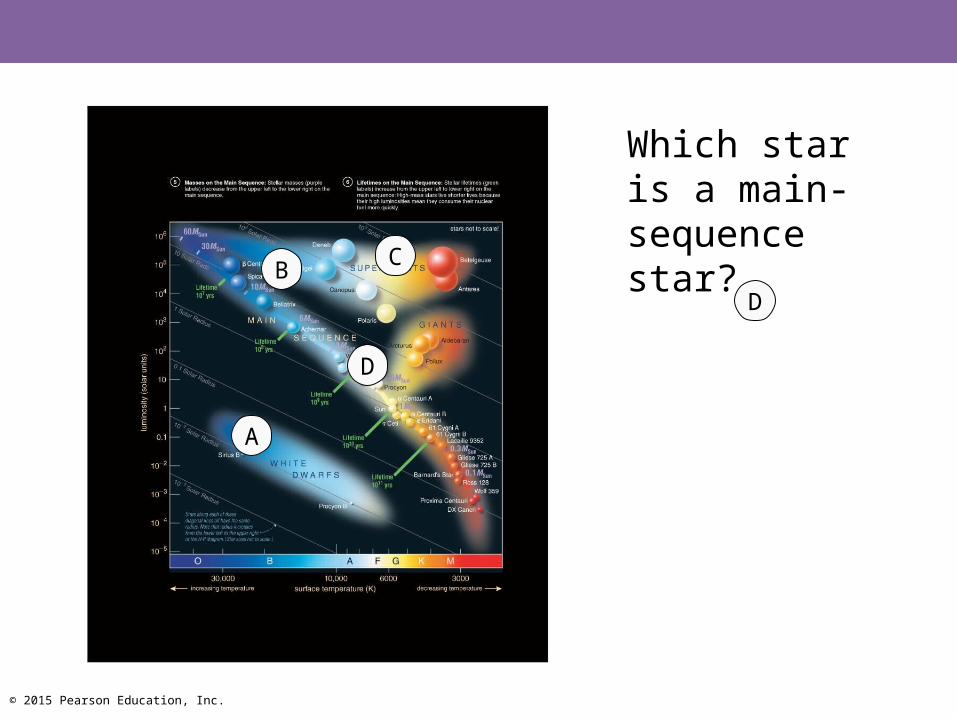
Which star is a main-sequence star?
© 2015 Pearson Education, Inc.
A
BC
D
D
Which star is a main-sequence star?
© 2015 Pearson Education, Inc.
A
BC
D
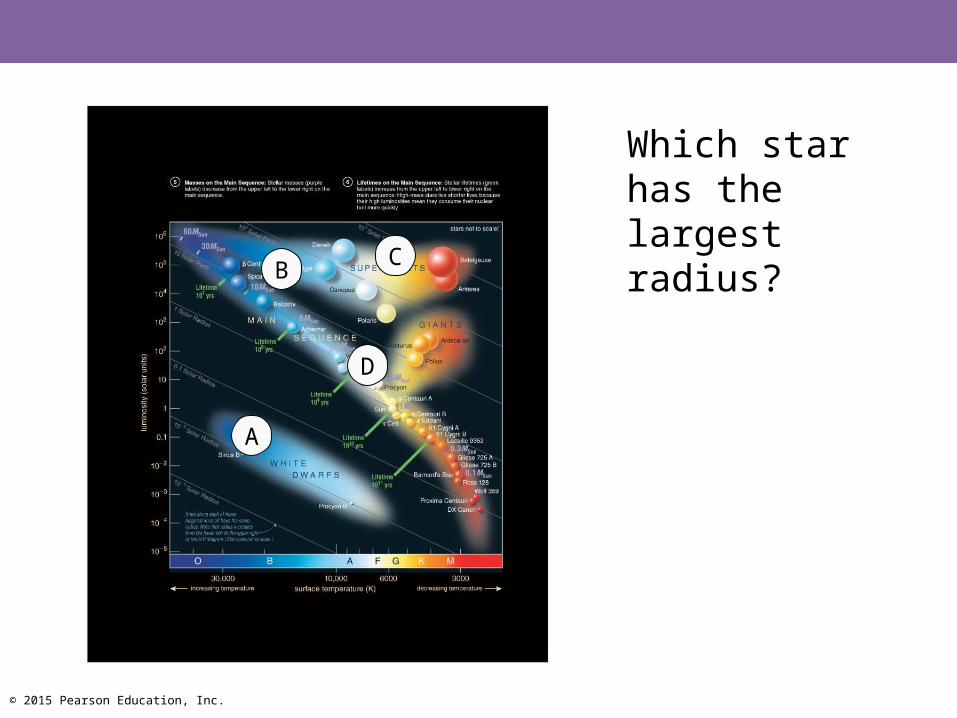
Which star has the largest radius?
© 2015 Pearson Education, Inc.
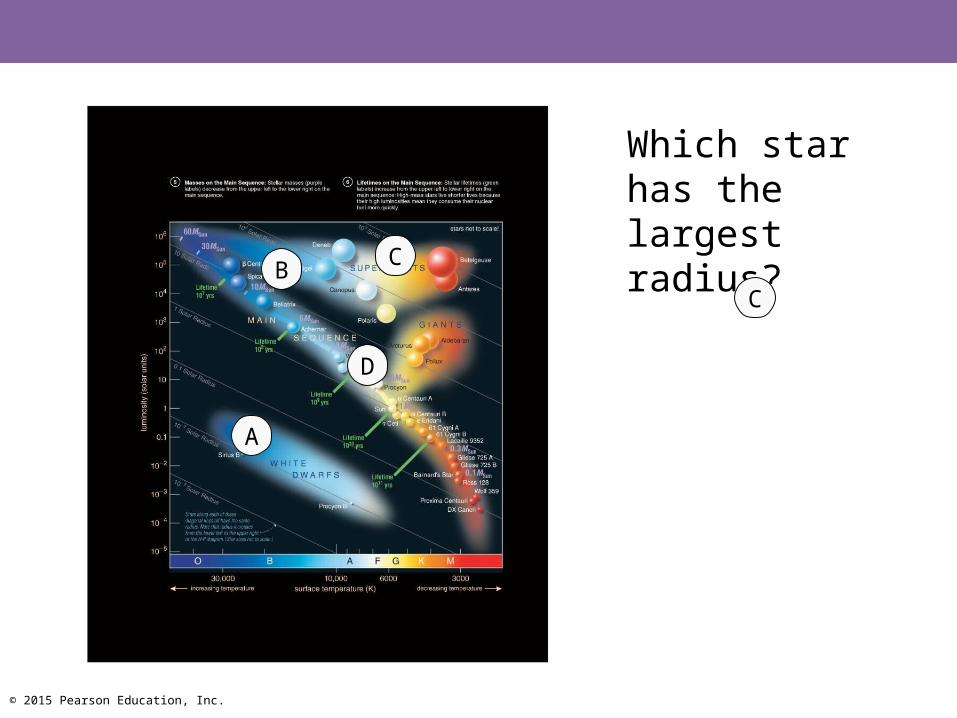
Which star has the largest radius?
A
BC
D
C

© 2015 Pearson Education, Inc.
What is the significance of the main sequence?
© 2015 Pearson Education, Inc.
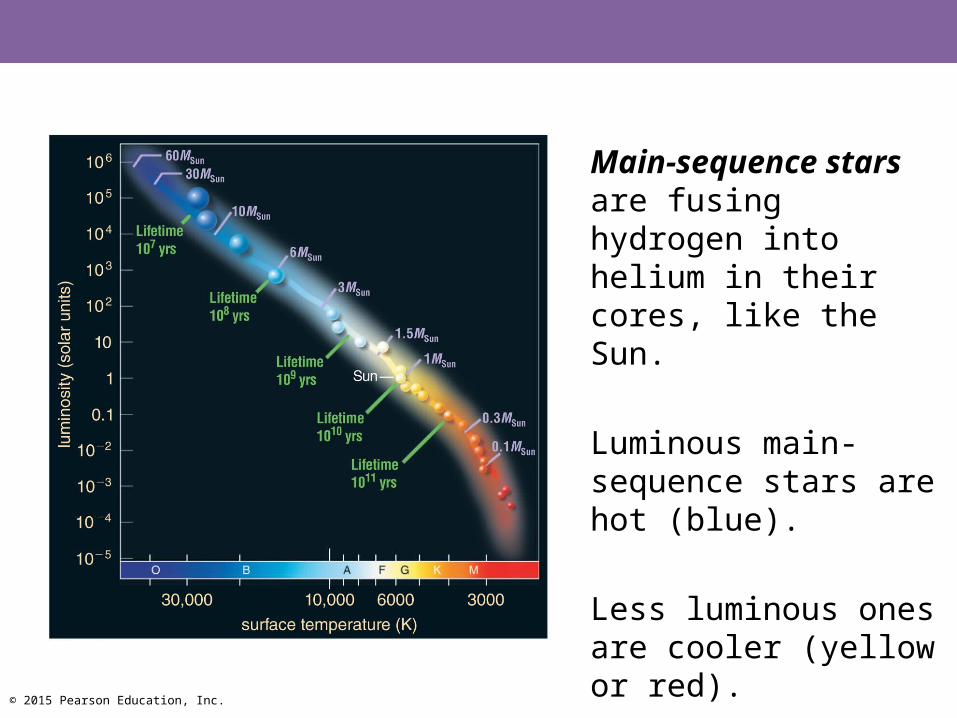
Main-sequence stars are fusing hydrogen into helium in their cores, like the Sun.
Luminous main-sequence stars are hot (blue).
Less luminous ones are cooler (yellow or red).
© 2015 Pearson Education, Inc.
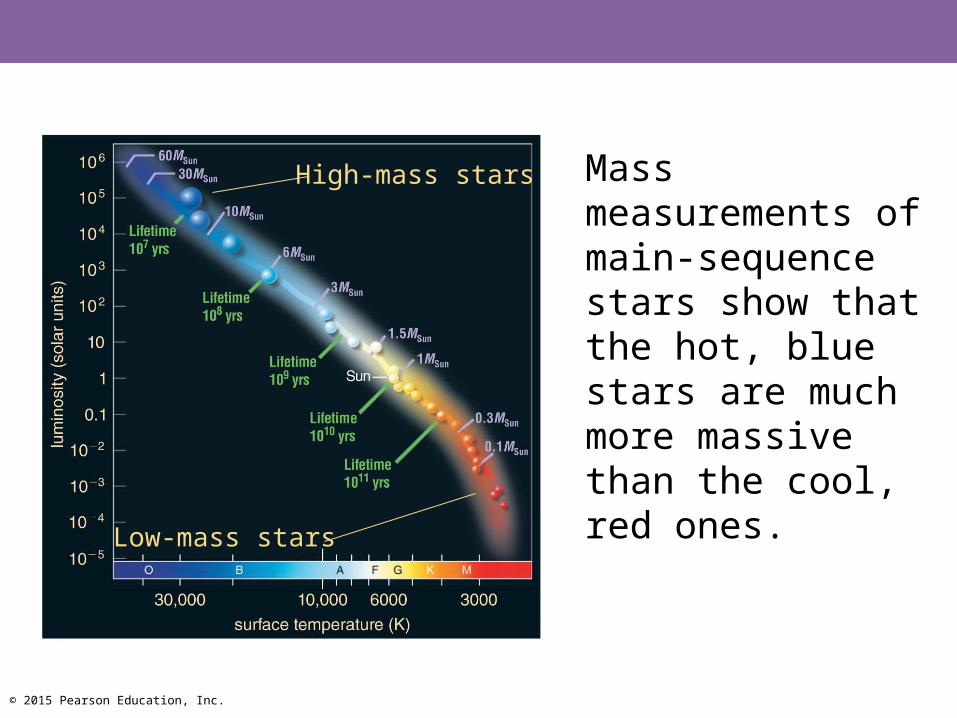
Mass measurements of main-sequence stars show that the hot, blue stars are much more massive than the cool, red ones.
High-mass stars
Low-mass stars
© 2015 Pearson Education, Inc.
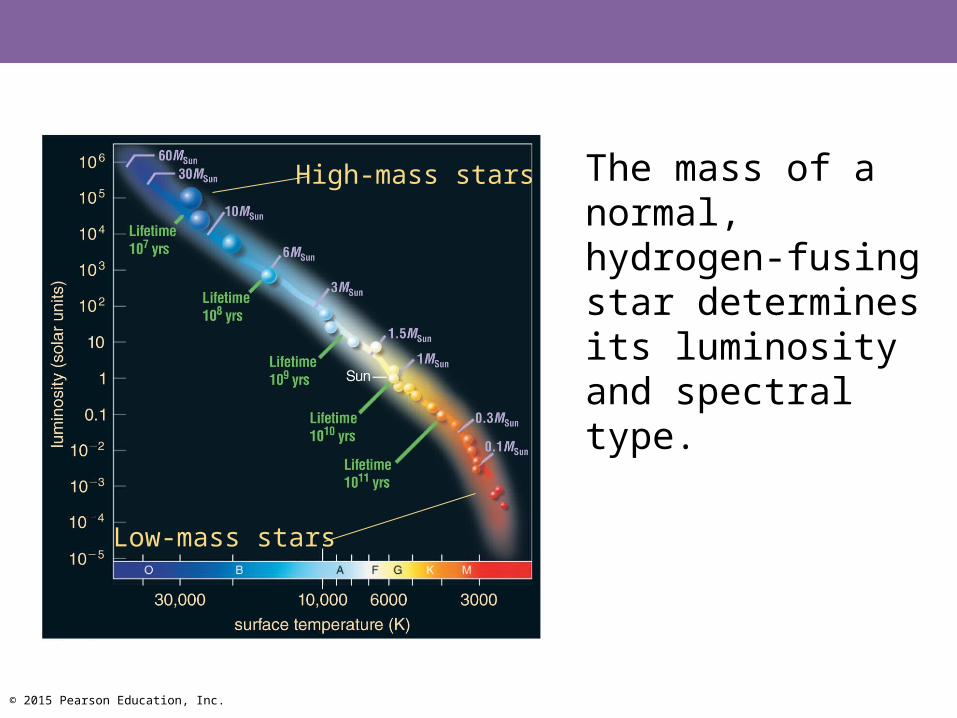
The mass of a normal, hydrogen-fusing star determines its luminosity and spectral type.
High-mass stars
Low-mass stars
© 2015 Pearson Education, Inc.
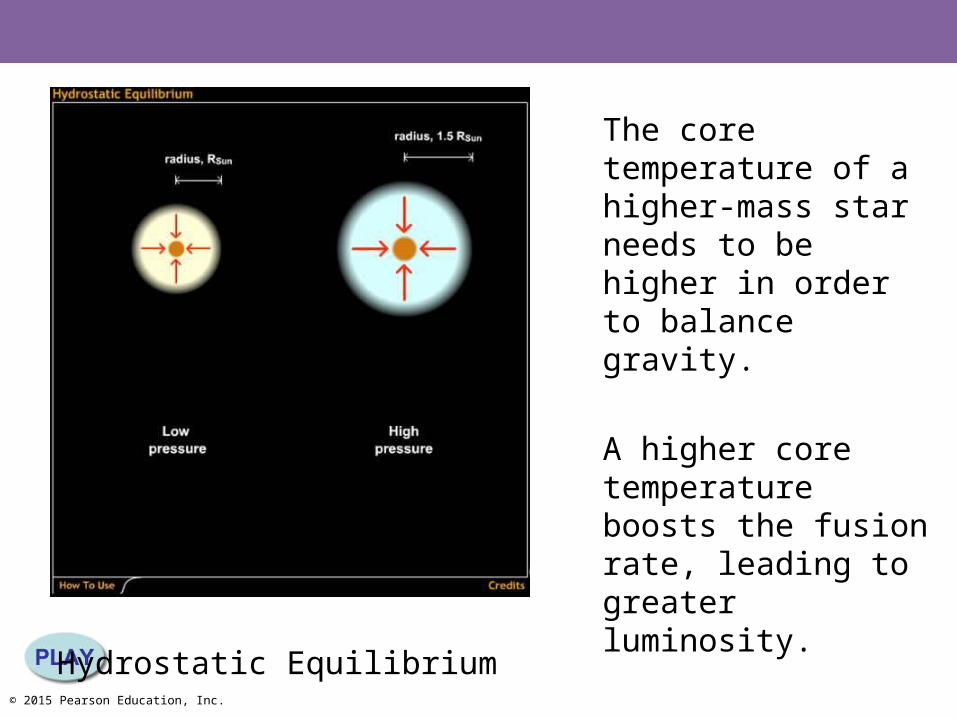
Hydrostatic Equilibrium
The core temperature of a higher-mass star needs to be higher in order to balance gravity.
A higher core temperature boosts the fusion rate, leading to greater luminosity.

© 2015 Pearson Education, Inc.
Stellar Properties Review
Luminosity: from brightness and distance
10-4LSun – 106LSun
Temperature: from color and spectral type
3000 K – 50,000 K
Mass: from period (p) and average separation (a) of binary-star orbit
0.08MSun – 100MSun
© 2015 Pearson Education, Inc.
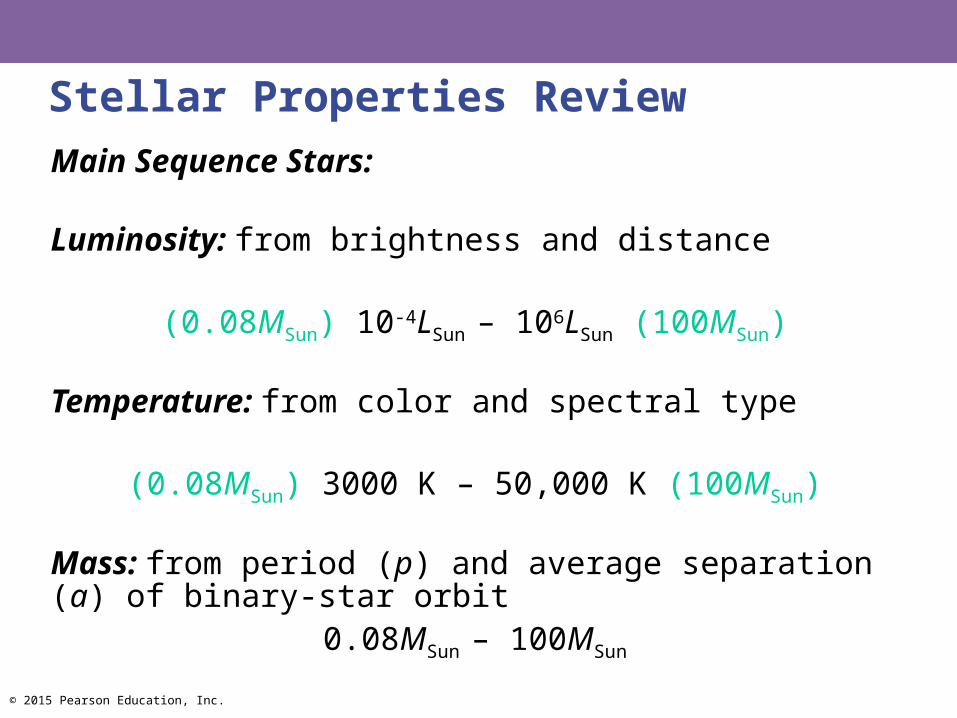
Stellar Properties Review
Main Sequence Stars:
Luminosity: from brightness and distance
(0.08MSun) 10-4LSun – 106LSun (100MSun)
Temperature: from color and spectral type
(0.08MSun) 3000 K – 50,000 K (100MSun)
Mass: from period (p) and average separation (a) of binary-star orbit
0.08MSun – 100MSun
© 2015 Pearson Education, Inc.
Mass and Lifetime
Sun's life expectancy: 10 billion years
(Note: age and life expectancy are different!)
© 2015 Pearson Education, Inc.
Mass and Lifetime
Sun's life expectancy: 10 billion years
Until core hydrogen(10% of total) is used up
© 2015 Pearson Education, Inc.
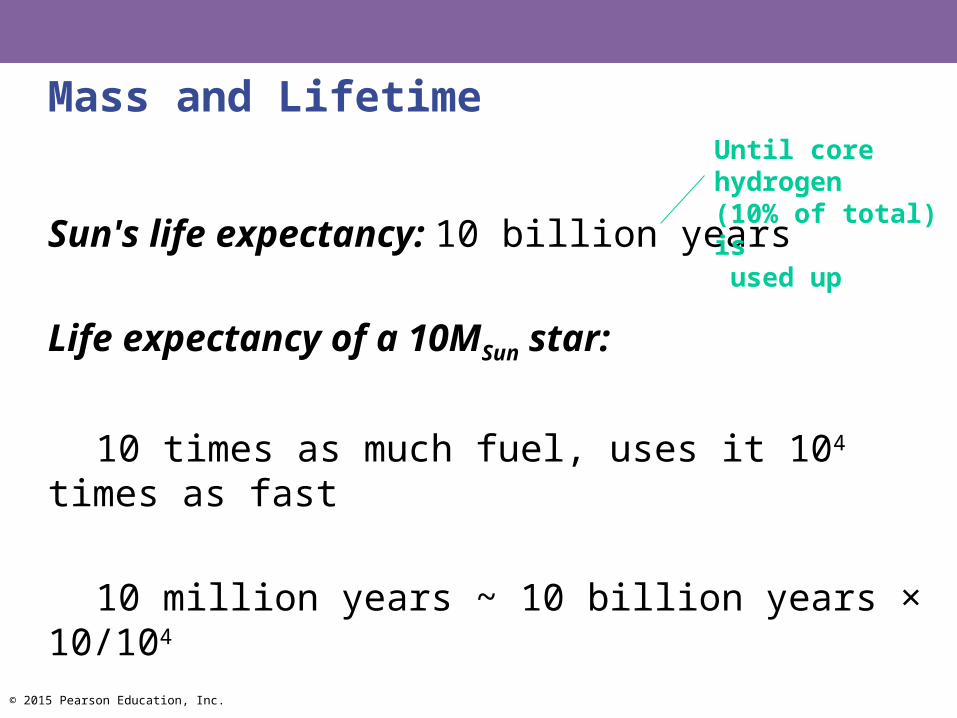
Mass and Lifetime
Sun's life expectancy: 10 billion years
Life expectancy of a 10MSun star:
10 times as much fuel, uses it 104 times as fast
10 million years ~ 10 billion years × 10/104
Until core hydrogen(10% of total) is used up
© 2015 Pearson Education, Inc.
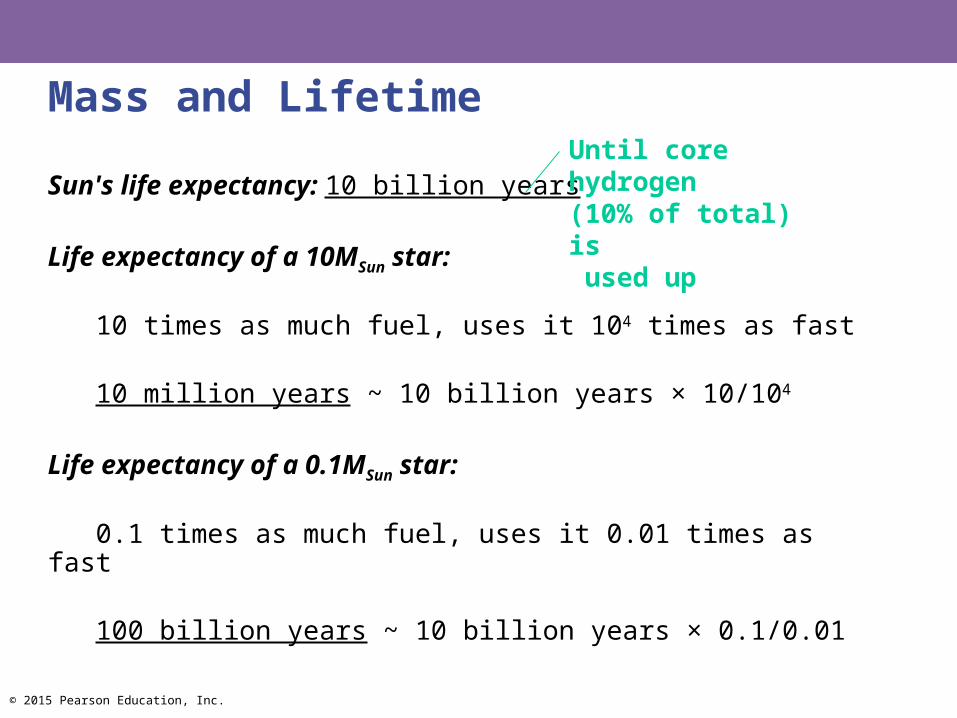
Mass and Lifetime
Sun's life expectancy: 10 billion years
Life expectancy of a 10MSun star:
10 times as much fuel, uses it 104 times as fast
10 million years ~ 10 billion years × 10/104
Life expectancy of a 0.1MSun star:
0.1 times as much fuel, uses it 0.01 times as fast
100 billion years ~ 10 billion years × 0.1/0.01
Until core hydrogen(10% of total) is used up
© 2015 Pearson Education, Inc.
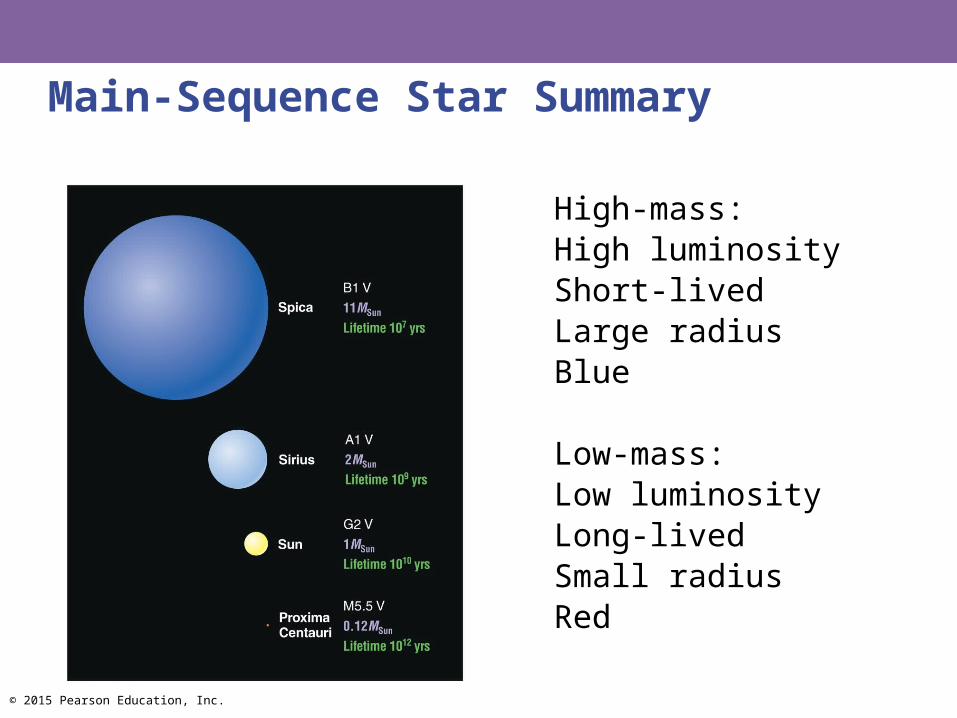
Main-Sequence Star Summary
High-mass:High luminosityShort-livedLarge radiusBlue
Low-mass:Low luminosityLong-livedSmall radiusRed
© 2015 Pearson Education, Inc.
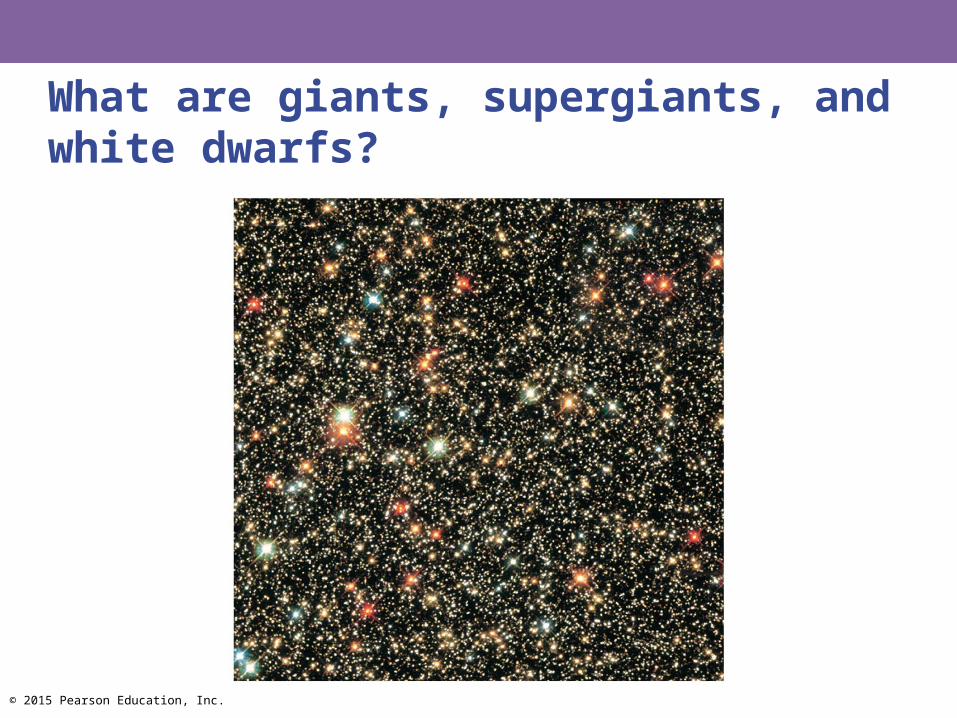
What are giants, supergiants, and white dwarfs?
© 2015 Pearson Education, Inc.
Off the Main Sequence
• Stellar properties depend on both mass and age: those that have finished fusing H to He in their cores are no longer on the main sequence.
• All stars become larger and redder after exhausting their core hydrogen: giants and supergiants.
• Most stars end up small and white after fusion has ceased: white dwarfs.
© 2015 Pearson Education, Inc.
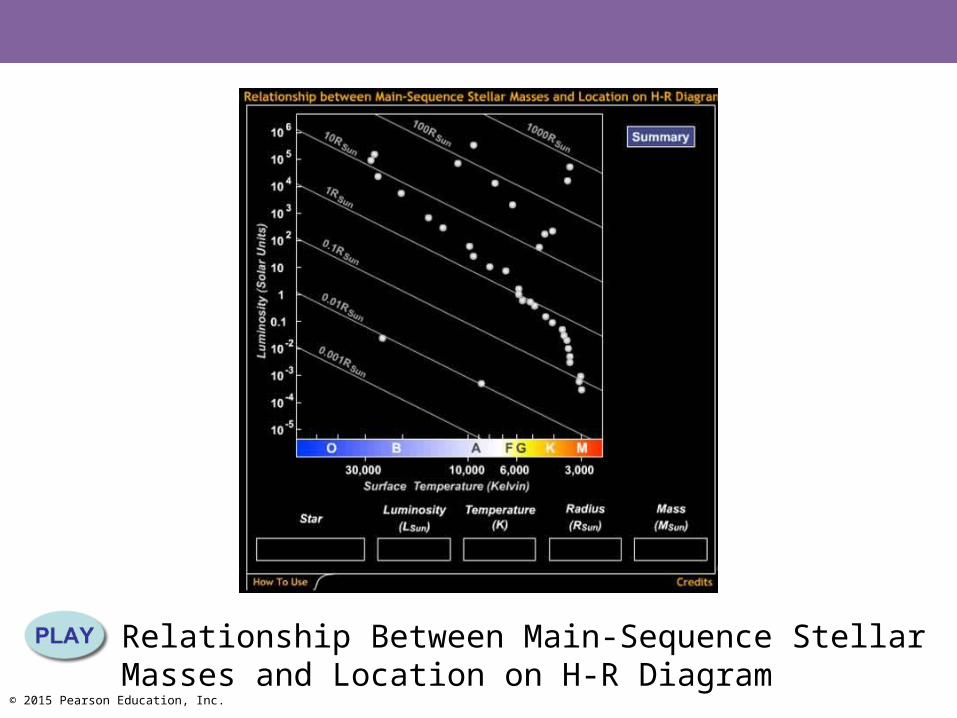
Relationship Between Main-Sequence Stellar Masses and Location on H-R Diagram
© 2015 Pearson Education, Inc.
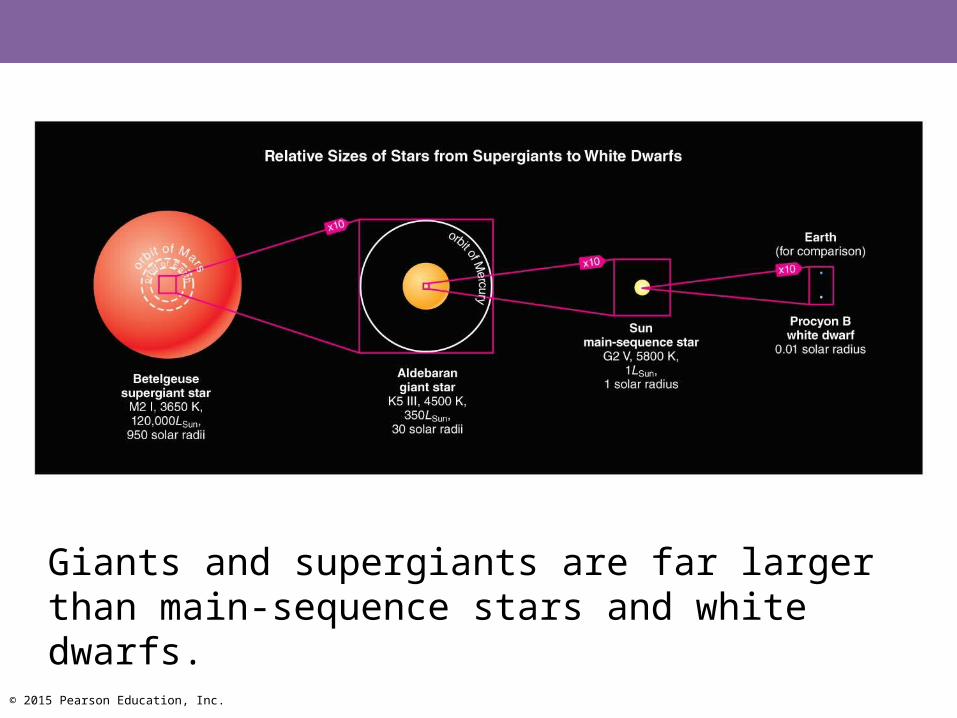
Giants and supergiants are far larger than main-sequence stars and white dwarfs.

© 2015 Pearson Education, Inc.
A
BC
D
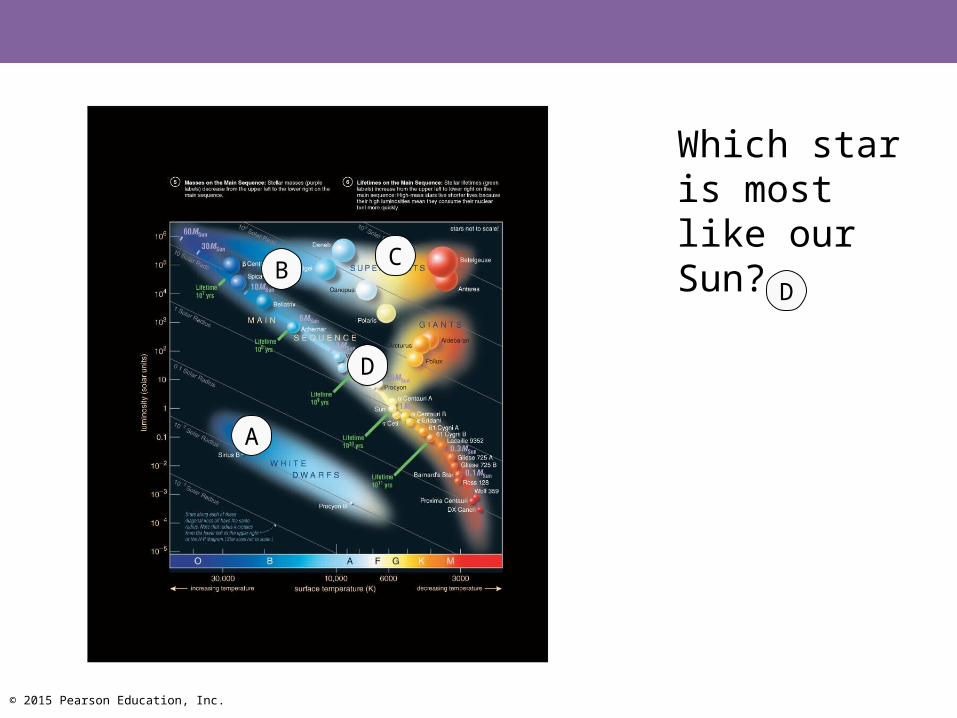
Which star is most like our Sun?
© 2015 Pearson Education, Inc.
A
BC
D
Which star is most like our Sun?
D
© 2015 Pearson Education, Inc.
A
BC
D
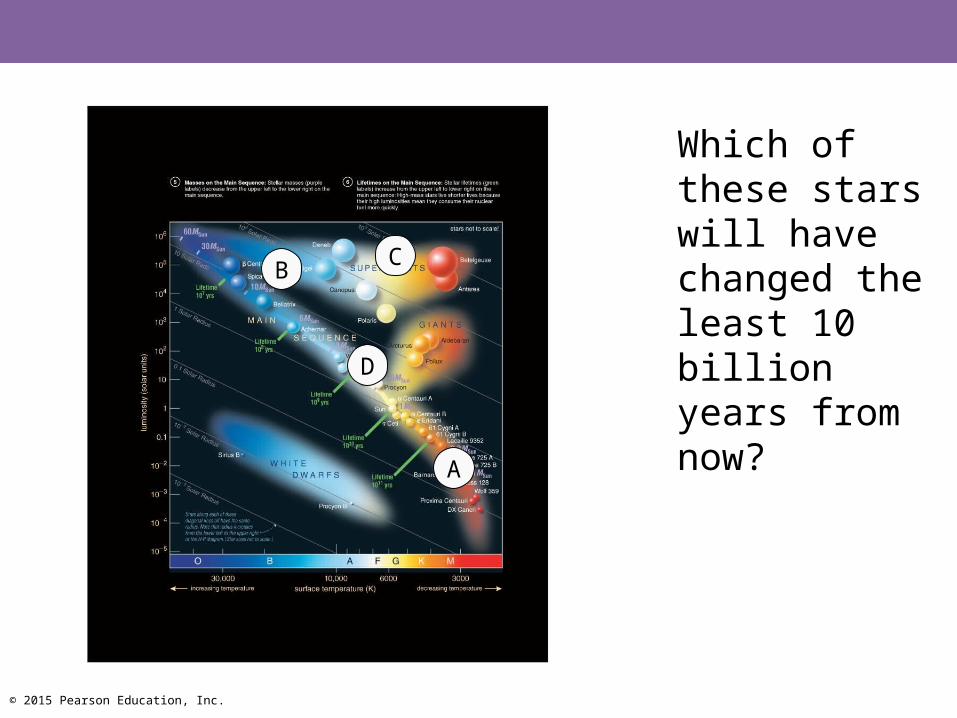
Which of these stars will have changed the least 10 billion years from now?
© 2015 Pearson Education, Inc.
A
BC
D
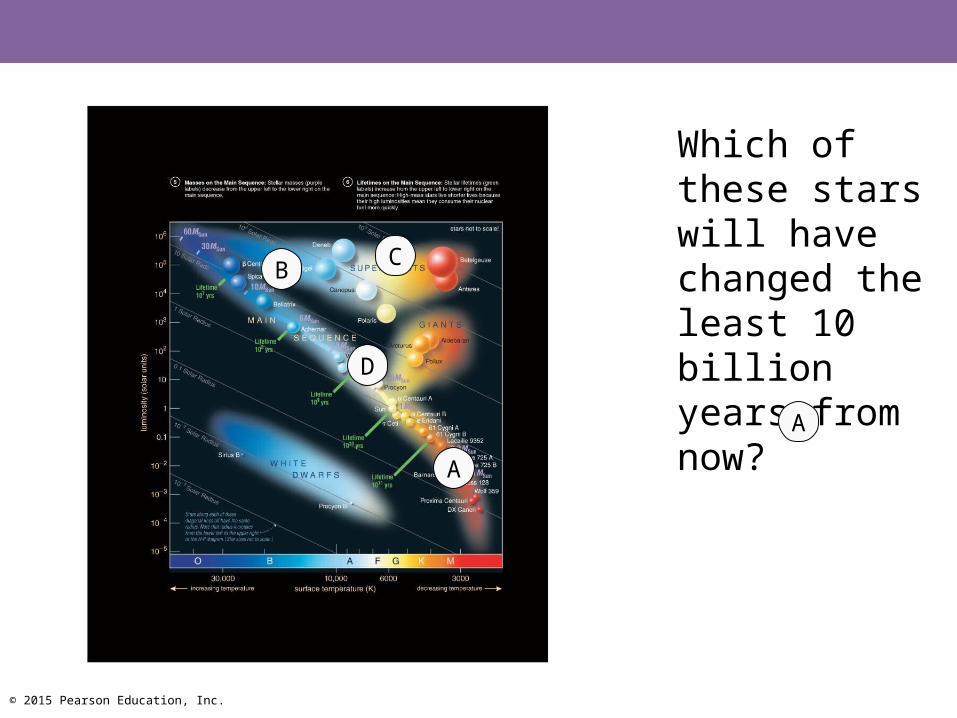
Which of these stars will have changed the least 10 billion years from now?
A
© 2015 Pearson Education, Inc.
12.3 Star Clusters
Our goals for learning:• What are the two types of star clusters?• How do we measure the age of a star cluster?
© 2015 Pearson Education, Inc.
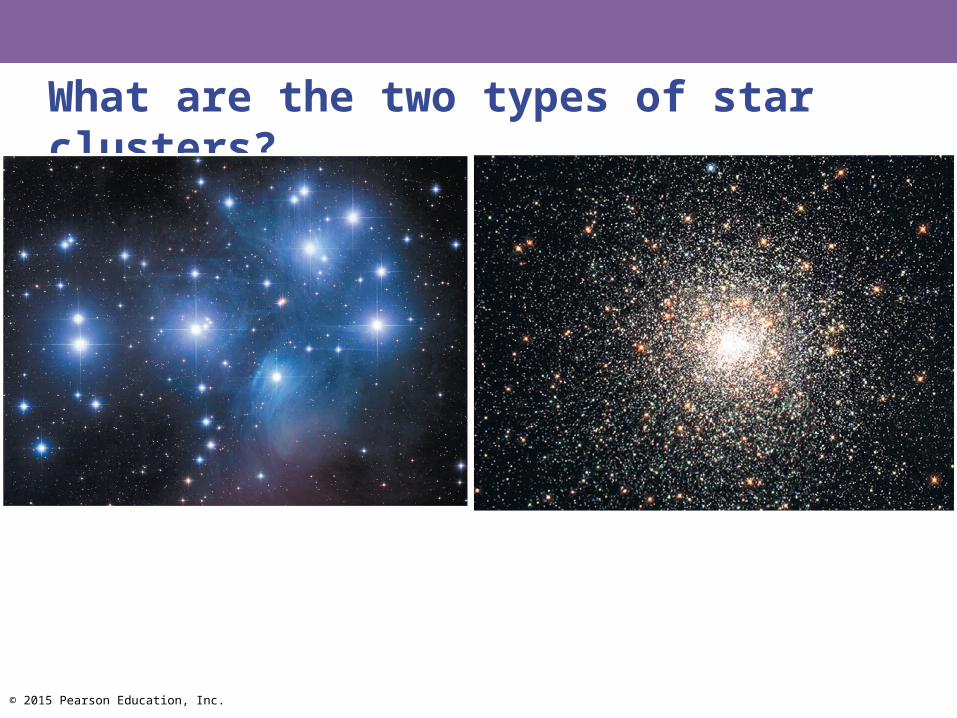
What are the two types of star clusters?
© 2015 Pearson Education, Inc.
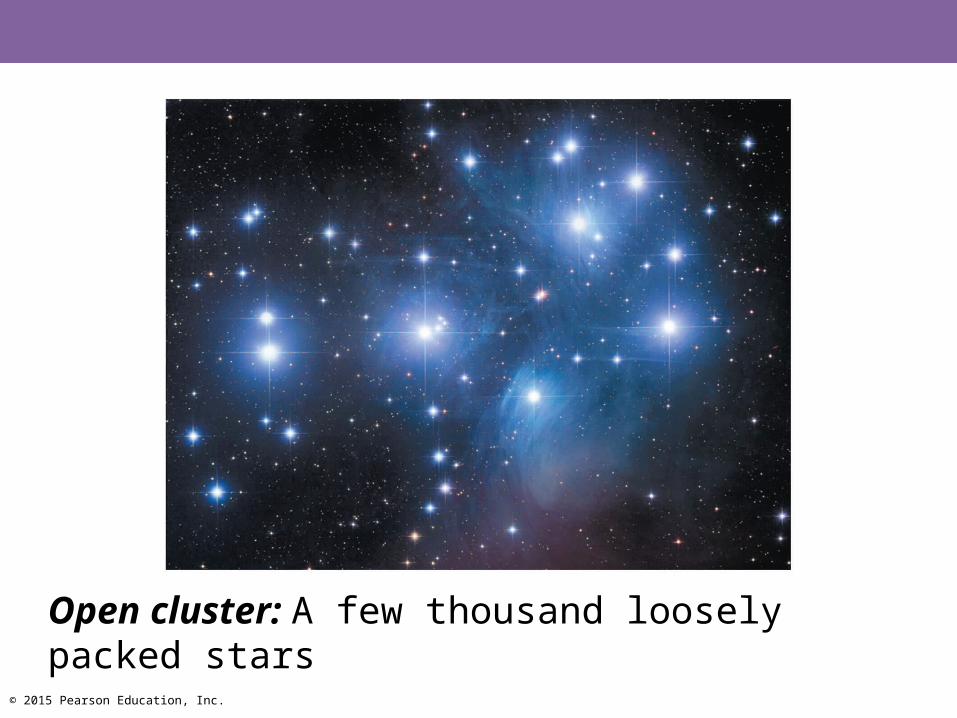
Open cluster: A few thousand loosely packed stars
© 2015 Pearson Education, Inc.
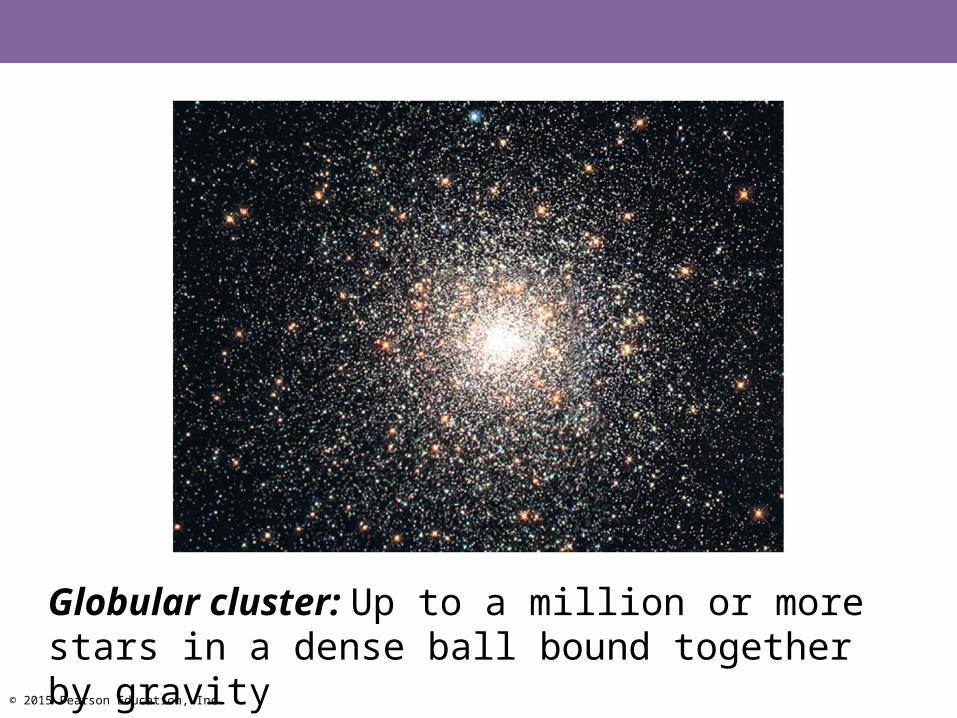
Globular cluster: Up to a million or more stars in a dense ball bound together by gravity
© 2015 Pearson Education, Inc.
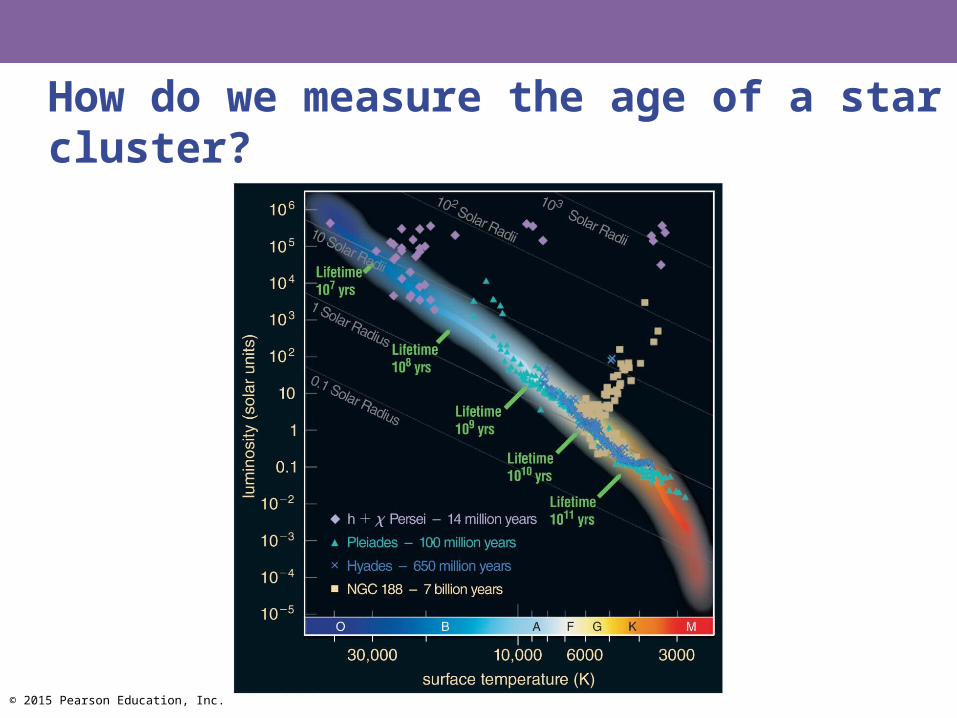
How do we measure the age of a star cluster?
© 2015 Pearson Education, Inc.
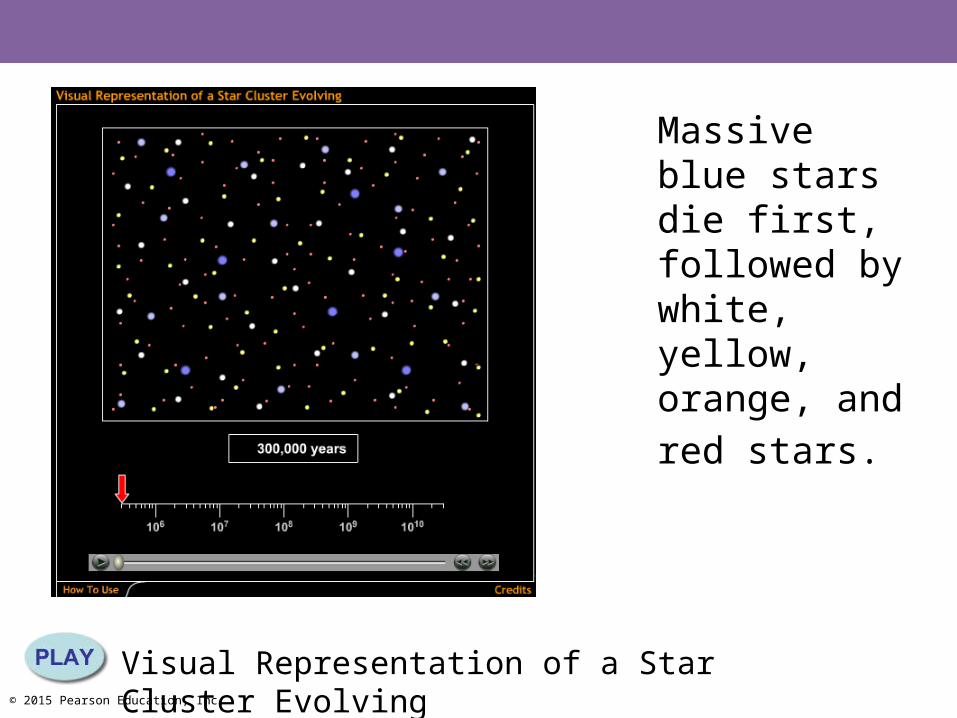
Visual Representation of a Star Cluster Evolving
Massive blue stars die first, followed by white, yellow, orange, and
red stars.
© 2015 Pearson Education, Inc.
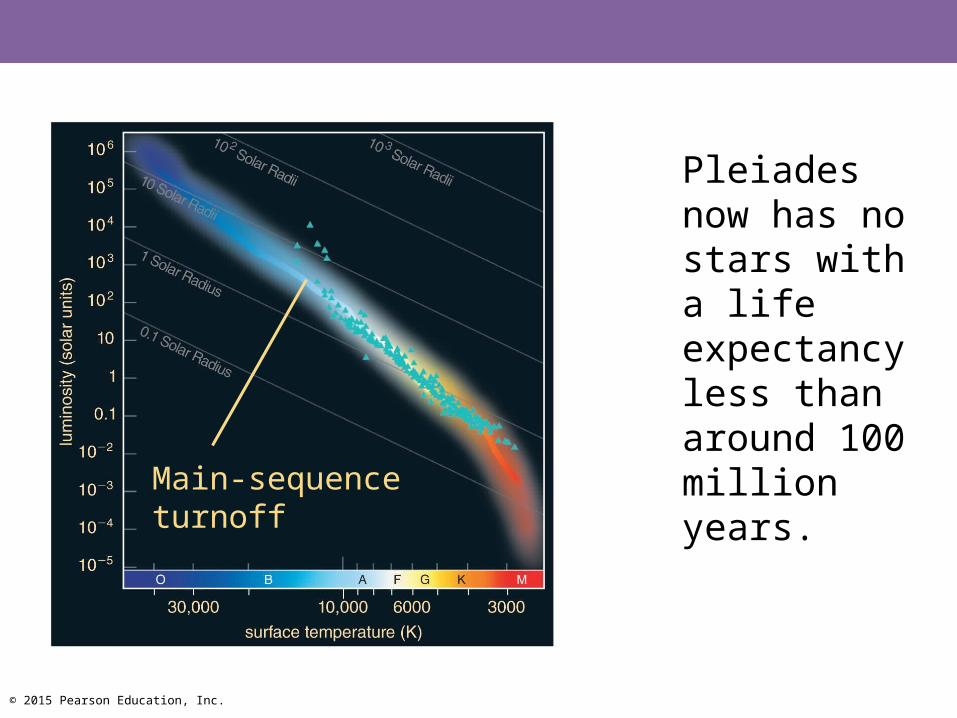
Pleiades now has no stars with a life expectancy less than around 100 million years.
Main-sequenceturnoff
© 2015 Pearson Education, Inc.
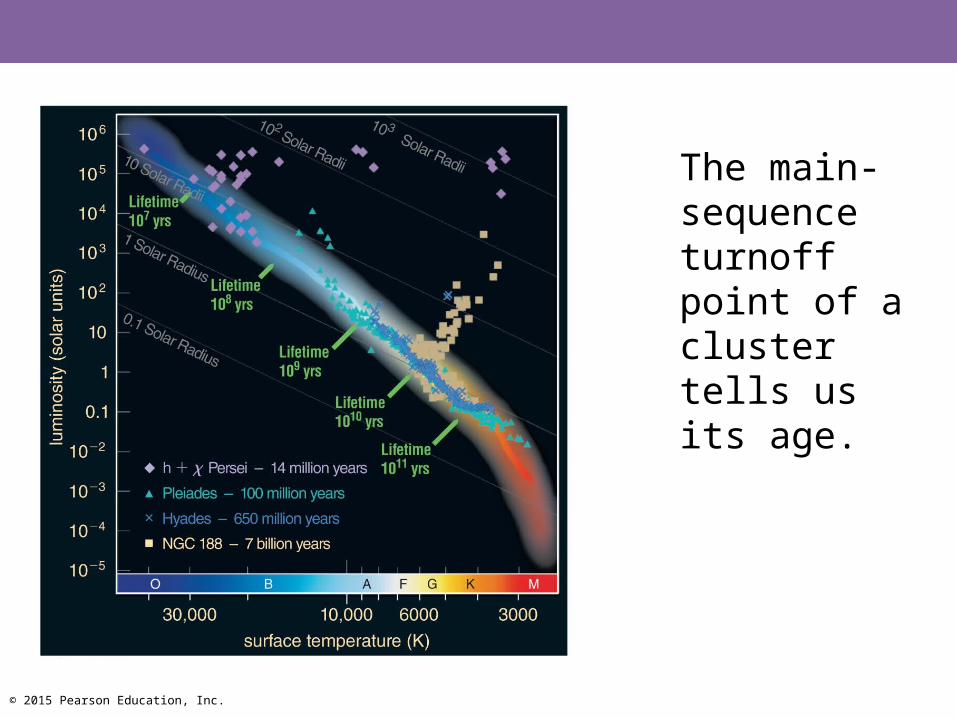
The main-sequence turnoff point of a cluster tells us its age.

© 2015 Pearson Education, Inc.
To determine accurate ages, we compare models of stellar evolution to the cluster data.
Using the H-R Diagram to Determine the Age of a Star Cluster
© 2015 Pearson Education, Inc.
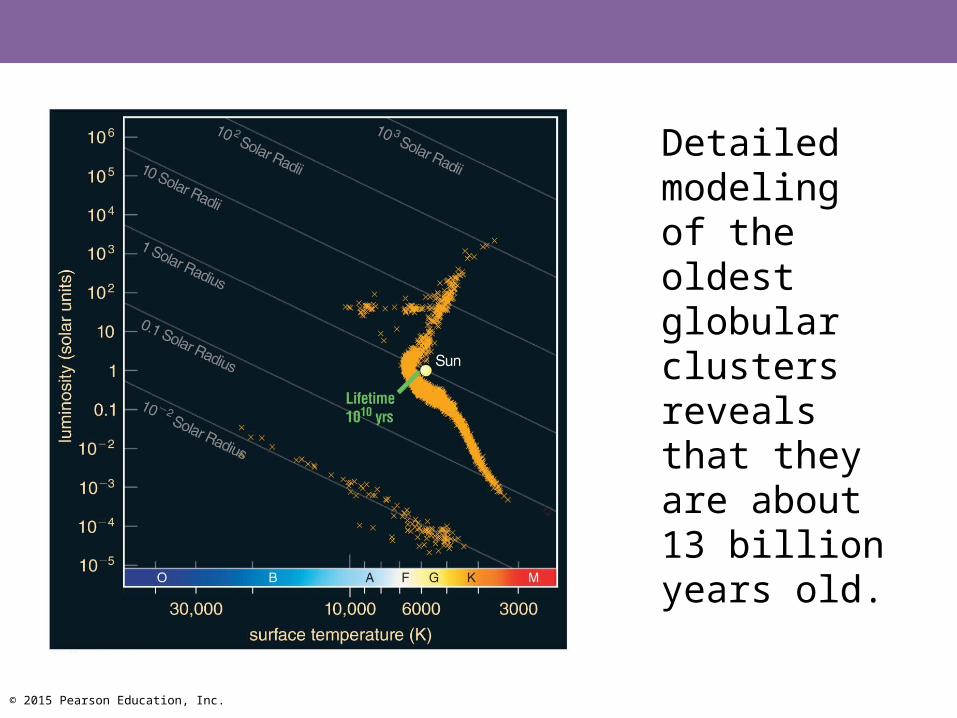
Detailed modeling of the oldest globular clusters reveals that they are about 13 billion years old.