Embed Size (px)
Citation preview
Nina Geurds and Pieta van der MolenSOURCES OF INNOVATION
lecturer: A. Reindersdate: November 4th 2011
University of Twentestudents: Geurds s1246445 & vd Molen: s0088145
3Sources of Innovation Nov 2011 N. Geurds and P. van der Molen
Table of Contents
IntroductionAbstract
Chapter 1: Current situation & strategyChapter 2: Design goal & RequirementsChapter 3: Concept DevelopmentChapter 4: Final DesignChapter 5: Evaluation and futureChapter 6: Conclusions & recommendations
ReferencesAppendices
45
61213203137
3940
4Sources of Innovation Nov 2011 N. Geurds and P. van der Molen
Introduction! e master course Sources of Innovation of the University of Twente provides insight in innovation processes regarding emerging technologies. ! is report is the result of the application of innovation theories and technologies which are explained in the lectures provided.
Client
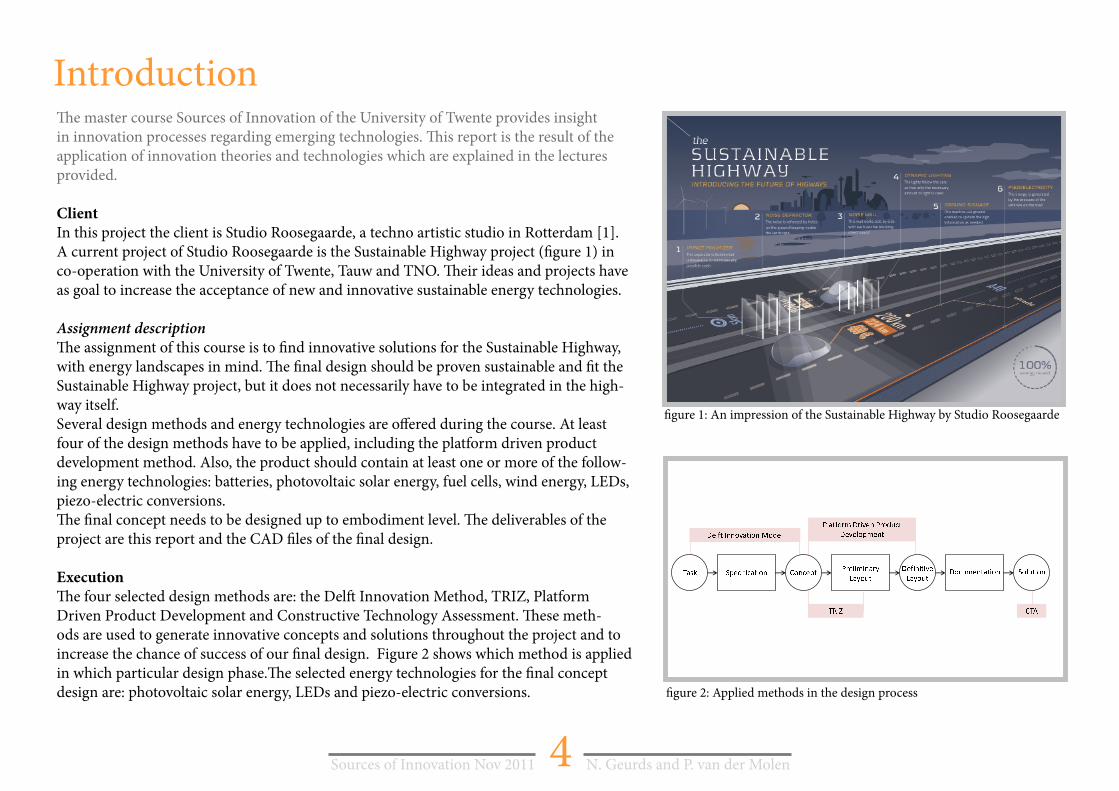
In this project the client is Studio Roosegaarde, a techno artistic studio in Rotterdam [1].A current project of Studio Roosegaarde is the Sustainable Highway project (" gure 1) in co-operation with the University of Twente, Tauw and TNO. ! eir ideas and projects have as goal to increase the acceptance of new and innovative sustainable energy technologies.
Assignment description
! e assignment of this course is to " nd innovative solutions for the Sustainable Highway, with energy landscapes in mind. ! e " nal design should be proven sustainable and " t the Sustainable Highway project, but it does not necessarily have to be integrated in the high-way itself.Several design methods and energy technologies are o# ered during the course. At least four of the design methods have to be applied, including the platform driven product development method. Also, the product should contain at least one or more of the follow-ing energy technologies: batteries, photovoltaic solar energy, fuel cells, wind energy, LEDs, piezo-electric conversions.! e " nal concept needs to be designed up to embodiment level. ! e deliverables of the project are this report and the CAD " les of the " nal design.
Execution
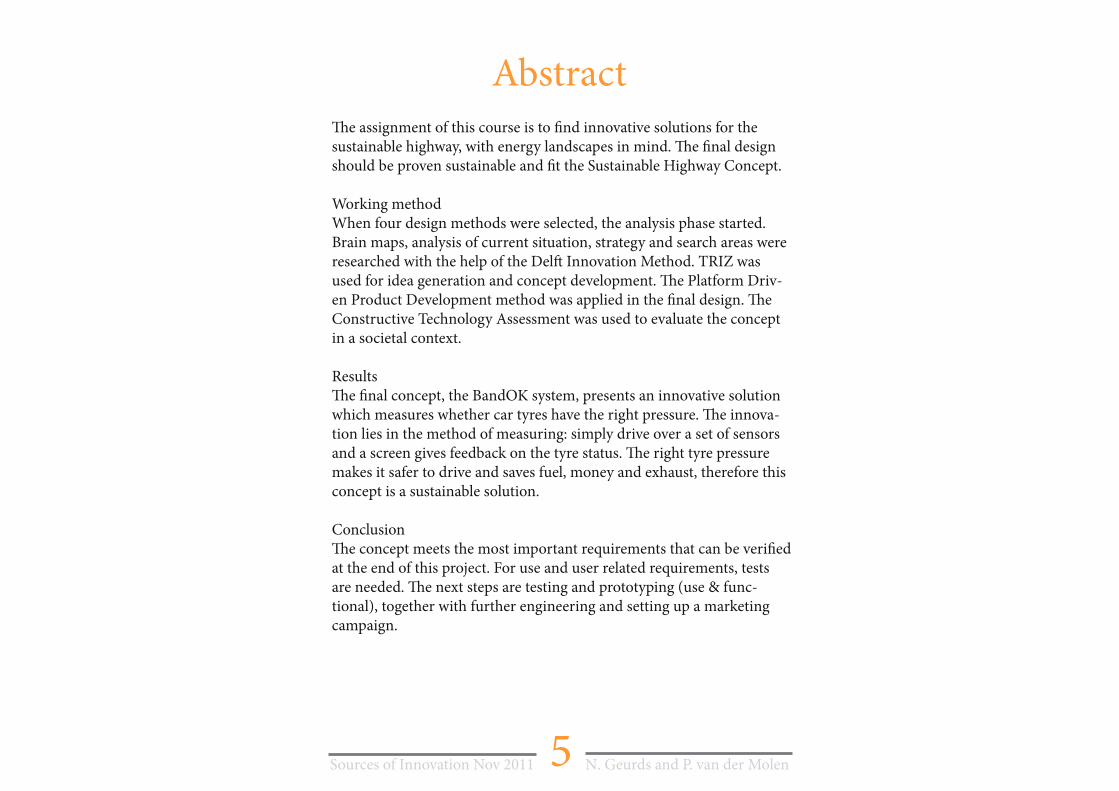
! e four selected design methods are: the Del$ Innovation Method, TRIZ, Platform Driven Product Development and Constructive Technology Assessment. ! ese meth-ods are used to generate innovative concepts and solutions throughout the project and to increase the chance of success of our " nal design. Figure 2 shows which method is applied in which particular design phase.! e selected energy technologies for the " nal concept design are: photovoltaic solar energy, LEDs and piezo-electric conversions.
" gure 1: An impression of the Sustainable Highway by Studio Roosegaarde�� � � �� � � � � � � �� � � � � �� �� � � � � � � � � �� � �� � � � � � � �� �� � �� � �� � � � � � � � � � �� � � �� ��� � �� �� � � � � ! �� " � #� � � � � � � � �� �� � � �� � $ � � � �� � �� � � � � � % & ' � (
" gure 2: Applied methods in the design process
5Sources of Innovation Nov 2011 N. Geurds and P. van der Molen
Abstract! e assignment of this course is to " nd innovative solutions for the sustainable highway, with energy landscapes in mind. ! e " nal design should be proven sustainable and " t the Sustainable Highway Concept.
Working methodWhen four design methods were selected, the analysis phase started. Brain maps, analysis of current situation, strategy and search areas were researched with the help of the Del# Innovation Method. TRIZ was used for idea generation and concept development. ! e Platform Driv-en Product Development method was applied in the " nal design. ! e Constructive Technology Assessment was used to evaluate the concept in a societal context.
Results! e " nal concept, the BandOK system, presents an innovative solution which measures whether car tyres have the right pressure. ! e innova-tion lies in the method of measuring: simply drive over a set of sensors and a screen gives feedback on the tyre status. ! e right tyre pressure makes it safer to drive and saves fuel, money and exhaust, therefore this concept is a sustainable solution.
Conclusion! e concept meets the most important requirements that can be veri" ed at the end of this project. For use and user related requirements, tests are needed. ! e next steps are testing and prototyping (use & func-tional), together with further engineering and setting up a marketing campaign.
6Sources of Innovation Nov 2011 N. Geurds and P. van der Molen
Chapter 1: Current situation & strategy
In this chapter the current situation of Dutch highways and a possible sustainable strategy are discussed. ! e " rst and second phases of the Del# Innovation Model (DIM) are used to get insight in the sustainable highway theme.
1.1 Problem analysis & problem statement
In this section the context of the project is de" ned. First several context mind maps are shown followed by several de" nitions in regard to this project. ! ey form the framework for the project.
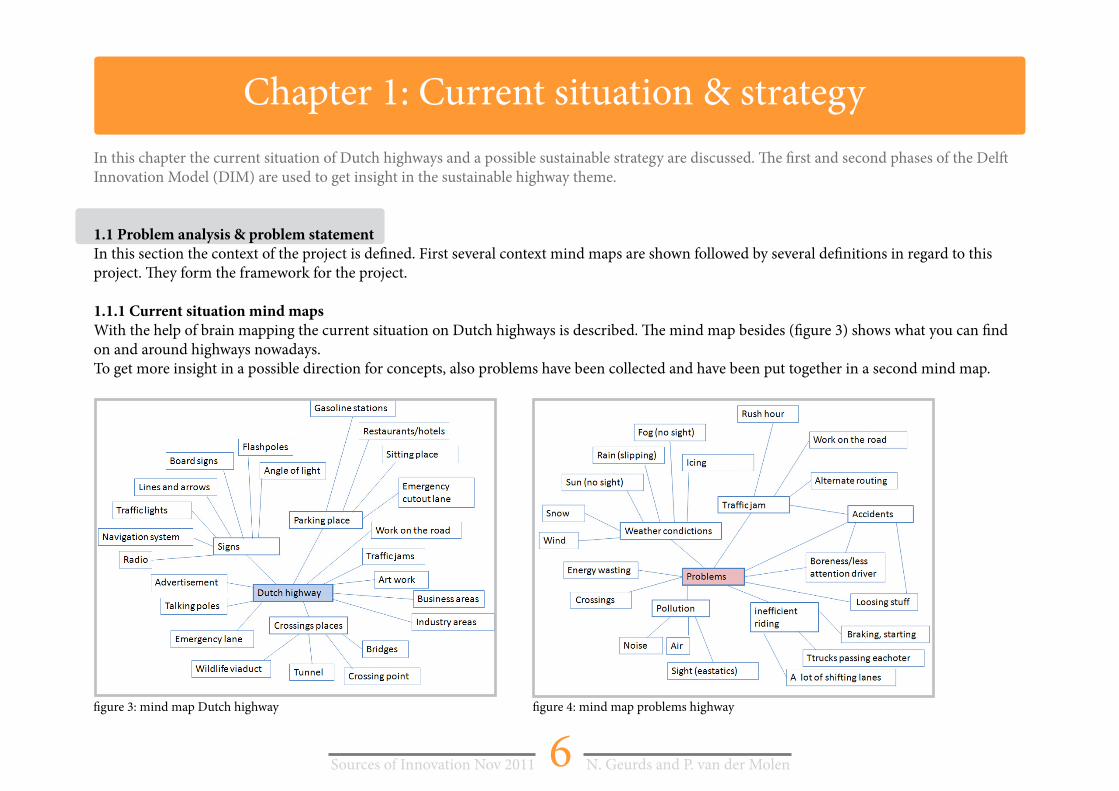
1.1.1 Current situation mind maps
With the help of brain mapping the current situation on Dutch highways is described. ! e mind map besides (" gure 3) shows what you can " nd on and around highways nowadays. To get more insight in a possible direction for concepts, also problems have been collected and have been put together in a second mind map.
" gure 3: mind map Dutch highway " gure 4: mind map problems highway
7Sources of Innovation Nov 2011 N. Geurds and P. van der Molen
1.1.2 De� nitions
! e de" nitions of Sustainable Highway, innovation, en-ergy landscape and energy neutral are important for this project, but can also be confusing. ! erefore we com-bined di# erent existing explanations and our vision on the project. In this section they are explained.
To de" ne Sustainable Highway, the term is split up in two parts, namely sustainable and highway.Sustainable means that the current situation is improved, or is less bad. Harmful e# ects are reduced, but also energy neutral products are included in this de" nition. John Elk-ington, a consultant in sustainable development, de" ned sustainable in three words: People, Planet, Pro" t. Ac-cording to him these three elements have to be balanced: when the combination is not harmonious, the other ele-ments su# er. During the world meeting about sustainable development in 2002, the P for Pro" t, became the P for Prosperity. ! is way also societal pro" t is included.[2]
According to the Longman Dictionary of Contemporary English [3] a highway is “A broad main road that joins one town to another”. Wikipedia o# ers a more general description: “A highway is a major public road connection between two or more destinations”. [4]
Combining both de" nitions on sustainable and highway resulted in the statement shown on this page.
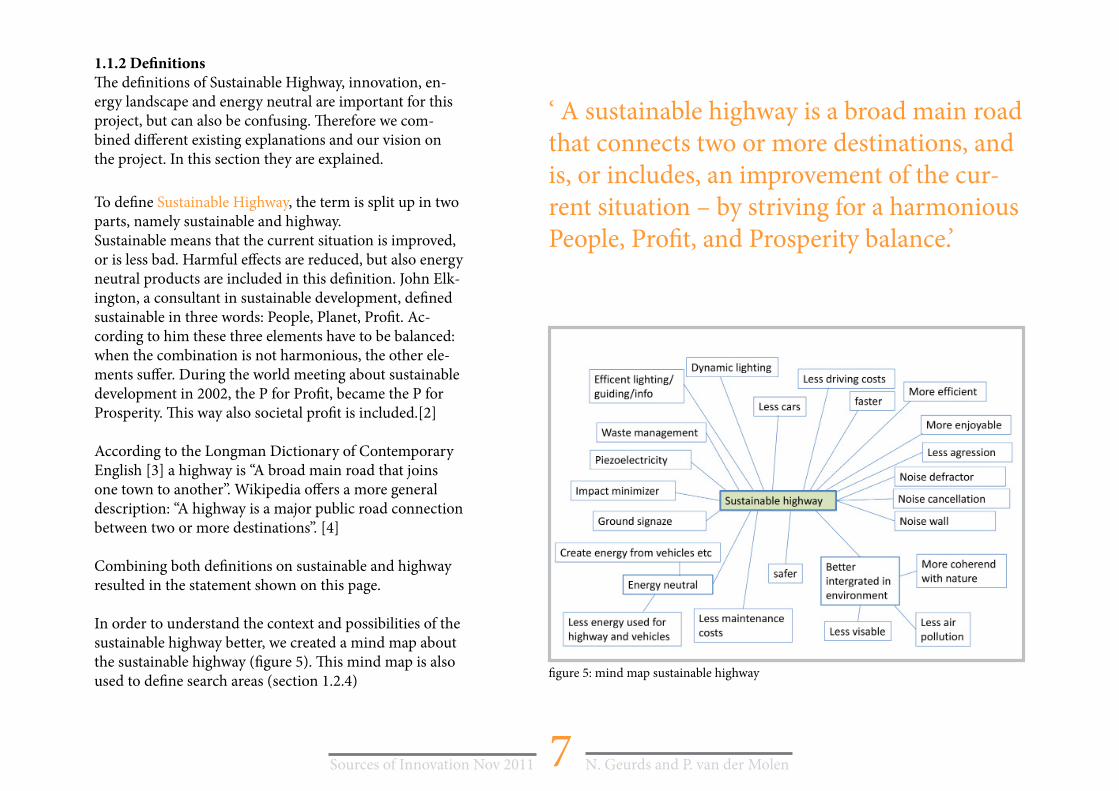
In order to understand the context and possibilities of the sustainable highway better, we created a mind map about the sustainable highway (" gure 5). ! is mind map is also used to de" ne search areas (section 1.2.4)
‘ A sustainable highway is a broad main road that connects two or more destinations, and is, or includes, an improvement of the cur-rent situation – by striving for a harmonious People, Pro" t, and Prosperity balance.’
" gure 5: mind map sustainable highway
8Sources of Innovation Nov 2011 N. Geurds and P. van der Molen
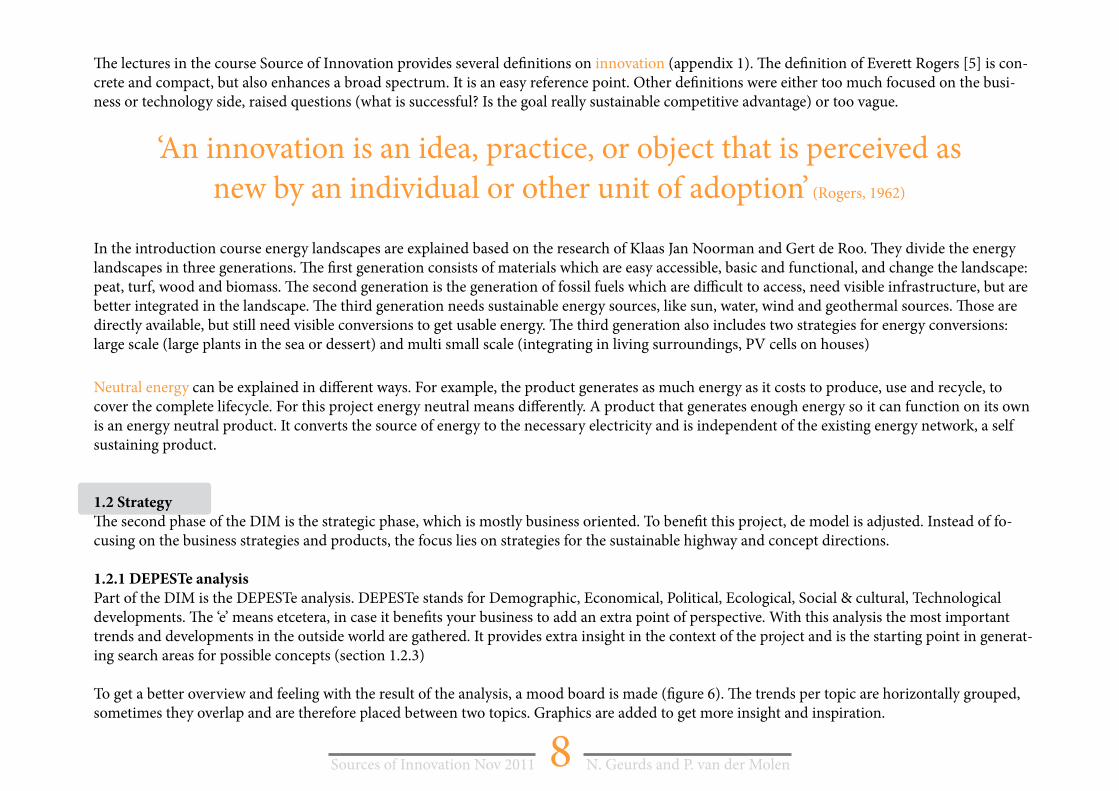
! e lectures in the course Source of Innovation provides several de" nitions on innovation (appendix 1). ! e de" nition of Everett Rogers [5] is con-crete and compact, but also enhances a broad spectrum. It is an easy reference point. Other de" nitions were either too much focused on the busi-ness or technology side, raised questions (what is successful? Is the goal really sustainable competitive advantage) or too vague.
In the introduction course energy landscapes are explained based on the research of Klaas Jan Noorman and Gert de Roo. ! ey divide the energy landscapes in three generations. ! e " rst generation consists of materials which are easy accessible, basic and functional, and change the landscape: peat, turf, wood and biomass. ! e second generation is the generation of fossil fuels which are di# cult to access, need visible infrastructure, but are better integrated in the landscape. ! e third generation needs sustainable energy sources, like sun, water, wind and geothermal sources. ! ose are directly available, but still need visible conversions to get usable energy. ! e third generation also includes two strategies for energy conversions: large scale (large plants in the sea or dessert) and multi small scale (integrating in living surroundings, PV cells on houses)
Neutral energy can be explained in di$ erent ways. For example, the product generates as much energy as it costs to produce, use and recycle, to cover the complete lifecycle. For this project energy neutral means di$ erently. A product that generates enough energy so it can function on its own is an energy neutral product. It converts the source of energy to the necessary electricity and is independent of the existing energy network, a self sustaining product.
1.2 Strategy
! e second phase of the DIM is the strategic phase, which is mostly business oriented. To bene" t this project, de model is adjusted. Instead of fo-cusing on the business strategies and products, the focus lies on strategies for the sustainable highway and concept directions.
1.2.1 DEPESTe analysis
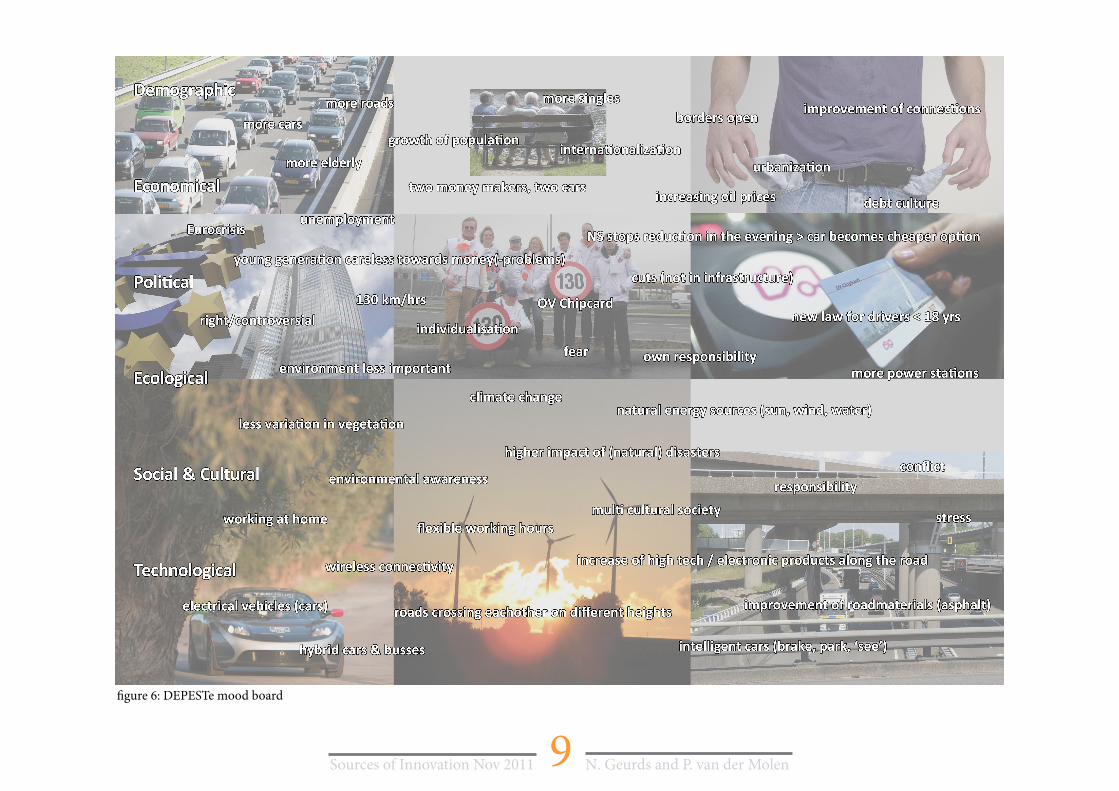
Part of the DIM is the DEPESTe analysis. DEPESTe stands for Demographic, Economical, Political, Ecological, Social & cultural, Technological developments. ! e ‘e’ means etcetera, in case it bene" ts your business to add an extra point of perspective. With this analysis the most important trends and developments in the outside world are gathered. It provides extra insight in the context of the project and is the starting point in generat-ing search areas for possible concepts (section 1.2.3)
To get a better overview and feeling with the result of the analysis, a mood board is made (" gure 6). ! e trends per topic are horizontally grouped, sometimes they overlap and are therefore placed between two topics. Graphics are added to get more insight and inspiration.
‘An innovation is an idea, practice, or object that is perceived as
new by an individual or other unit of adoption’ (Rogers, 1962)
9Sources of Innovation Nov 2011 N. Geurds and P. van der Molen
! gure 6: DEPESTe mood board
10Sources of Innovation Nov 2011 N. Geurds and P. van der Molen
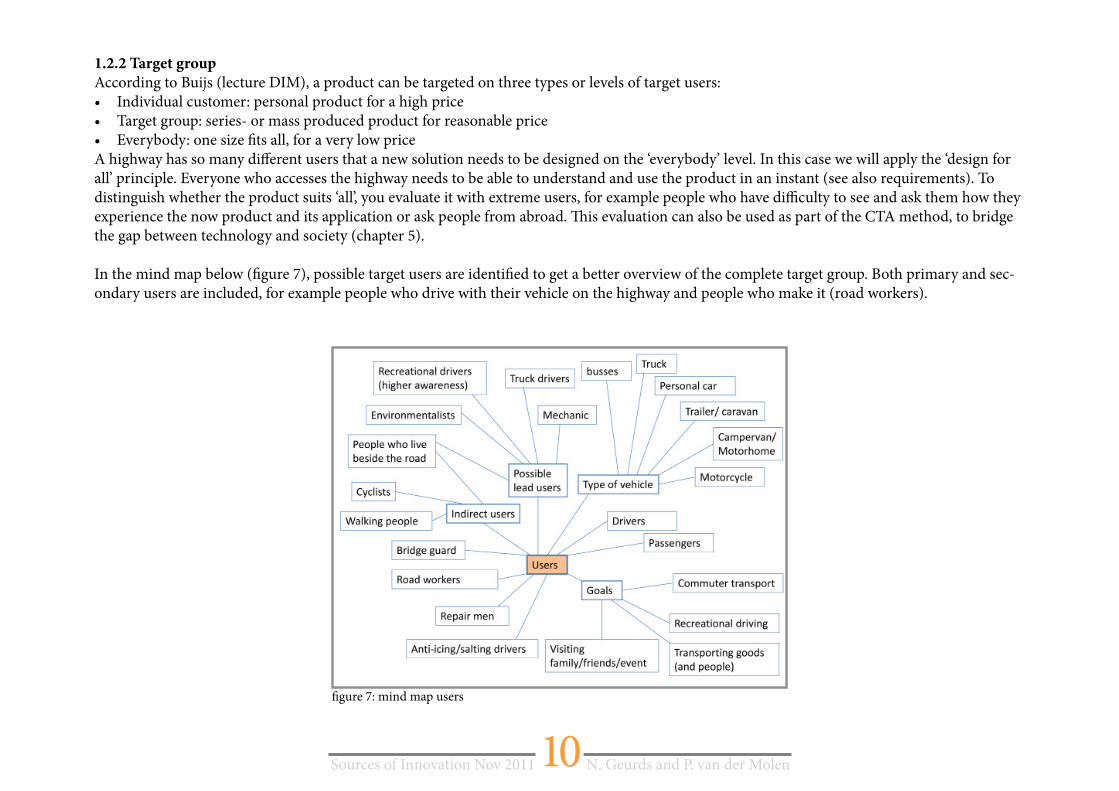
1.2.2 Target group
According to Buijs (lecture DIM), a product can be targeted on three types or levels of target users:• Individual customer: personal product for a high price• Target group: series- or mass produced product for reasonable price• Everybody: one size ! ts all, for a very low priceA highway has so many di" erent users that a new solution needs to be designed on the ‘everybody’ level. In this case we will apply the ‘design for all’ principle. Everyone who accesses the highway needs to be able to understand and use the product in an instant (see also requirements). To distinguish whether the product suits ‘all’, you evaluate it with extreme users, for example people who have di# culty to see and ask them how they experience the now product and its application or ask people from abroad. $ is evaluation can also be used as part of the CTA method, to bridge the gap between technology and society (chapter 5).
In the mind map below (! gure 7), possible target users are identi! ed to get a better overview of the complete target group. Both primary and sec-ondary users are included, for example people who drive with their vehicle on the highway and people who make it (road workers).
! gure 7: mind map users
11Sources of Innovation Nov 2011 N. Geurds and P. van der Molen
1.2.3 Search areas
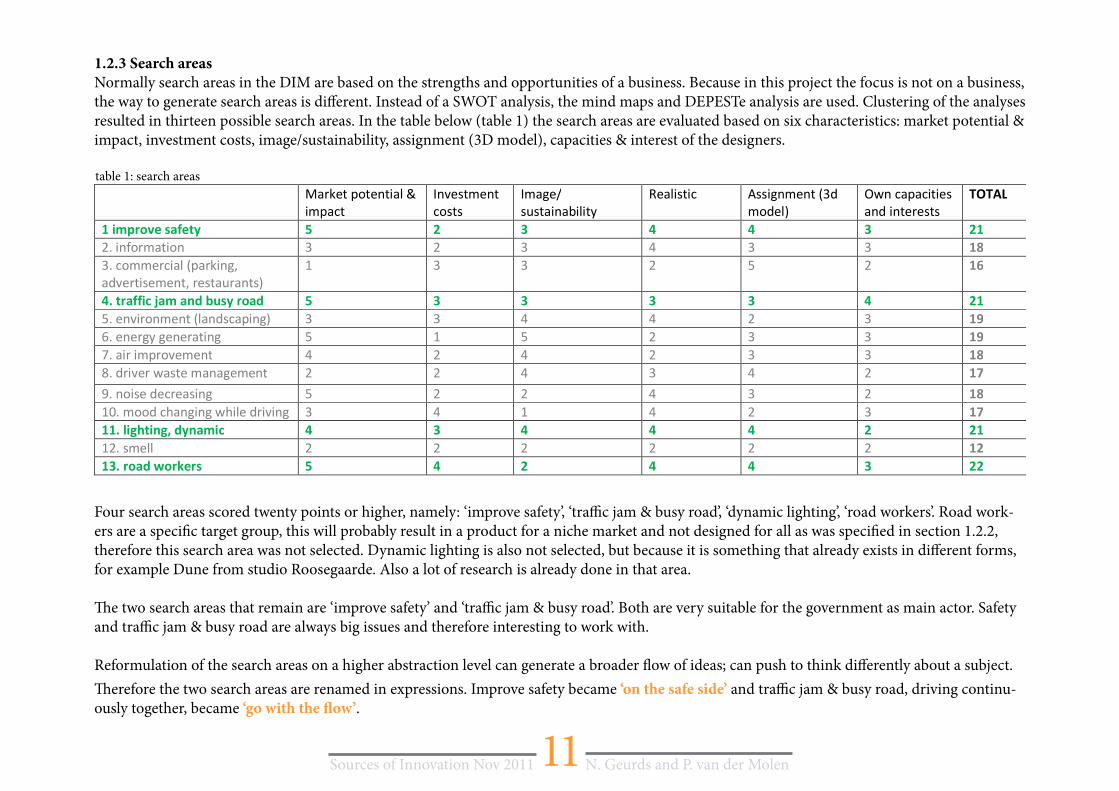
Normally search areas in the DIM are based on the strengths and opportunities of a business. Because in this project the focus is not on a business, the way to generate search areas is di! erent. Instead of a SWOT analysis, the mind maps and DEPESTe analysis are used. Clustering of the analyses resulted in thirteen possible search areas. In the table below (table 1) the search areas are evaluated based on six characteristics: market potential & impact, investment costs, image/sustainability, assignment (3D model), capacities & interest of the designers.
� ��������������� �
�������
���������
�����
�������
��������������
���������� �������������
������
��������������
������������
������
������ ���� ��� �� �� �� �� �� �� ���
!��"������ �� � �� #� �� �� ���
�!������������������$�
������������$�������������
%� �� �� � &� � ���
��������������������������� �� �� �� �� �� �� ���
&!��������������������� �� �� #� #� � �� � �
'!���������������� &� %� &� � �� �� � �
(!��������������� #� � #� � �� �� ���
)!����������������������� � � #� �� #� � �!�
*!��������������� &� � � #� �� � ���
%+!�����,������,����������� �� #� %� #� � �� �!�
����"�#$���#%��������� �� �� �� �� �� �� ���
% !������� � � � � � � ���
��������&�' �� �� �� �� �� �� �� ���
�
�Four search areas scored twenty points or higher, namely: ‘improve safety’, ‘tra" c jam & busy road’, ‘dynamic lighting’, ‘road workers’. Road work-ers are a speci# c target group, this will probably result in a product for a niche market and not designed for all as was speci# ed in section 1.2.2, therefore this search area was not selected. Dynamic lighting is also not selected, but because it is something that already exists in di! erent forms, for example Dune from studio Roosegaarde. Also a lot of research is already done in that area.
$ e two search areas that remain are ‘improve safety’ and ‘tra" c jam & busy road’. Both are very suitable for the government as main actor. Safety and tra" c jam & busy road are always big issues and therefore interesting to work with.
Reformulation of the search areas on a higher abstraction level can generate a broader % ow of ideas; can push to think di! erently about a subject.
$ erefore the two search areas are renamed in expressions. Improve safety became ‘on the safe side’ and tra" c jam & busy road, driving continu-ously together, became ‘go with the ! ow’.
table 1: search areas
12Sources of Innovation Nov 2011 N. Geurds and P. van der Molen
Chapter 2: Design goal & Requirements
In this chapter the goal of the project and the requirements are described. ! ese are derived from the strategy phase and they function as a guide-line in this project.
2.1 Design goal
A design goal was formulated to stay focused on the goal of the project and to be able to re" ect on the process and the concept.
Develop a tangible, realistic, innovative concept which # ts in the sustainable highway project and which # ts in one of the two search areas ‘go with the " ow’ or ‘on the safe side’.
2.2 Requirements
A list of requirements was created to evaluate future idea directions, ideas and concepts. For the concept development the requirements are a tool to increase the success of the concept.
Requirements: • ! e solution is sustainable• ! e solution is energy neutral• ! e solution is innovative• ! e solution # ts the theme ‘sustainable highway’• ! e solution implements one or more given energy technologies• ! e solution increases the safety for all (on the safe side)• ! e solution reduces tra$ c jams • ! e solution supports ‘het Nieuwe Rijden’• ! e solution stimulates continuous driving (go with the " ow)• ! e solution is feasible to implement in the next three years• (Part of) ! e solution is tangible• ! e solution is visible/understandable for all drivers from the # rst time
13Sources of Innovation Nov 2011 N. Geurds and P. van der Molen
Chapter 3: Concept Development
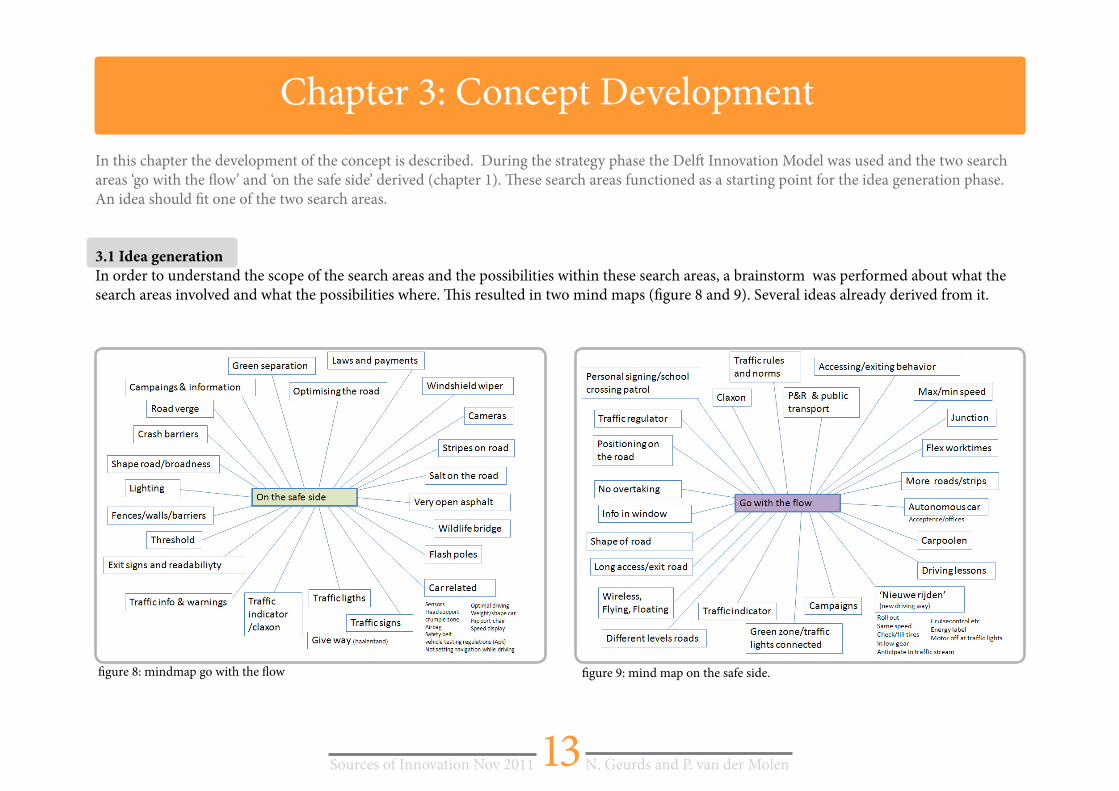
In this chapter the development of the concept is described. During the strategy phase the Del! Innovation Model was used and the two search areas ‘go with the " ow’ and ‘on the safe side’ derived (chapter 1). # ese search areas functioned as a starting point for the idea generation phase. An idea should $ t one of the two search areas.
3.1 Idea generation
In order to understand the scope of the search areas and the possibilities within these search areas, a brainstorm was performed about what the search areas involved and what the possibilities where. # is resulted in two mind maps ($ gure 8 and 9). Several ideas already derived from it.
$ gure 8: mindmap go with the " ow $ gure 9: mind map on the safe side.
14Sources of Innovation Nov 2011 N. Geurds and P. van der Molen
3.2 “Het Nieuwe Rijden” (the new way of driving)
During the brainstorms sessions “Het Nieuwe Rijden” seemed to ! t many of the ideas. “Het Nieuwe Rijden” is a Dutch governmental campaign to stimulate a new way of driving, where people are more aware about their behaviour and which lead to less CO2 emission. A concept which is part of “Het Nieuwe Rijden” would increase the sustainability (PPP) e" ect of this project and would have bene! ts for the realization. [6,7,8]
“! e Nieuwe Rijden” means ‘[1]:
• Turn as early as possible to a higher gear.
• Let the car roll out when you have to stop.
• Drive with a constant speed (and not too fast) and in he highest gear possible.
• Check the tire pressure monthly.
• Look far ahead and anticipate on other tra" c.
• Turn the engine o# , even at shorter stops.
• If possible, use in-car devices, such as tachometer, cruise control and trip computer.
• When buying a new car on the energy label.
• Go conscious of guzzlers, such as air conditioning and roof boxes.
3.3 idea selection
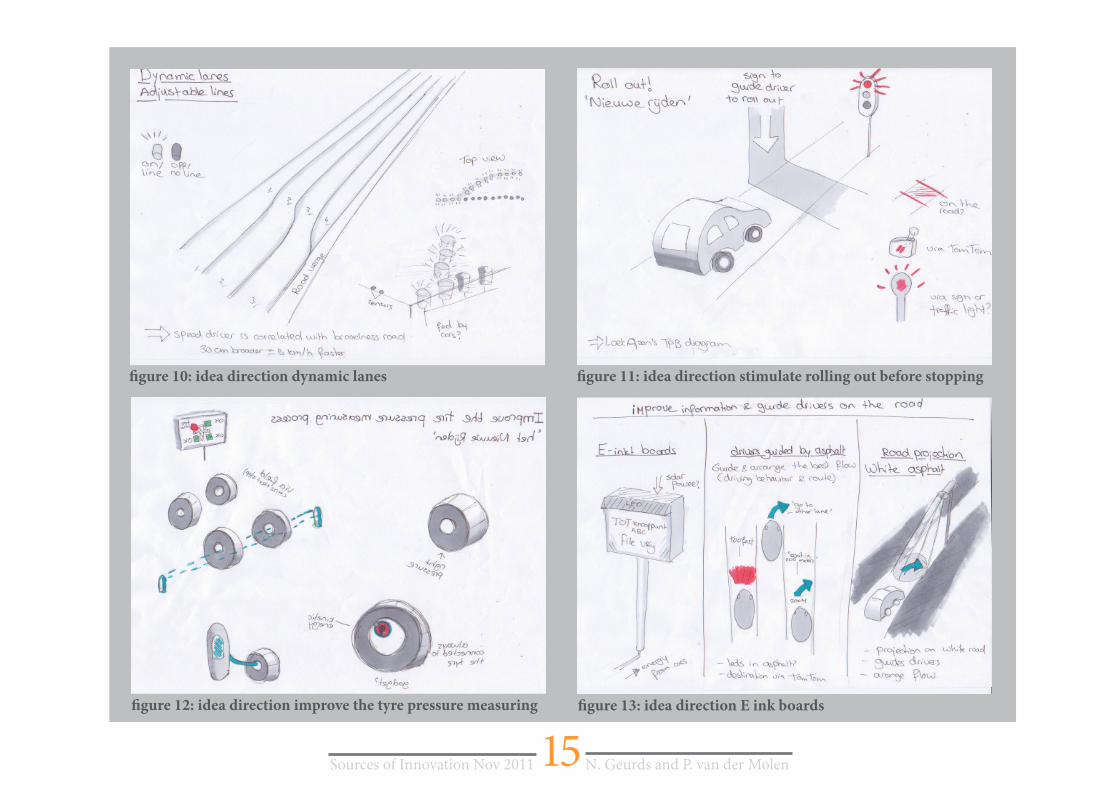
# e ideas were grouped and evaluated by feasibility and relevance. # is resulted in four idea directions.To get a more insight in the idea directions, a TRIZ analysis of cause & positive or negative e" ects was done. # is resulted in lists of strong and weak points of each of the idea directions, which also helped to concretized them and to see possibilities on a more abstract level (appendix 2). # e lists are translated into four concrete idea initial concepts (! gure 10-13).
15Sources of Innovation Nov 2011 N. Geurds and P. van der Molen
� gure 10: idea direction dynamic lanes � gure 11: idea direction stimulate rolling out before stopping
� gure 12: idea direction improve the tyre pressure measuring � gure 13: idea direction E ink boards
16Sources of Innovation Nov 2011 N. Geurds and P. van der Molen
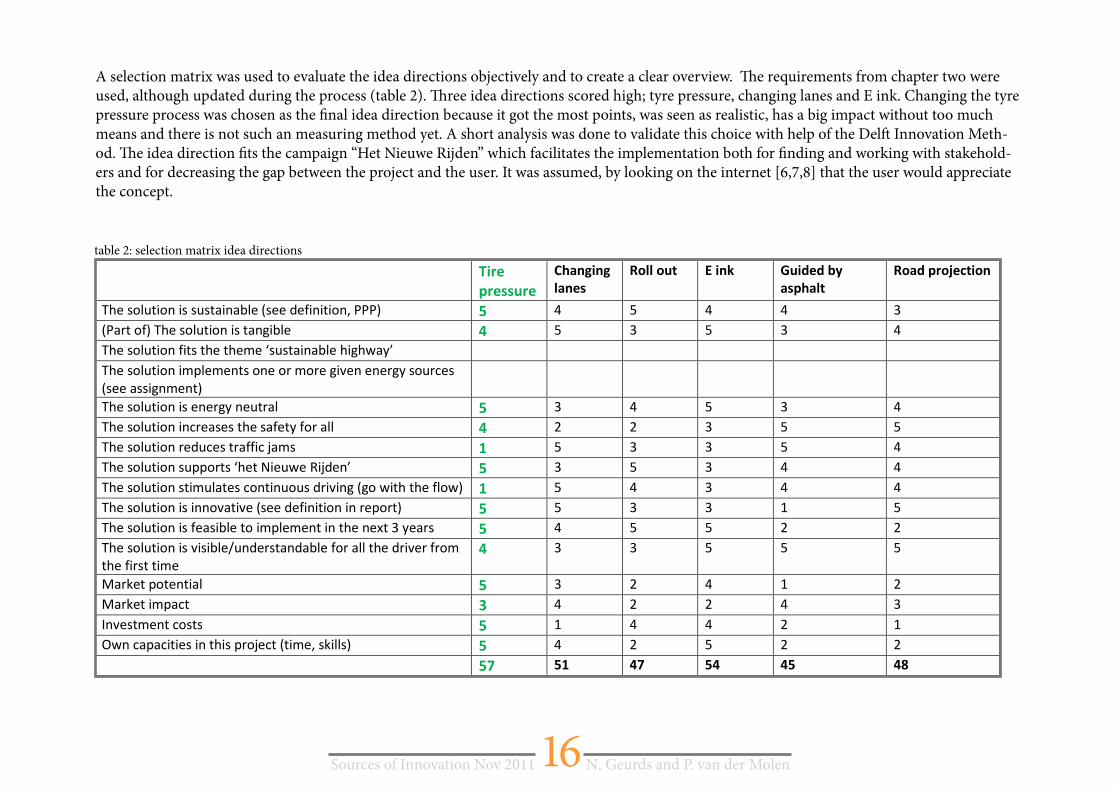
A selection matrix was used to evaluate the idea directions objectively and to create a clear overview. ! e requirements from chapter two were used, although updated during the process (table 2). ! ree idea directions scored high; tyre pressure, changing lanes and E ink. Changing the tyre pressure process was chosen as the " nal idea direction because it got the most points, was seen as realistic, has a big impact without too much means and there is not such an measuring method yet. A short analysis was done to validate this choice with help of the Del# Innovation Meth-od. ! e idea direction " ts the campaign “Het Nieuwe Rijden” which facilitates the implementation both for " nding and working with stakehold-ers and for decreasing the gap between the project and the user. It was assumed, by looking on the internet [6,7,8] that the user would appreciate the concept.
table 2: selection matrix idea directions
� �����
���������
�� �� �
������
��������� ������ ����������
�������
����������������
������������������� ��������������������� �� �� �� �� �� ��
������������������������� ��� �� �� �� �� �� ��
����������������������������� ����������� � � � � � �
������������������������������������������������ ���
���������������
� � � � � �
��������������������������� �� �� �� �� �� ��
������������ ������������������������ �� !� !� �� �� ��
��������������� ������� �"���� �� �� �� �� �� ��
�����������������������#�����$"����� �� �� �� �� �� ��
������������������� ������������������������������ �� �� �� �� �� ��
������������������������������������������ �� �� �� �� %� ��
����������������� ��������������������&��������� �� �� �� �� !� !�
��������������� ��'���������� �������������������������
����������
�� �� �� �� �� ��
(��)���������� �� �� !� �� %� !�
(��)����� � �� �� !� !� �� ��
*�������� ���� �� %� �� �� !� %�
+��� ��� �����������"� �������)����� �� �� !� �� !� !�
� ��� ��� ��� ��� ��� ���
�
17Sources of Innovation Nov 2011 N. Geurds and P. van der Molen
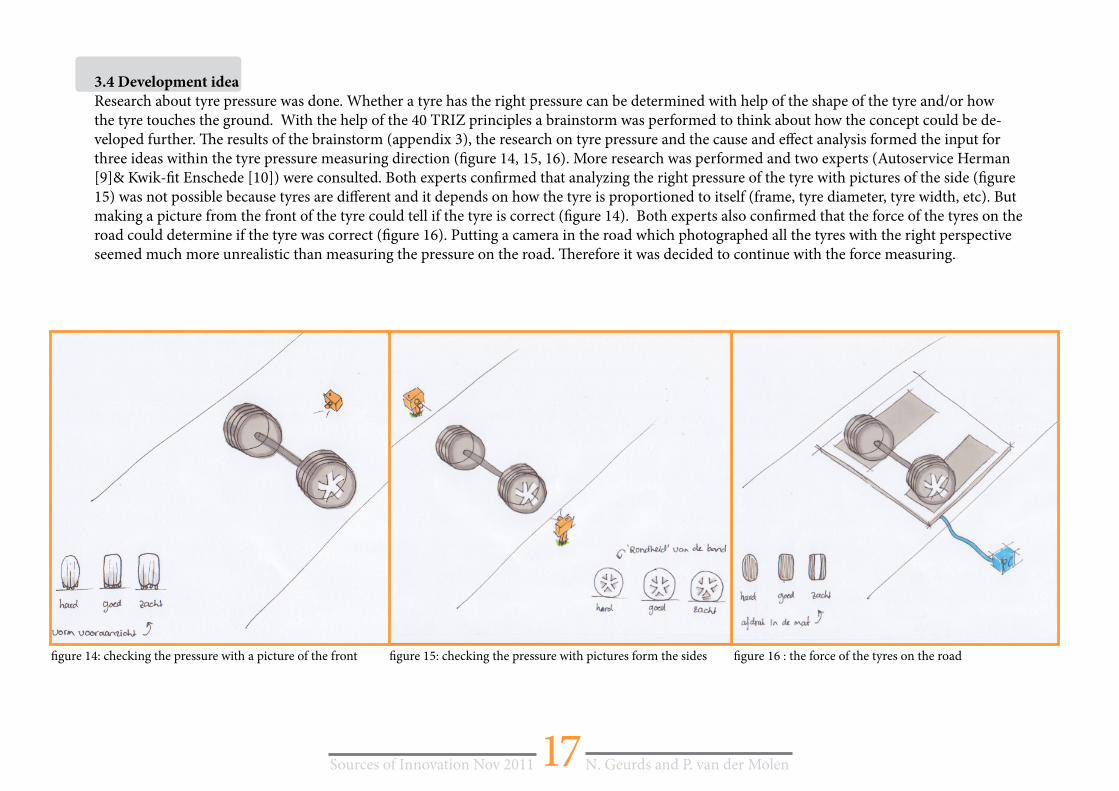
3.4 Development idea
Research about tyre pressure was done. Whether a tyre has the right pressure can be determined with help of the shape of the tyre and/or how the tyre touches the ground. With the help of the 40 TRIZ principles a brainstorm was performed to think about how the concept could be de-veloped further. ! e results of the brainstorm (appendix 3), the research on tyre pressure and the cause and e" ect analysis formed the input for three ideas within the tyre pressure measuring direction (# gure 14, 15, 16). More research was performed and two experts (Autoservice Herman [9]& Kwik-# t Enschede [10]) were consulted. Both experts con# rmed that analyzing the right pressure of the tyre with pictures of the side (# gure 15) was not possible because tyres are di" erent and it depends on how the tyre is proportioned to itself (frame, tyre diameter, tyre width, etc). But making a picture from the front of the tyre could tell if the tyre is correct (# gure 14). Both experts also con# rmed that the force of the tyres on the road could determine if the tyre was correct (# gure 16). Putting a camera in the road which photographed all the tyres with the right perspective seemed much more unrealistic than measuring the pressure on the road. ! erefore it was decided to continue with the force measuring.
# gure 14: checking the pressure with a picture of the front # gure 15: checking the pressure with pictures form the sides # gure 16 : the force of the tyres on the road
18Sources of Innovation Nov 2011 N. Geurds and P. van der Molen
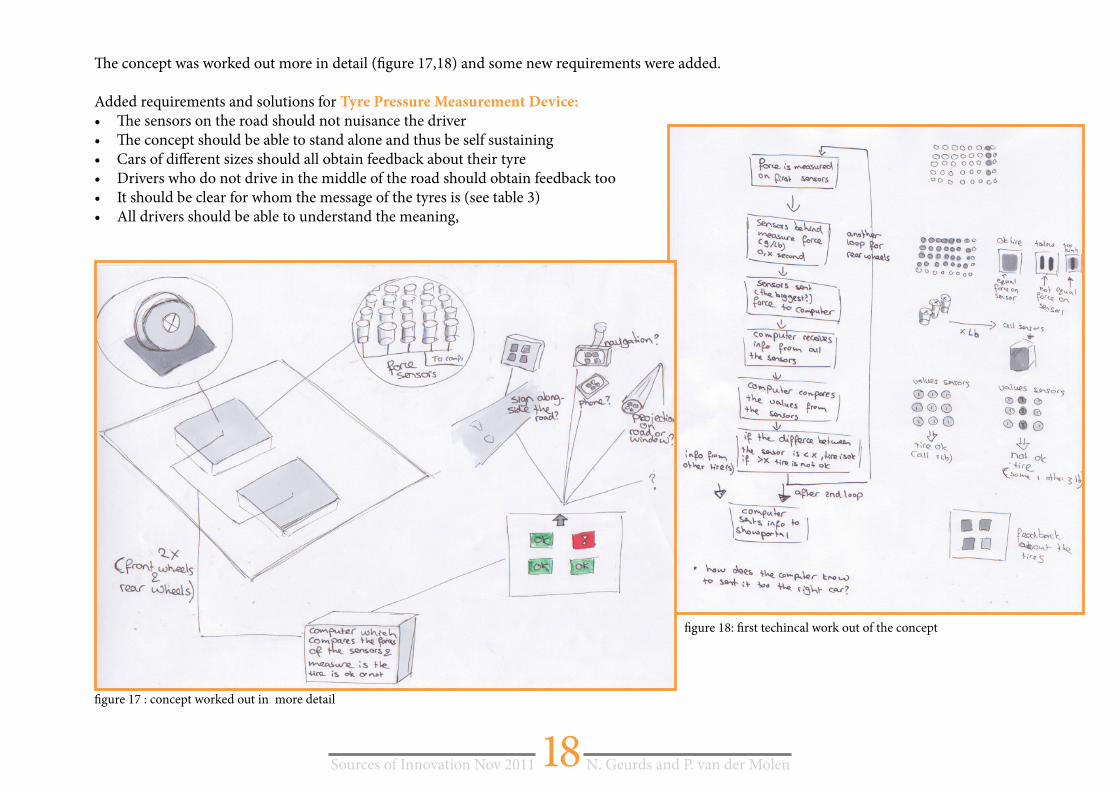
! e concept was worked out more in detail (" gure 17,18) and some new requirements were added.
Added requirements and solutions for Tyre Pressure Measurement Device:
• ! e sensors on the road should not nuisance the driver• ! e concept should be able to stand alone and thus be self sustaining• Cars of di# erent sizes should all obtain feedback about their tyre • Drivers who do not drive in the middle of the road should obtain feedback too• It should be clear for whom the message of the tyres is (see table 3)• All drivers should be able to understand the meaning,
" gure 18: " rst techincal work out of the concept
" gure 17 : concept worked out in more detail
19Sources of Innovation Nov 2011 N. Geurds and P. van der Molen
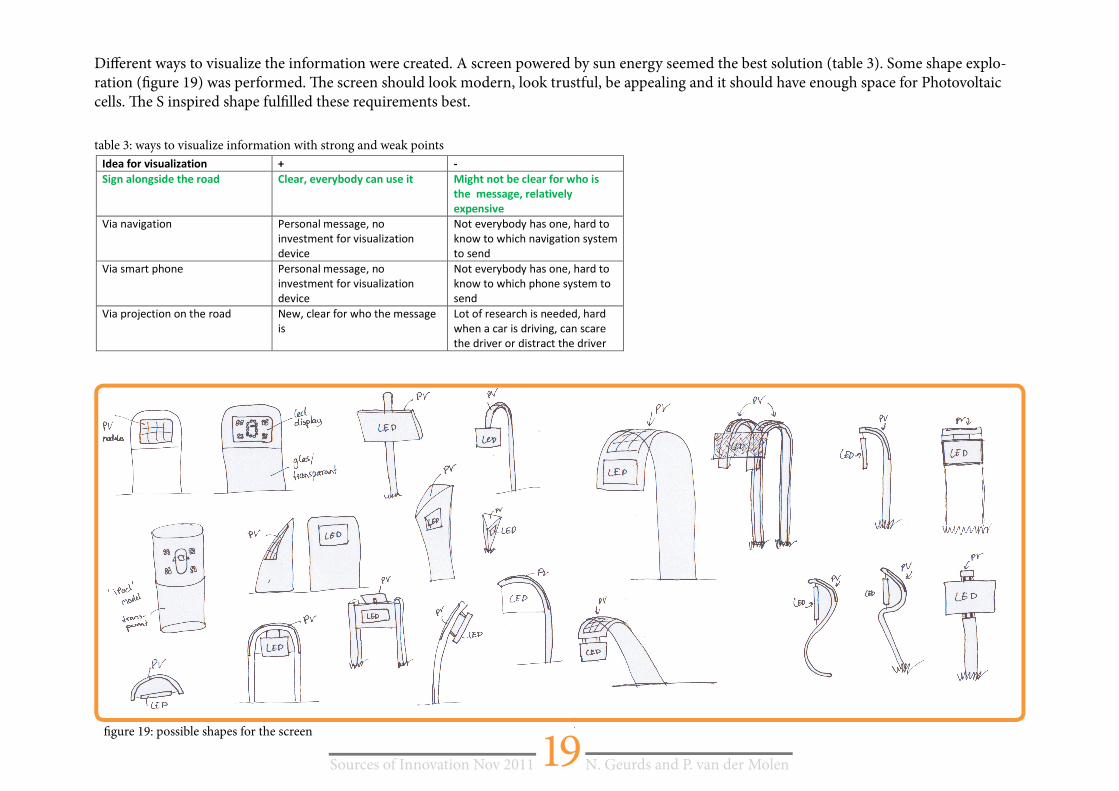
Di! erent ways to visualize the information were created. A screen powered by sun energy seemed the best solution (table 3). Some shape explo-ration (" gure 19) was performed. # e screen should look modern, look trustful, be appealing and it should have enough space for Photovoltaic cells. # e S inspired shape ful" lled these requirements best.
������������ ������ �� ��
����� ���������������� � ������������������������ ������������� ��������������
���������������� ��� ��
��������
�������������� �� ������ �������
���� ����������� ����������
�������
�������������� ������������
���������������������� � ����
�� ����
���� ���������� �� ������ �������
���� ����������� ����������
�������
�������������� ������������
����������������� � ������
����
����������������������� ����������������������� ����
� �
������� ������� ��������������
������������ �������������� �����
��������������� �����������������
�
table 3: ways to visualize information with strong and weak points
" gure 19: possible shapes for the screen
20Sources of Innovation Nov 2011 N. Geurds and P. van der Molen
Chapter 4: Final Design
In this chapter the ! nal design of the tyre measuring and feedback tool – BandOK – is discussed. " e working principle, positioning, use, mainte-nance, styling, technical aspects of the product are explained ! rst. " en pos-sible platforms are explained with the platform driven product development method.
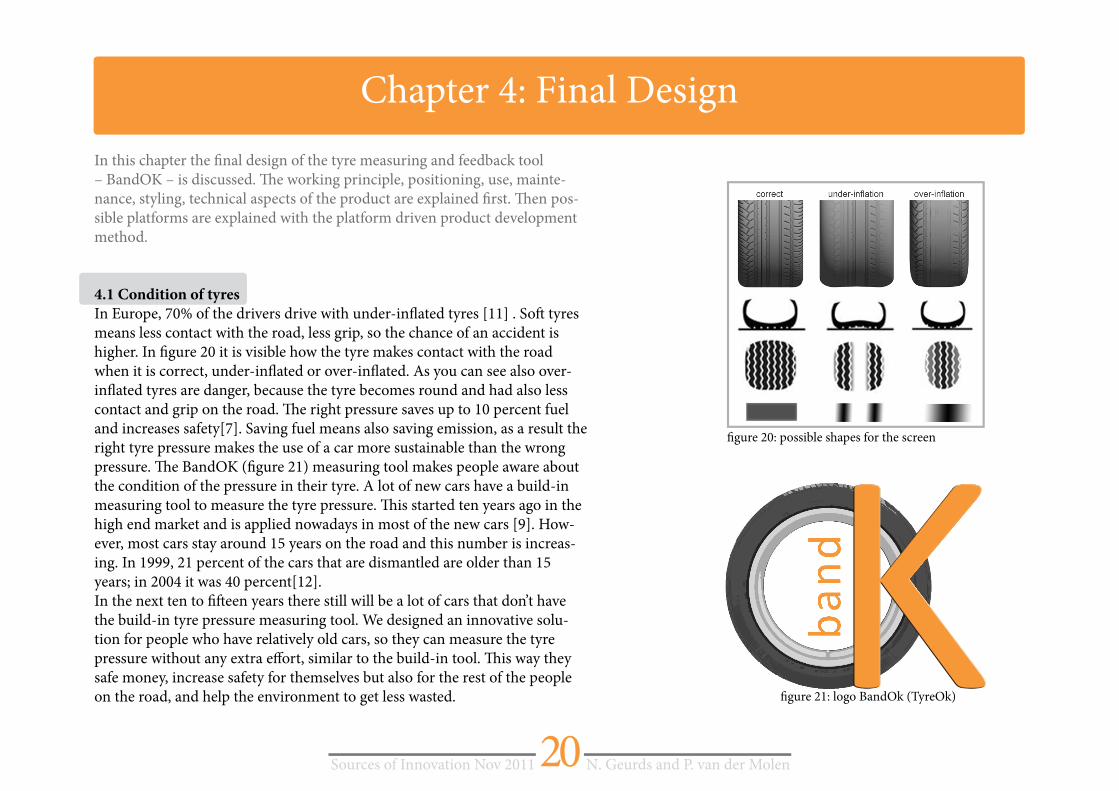
4.1 Condition of tyres
In Europe, 70% of the drivers drive with under-in# ated tyres [11] . So$ tyres means less contact with the road, less grip, so the chance of an accident is higher. In ! gure 20 it is visible how the tyre makes contact with the road when it is correct, under-in# ated or over-in# ated. As you can see also over-in# ated tyres are danger, because the tyre becomes round and had also less contact and grip on the road. " e right pressure saves up to 10 percent fuel and increases safety[7]. Saving fuel means also saving emission, as a result the right tyre pressure makes the use of a car more sustainable than the wrong pressure. " e BandOK (! gure 21) measuring tool makes people aware about the condition of the pressure in their tyre. A lot of new cars have a build-in measuring tool to measure the tyre pressure. " is started ten years ago in the high end market and is applied nowadays in most of the new cars [9]. How-ever, most cars stay around 15 years on the road and this number is increas-ing. In 1999, 21 percent of the cars that are dismantled are older than 15 years; in 2004 it was 40 percent[12]. In the next ten to ! $ een years there still will be a lot of cars that don’t have the build-in tyre pressure measuring tool. We designed an innovative solu-tion for people who have relatively old cars, so they can measure the tyre pressure without any extra e& ort, similar to the build-in tool. " is way they safe money, increase safety for themselves but also for the rest of the people on the road, and help the environment to get less wasted.
! gure 20: possible shapes for the screen
! gure 21: logo BandOk (TyreOk)
21Sources of Innovation Nov 2011 N. Geurds and P. van der Molen
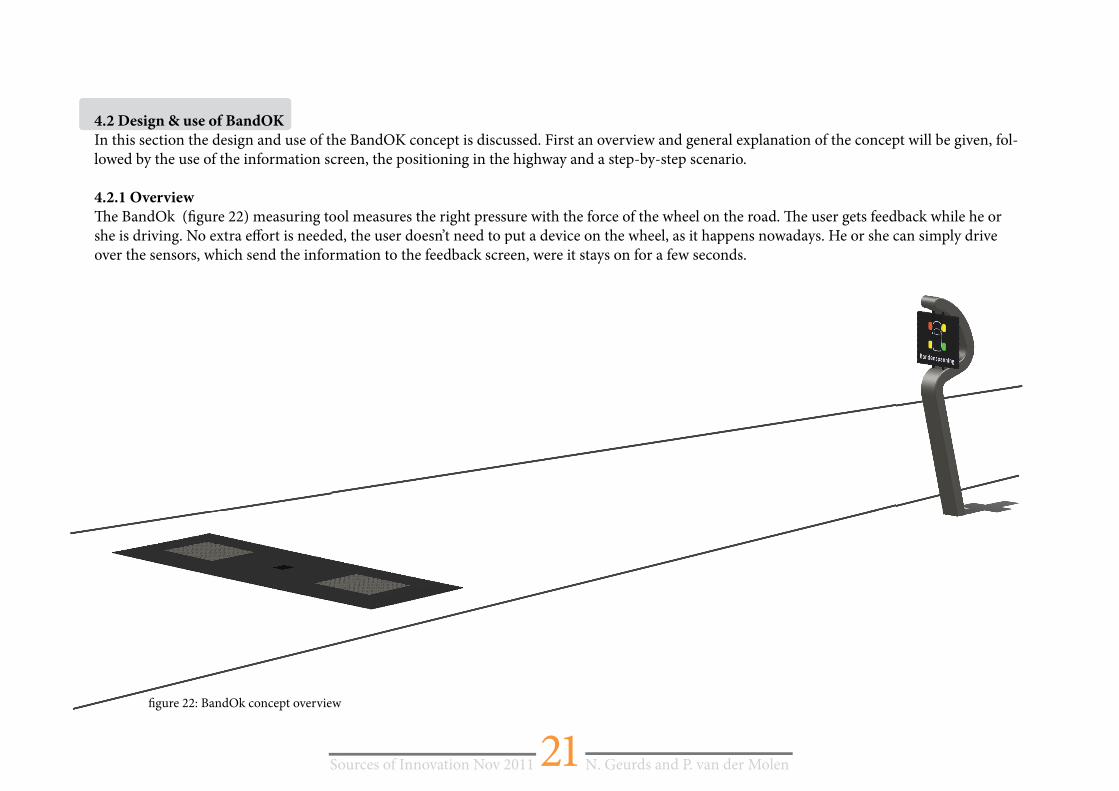
4.2 Design & use of BandOK
In this section the design and use of the BandOK concept is discussed. First an overview and general explanation of the concept will be given, fol-lowed by the use of the information screen, the positioning in the highway and a step-by-step scenario.
4.2.1 Overview
! e BandOk (" gure 22) measuring tool measures the right pressure with the force of the wheel on the road. ! e user gets feedback while he or she is driving. No extra e# ort is needed, the user doesn’t need to put a device on the wheel, as it happens nowadays. He or she can simply drive over the sensors, which send the information to the feedback screen, were it stays on for a few seconds.she is d ving. No extra e ort is eeded, the use does t need to put a device o the wheel, as it appens owadays. e or she can s ply drive over the sensors, which send the information to the feedback screen, were it stays on for a few seconds.
" gure 22: BandOk concept overview
22Sources of Innovation Nov 2011 N. Geurds and P. van der Molen
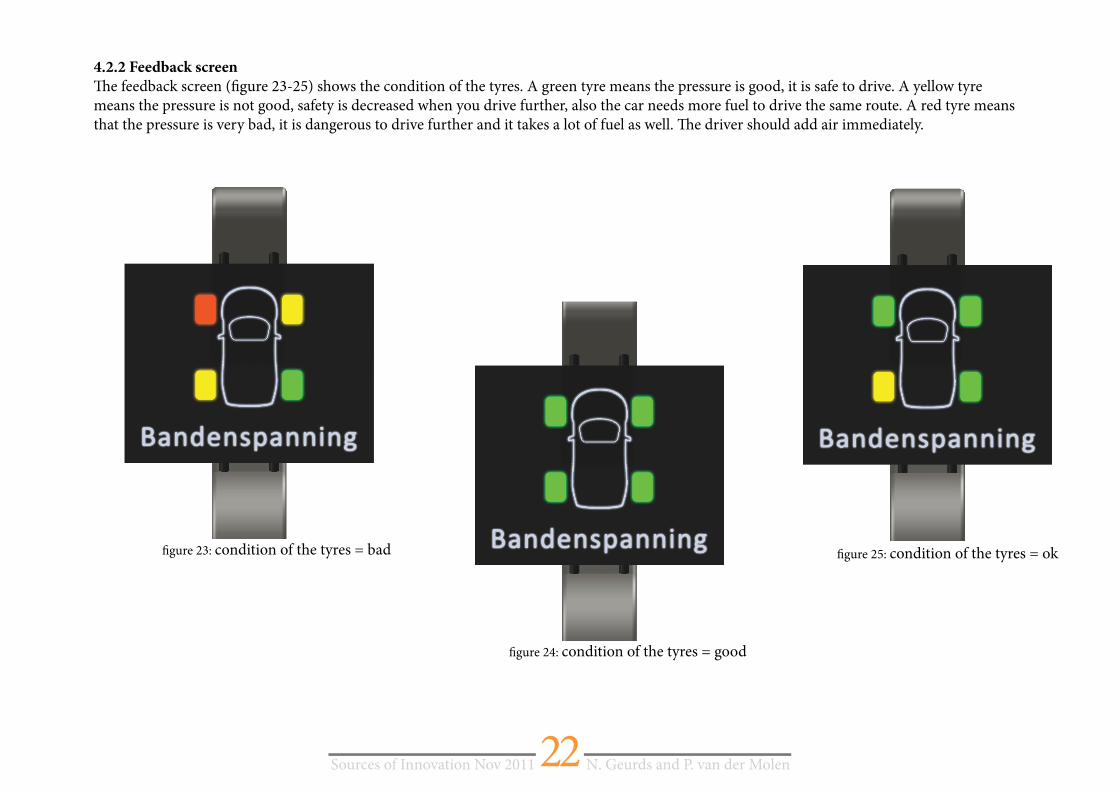
4.2.2 Feedback screen
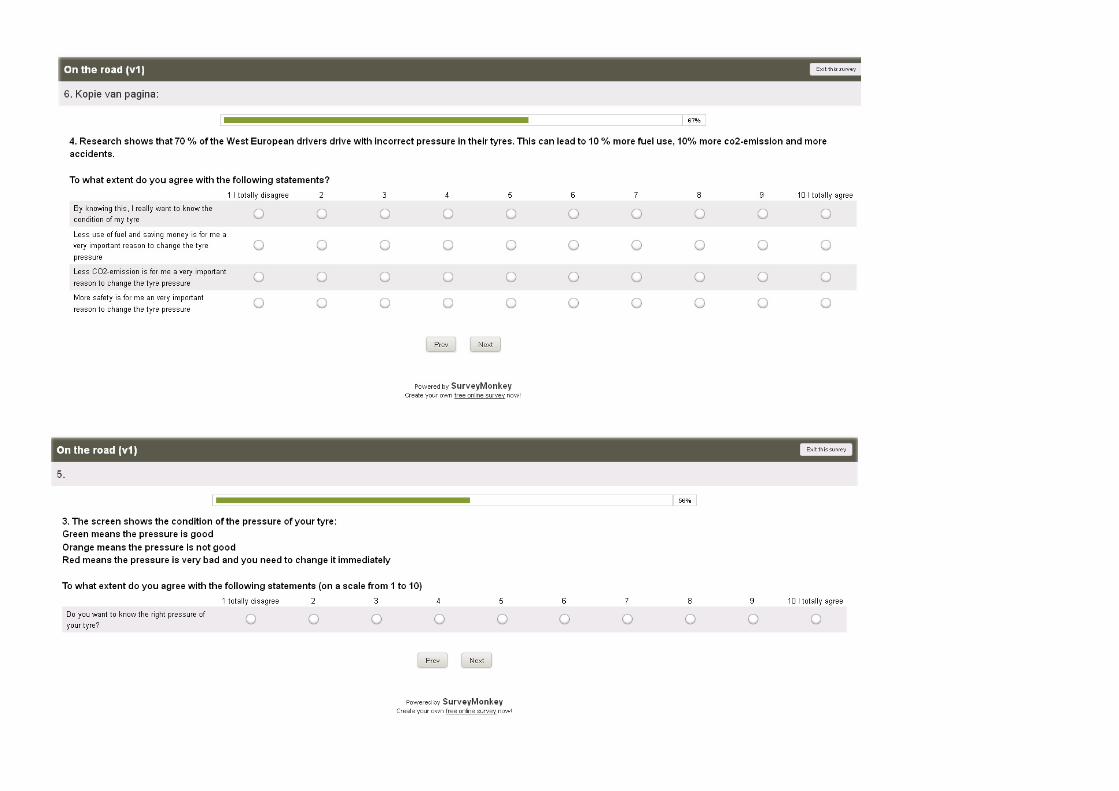
! e feedback screen (" gure 23-25) shows the condition of the tyres. A green tyre means the pressure is good, it is safe to drive. A yellow tyre means the pressure is not good, safety is decreased when you drive further, also the car needs more fuel to drive the same route. A red tyre means that the pressure is very bad, it is dangerous to drive further and it takes a lot of fuel as well. ! e driver should add air immediately.
" gure 23: condition of the tyres = bad
" gure 24: condition of the tyres = good
" gure 25: condition of the tyres = ok
23Sources of Innovation Nov 2011 N. Geurds and P. van der Molen
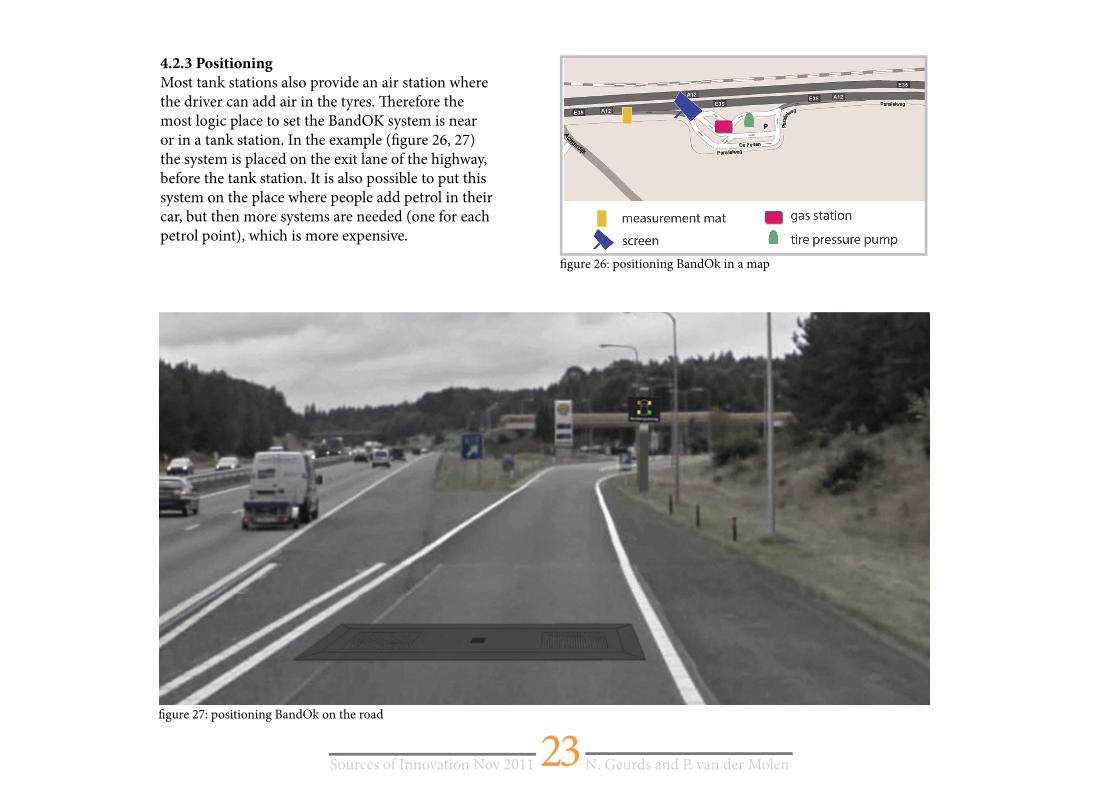
4.2.3 Positioning
Most tank stations also provide an air station where the driver can add air in the tyres. " erefore the most logic place to set the BandOK system is near or in a tank station. In the example (! gure 26, 27)the system is placed on the exit lane of the highway, before the tank station. It is also possible to put this system on the place where people add petrol in their car, but then more systems are needed (one for each petrol point), which is more expensive.
! gure 26: positioning BandOk in a map
! gure 27: positioning BandOk on the road
24Sources of Innovation Nov 2011 N. Geurds and P. van der Molen
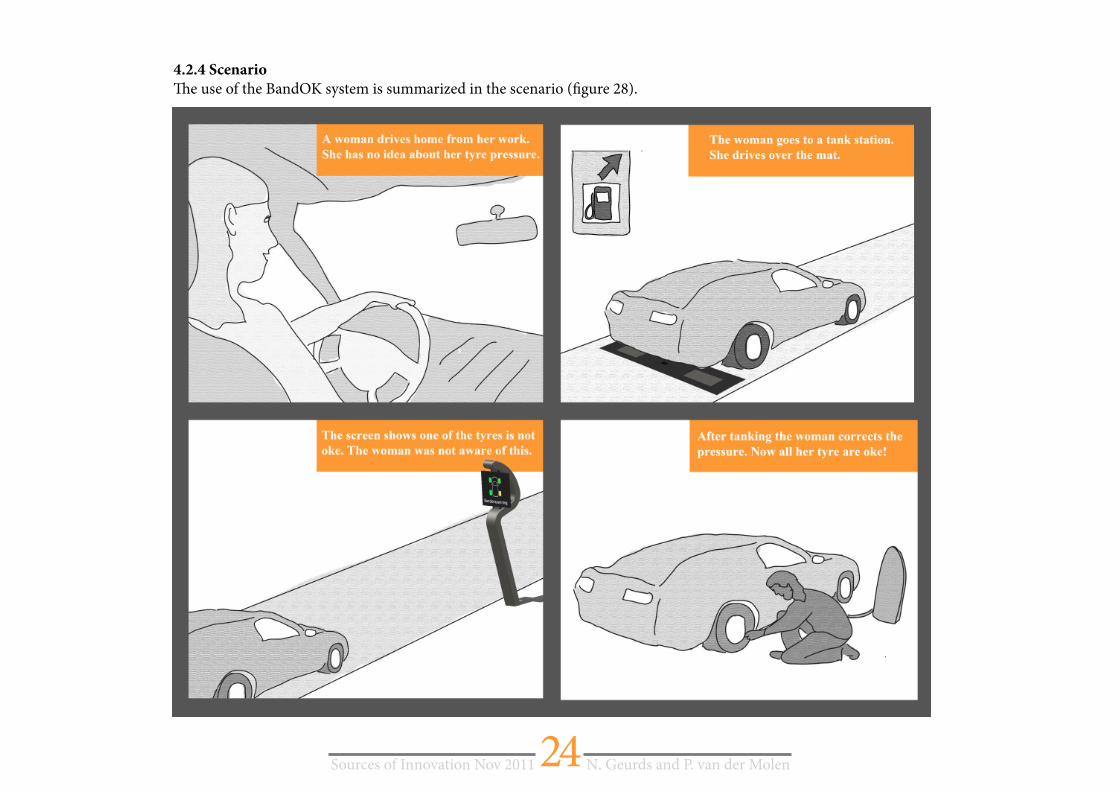
4.2.4 Scenario
! e use of the BandOK system is summarized in the scenario (" gure 28).
25Sources of Innovation Nov 2011 N. Geurds and P. van der Molen
4.3 Technical aspects of BandOK
In this section the technical aspects and working of the BandOK concept is explained. First the di! erent parts are shown and is visualized how they are connected. " en the working principle, energy supply and maintenance are discussed.
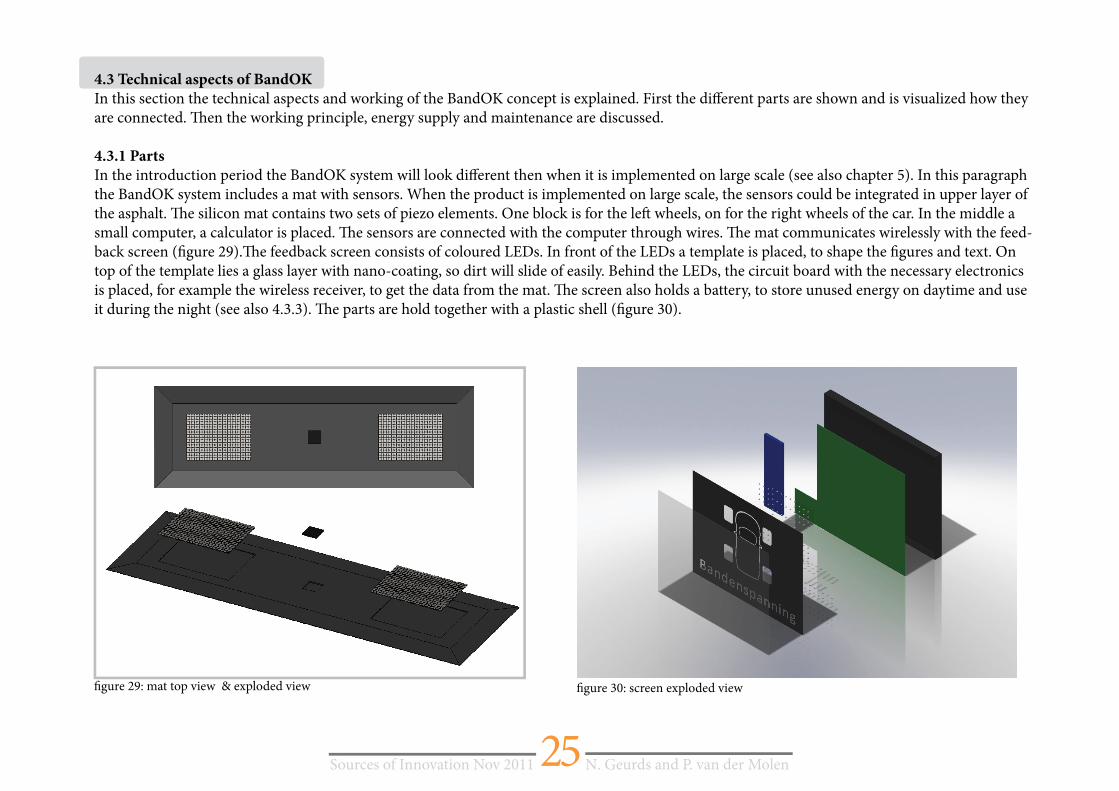
4.3.1 Parts
In the introduction period the BandOK system will look di! erent then when it is implemented on large scale (see also chapter 5). In this paragraph the BandOK system includes a mat with sensors. When the product is implemented on large scale, the sensors could be integrated in upper layer of the asphalt. " e silicon mat contains two sets of piezo elements. One block is for the le# wheels, on for the right wheels of the car. In the middle a small computer, a calculator is placed. " e sensors are connected with the computer through wires. " e mat communicates wirelessly with the feed-back screen ($ gure 29)." e feedback screen consists of coloured LEDs. In front of the LEDs a template is placed, to shape the $ gures and text. On top of the template lies a glass layer with nano-coating, so dirt will slide of easily. Behind the LEDs, the circuit board with the necessary electronics is placed, for example the wireless receiver, to get the data from the mat. " e screen also holds a battery, to store unused energy on daytime and use it during the night (see also 4.3.3). " e parts are hold together with a plastic shell ($ gure 30).
$ gure 29: mat top view & exploded view $ gure 30: screen exploded view
26Sources of Innovation Nov 2011 N. Geurds and P. van der Molen
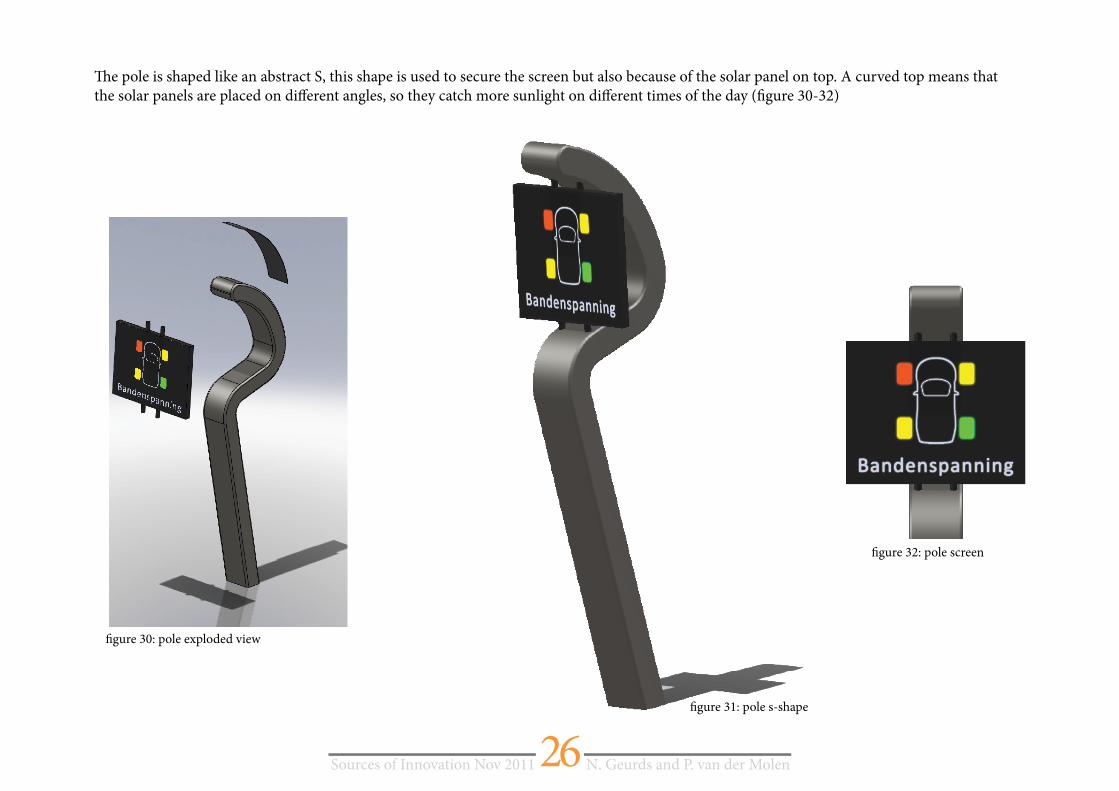
! e pole is shaped like an abstract S, this shape is used to secure the screen but also because of the solar panel on top. A curved top means that the solar panels are placed on di" erent angles, so they catch more sunlight on di" erent times of the day (# gure 30-32)
# gure 30: pole exploded view
# gure 32: pole screen
# gure 31: pole s-shape
27Sources of Innovation Nov 2011 N. Geurds and P. van der Molen
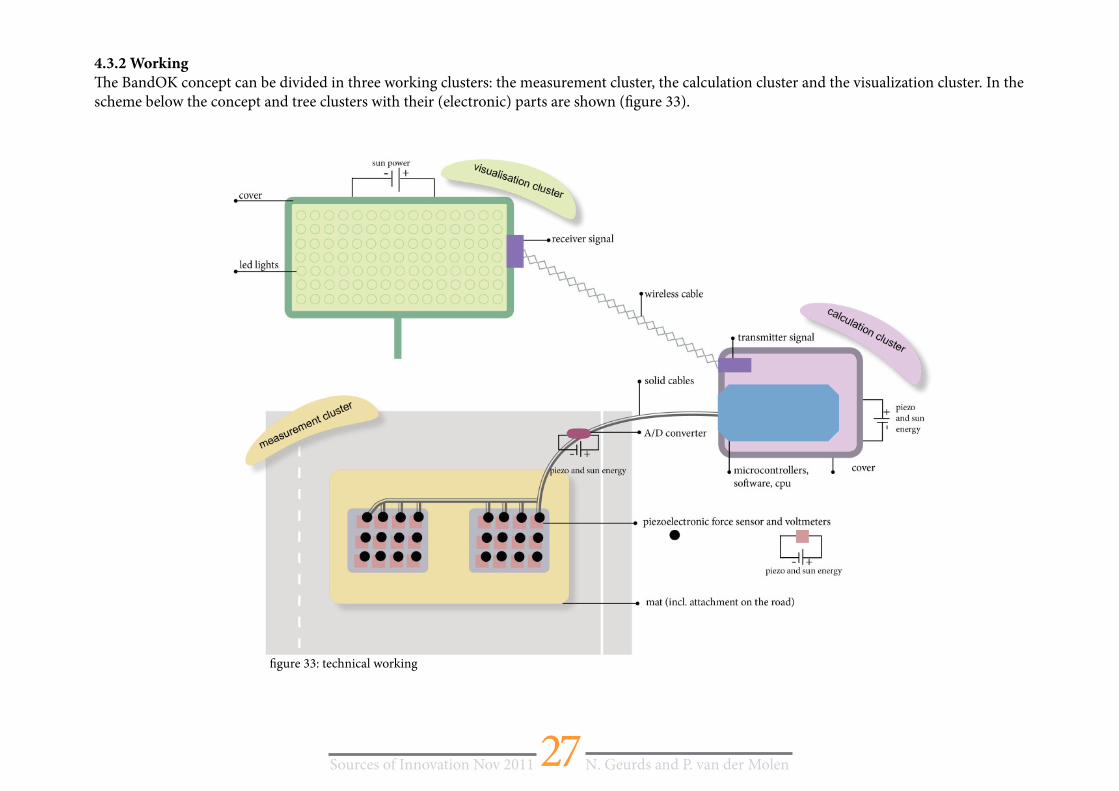
4.3.2 Working
" e BandOK concept can be divided in three working clusters: the measurement cluster, the calculation cluster and the visualization cluster. In the scheme below the concept and tree clusters with their (electronic) parts are shown (! gure 33).
! gure 33: technical working
28Sources of Innovation Nov 2011 N. Geurds and P. van der Molen
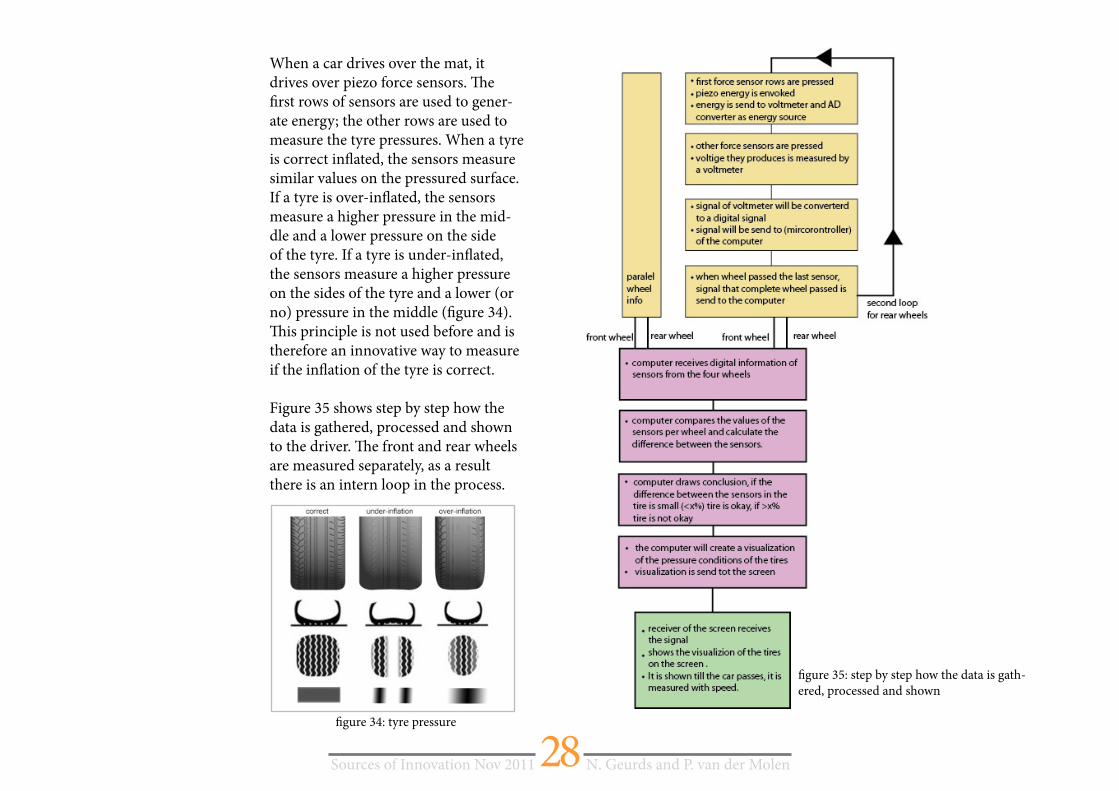
When a car drives over the mat, it drives over piezo force sensors. ! e " rst rows of sensors are used to gener-ate energy; the other rows are used to measure the tyre pressures. When a tyre is correct in# ated, the sensors measure similar values on the pressured surface. If a tyre is over-in# ated, the sensors measure a higher pressure in the mid-dle and a lower pressure on the side of the tyre. If a tyre is under-in# ated, the sensors measure a higher pressure on the sides of the tyre and a lower (or no) pressure in the middle (" gure 34). ! is principle is not used before and is therefore an innovative way to measure if the in# ation of the tyre is correct.
Figure 35 shows step by step how the data is gathered, processed and shown to the driver. ! e front and rear wheels are measured separately, as a result there is an intern loop in the process.
" gure 34: tyre pressure
" gure 35: step by step how the data is gath-ered, processed and shown
29Sources of Innovation Nov 2011 N. Geurds and P. van der Molen
4.3.3 Energy landscape
As described in section 4.3.2, the mat uses electricity that is generated by cars that drive over the ! rst rows of piezo sensors. Because other sensors in the same set are used for measurement of the tyre pressure, is it a kind of hidden way to get energy. Like the mat, the pole and screen are also self sustaining, however, the pole has a solar panel, which is visible for anyone who passes.
Both energy generators can be seen as third generation energy landscapes. " ey need sustainable energy sources – force/movement and sun – which are directly available. " e strategy for conversion is multi small scale, this makes the product # exible. It can be placed everywhere without cables that need to be prolonged, which can cost thousands of euros.
In section 1.1.4 the term ‘energy neutral’ is de! ned for this project. " e BandOK concept is a self sustaining product as it generates enough energy to function on its own, therefore it can be called and energy neutral product.
4.3.4 Maintanance
" e screen is coated with a nano layer so the dirt slides of. " e shape of the pole is angled so the chance of something sticking on it is smaller. " e mat also has a # exible top layer so dirt cannot get between the electronics.
" e product is made of modules. " e mat can be opened from below, this way it is easier to replace broken sensors or repair the computer in case this is needed. " e screen is removable from the pole, and can be disassembled (glass, template, circuit and LEDs, battery, shell, attaching cylinders). Also the PV module can be removed and replaced when needed.
4.4 Platform driven product development
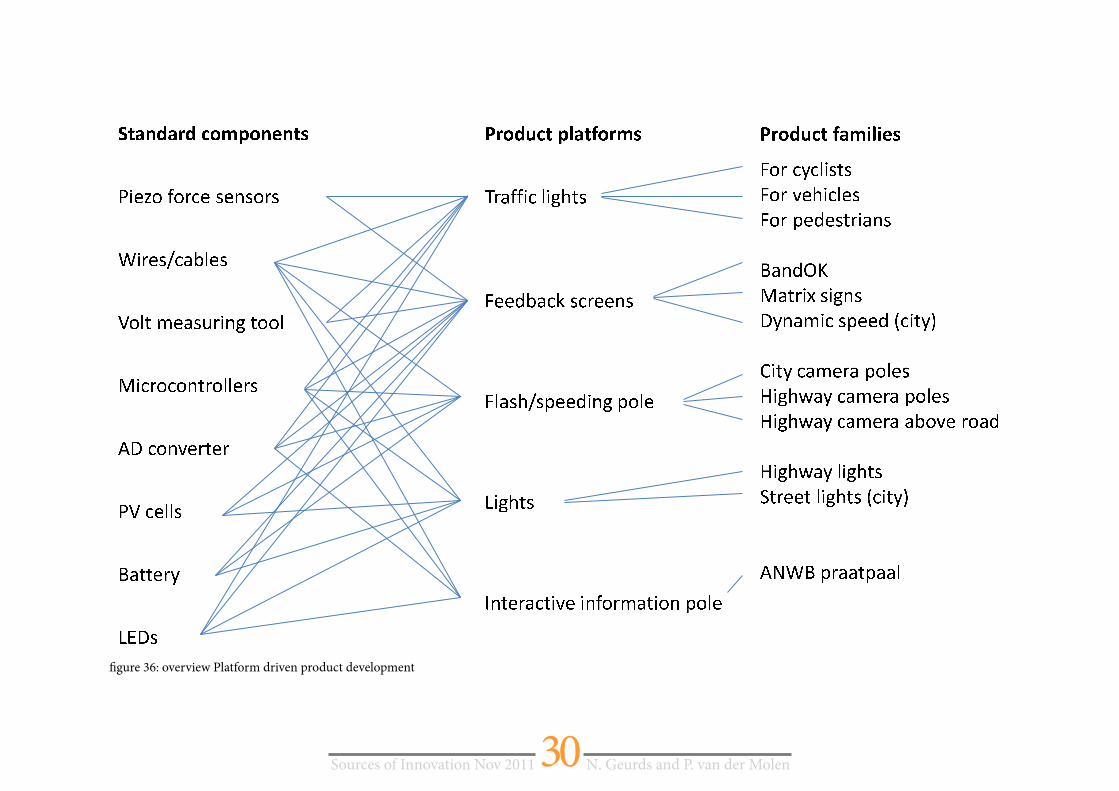
According to Mc Grath (1995) a product platform is a set of subsystems and interfaces that forms a common structure from which a stream of relat-ed products (product family) can be e$ ciently developed and produced. Di% erent product platforms can have the same standardized components. Due to this modular product architecture, when a new type of one component is available, all the platforms and product families can be updated.
In the ! gure on the next page (! gure 36) is shown how the standardized components of the BandOK concept could be integrated in other existing
product platforms & families. " e last column, market segments, is le* out because it is not applicable for this project." e other components of the
BandOK concept are partly standard or non standard. Partly standard components that ! t the platform ‘feedback screens’ are the pole and the shell of the screen and the wireless data transmitter and receiver. Another possible partly standard component is the shell of the computer/calculator. Non standard components are the mat and the so* ware that is needed to calculate and convert the data.
30Sources of Innovation Nov 2011 N. Geurds and P. van der Molen
)* + , - + . - / 0 1 2 0 , 3 , *45 67 8 9 : 9 ; <7 =7 > = 9 ; =? 6 ;7 = @ < A B C 7 =D 9 CE F 7 A =G ; 6 > H E 9 9 CI 6 < ; 9 < 9 >E ; 9 C C 7 ; =J K < 9 >L 7 ;E 7 ;5 D <7 C C =M AE E 7 ;NO P K =
Q . 0 -R /* 2 S + * T 0 . 14U ; A : : 6 < C 6 H VE =W7 7 X B A < Y = < ;7 7 > =
W C A = V @ = Z7 7 X 6 > H Z 9 C 7O 6 H VE =
[ >E 7 ; A <E 6L 7 6 > : 9 ; F AE 6 9 > Z 9 C 7\] _ a b cd e f g fh iW 9 ; < N < C 6 =E =W 9 ; L 7 V 6 < C 7 =W 9 ; Z7 X 7 =E ; 6 A > =jk l mn oI AE ; 6p = 6 H > =K N > A F 6 < = Z7 7 X q < 6E N rs 6E N < A F 7 ; A Z 9 C 7 =t 6 H Vu A N < A F 7 ; A Z 9 C 7 =t 6 H Vu A N < A F 7 ; A A B 9L 7 ; 9 A Xt 6 H Vu A N C 6 H VE =vE ;7 7 E C 6 H VE = q < 6E N rJ w ? M Z ; A AE Z A A C
! gure 36: overview Platform driven product development
31Sources of Innovation Nov 2011 N. Geurds and P. van der Molen
Chapter 5: Evaluation and future
In this chapter the ! nal concept, BandOk, is evaluated and future steps are provided. With the help of the Constructive Technology Assessment method the bridge between the user and the concept was analyzed and decreased. A questionnaire has been send and the " eory of Planned Be-haviour (Ajzen 1991) has been used. " e innovation process, the future of the BandOK innovation and the business model is described
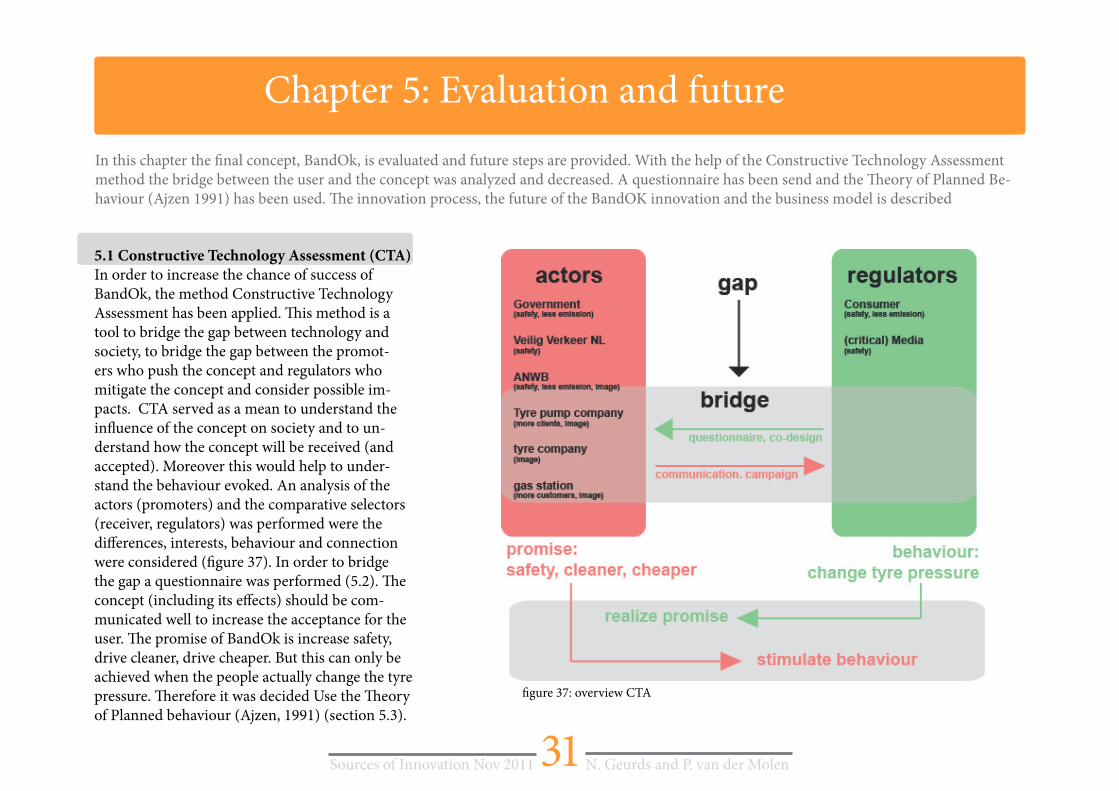
5.1 Constructive Technology Assessment (CTA)
In order to increase the chance of success of BandOk, the method Constructive Technology Assessment has been applied. " is method is a tool to bridge the gap between technology and society, to bridge the gap between the promot-ers who push the concept and regulators who mitigate the concept and consider possible im-pacts. CTA served as a mean to understand the in# uence of the concept on society and to un-derstand how the concept will be received (and accepted). Moreover this would help to under-stand the behaviour evoked. An analysis of the actors (promoters) and the comparative selectors (receiver, regulators) was performed were the di$ erences, interests, behaviour and connection were considered (! gure 37). In order to bridge the gap a questionnaire was performed (5.2). " e concept (including its e$ ects) should be com-municated well to increase the acceptance for the user. " e promise of BandOk is increase safety, drive cleaner, drive cheaper. But this can only be achieved when the people actually change the tyre pressure. " erefore it was decided Use the " eory of Planned behaviour (Ajzen, 1991) (section 5.3).
! gure 37: overview CTA
32Sources of Innovation Nov 2011 N. Geurds and P. van der Molen
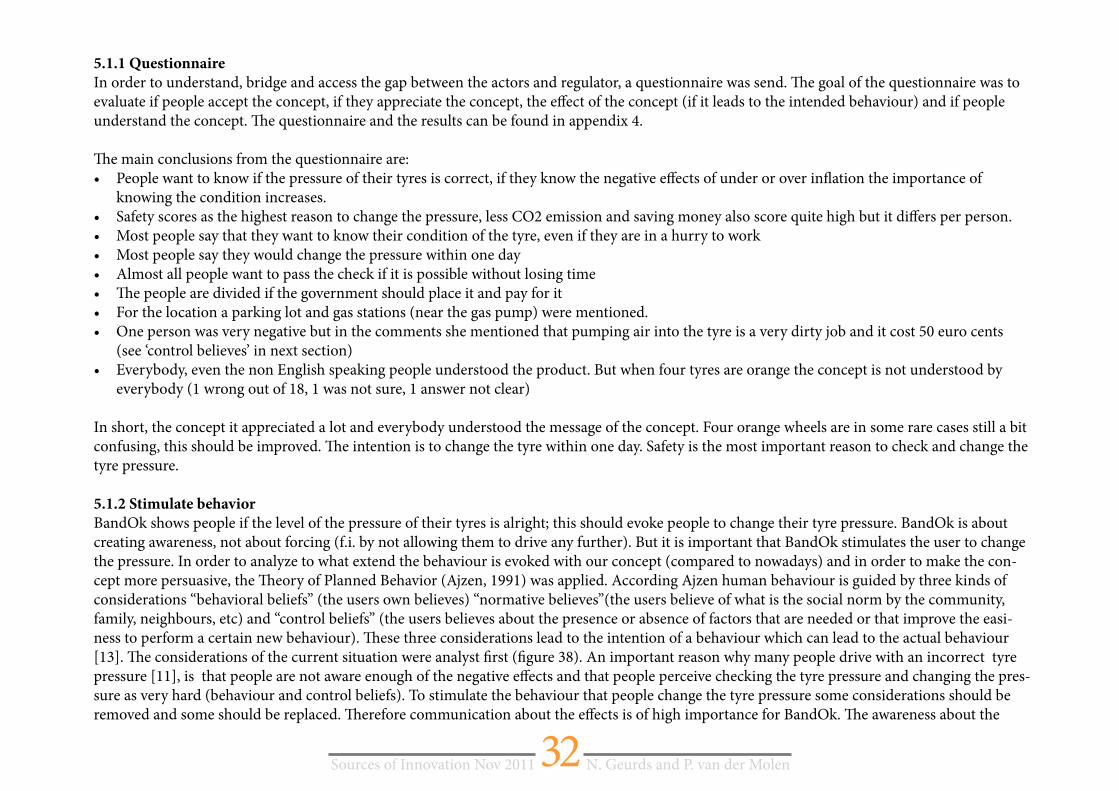
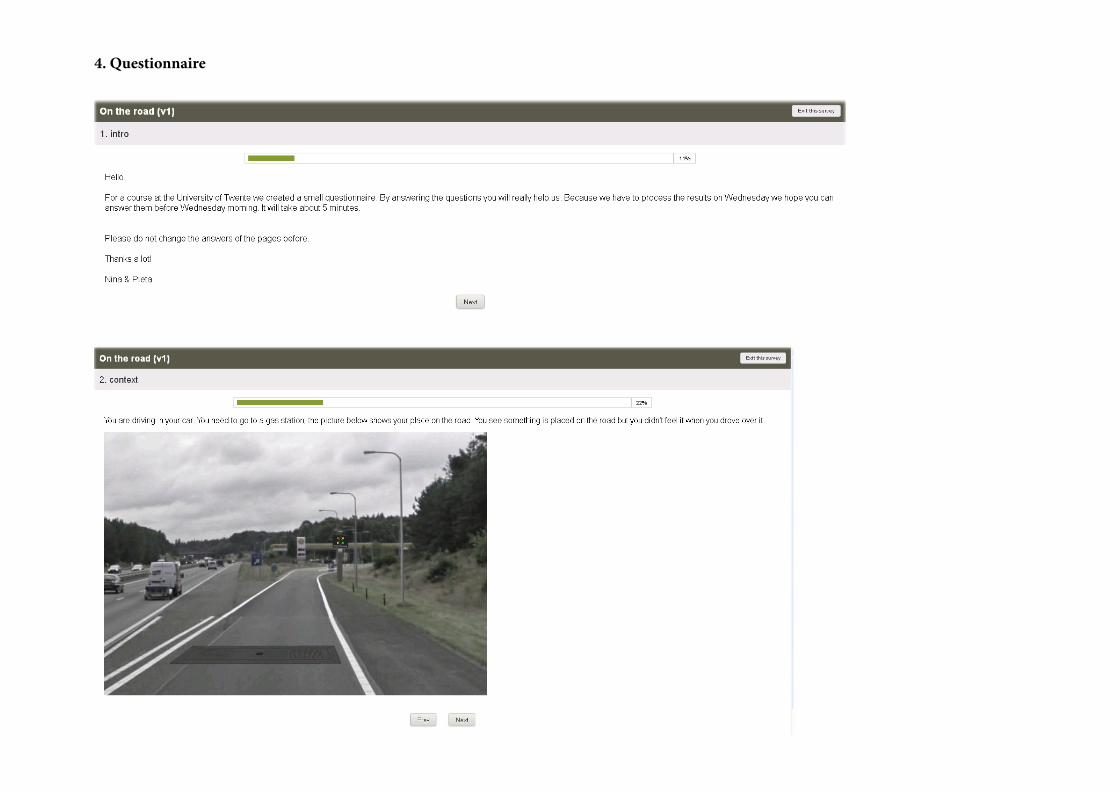
5.1.1 Questionnaire
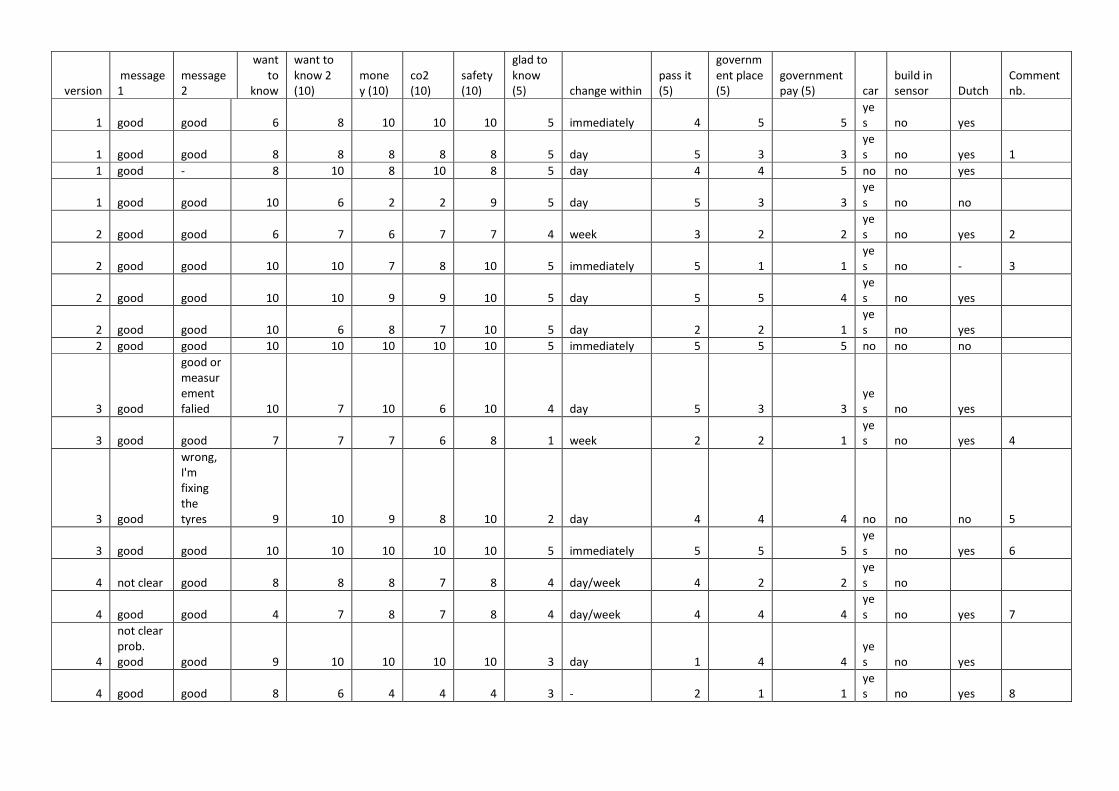
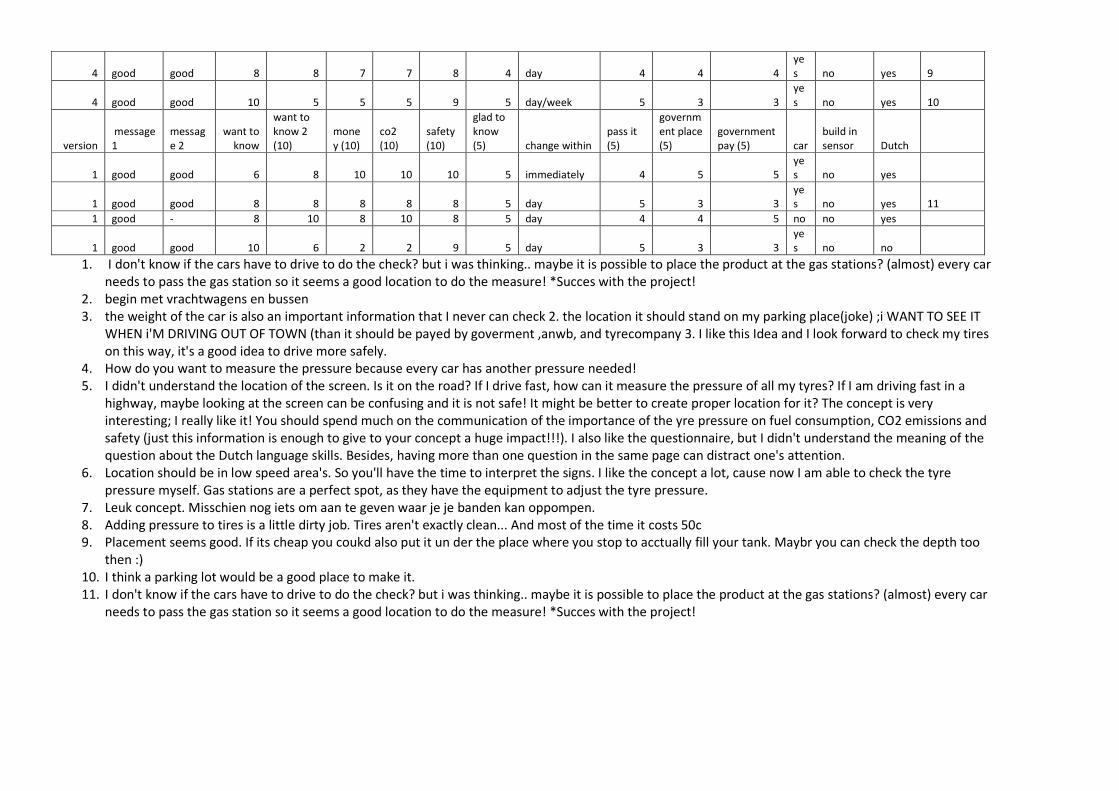
In order to understand, bridge and access the gap between the actors and regulator, a questionnaire was send. ! e goal of the questionnaire was to evaluate if people accept the concept, if they appreciate the concept, the e" ect of the concept (if it leads to the intended behaviour) and if people understand the concept. ! e questionnaire and the results can be found in appendix 4.
! e main conclusions from the questionnaire are:• People want to know if the pressure of their tyres is correct, if they know the negative e" ects of under or over in# ation the importance of knowing the condition increases. • Safety scores as the highest reason to change the pressure, less CO2 emission and saving money also score quite high but it di" ers per person.• Most people say that they want to know their condition of the tyre, even if they are in a hurry to work• Most people say they would change the pressure within one day• Almost all people want to pass the check if it is possible without losing time• ! e people are divided if the government should place it and pay for it• For the location a parking lot and gas stations (near the gas pump) were mentioned. • One person was very negative but in the comments she mentioned that pumping air into the tyre is a very dirty job and it cost 50 euro cents (see ‘control believes’ in next section)• Everybody, even the non English speaking people understood the product. But when four tyres are orange the concept is not understood by everybody (1 wrong out of 18, 1 was not sure, 1 answer not clear)
In short, the concept it appreciated a lot and everybody understood the message of the concept. Four orange wheels are in some rare cases still a bit confusing, this should be improved. ! e intention is to change the tyre within one day. Safety is the most important reason to check and change the tyre pressure.
5.1.2 Stimulate behavior
BandOk shows people if the level of the pressure of their tyres is alright; this should evoke people to change their tyre pressure. BandOk is about creating awareness, not about forcing (f.i. by not allowing them to drive any further). But it is important that BandOk stimulates the user to change the pressure. In order to analyze to what extend the behaviour is evoked with our concept (compared to nowadays) and in order to make the con-cept more persuasive, the ! eory of Planned Behavior (Ajzen, 1991) was applied. According Ajzen human behaviour is guided by three kinds of considerations “behavioral beliefs” (the users own believes) “normative believes”(the users believe of what is the social norm by the community, family, neighbours, etc) and “control beliefs” (the users believes about the presence or absence of factors that are needed or that improve the easi-ness to perform a certain new behaviour). ! ese three considerations lead to the intention of a behaviour which can lead to the actual behaviour [13]. ! e considerations of the current situation were analyst $ rst ($ gure 38). An important reason why many people drive with an incorrect tyre pressure [11], is that people are not aware enough of the negative e" ects and that people perceive checking the tyre pressure and changing the pres- sure as very hard (behaviour and control beliefs). To stimulate the behaviour that people change the tyre pressure some considerations should be removed and some should be replaced. ! erefore communication about the e" ects is of high importance for BandOk. ! e awareness about the
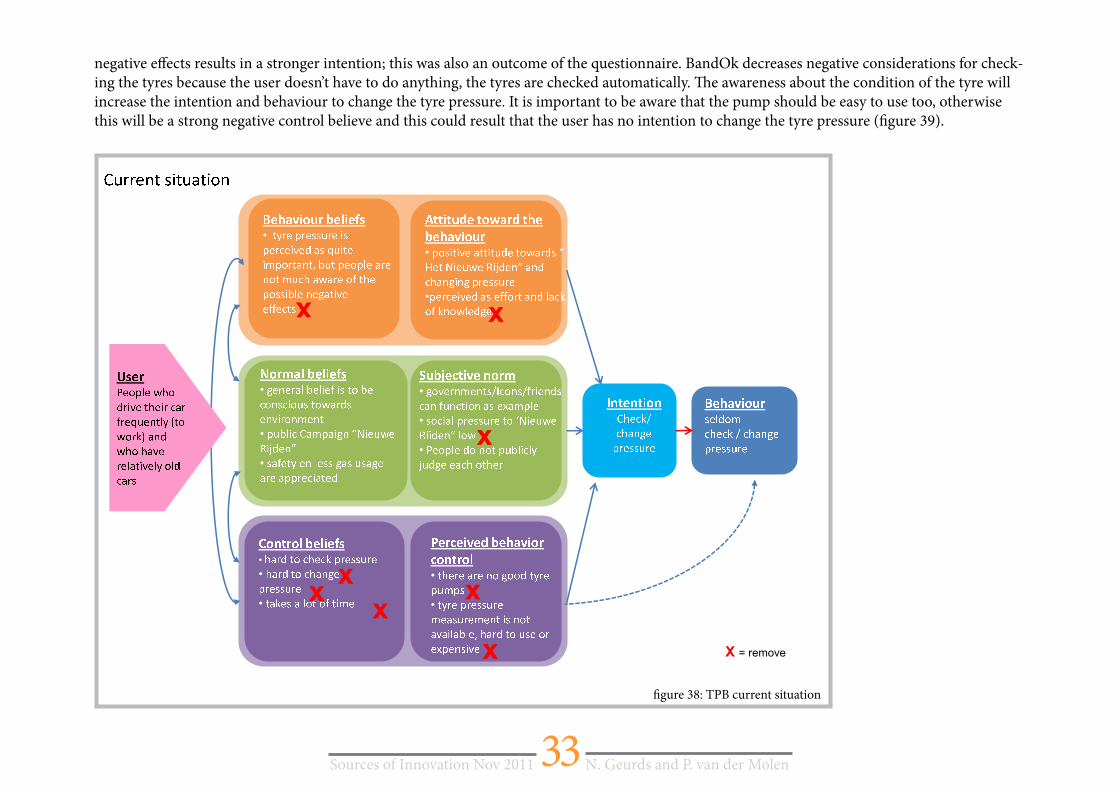
33Sources of Innovation Nov 2011 N. Geurds and P. van der Molen
negative e! ects results in a stronger intention; this was also an outcome of the questionnaire. BandOk decreases negative considerations for check-ing the tyres because the user doesn’t have to do anything, the tyres are checked automatically. " e awareness about the condition of the tyre will increase the intention and behaviour to change the tyre pressure. It is important to be aware that the pump should be easy to use too, otherwise this will be a strong negative control believe and this could result that the user has no intention to change the tyre pressure (# gure 39).
xy z {|}~ � � }� � ~�� �� }� � }�� � ���� }� � }� � �� � � ~� ~� � � � � �� � ~ � �� }� }� � � �� }�� ~ � �� �� �� z �� � �� � { � z � � z �y
•
�� � }�� }� � �� }� �� }� � }�� }� � � � � � � }�� � ~� � � � �� � � � � }~ � � }�� }� ~ � � � � � � � �� }~ � � � }� ~ � � � � � }� } � � �� }}� � }� � �¡¢ ¢ � ¢ � £ z ¢ � ¤� { £ ¢ � z� z �� � �� � {
•
¥ ¦ § ¨© ¨ª « ¬© © ¨© ® « © ¦ ¬ ° ® § ±² }� ³ � }� � }´ � µ � }� ¶ ¬ · ®� � � � � � �� }� � �� }
•
� }� � }�� }� � � }� � ~� � � � � � � � �~ � � � ~ � � }� }¸ � { ¹� � � z � � z �y
•
}� }� � � � }� � }� � � � ~ � }� ~ � � � � ~ � � � ~ � �� � �}�� �� ~ � � }� �
•
� º » ¼ ½ ¬ ¾ ¥ ¬ ¨¿ · ± ³ � }� � }´ � µ � }� ¶
•
� � � }�� }� � }� � � � � � � }�� }� � �� }� � � � }�À � � Á z  ¢ � � z Ã� { ¹
•
~� }� � � }� � � ÄÅ � ~ � � Ä �� � }� � �� � � � � � � � � ~ � � � }Æ � � � � }•
� ~ � � � � �� }� � �� }© ¦ Ç ³ � }� � }´ � � � }� ¶ » ¦•
ÈÉ Ê Ë Ì É Í Ê Î Ê Ï Ë Ð Ñ Ì ÒÓ ÌÔµ � � } }� � � ~ � � }� � z � � � �� � {� }� � ~�� � }� � Ä � � � � }�� }� � �� }
Õ� Ã ¢ {� � � z � � z �y•
� �� � � ~ � � }� � �� }� � �� }•
� �� � � ~ � � � � }�� }� � �� }•
� � � }� � � ~ � ~ � � � � } Ö z {  z � � z £ � z � � � �� {Â� à ¢ {� �•
� � }� }�� }� ~ ~ ~ � �� � }� � � � �•
�� � }�� }� � �� }� }� � �� }� }� � � � � ~ ��� � � � � � � }� � �� � � ~ � � }~�}Æ � }� � �� }× }� �� � ~� Å � � � �ØÙ ÚÙ Ù Û ÜÝ Ú ÞÙ ßÝ à á â Þ Ù â Þã ä ÛÝåæ Ý ä Þ çÝ à ÚÙ à è ä à Ûã éêÝ á ë à ë Þ äÙ æ Ù Ú ì í îï ë ã ÞÝð ë æ Û äæ ñ äæ ì í îï ë ã ÞÝ äæ ñÙ Ù Ûï ë ò
óô õ õ ö ÷ øù ú øô û ø úü ÷
x x
X = remove
x
x
x
x
x
x
ý à ¢ z à ¢ �� Ãþ ÿ É Ó � �� � � � }�� }� � �� }
# gure 38: TPB current situation
34Sources of Innovation Nov 2011 N. Geurds and P. van der Molen
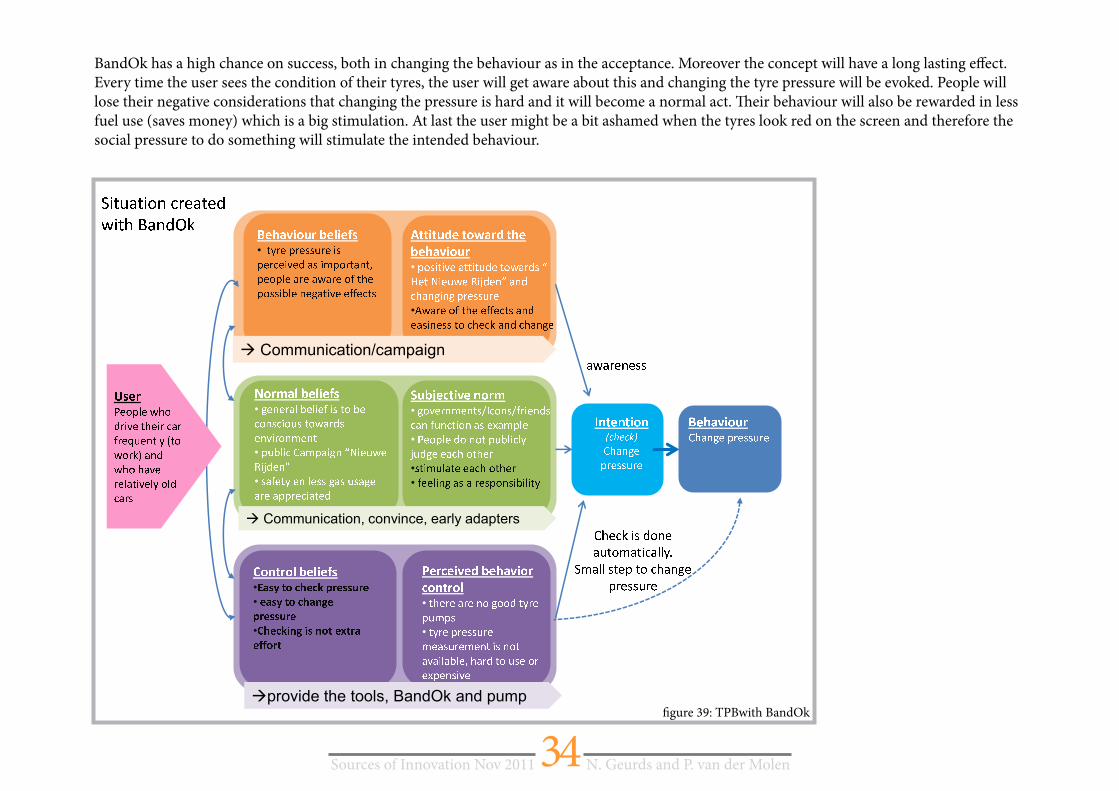
BandOk has a high chance on success, both in changing the behaviour as in the acceptance. Moreover the concept will have a long lasting e! ect. Every time the user sees the condition of their tyres, the user will get aware about this and changing the tyre pressure will be evoked. People will lose their negative considerations that changing the pressure is hard and it will become a normal act. " eir behaviour will also be rewarded in less fuel use (saves money) which is a big stimulation. At last the user might be a bit ashamed when the tyres look red on the screen and therefore the social pressure to do something will stimulate the intended behaviour.
�� � ��� � � � � � � �� � � � � �� � ���� � � � � � � � � � �� �� � � � � � � � � �� �� � � � �� � � � � �� �� � �� !" # � $ � % ! � &�
•
�� � � � � � � � � � � � � � � � �� � � � �' �� � � � �( � � � �� � � � �� � � � � � � � � � � ) � � � * � � � � � � � �� � � � +, , ! , # - � , " .� � - , � �$ � � � !" # �
•
/ 0 1 23 24 5 63 3 237 8 5 3 0 9 6 : 8 1 ;< � � = � � � �� > � ? � � @ 6 A 8� � � � * � � * � � � � �� �
•
B � �� � � � � � � � � �� � � � � � � � � � � � � � � � � � � � � � � � � � � *�C " � D� % $ � % ! � &�
•
*� � � � � ) � � � � � � � � ) �� � � � � � � � � � � � �� �� �� �� � �' � � �
•
7 E F 2G H 6 I / 6 2J A ; = � � � ��> � ? � � @
•
� � �� �� � � � � � * � � � � � * ��� � � � � � � � � � K # $ L � M , ! � N" � D
•
* �� � � � ' � � � � OP � � � � O �� � � � �� � � � � � � � � � � � � � Q �' �•
� � � � � � � � � ) � � �? � * � � � � � � � � � �•
R S TU V WX SY Y X Z [\ S [ Y ]•
�� � � � * � � � � � � � � � � ) � � ��
^" N , �" % $ � % ! � &�•
_ a b cd e fg e hi jg a a k jg•
g a b cd e f l mgi jg a a k jg•
n fg e h o l m o a l d c g p c jg q qd j c r � � M � ! � - $ � � � !" �M" N , �" %•
� � � � � � � � � � * � � �� � � � ' �•
�� � � � � � � � � �' � � � �� � ' � � � � � � � ��� � � � ) � ( � �� � � � � � ��� Q � � � � � �
s � � �� � �� P � � � �tu vu u w xy vz u {y | } ~ z u ~ z� � w y�� y � z �y | vu | � � | w� ��y } � | � z �u � u v� � �� �� z y� �� w �� � �� � � �� �� z y �� �u u w� � �
� �� � �� �� � � � � � � � �� �� �� � � �� �
� N , � N , !" N ¡ ¢£ ¡ ¤ ¥¦ � � � *�� � � � � � �
à Communication/campaign
à Communication, convince, early adapters
àprovide the tools, BandOk and pump
� � �� !" # �§ [X ©Y ª ]Y R R V ]Y « ¬ ® °± ²³ µ ¶ ·³ µ · ° ® µ ¹ ¹º»¼ µ ¹ ¹ ± · ½ ·³ ® ¬ µ ¾½ ¿ ± ± ¶ ¿
µ À µ ¿ ± ±
# gure 39: TPBwith BandOk
35Sources of Innovation Nov 2011 N. Geurds and P. van der Molen
5.3 Innovation process and future
" e concept BandOk is still under development and should be worked out in detail while enhancing the user in the design process. A# er a ! rst “in use proto-type” a media campaign should be started. " is will communicate the idea of the concept, increase the awareness of the negative e$ ects of the wrong pressure in the tyre and stimulates the intended behaviour. BandOk can be placed on several places in the Netherlands. In the future it can be integrated in the asphalt next to the fuel pump, so while refuelling the car the tyre is automatically re! lled too. More research is needed before this would work. BandOk focuses right now on personal cars, in the further it could also be designed for other devices like trucks, motors and caravans. " e whole concept (the product and the campaign) can be exported to other countries. BandOk is focussed on the current situation on the road. In twenty years most cars contain a build in pressure measurer [9]. " erefore the concept should be realised quick. Since the concept is not that hard to build it is feasible to have a working concept in one year. It should be dis-cussed in the future if the concept stays as an extra sign to increase awareness about the tyre pressure or whether the components of the products will be used for something else. Since the product is build out of many standard components the maintenance and renewing of the concept is easy done.BandOk has two potential further innovation paths. One is the adaptable tyres pressure. Currently the pressure is measured by comparing pressure, relying on a ! gure given by the manufacturer. BandOk measures the tyre pressure speci! c to the context (weather, load, condition tyre, kind of car, etc). Since the tyre will be adjusted to speci! c situations less fuel is used and safety is increased." e second future innovation path is personal feedback while driving (! gure 40, next page). " is can for instance be about if the light are working, the emission of the car or alertness of the users. " e driver receives personal information which will increase the safety on the road.
5.4 Business model Several actors gain bene! t from the concept (section 5.1). " erefore collaboration between several parties is considered as the best option. " e government can ! nancially support the concept because it increases safety and decreases fuel and exhaust. " e gas station could pay for it to attract more customers (for fuel and pressure pump) and to increase its image. A tyre company like Vredestein could be involved as sponsor because its image will be increased as well. ANWB and VVN can help communicating the concept. Since BandOk is partly made of standard components, which can be used in other products, the costs decreases. " e research and investment for BandOk can also be used for other products. " e product is self sustaining so it saves money of installing cables to connect to the screen and the overall energy network.
���������� � ����������
�������������������������������������� � ��������������� ����������������������������� ���� �� ��������������� �������������
������������� ������������������������������������ ��
�������
��������� ������������������ ����� ������������� � �������
���� ����������� ��������������������� ����!���"#����� ��� �������������� � ����� ��$���������������
��������� ���� �����
%������������� &��������������������������� ��������������
�������� �����
'����� � ������� ������������ ������������������������������������
(���� ������������$�������������������������� �
�������� ��� ������ �$������������������������ ����� � ��� �
)������ ������������������� �
* ������������������������� �
�
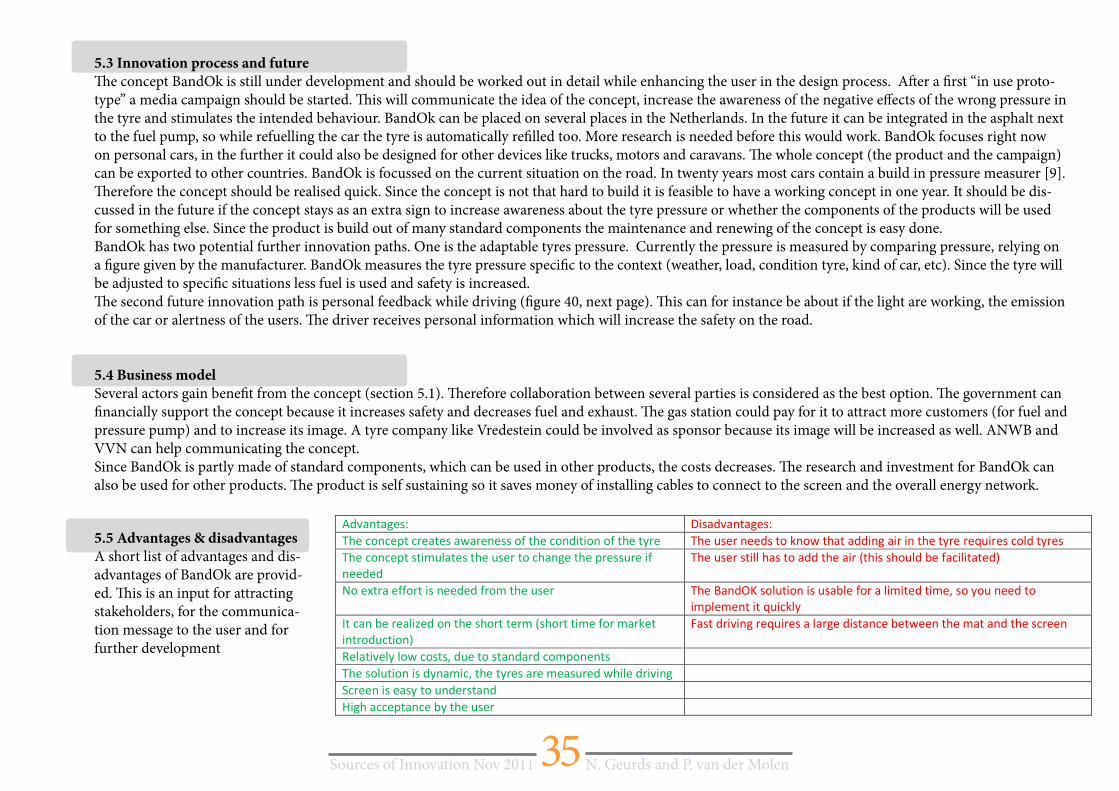
5.5 Advantages & disadvantages
A short list of advantages and dis-advantages of BandOk are provid-ed. " is is an input for attracting stakeholders, for the communica-tion message to the user and for further development
36Sources of Innovation Nov 2011 N. Geurds and P. van der Molen
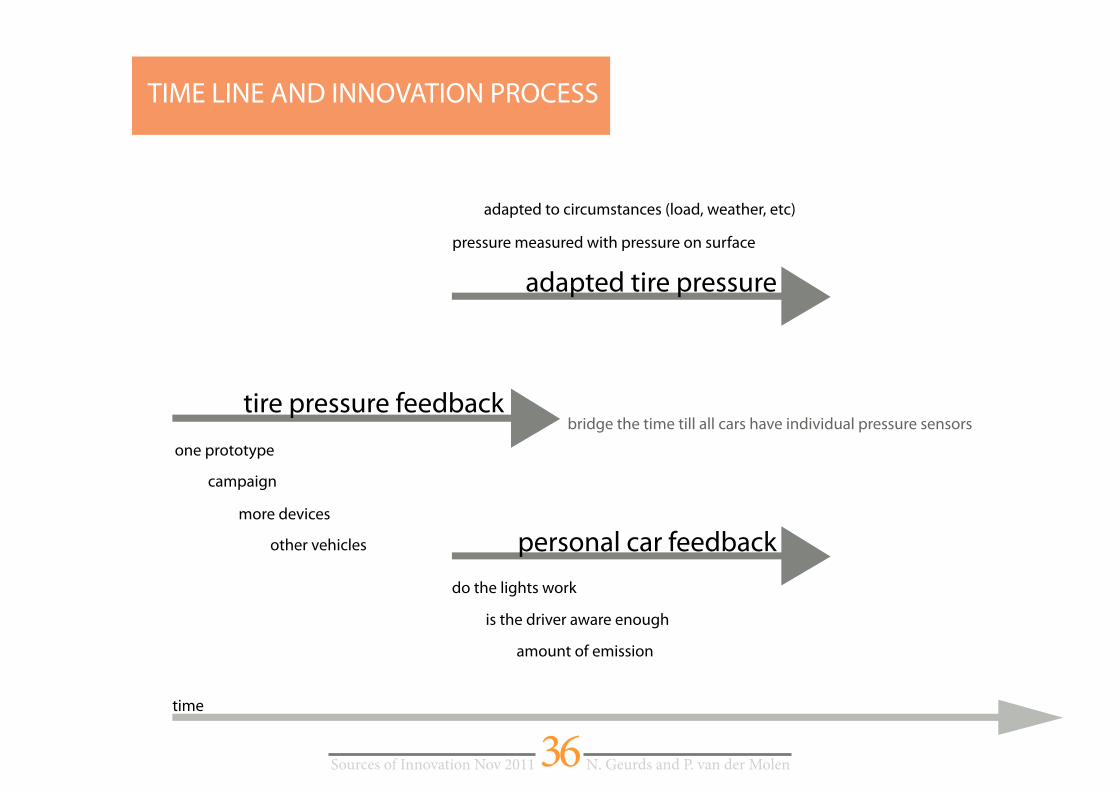
adapted tire pressure
personal car feedback
tire pressure feedback
one prototype
more devices
other vehicles
campaign
do the lights work
is the driver aware enough
amount of emission
pressure measured with pressure on surface
adapted to circumstances (load, weather, etc)
TIME LINE AND INNOVATION PROCESS
bridge the time till all cars have individual pressure sensors
time
37Sources of Innovation Nov 2011 N. Geurds and P. van der Molen
6.1 Conclusion
As explained in chapter four, the right tyre pressure saves up to 10 percent fuel and increases safety. Saving fuel means also saving emission, as a result the right tyre pressure makes the use of a car more sustainable.
An important reason why many people drive with an incorrect tyre pressure is that people are not aware enough of the negative e! ects. Also they perceive checking the tyre pressure and changing the pressure as very hard.
" e BandOK concept involves an innovative solution to measure the pressure of a car tyre. " e force of the wheel on the road combined with the shape of the tyre can tell whether the pressure is right or not. " e user can simply drive over the sensors, which send the information to the solar powered LED screen, where he or she can see the status of the tyres.
Driving over a mat with piezo sensors that measure the force of the tyres on the sensor is an innovative principle in the tyre measuring market. According to the de# nition of innovation from Everett M. Rogers’ Di! usion of innovations theory, an innovation is ‘an idea, practice, or object that is perceived as new by an individual or other unit of adoption’. In this case the piezo technology to measure tyre pressure combined with the feedback screen is the idea or object that is perceived as new by the driver and the tyre measuring market, which is another unit of adoption.
" e promise of BandOk is to increase safety, drive cleaner, drive cheaper. But this can only be achieved when the people actually change the tyre pressure. To increase the acceptance for the user to concept needs to be communicated clearly. Results of the user evaluation show that people understand the concept and have the intention to change the tyre pressure, with safety as the most important motivator.
6.1.1 Testing requirements
" e requirements as described in chapter two are almost all met. " is is because two requirements are not met. " ey are a result of the ‘go with the $ ow’ search area, which is not directly related to the BandOK system and is derived from the ‘on the safe side’ search area.
Chapter 6: Conclusions & recommendations
In this chapter the conclusions and recommendations for this project are discussed. " e conclusion gives a brief overview of the project outcomes, including the testing of the requirements. " e recommendations explain the next possible steps in the design trajectory.
38Sources of Innovation Nov 2011 N. Geurds and P. van der Molen
! e requirements below, from chapter three, need to be tested in the next design phases:• ! e solution is visible/understandable for all drivers from the " rst time• ! e solution should be accepted by the user• ! e sensors on the road should not nuisance the driver• Cars of di# erent sizes should all obtain feedback about their tyre• Drivers who do not drive in the middle of the road should obtain feedback too• It should be clear for whom the message of the tyres is• All drivers should be able to understand the concept, including 50 % of non Dutch speaking drivers
! e last requirement ‘the concept should be able to stand alone and thus be self sustaining’ is also met. Part of the piezo sensors are used to gener-ate energy for the calculations and data transmitting. ! e pole of the LED screen has PV modules included. ! erefore the concept is completely self sustaining.
6.2 Recommendations
! e BandOK concept is designed up to embodiment level and is ready for prototyping. Prototypes are needed for functional tests, but also for tests on usability. During the prototyping and testing process, the research on modularity and product families, as explained with the platform driven product development method, can continue so that modules can be speci" ed and selected.
To extend the product families and other functionalities of the concept, the TRIZ method could be applied again. ! is is useful when a new cycle of developing a product is started, or when the BandOK concept is updated/redesigned. Before starting with new ideas, a product use analysis is advisable. As explained in the DIM model, the product use of an existing product can be the starting point for the new product.
For the technical design of the product more engineering is needed. Calculations to select the right components for the mat, testing, measuring, calibrating the right values for the piezo sensors also need to be done. ! e communication between mat and the screen needs to be tested and cali-brated as well. Calculations on energy supply are also a must. Besides that, materials for the mat itself, the pole and screen need to be selected.
When is decided that the product is going to be produced and marketed, the design of the marketing campaign should also begin. It is important to inform the driver before the product is implemented so they recognize it when they see it for the " rst time. Especially when the concept is part of the ‘Het Nieuwe Rijden’ project, marketing campaigns are essential to the build name and the brand.
39Sources of Innovation Nov 2011 N. Geurds and P. van der Molen
References[1] Studio Roosegaarde, http://www.studioroosegaarde.net/info/pro! le, 2011, accessed 27 sept. 2011)
[2] Wikipedia, http://nl.wikipedia.org/wiki/People_Planet_Pro! t, 2011, accessed 30 sept. 2011
[3] Longman Dictionary of Contemporary English, 3rd edition, Longman Dictionaries, 1995, Essex, England
[4] Wikipedia, http://en.wikipedia.org/wiki/Highway, 2011, accessed 30 sept. 2011
[5] Everett M. Rogers, Di" usion of innovations, # e Free Press, NY, 1962, 5th Ed. 2003
[6] ANWB, http://www.anwb.nl/auto/dagelijks-rijden/zuinig-rijden,/het-nieuwe-rijden.html, 2011, accessed 3 oct. 2011
[7] Het Nieuwe Rijden, www.hetnieuwerijden.nl, 2011, accessed 3 oct. 2011
[8] Band op Spanning, http://www.bandopspanning.nl/band-op-spanning/, 2011, accessed 7 oct. 2011
[9] Interview with expert, experienced mechanic of Hermans Autoservice Enschede, 18 oct. 2011
[10] Interview with expert, experienced mechanic of Kwik-! t Enschede, 18 oct. 2011
[11] Bridgestone Tyre Safety, http://tyresafety.eu, 2010, accessed 11 oct. 2011
[12] Rene Jolly, Statline, http://www.cbs.nl/nl-NL/menu/themas/natuur-milieu/publicaties/artikelen/archief/2005/2005-1680-wm.htm source, 2005, accessed 2011
[13] Ajzen, I. (1991). # e theory of planned behavior. Organizational Behavior and Human Decision Processes, 50, 179-211
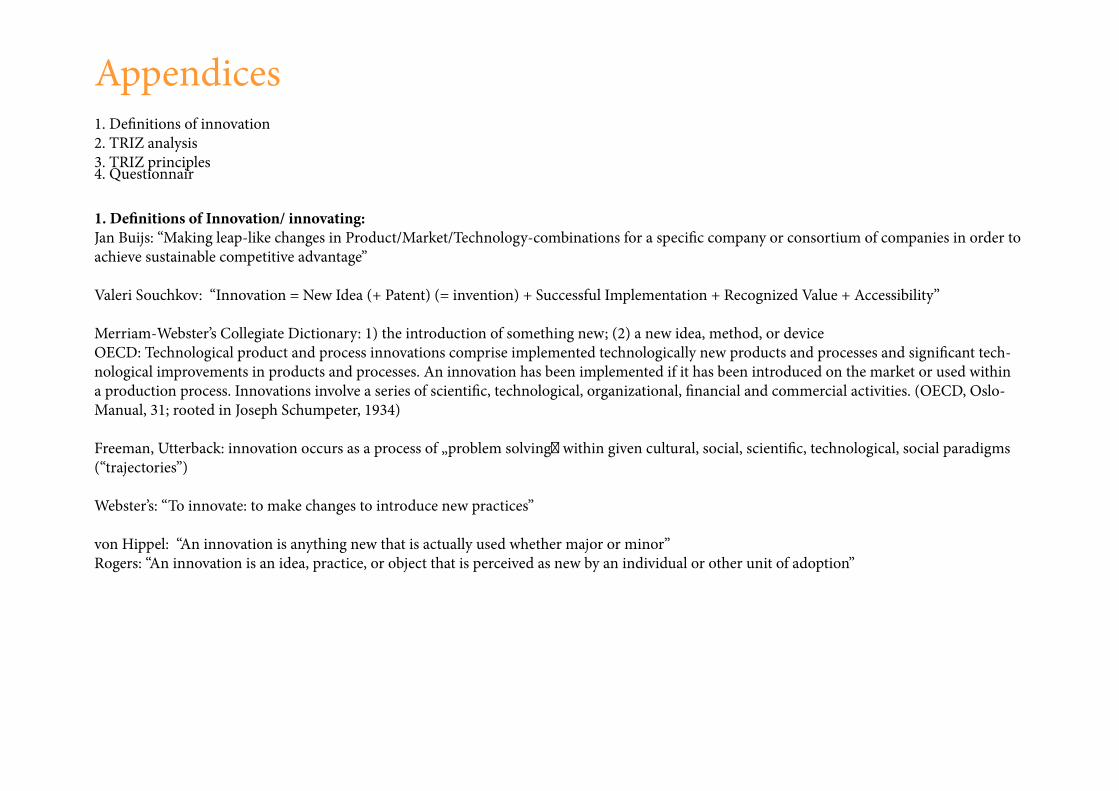
1. De� nitions of innovation2. TRIZ analysis3. TRIZ principles
Appendices
1. De� nitions of Innovation/ innovating:
Jan Buijs: “Making leap-like changes in Product/Market/Technology-combinations for a speci� c company or consortium of companies in order to achieve sustainable competitive advantage”
Valeri Souchkov: “Innovation = New Idea (+ Patent) (= invention) + Successful Implementation + Recognized Value + Accessibility”
Merriam-Webster’s Collegiate Dictionary: 1) the introduction of something new; (2) a new idea, method, or deviceOECD: Technological product and process innovations comprise implemented technologically new products and processes and signi� cant tech-nological improvements in products and processes. An innovation has been implemented if it has been introduced on the market or used within a production process. Innovations involve a series of scienti� c, technological, organizational, � nancial and commercial activities. (OECD, Oslo-Manual, 31; rooted in Joseph Schumpeter, 1934)
Freeman, Utterback: innovation occurs as a process of „problem solving! within given cultural, social, scienti� c, technological, social paradigms (“trajectories”)
Webster’s: “To innovate: to make changes to introduce new practices”
von Hippel: “An innovation is anything new that is actually used whether major or minor”Rogers: “An innovation is an idea, practice, or object that is perceived as new by an individual or other unit of adoption”
4. Questionnair
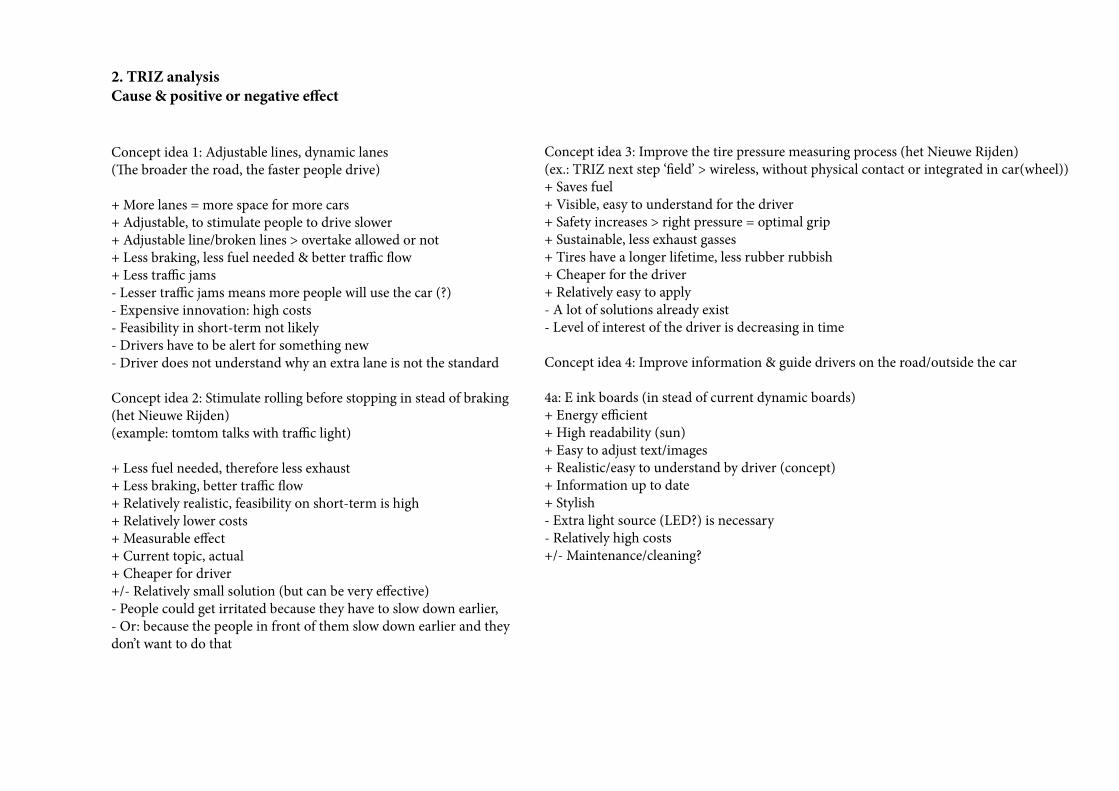
2. TRIZ analysis
Cause & positive or negative e� ect
Concept idea 1: Adjustable lines, dynamic lanes(� e broader the road, the faster people drive)
+ More lanes = more space for more cars+ Adjustable, to stimulate people to drive slower+ Adjustable line/broken lines > overtake allowed or not+ Less braking, less fuel needed & better tra� c � ow+ Less tra� c jams- Lesser tra� c jams means more people will use the car (?)- Expensive innovation: high costs- Feasibility in short-term not likely- Drivers have to be alert for something new- Driver does not understand why an extra lane is not the standard
Concept idea 2: Stimulate rolling before stopping in stead of braking (het Nieuwe Rijden)(example: tomtom talks with tra� c light)
+ Less fuel needed, therefore less exhaust+ Less braking, better tra� c � ow+ Relatively realistic, feasibility on short-term is high+ Relatively lower costs+ Measurable e� ect+ Current topic, actual+ Cheaper for driver+/- Relatively small solution (but can be very e� ective)- People could get irritated because they have to slow down earlier, - Or: because the people in front of them slow down earlier and they don’t want to do that
Concept idea 3: Improve the tire pressure measuring process (het Nieuwe Rijden)(ex.: TRIZ next step ‘" eld’ > wireless, without physical contact or integrated in car(wheel))+ Saves fuel+ Visible, easy to understand for the driver+ Safety increases > right pressure = optimal grip+ Sustainable, less exhaust gasses+ Tires have a longer lifetime, less rubber rubbish+ Cheaper for the driver+ Relatively easy to apply- A lot of solutions already exist- Level of interest of the driver is decreasing in time
Concept idea 4: Improve information & guide drivers on the road/outside the car
4a: E ink boards (in stead of current dynamic boards)+ Energy e� cient+ High readability (sun)+ Easy to adjust text/images+ Realistic/easy to understand by driver (concept)+ Information up to date+ Stylish- Extra light source (LED?) is necessary- Relatively high costs+/- Maintenance/cleaning?
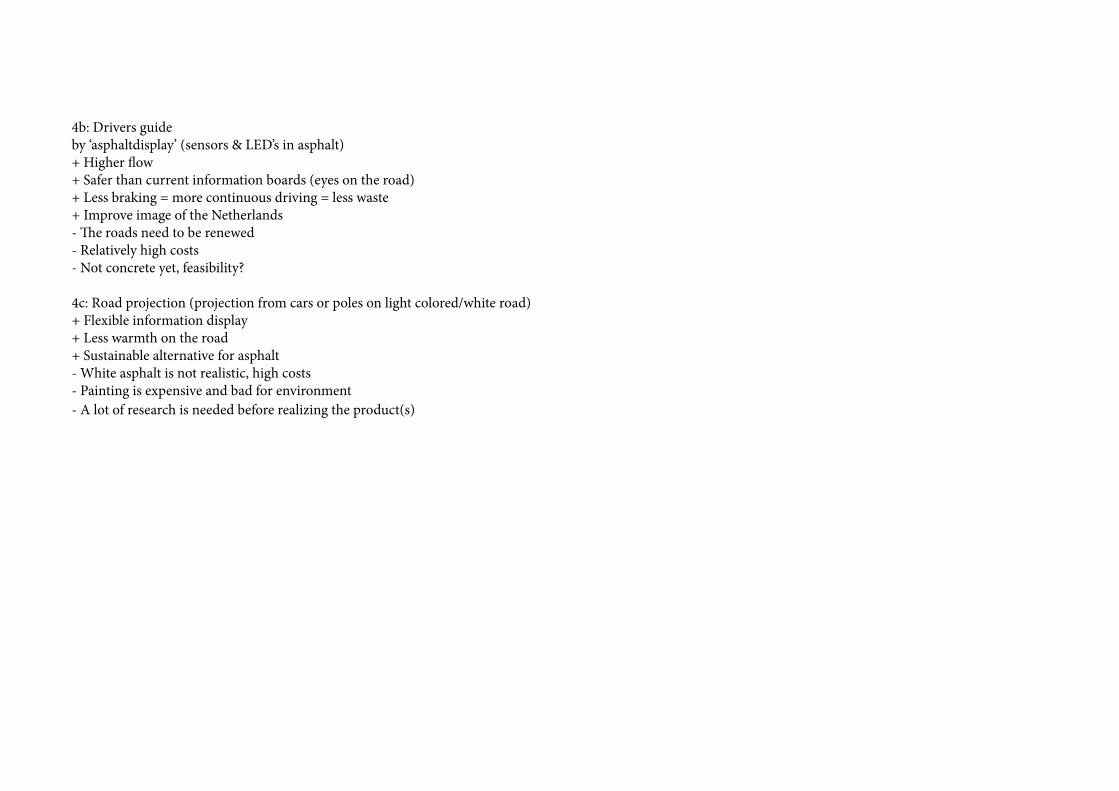
4b: Drivers guide by ‘asphaltdisplay’ (sensors & LED’s in asphalt)+ Higher � ow+ Safer than current information boards (eyes on the road)+ Less braking = more continuous driving = less waste+ Improve image of the Netherlands- � e roads need to be renewed- Relatively high costs- Not concrete yet, feasibility?
4c: Road projection (projection from cars or poles on light colored/white road)+ Flexible information display+ Less warmth on the road+ Sustainable alternative for asphalt- White asphalt is not realistic, high costs- Painting is expensive and bad for environment
- A lot of research is needed before realizing the product(s)
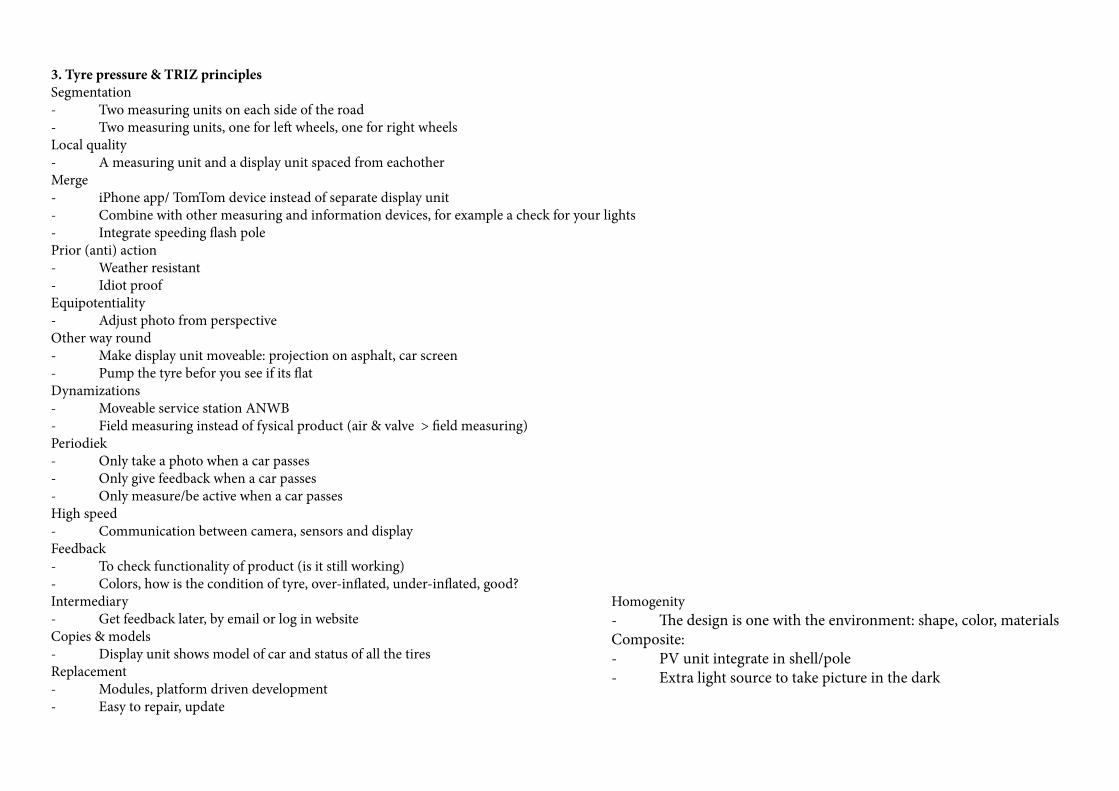
3. Tyre pressure & TRIZ principles
Segmentation - Two measuring units on each side of the road- Two measuring units, one for le� wheels, one for right wheelsLocal quality- A measuring unit and a display unit spaced from eachotherMerge- iPhone app/ TomTom device instead of separate display unit- Combine with other measuring and information devices, for example a check for your lights- Integrate speeding � ash polePrior (anti) action- Weather resistant- Idiot proofEquipotentiality- Adjust photo from perspectiveOther way round- Make display unit moveable: projection on asphalt, car screen- Pump the tyre befor you see if its � atDynamizations- Moveable service station ANWB- Field measuring instead of fysical product (air & valve > � eld measuring)Periodiek- Only take a photo when a car passes- Only give feedback when a car passes- Only measure/be active when a car passesHigh speed- Communication between camera, sensors and displayFeedback- To check functionality of product (is it still working)- Colors, how is the condition of tyre, over-in� ated, under-in� ated, good?Intermediary- Get feedback later, by email or log in websiteCopies & models- Display unit shows model of car and status of all the tires Replacement- Modules, platform driven development- Easy to repair, update
Homogenity
- � e design is one with the environment: shape, color, materialsComposite:- PV unit integrate in shell/pole- Extra light source to take picture in the dark
4. Questionnaire
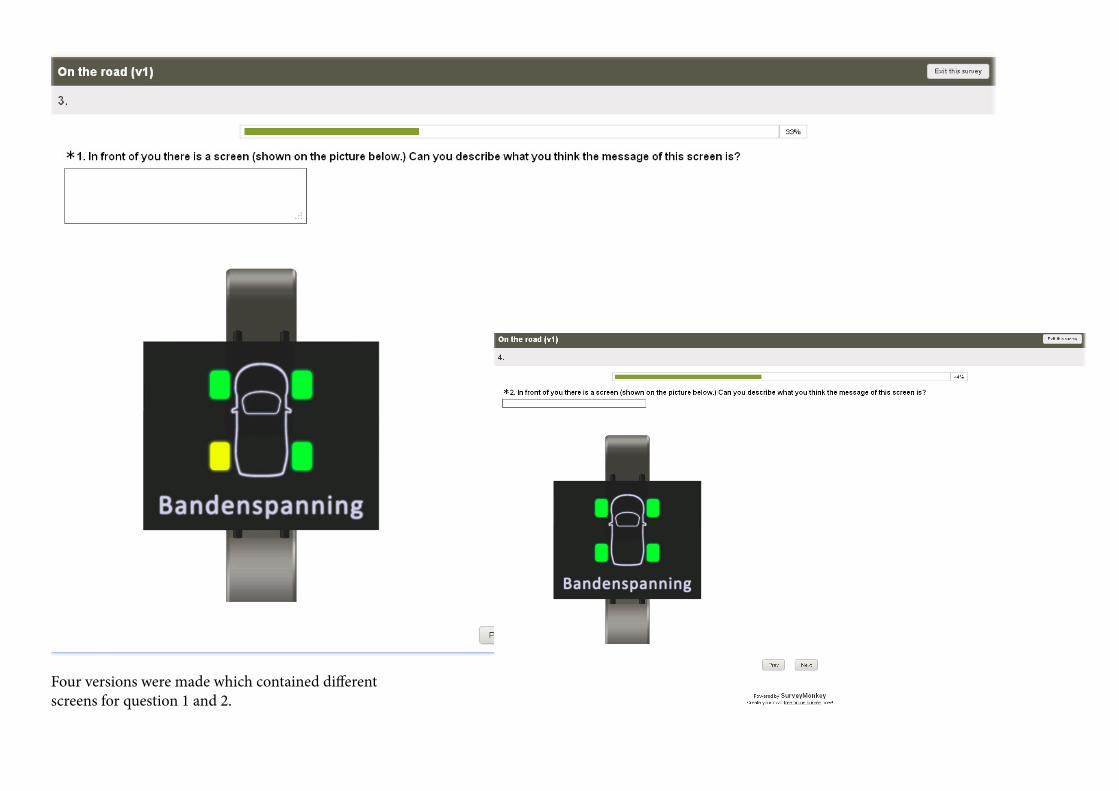
Four versions were made which contained di� erent screens for question 1 and 2.
��������
�������
��
������
�
����
���
�����
�������
����� �
�����
���
�������
�� �
�����
������
�����
�������
�����
���� �������������
�������
����
������
���������
����
����������
������� ���
���������
������� ������
������
�� �
�� ����� ����� !� "� ��� ��� ��� �� ��������� #� �� ��
��
�� ���� ���� �
�� ����� ����� "� "� "� "� "� �� ��� �� $� $�
��
�� ���� ���� ��
�� ������ %� "� ��� "� ��� "� �� ��� #� #� �� ��� ���� ���� �
�� ����� ����� ��� !� � � &� �� ��� �� $� $�
��
�� ���� ��� �
� ����� ����� !� '� !� '� '� #� ����� $� � �
��
�� ���� ���� �
� ����� ����� ��� ��� '� "� ��� �� ��������� �� �� ��
��
�� ���� %� $�
� ����� ����� ��� ��� &� &� ��� �� ��� �� �� #�
��
�� ���� ���� �
� ����� ����� ��� !� "� '� ��� �� ��� � � ��
��
�� ���� ���� �
� ����� ����� ��� ��� ��� ��� ��� �� ��������� �� �� �� ��� ���� ��� �
$� �����
��������
����
�����
������ ��� '� ��� !� ��� #� ��� �� $� $�
��
�� ���� ���� �
$� ����� ����� '� '� '� !� "� �� ����� � � ��
��
�� ���� ���� #�
$� �����
�����(�
)*�
��+����
����
������ &� ��� &� "� ��� � ��� #� #� #� ��� ���� ��� ��
$� ����� ����� ��� ��� ��� ��� ��� �� ��������� �� �� ��
��
�� ���� ���� !�
#� ��������� ����� "� "� "� '� "� #� ��,����� #� � �
��
�� ���� � �
#� ����� ����� #� '� "� '� "� #� ��,����� #� #� #�
��
�� ���� ���� '�
#�
���������
���� �
����� ����� &� ��� ��� ��� ��� $� ��� �� #� #�
��
�� ���� ���� �
#� ����� ����� "� !� #� #� #� $� %� � �� ��
��
�� ���� ���� "�
�� ����� ����� �� �� �� �� �� �� ��� �� �� ��
�� ���� �� �
�� ����� ����� ��� �� �� �� � �� ������ �� �� ��
�� ���� �� ���
�������
�������
��
�����
���
��������
�����
��������
�������
�����
���
������
����
�����
�����
�����
��������
�����
���� � ������� ���
!�������
����
������
���!����
����
���������
!������ ����
"#�������
������ $#�� � �
�� ����� ����� %� �� ��� ��� ��� �� ��������� �� �� ��
�� ���� �� �
�� ����� ����� �� �� �� �� �� �� ��� �� �� ��
�� ���� �� ���
�� ������ &� �� ��� �� ��� �� �� ��� �� �� �� ��� ���� �� �
�� ����� ����� ��� %� �� �� � �� ��� �� �� ��
�� ���� ��� �
�' �(����)����������� ������ ������������������ �� ��*�"#��������� ������''���"�������!����"�����!����� �!���#������� �������������*�����������������
�������!����� ���������������������������������������������� ����#�+�,-#������� �� �!��.��+�
�' "����������� ���������"#����
�' � ���� ������ ������������������!�������������������� ���(���������� ����'�� �������������� �#��������������!�������!����.����/��0123�34�-55�(3�
0652��)7�$8(9(2:�4;3�4<�3402��� ������� �#���"�!���"���������=���"=����������!����'�(������ ���(�������(������������������ ����������
���� �����=���)�����������������������������'�
�' 6�������#������������#��� �!���#��"��#��������� ������� ��!���#�����+�
�' (�����)��#���������� �������������� �����'�(��������� �����*�(��(����������=� �������������#��� �!���#��������������*�(��(����������������������
�� ��=���"������������� ����������"�����#����������������������+�(����� ��"�"������������!��!�����������������*�3 �����!��������
���������/�(������������+�>�#�� �#����!����#� ����� �����#������������� ���!����������� ���!���#������#������#�!����=�?4���������������
������.#���� ��������������������#� ������������#������!���� #����!���+++�'�(����������� �@#���������=�"#��(�����)��#���������� ������������ �
@#�������"�#��� �$#�� �����#���������'�A����=� ����������� ������@#���������� �����!������������������)����������'�
%' B��������� �#���"���������!�����)�'�-���#)��� ���� ������������!���� ������'�(������ �����!�������=���#������(�����"������ ���� ����
!���#������'�:�����������������!������!��=����� � ���� �@#�!���������.#���� ����!���#�'�
�' B#������!�'�7���� �����������������������������.�.�"����������!!��!�'�
�' 1������!���#��������������������������.�"'�3�������)��C���������'''�1������������ ������������������
' D���������������'�(������� �!��#���#��������!#�����#������ �!����� ���#����!��������#����������#������'�7�"���#������ ���� ��!� �����
� ��E��
��' (�� ������!�������������#���"��������!�������������'�
��' (����)����������� ������ ������������������ �� ��*�"#��������� ������''���"�������!����"�����!����� �!���#������� �������������*�����������������
�������!����� ���������������������������������������������� ����#�+�,-#������� �� �!��.��+�