Embed Size (px)
DESCRIPTION
Crystallography and Diffraction. Theory and Modern Methods of Analysis Lectures 9-10 Powder Diffraction Dr. I. Abrahams Queen Mary University of London. Lectures co-financed by the European Union in scope of the European Social Fund. Powder Diffraction. - PowerPoint PPT Presentation
Citation preview
Crystallography and Diffraction. Theory and Modern Methods of Analysis
Lectures 9-10Powder Diffraction
Dr. I. AbrahamsQueen Mary University of London
Lectures co-financed by the European Union in scope of the European Social Fund
Lectures co-financed by the European Union in scope of the European Social Fund
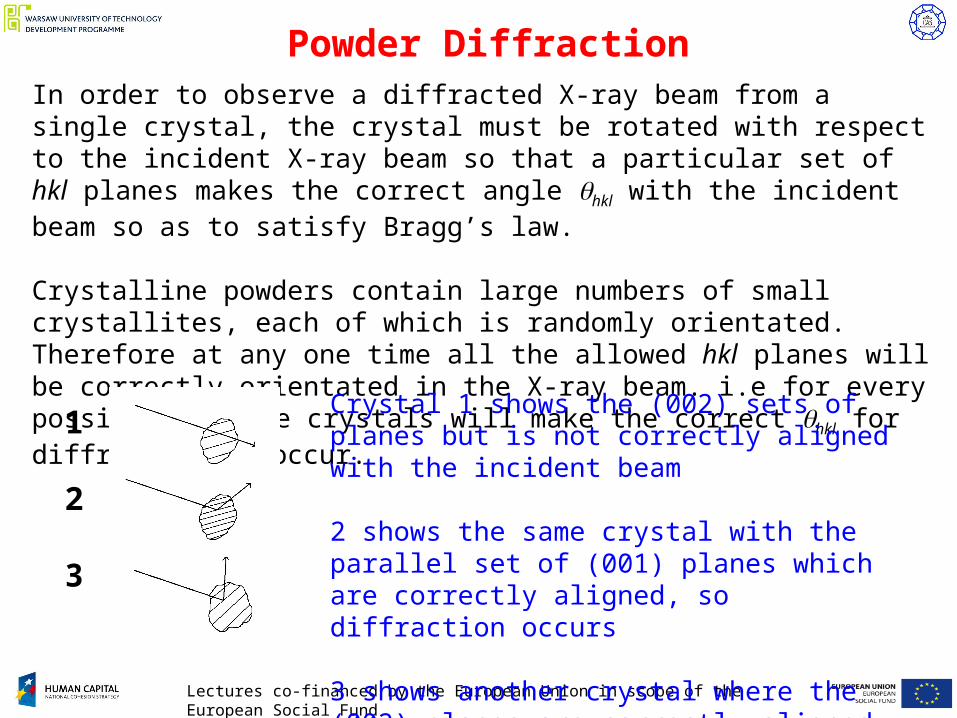
Powder DiffractionIn order to observe a diffracted X-ray beam from a single crystal, the crystal must be rotated with respect to the incident X-ray beam so that a particular set of hkl planes makes the correct angle hkl with the incident beam so as to satisfy Bragg’s law.
Crystalline powders contain large numbers of small crystallites, each of which is randomly orientated. Therefore at any one time all the allowed hkl planes will be correctly orientated in the X-ray beam. i.e for every possible hkl some crystals will make the correct hkl for diffraction to occur.
1
2
3
Crystal 1 shows the (002) sets of planes but is not correctly aligned with the incident beam
2 shows the same crystal with the parallel set of (001) planes which are correctly aligned, so diffraction occurs
3 shows another crystal where the (002) planes are correctly aligned so diffraction occurs.
Lectures co-financed by the European Union in scope of the European Social Fund
Powder Diffractometer
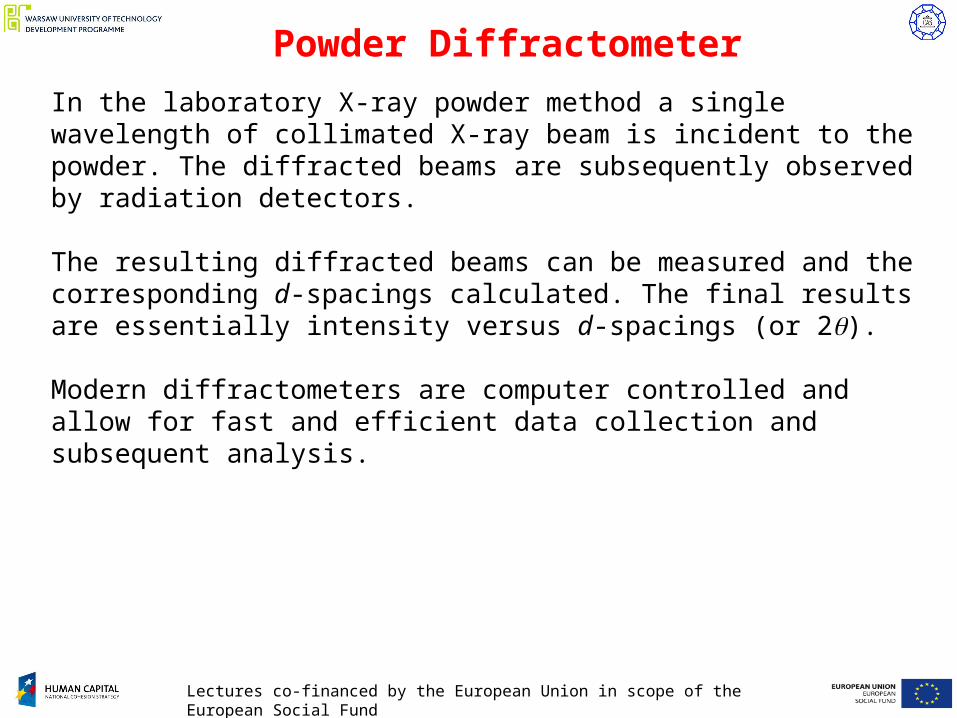
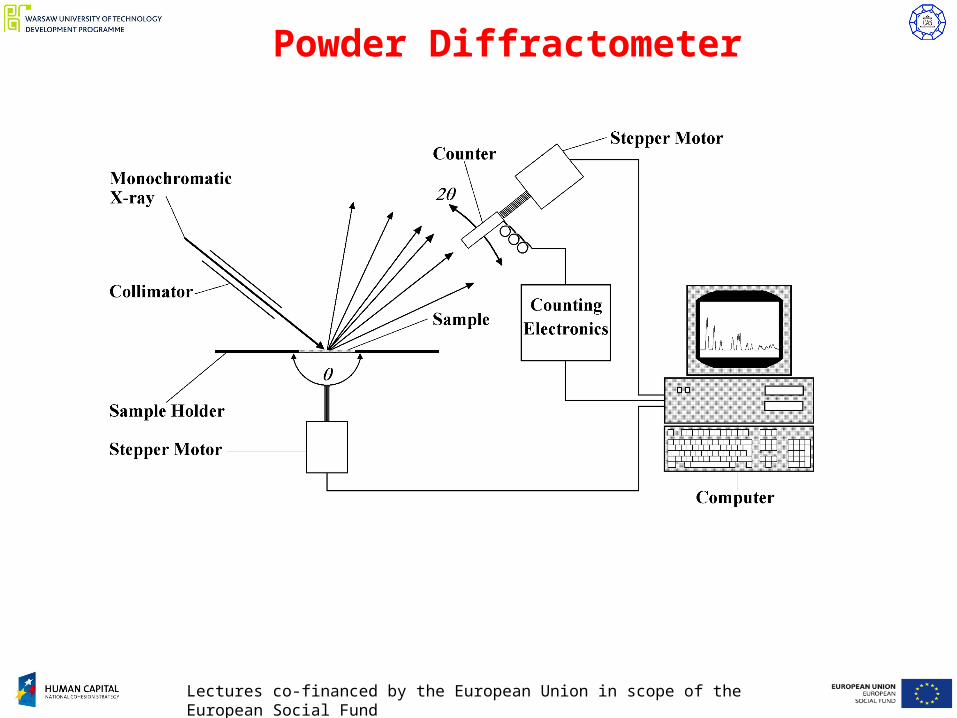
In the laboratory X-ray powder method a single wavelength of collimated X-ray beam is incident to the powder. The diffracted beams are subsequently observed by radiation detectors.
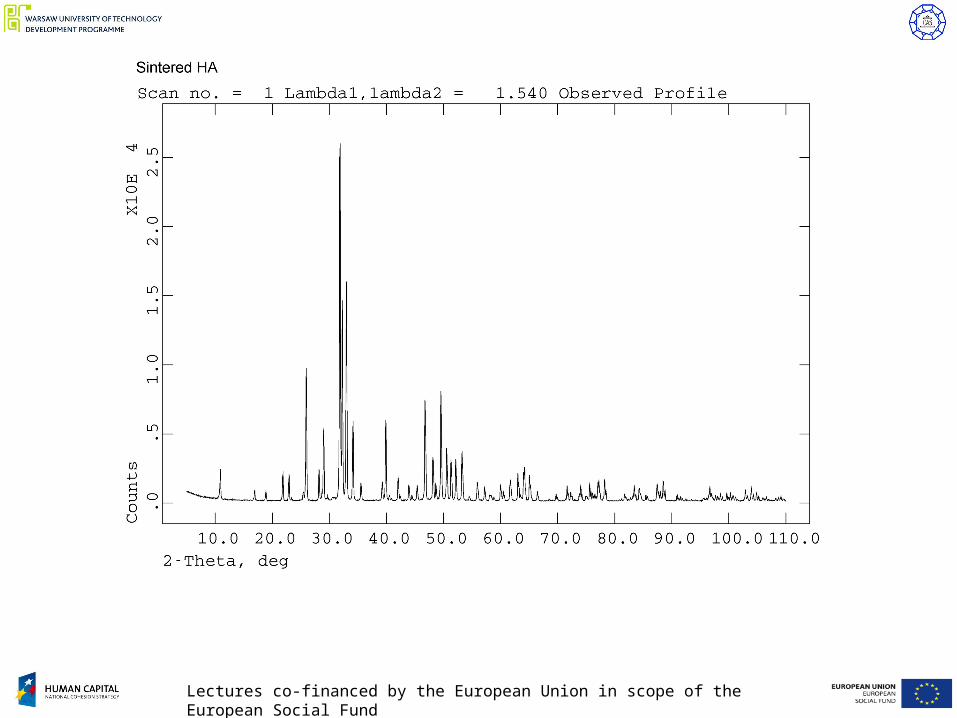
The resulting diffracted beams can be measured and the corresponding d-spacings calculated. The final results are essentially intensity versus d-spacings (or 2).
Modern diffractometers are computer controlled and allow for fast and efficient data collection and subsequent analysis.
Lectures co-financed by the European Union in scope of the European Social Fund
Powder Diffractometer
Lectures co-financed by the European Union in scope of the European Social Fund
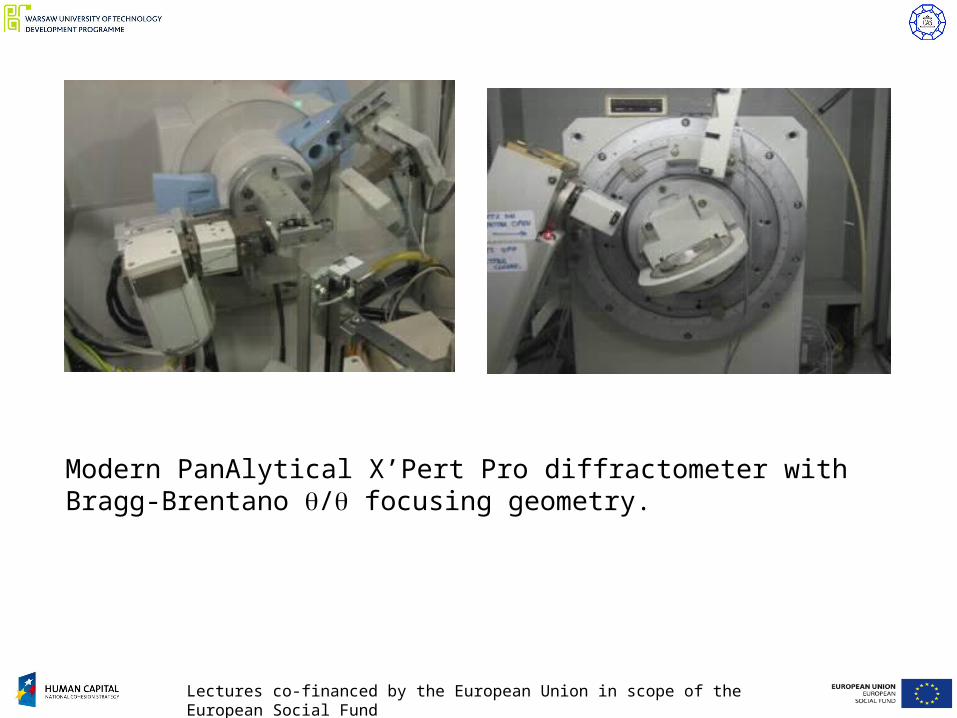
Modern PanAlytical X’Pert Pro diffractometer with Bragg-Brentano / focusing geometry.
Lectures co-financed by the European Union in scope of the European Social Fund

Lectures co-financed by the European Union in scope of the European Social Fund
Powder Neutron Diffraction
Neutrons with wavelengths of around 1 Å can be used for diffraction purposes.
Neutrons are scattered by nuclei and this has important consequences for the nature of the diffraction data obtained.
Symbol n0
Spin 1/2 Actual Mass m = 1.6749 10-27 kg
Actual Charge 0
Some physical properties of thermal neutrons
The de Broglie equation relates to the neutron mass and velocities to wavelength. Therefore, the neutrons generated from reactors or pulsed sources at certain speeds can be in useful ranges for diffraction experiments.
mv
h
Lectures co-financed by the European Union in scope of the European Social Fund
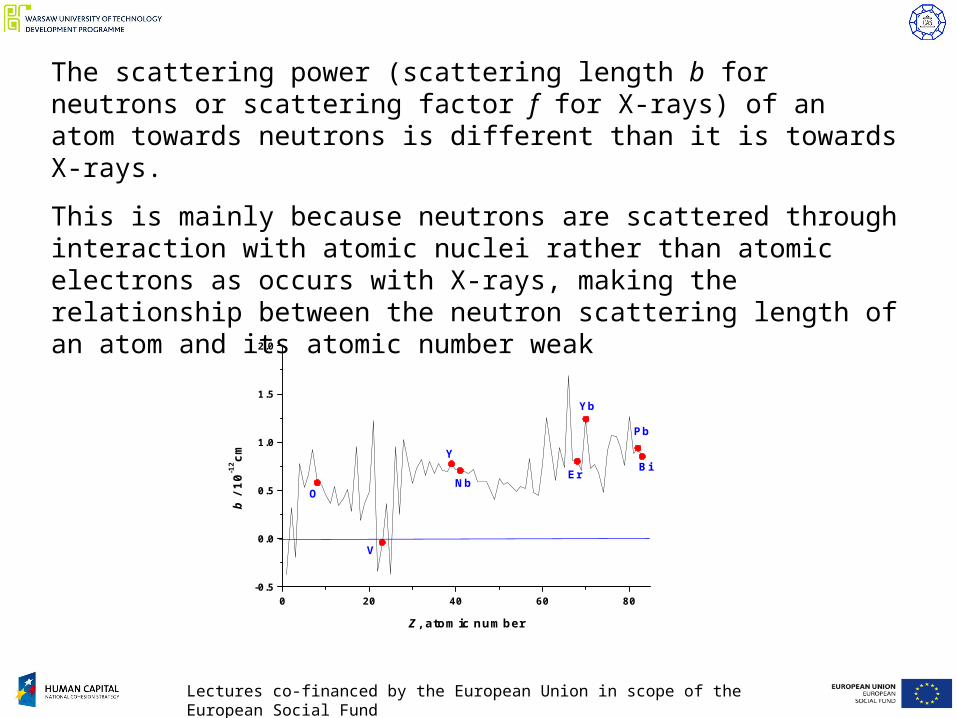
The scattering power (scattering length b for neutrons or scattering factor f for X-rays) of an atom towards neutrons is different than it is towards X-rays.
This is mainly because neutrons are scattered through interaction with atomic nuclei rather than atomic electrons as occurs with X-rays, making the relationship between the neutron scattering length of an atom and its atomic number weak
0 20 40 60 80-0.5
0.0
0.5
1.0
1.5
2.0
Bi
Pb
Yb
ErNb
Y
V
O
b /
10-1
2 cm
Z, atomic number

Lectures co-financed by the European Union in scope of the European Social Fund
In systems containing light and heavy atoms X-ray scattering will be dominated by scattering from the heavy atoms, while neutron scattering does not show this correlation and it is often easier to locate light atoms in the presence of heavier ones.
Able to distinguish between neighbouring elements in the periodic table such as manganese and iron or cobalt and nickel.
Isotopic substitution experiments possible as scattering lengths of isotopes differ.
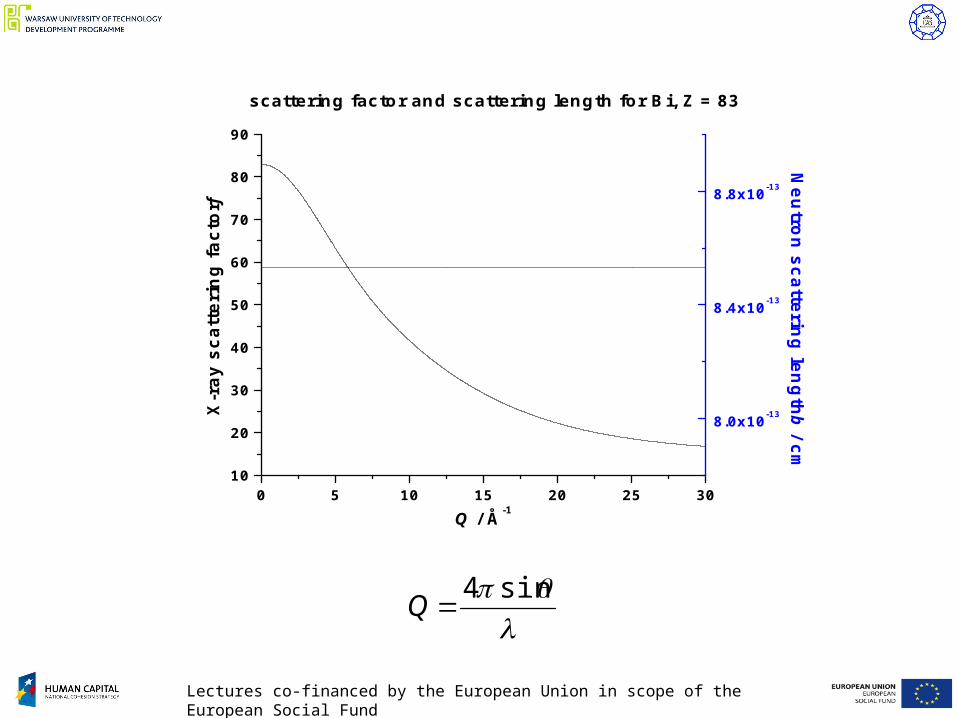
Less dependence of scattering on Bragg angle, , leading to greater intensity at higher angles.
Advantages of neutron diffraction
Lectures co-financed by the European Union in scope of the European Social Fund
0 5 10 15 20 25 3010
20
30
40
50
60
70
80
90
scattering factor and scattering length for Bi, Z = 83
Neu
tron
scattering
leng
th b / cm
X-r
ay s
catt
erin
g f
acto
r f
Q / Å-1
8.0x10⁻¹³
8.4x10⁻¹³
8.8x10⁻¹³
sin4
Q

Lectures co-financed by the European Union in scope of the European Social Fund
Ref: Neutron Diffraction, Bacon Clarendon Press 1975.

Lectures co-financed by the European Union in scope of the European Social Fund
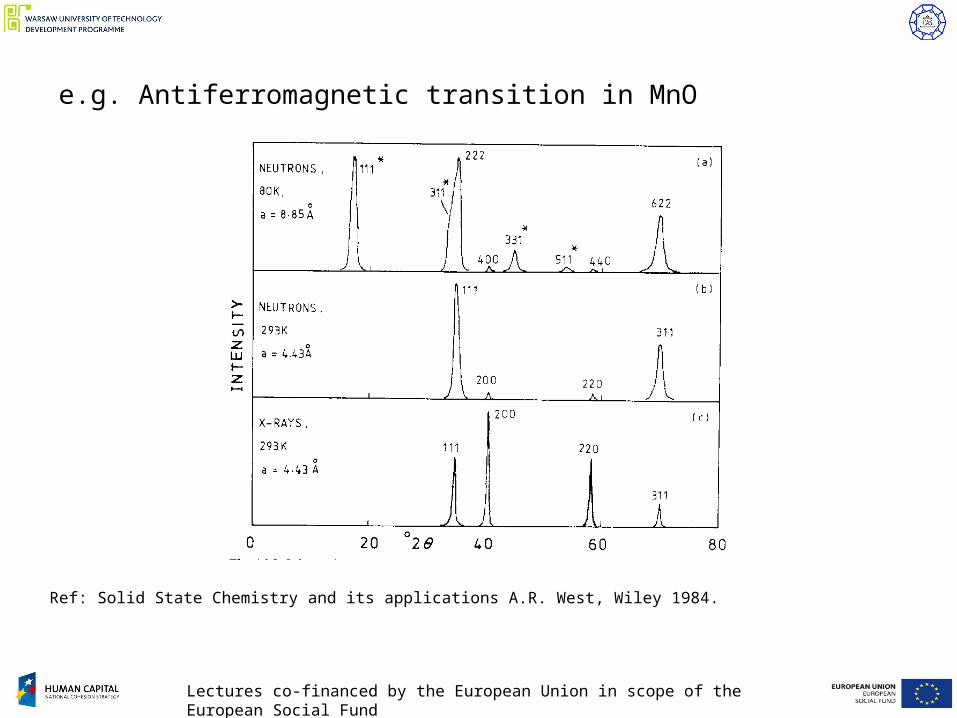
Neutron diffraction is also a powerful technique for the study of magnetic structure.
Neutrons possess a spin of ½ and therefore, have a magnetic dipole moment that can interact with unpaired electrons (mostly in d or f orbitals) giving rise to an additional scattering effect.
In diffraction experiments, where magnetic ordering may occur over different length scales to the crystallographic ordering, this gives rise to magnetic superlattice peaks in the diffraction pattern.
Lectures co-financed by the European Union in scope of the European Social Fund
e.g. Antiferromagnetic transition in MnO
Ref: Solid State Chemistry and its applications A.R. West, Wiley 1984.
Lectures co-financed by the European Union in scope of the European Social Fund
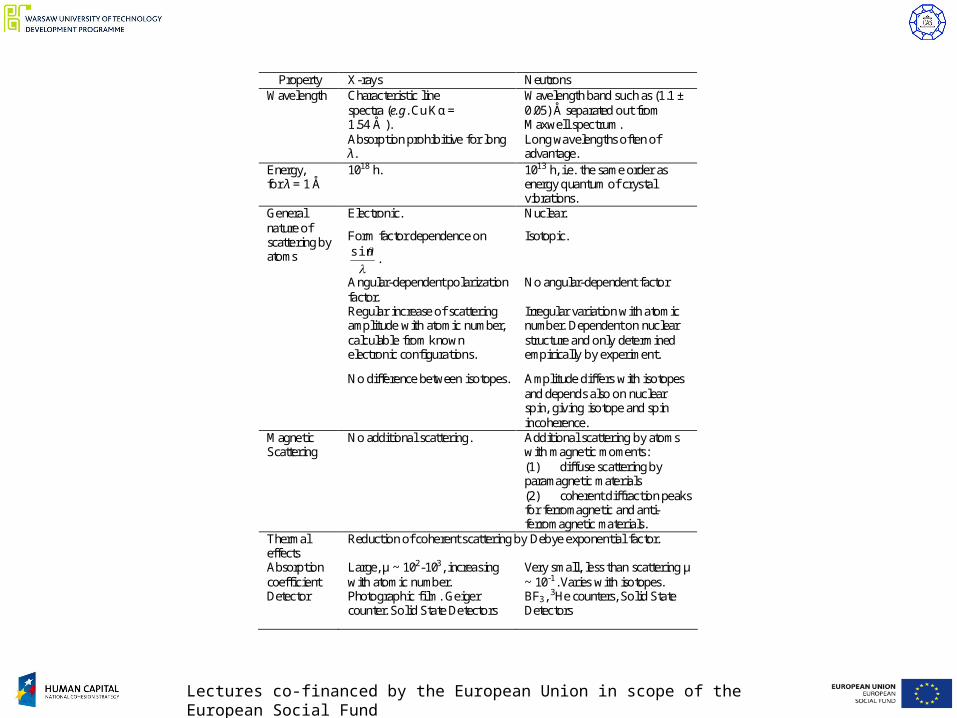
Property X-rays Neutrons Characteristic line spectra (e.g. Cu Kα = 1.54 Å ).
Wavelength band such as (1.1 ± 0.05) Å separated out from Maxwell spectrum.
Wavelength
Absorption prohibitive for long λ.
Long wavelengths often of advantage.
Energy, for λ = 1 Å
1018 h. 1013 h, i.e. the same order as energy quantum of crystal vibrations.
Electronic. Nuclear.
Form factor dependence on
sin
.
Isotopic.
Angular-dependent polarization factor.
No angular-dependent factor
Regular increase of scattering amplitude with atomic number, calculable from known electronic configurations.
Irregular variation with atomic number. Dependent on nuclear structure and only determined empirically by experiment.
General nature of scattering by atoms
No difference between isotopes.
Amplitude differs with isotopes and depends also on nuclear spin, giving isotope and spin incoherence.
Magnetic Scattering
No additional scattering. Additional scattering by atoms with magnetic moments: (1) diffuse scattering by paramagnetic materials (2) coherent diffraction peaks for ferromagnetic and anti-ferromagnetic materials.
Thermal effects
Reduction of coherent scattering by Debye exponential factor.
Absorption coefficient
Large, μ ~ 102-103, increasing with atomic number.
Very small, less than scattering μ ~ 10-1. Varies with isotopes.
Detector Photographic film. Geiger counter. Solid State Detectors
BF3, 3He counters, Solid State Detectors

Lectures co-financed by the European Union in scope of the European Social Fund
Neutron sources
Two main types of neutron sources.
1. Reactor Sources
e.g. ILL High Flux reactor source. Neutrons produced as a product of the fission of 235U. Neutrons can then be moderated to give a range of energies and then conducted to different instruments via guide tubes.
Diffraction experiments are normally at a constant wavelength, but can also be energy dispersive.
2. Pulsed Sources
e.g. ISIS Proton spallation source. Pulses of protons are accelerated in a synchrotron and then fired at a heavy metal target (tantalum in this case) to generate neutrons. These can be moderated or used directly. A Maxwellian distribution of energies is produced.
Diffraction experiments normally use a large range of energies (time of flight method).
Lectures co-financed by the European Union in scope of the European Social Fund
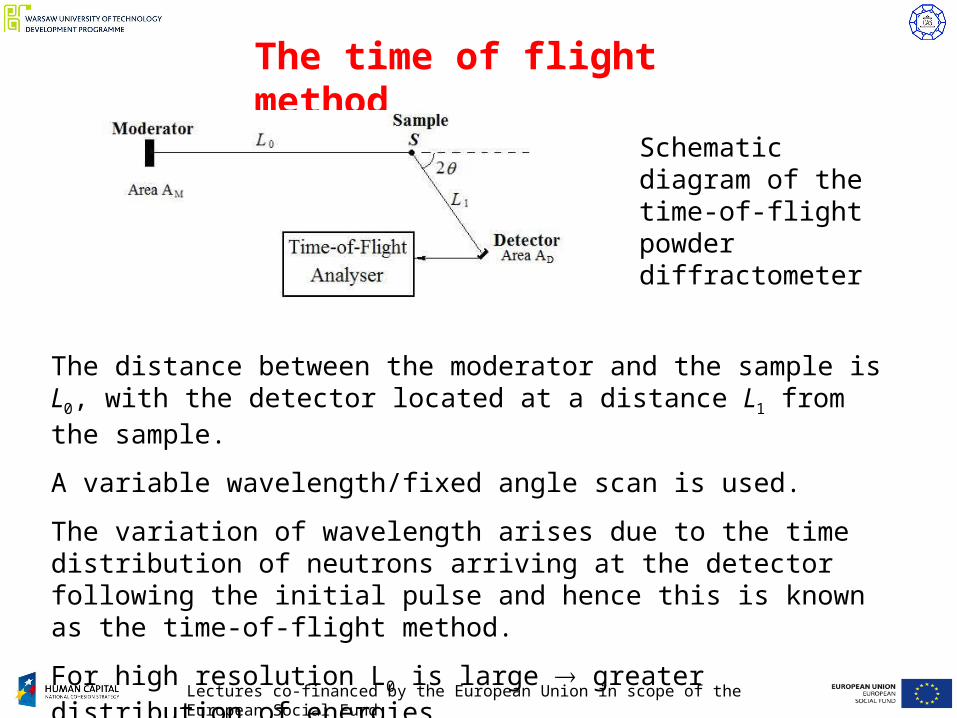
The time of flight method
Schematic diagram of the time-of-flight powder diffractometer
The distance between the moderator and the sample is L0, with the detector located at a distance L1 from the sample.
A variable wavelength/fixed angle scan is used.
The variation of wavelength arises due to the time distribution of neutrons arriving at the detector following the initial pulse and hence this is known as the time-of-flight method.
For high resolution L0 is large greater distribution of energies.

Lectures co-financed by the European Union in scope of the European Social Fund
hklhkldmv
h sin2
t
L
t
LLv
01
hklhkl mL
htd
sin2
hklhkldL
t
m
h sin2
The neutron velocity is given by:
Combining the de Broglie and Bragg equations:
Thus
Lectures co-financed by the European Union in scope of the European Social Fund
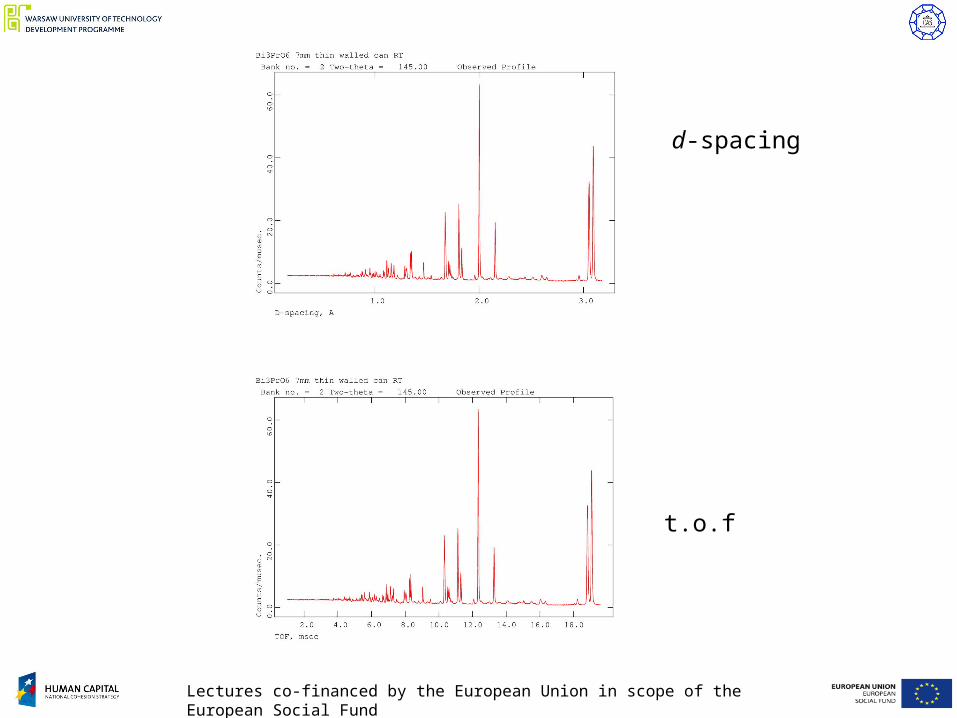
t.o.f
d-spacing
Lectures co-financed by the European Union in scope of the European Social Fund
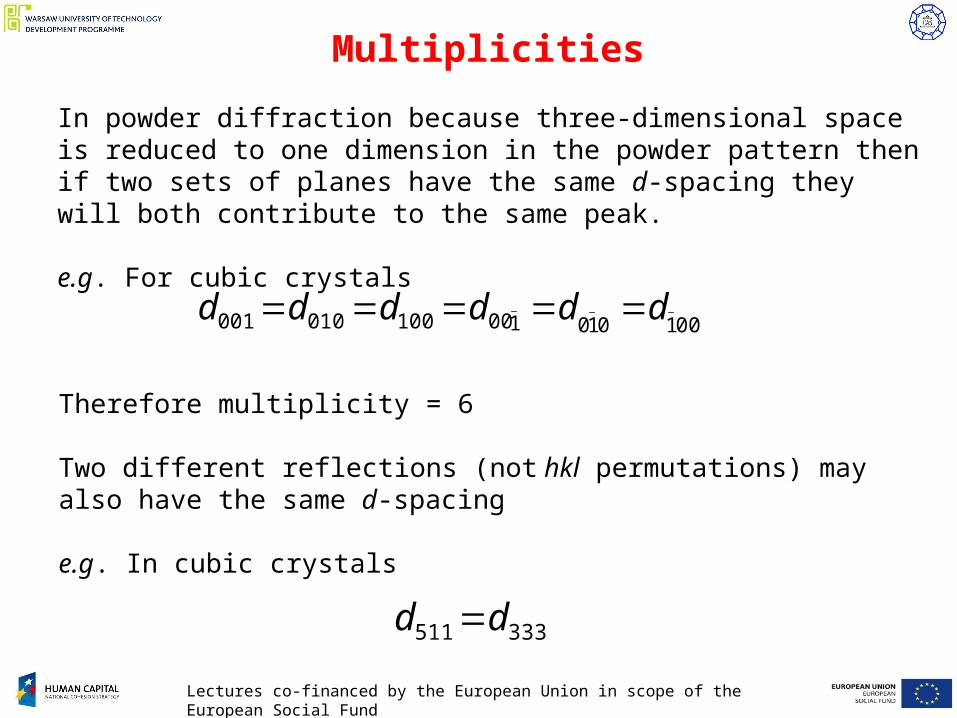
Multiplicities
In powder diffraction because three-dimensional space is reduced to one dimension in the powder pattern then if two sets of planes have the same d-spacing they will both contribute to the same peak.
e.g. For cubic crystals
001010100100010001 dddddd
Therefore multiplicity = 6
Two different reflections (not hkl permutations) may also have the same d-spacing
e.g. In cubic crystals
333511 dd
Lectures co-financed by the European Union in scope of the European Social Fund
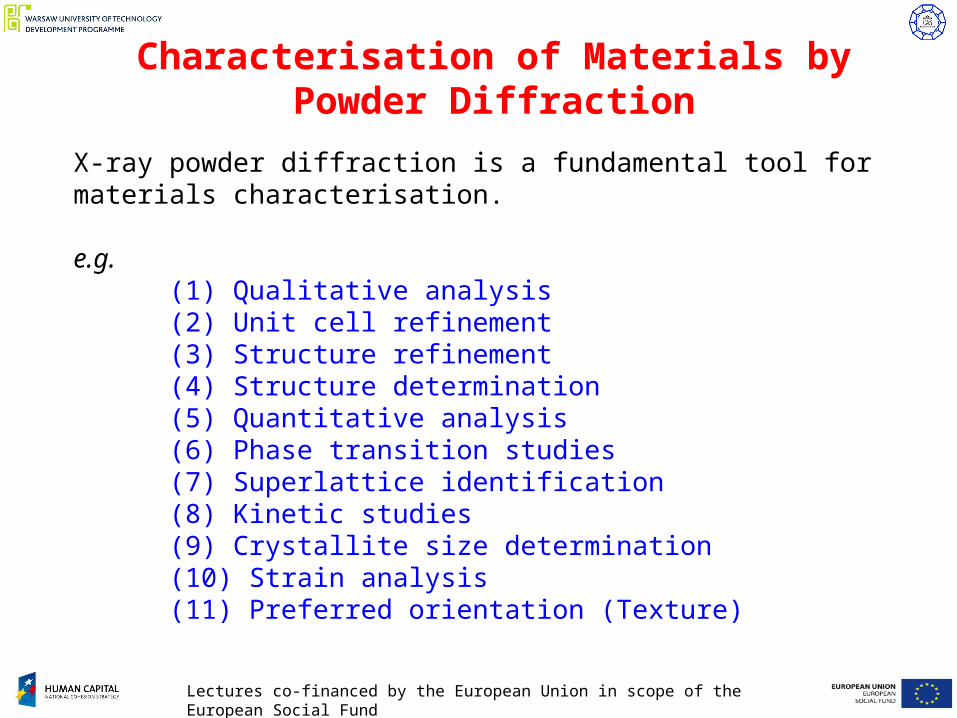
Characterisation of Materials by Powder Diffraction
X-ray powder diffraction is a fundamental tool for materials characterisation.
e.g.(1) Qualitative analysis(2) Unit cell refinement(3) Structure refinement(4) Structure determination(5) Quantitative analysis(6) Phase transition studies(7) Superlattice identification(8) Kinetic studies(9) Crystallite size determination(10) Strain analysis(11) Preferred orientation (Texture)

Lectures co-financed by the European Union in scope of the European Social Fund
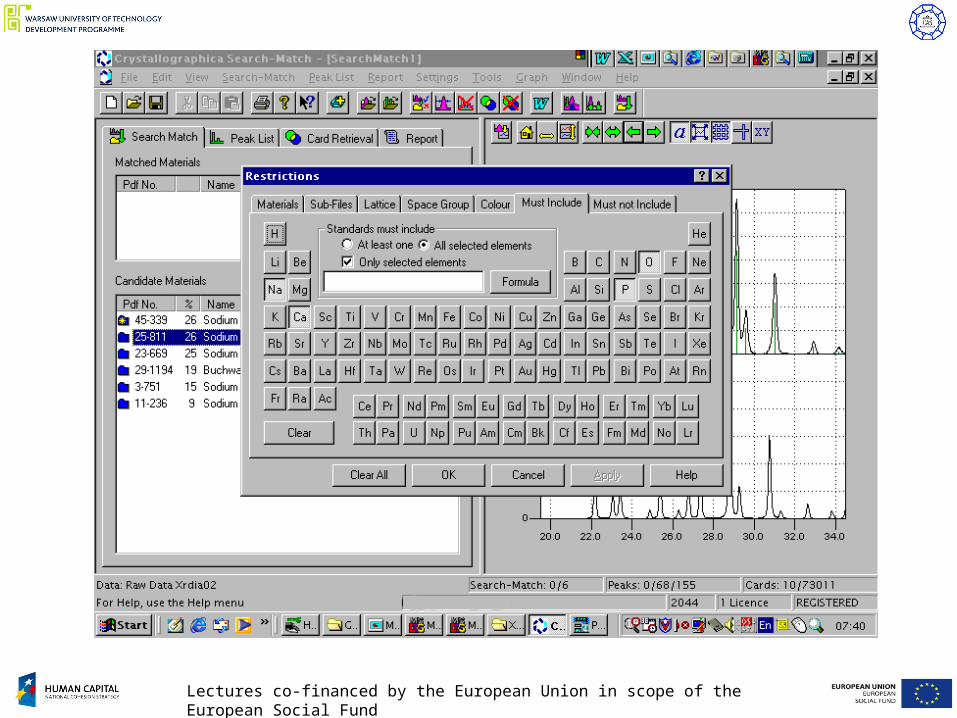
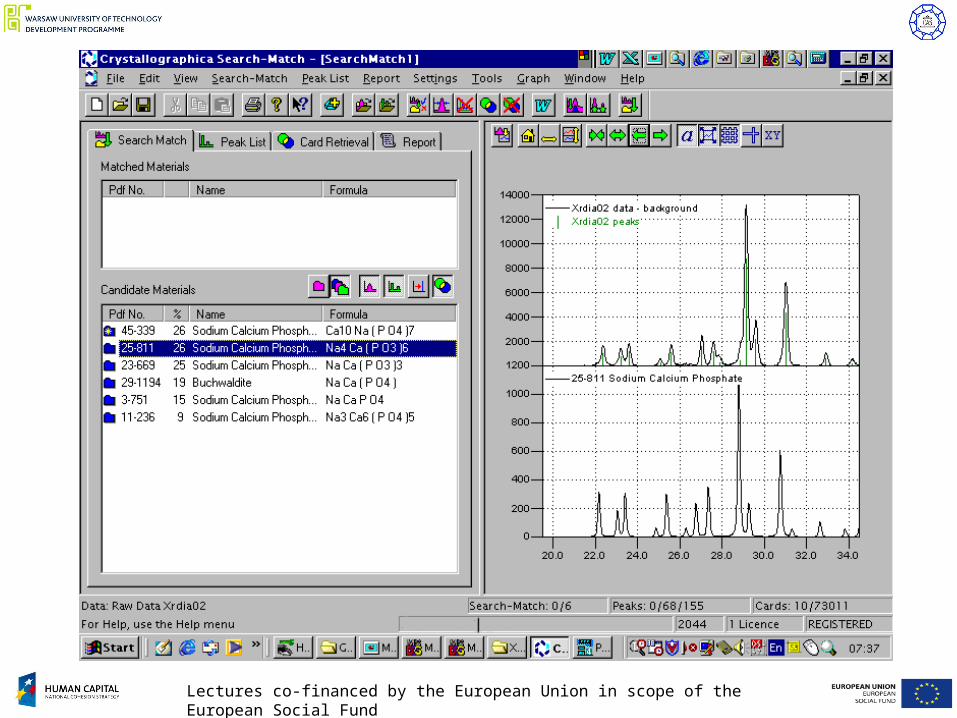
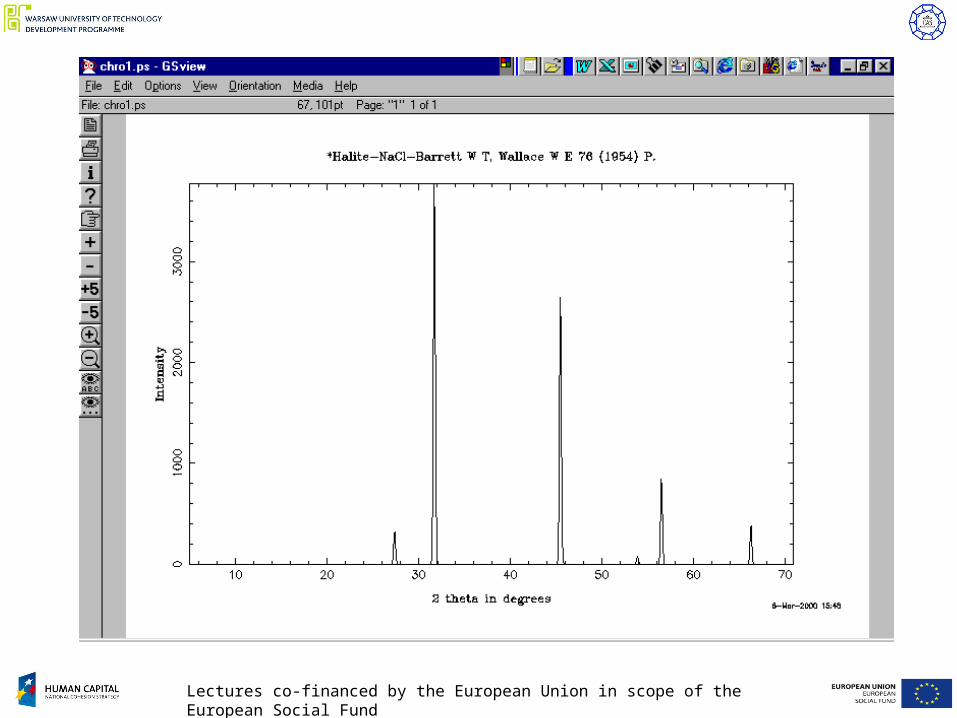
Qualitative Analysis
The primary role of the majority of X-ray powder diffractometers is phase identification. This relies on the fact that every unique crystal structure has its own unique powder pattern, i.e. its own fingerprint.
PDFThe Powder Diffraction File (PDF-2, PDF-3 or PDF-4) represents the most complete database of powder diffraction data. The database can be searched in a number of ways by a variety of commercial search engines.
A typical search would involve the loading of a powder pattern and automatic measurement of the diffraction peaks. These would then be compared to those in the database and matches ranked according to how good the match is.
To narrow the search it is advisable to restrict the search to compounds containing only those elements you know were in the reaction mixture.
Lectures co-financed by the European Union in scope of the European Social Fund
Lectures co-financed by the European Union in scope of the European Social Fund
Lectures co-financed by the European Union in scope of the European Social Fund
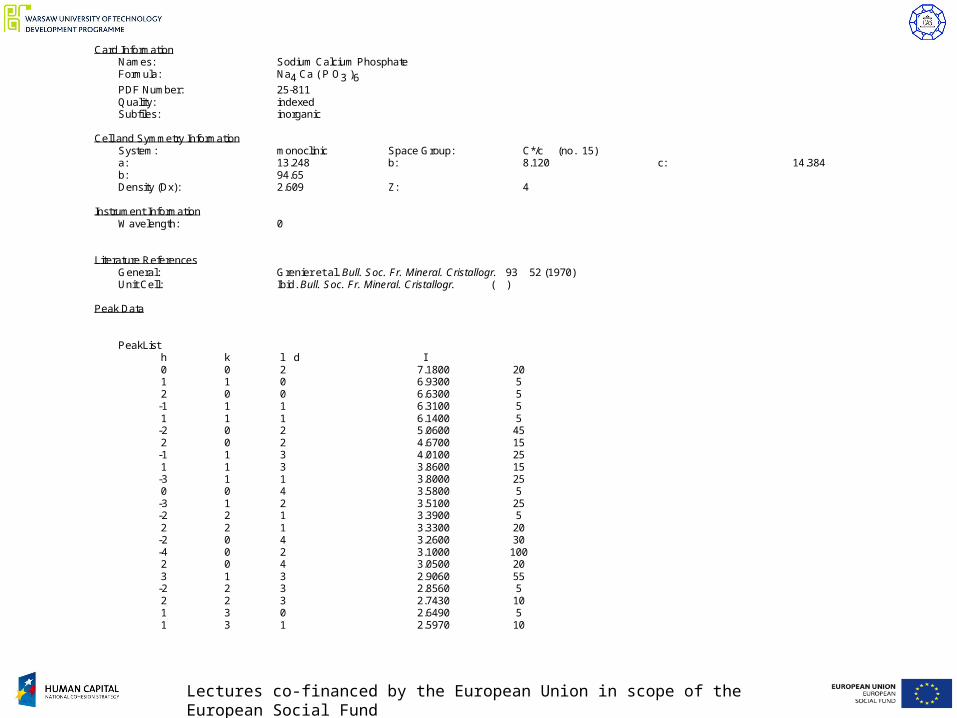
Card Information Names: Sodium Calcium Phosphate Formula: Na4 Ca ( P O3 )6
PDF Number: 25-811 Quality: indexed Subfiles: inorganic
Cell and Symmetry Information System: monoclinic Space Group: C*/c (no. 15) a: 13.248 b: 8.120 c: 14.384 b: 94.65 Density (Dx): 2.609 Z: 4
Instrument Information Wavelength: 0
Literature References
General: Grenier et al. Bull. Soc. Fr. Mineral. Cristallogr. 93 52 (1970) Unit Cell: Ibid. Bull. Soc. Fr. Mineral. Cristallogr. ( )
Peak Data
PeakList h k l d I 0 0 2 7.1800 20 1 1 0 6.9300 5 2 0 0 6.6300 5 -1 1 1 6.3100 5 1 1 1 6.1400 5 -2 0 2 5.0600 45 2 0 2 4.6700 15 -1 1 3 4.0100 25 1 1 3 3.8600 15 -3 1 1 3.8000 25 0 0 4 3.5800 5 -3 1 2 3.5100 25 -2 2 1 3.3900 5 2 2 1 3.3300 20 -2 0 4 3.2600 30 -4 0 2 3.1000 100 2 0 4 3.0500 20 3 1 3 2.9060 55 -2 2 3 2.8560 5 2 2 3 2.7430 10 1 3 0 2.6490 5 1 3 1 2.5970 10
Lectures co-financed by the European Union in scope of the European Social Fund
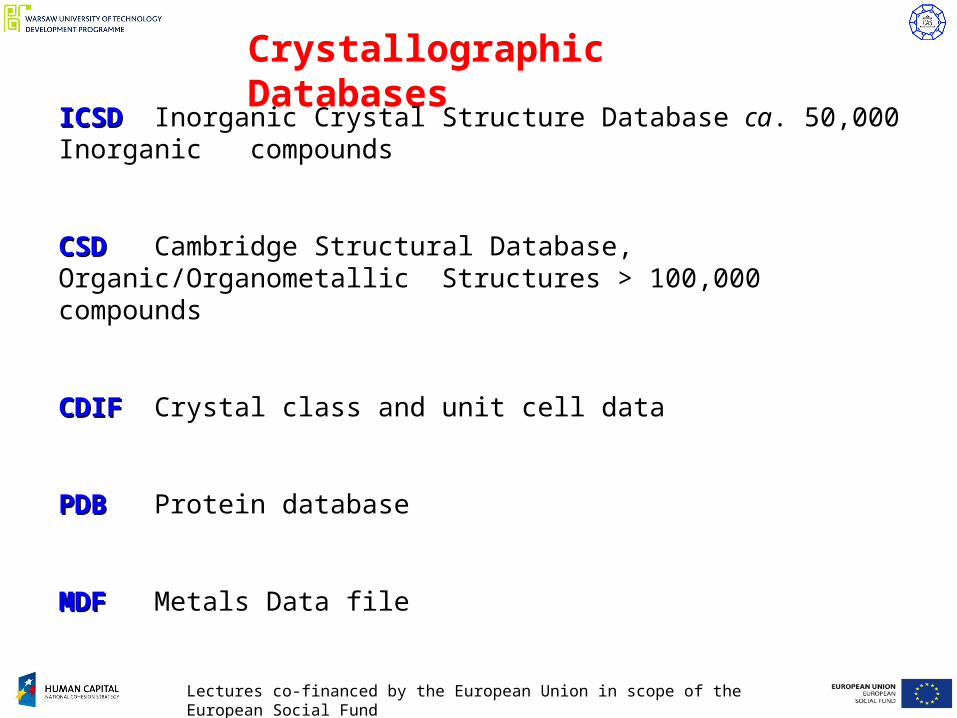
Crystallographic Databases
ICSDICSD Inorganic Crystal Structure Database ca. 50,000 Inorganic compounds
CSDCSD Cambridge Structural Database, Organic/Organometallic Structures > 100,000 compounds
CDIFCDIF Crystal class and unit cell data
PDBPDB Protein database
MDFMDF Metals Data file

Lectures co-financed by the European Union in scope of the European Social Fund
ICSD on the Web
Lectures co-financed by the European Union in scope of the European Social Fund
Lectures co-financed by the European Union in scope of the European Social Fund
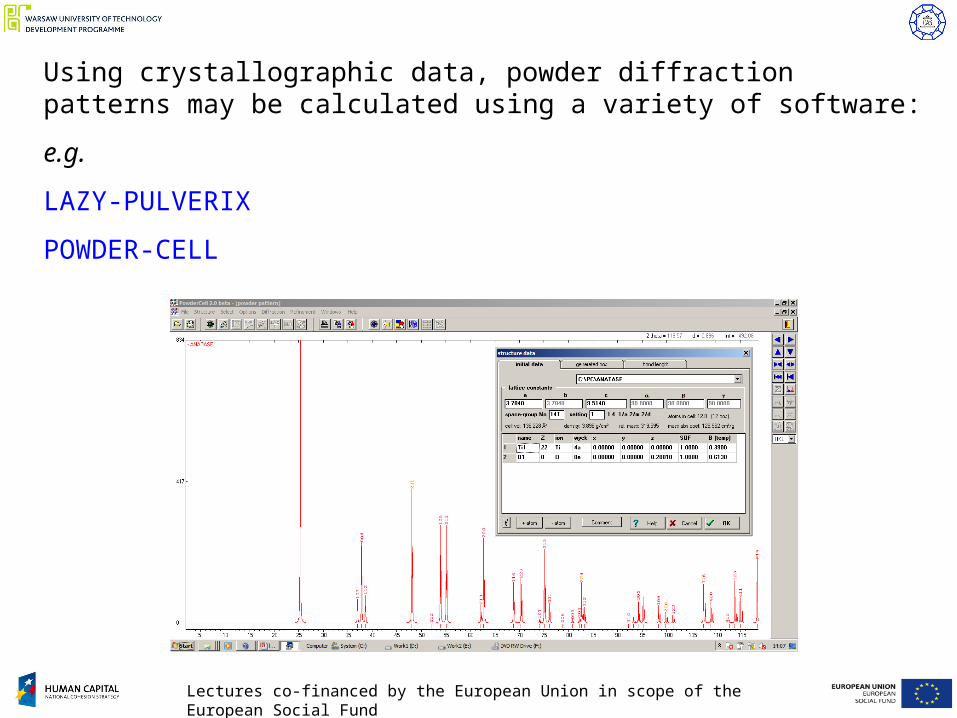
Using crystallographic data, powder diffraction patterns may be calculated using a variety of software:
e.g.
LAZY-PULVERIX
POWDER-CELL
Lectures co-financed by the European Union in scope of the European Social Fund
Unit cell refinement
Assuming that you have been able to identify phases and index the powder pattern, it is often useful to refine unit cell dimensions. This is particularly important if you want to identify solid-solutions.
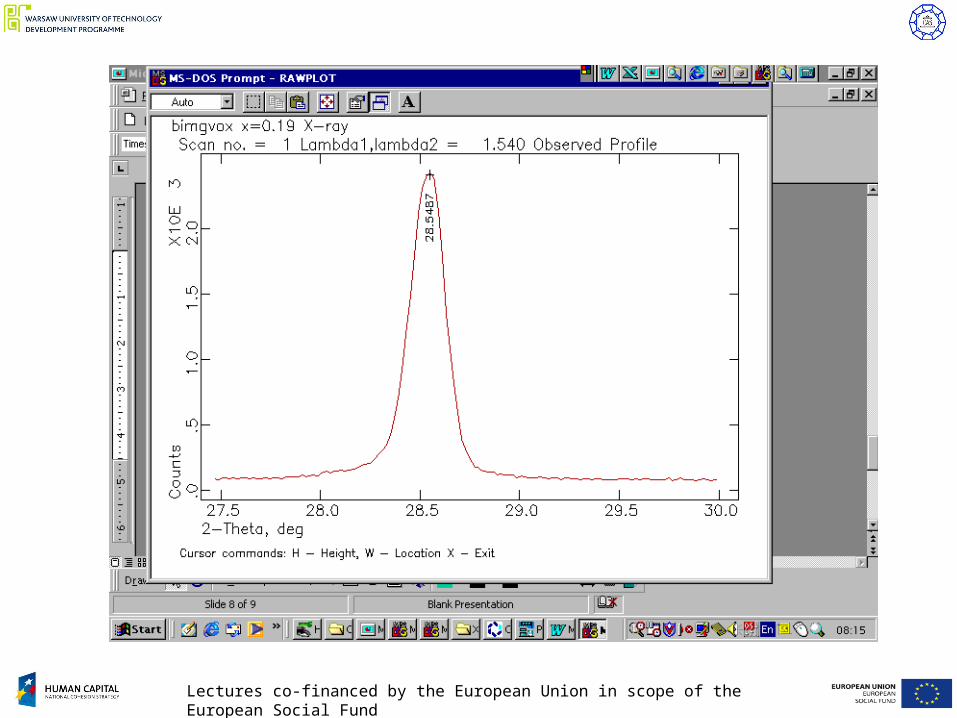
(1) Measure the peaks accurately
(2) Index the peaks
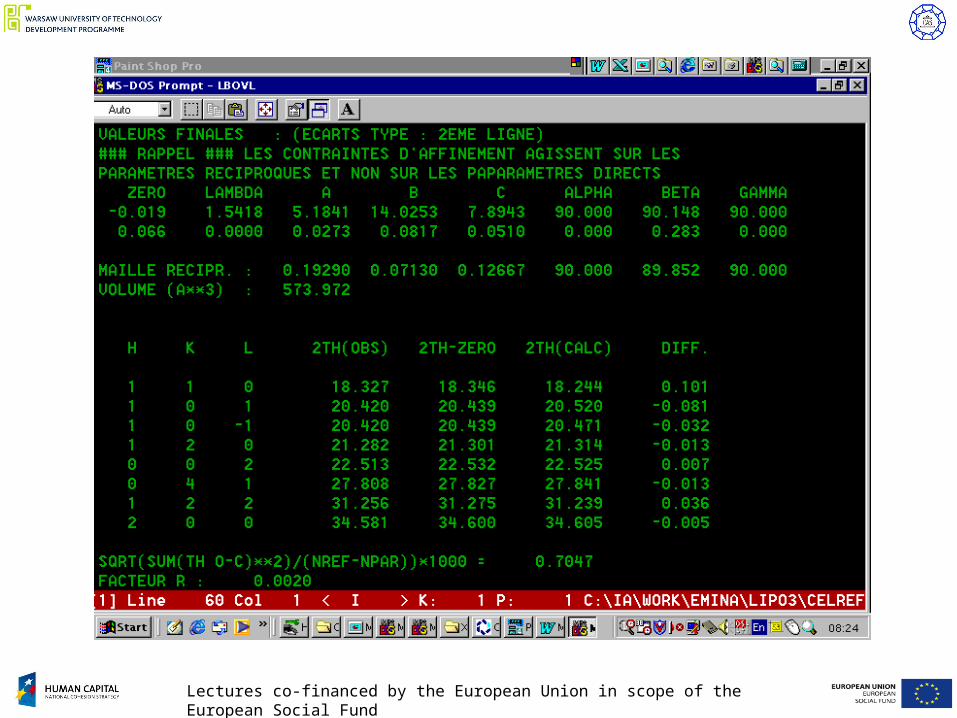
(3) Refine the unit cell dimensions and zero-point correction.
There are a number of programs available to do this. However they all rely on accurate peak measurement. Some incorporate automatic peak measurement
Often where the structure is known you are better off carrying out a Rietveld refinement. Alternatively a LeBail type fit can be carried out.
Lectures co-financed by the European Union in scope of the European Social Fund
Lectures co-financed by the European Union in scope of the European Social Fund
Lectures co-financed by the European Union in scope of the European Social Fund
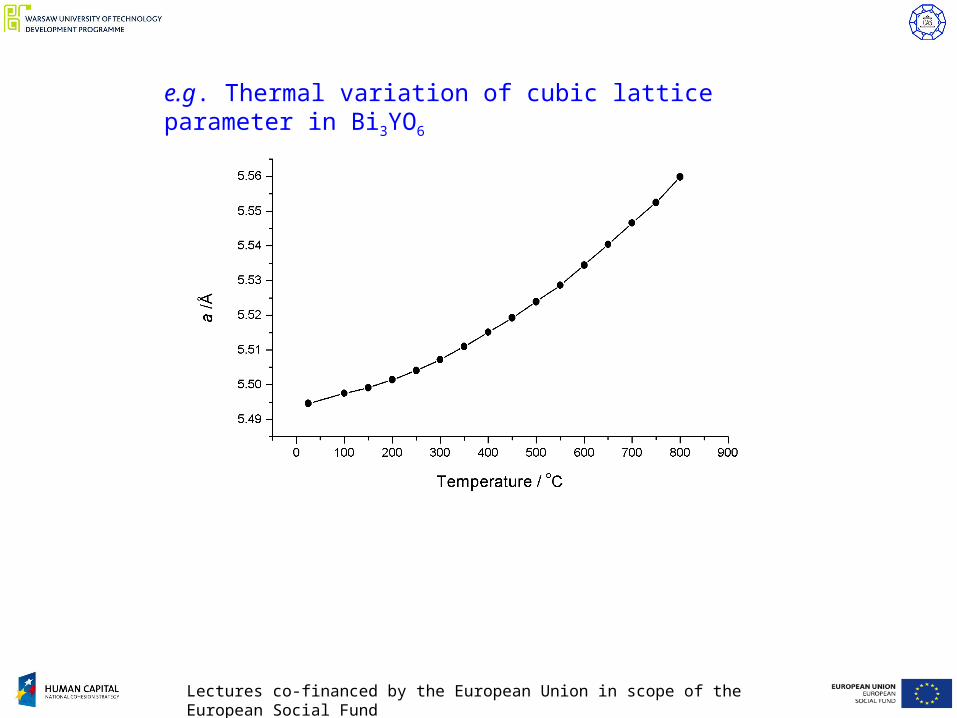
e.g. Thermal variation of cubic lattice parameter in Bi3YO6

Lectures co-financed by the European Union in scope of the European Social Fund
Structure Refinement
The Rietveld method is a structure refinement technique for powder diffraction data which fits the whole powder pattern including peak shapes and background.
This will be dealt with in the next set of lectures.
Lectures co-financed by the European Union in scope of the European Social Fund
Structure Determination
For structure refinement an initial structural model is required before refinement can proceed.
In structure determination the initial model is found using an ab-initio approach.
There are a number of stages in structure determination
(1) Unit cell determination and indexing(2) Space Group identification(3) Intensity extraction(4) Initial model determination (5) Rietveld refinement(6) Difference Fourier maps generated to locate remaining atoms(7) Final Rietveld Refinement
Lectures co-financed by the European Union in scope of the European Social Fund
Unit cell determination and indexing
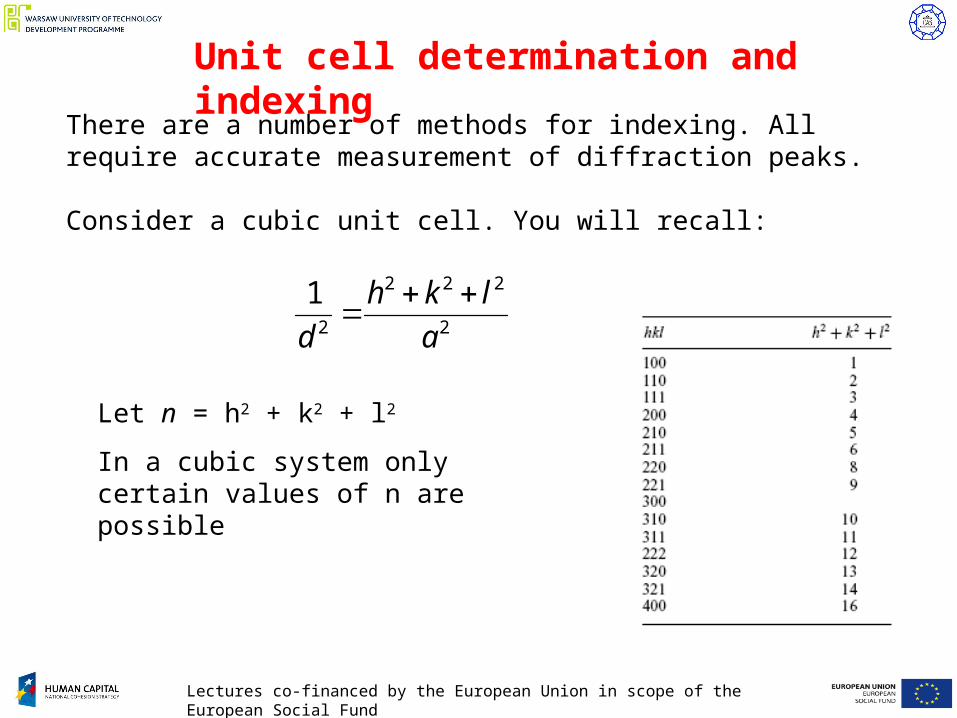
There are a number of methods for indexing. All require accurate measurement of diffraction peaks.
Consider a cubic unit cell. You will recall:
2
222
2
1
a
lkh
d
Let n = h2 + k2 + l2
In a cubic system only certain values of n are possible

Lectures co-financed by the European Union in scope of the European Social Fund
Lectures co-financed by the European Union in scope of the European Social Fund
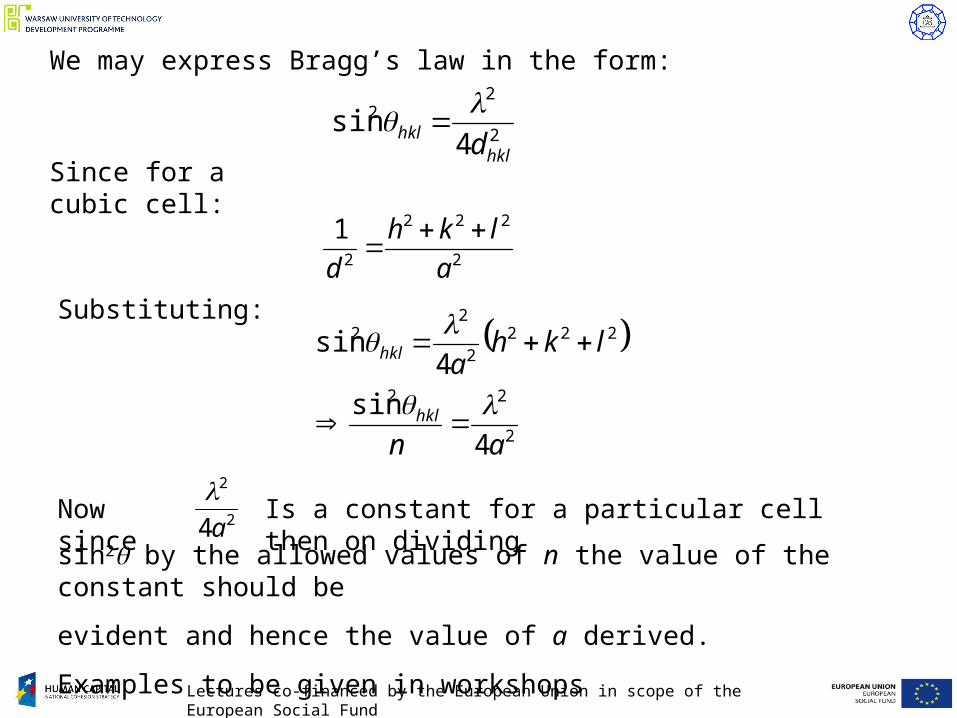
We may express Bragg’s law in the form:
2
22
4sin
hklhkl d
2
222
2
1
a
lkh
d
Since for a cubic cell:
Substituting:
2
22
2222
22
4
sin
4sin
an
lkha
hkl
hkl
Now since 2
2
4a
Is a constant for a particular cell then on dividing
sin2 by the allowed values of n the value of the constant should be
evident and hence the value of a derived.
Examples to be given in workshops
Lectures co-financed by the European Union in scope of the European Social Fund
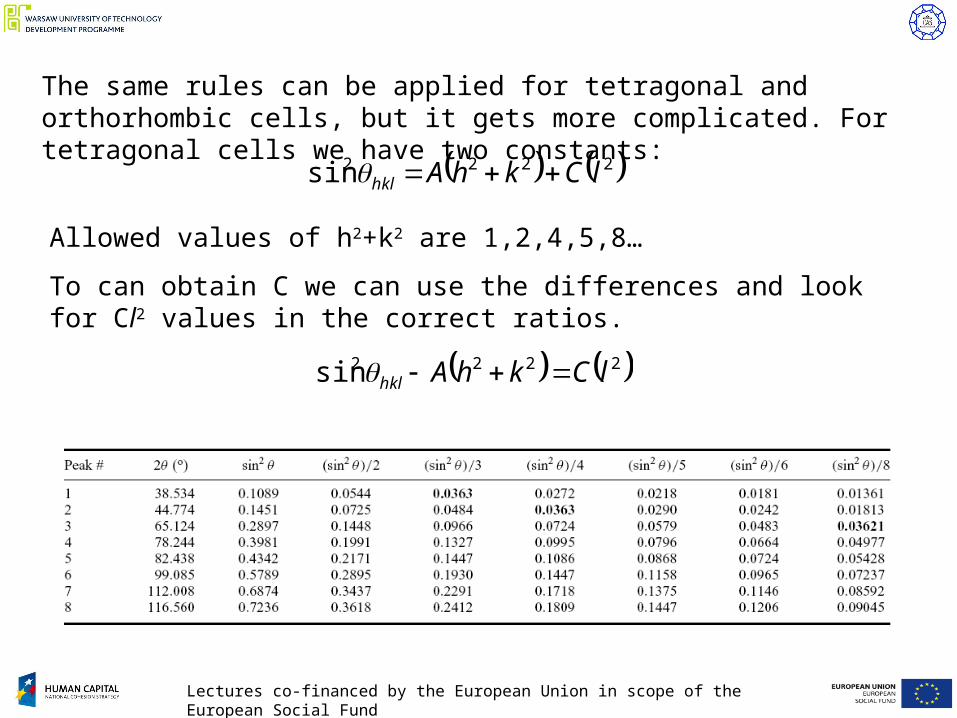
The same rules can be applied for tetragonal and orthorhombic cells, but it gets more complicated. For tetragonal cells we have two constants:
2222sin lCkhAhkl
Allowed values of h2+k2 are 1,2,4,5,8…
To can obtain C we can use the differences and look for Cl2 values in the correct ratios.
2222sin lCkhAhkl
Lectures co-financed by the European Union in scope of the European Social Fund
Today, this type of indexing is done automatically
Typically 20 peaks or more are used. These should include all the high d-spacing peaks.
The most popular programs are
Visser
ITO
TREOR
DICVOL
Typically these programs will offer a number of possible solutions.

Lectures co-financed by the European Union in scope of the European Social Fund
Most automatic indexing programs work with reciprocal space Q values where:
2
1
hklhkl dQ
Thus in the general triclinic case there are 6 unknowns in reciprocal space:
klFhlEhkDClBkAhQhkl 222
Two basic approaches are used to solve this equation.
The Shirley method works through the different crystal systems starting with cubic and increments the lattice parameters until a solution is found.
The ITO method starts with triclinic symmetry and tries to find a solution and work out the higher symmetry from this.

Lectures co-financed by the European Union in scope of the European Social Fund
NUMBER OF SINGLE INDEXED LINES= 5 TOTAL NUMBER OF LINES= 8 NUMBER OF SINGLE INDEXED LINES = 5 TOTAL NUMBER OF LINES = 8 A = 9.969106 0.001236 A ALFA = 90.000000 0.000000 DEG B = 9.969106 0.001236 A BETA = 90.000000 0.000000 DEG C = 19.823130 0.008515 A GAMMA = 90.000000 0.000000 DEG UNIT CELL VOLUME = 1970.08 A**3 H K L SST-OBS SST-CALC DELTA 2TH-OBS 2TH-CALC D-OBS FREE PARAM. 1 1 2 0.018007 0.018009 -0.000001 15.424 15.424 5.7448 2 0 0 0.023954 0.023919 0.000035 17.807 17.794 4.9809 3 0 0 0.053641 0.053818 -0.000177 26.783 26.828 3.3285 2 2 2 0.053887 26.846 3 1 0 0.059798 28.309 3 0 2 0.060039 0.059867 0.000172 28.367 28.326 3.1462 1 0 6 0.060424 28.460 3 1 3 0.073461 0.073409 0.000052 31.452 31.440 2.8443 3 2 0 0.077737 32.379 3 0 4 0.078010 0.078015 -0.000006 32.437 32.438 2.7601 2 0 6 0.078364 32.513 5 0 0 0.149477 0.149494 -0.000017 45.489 45.492 1.9939 3 3 6 0.162067 0.162080 -0.000013 47.479 47.481 1.9149 NUMBER OF OBS. LINES = 8 NUMBER OF CALC. LINES = 13 M( 8)= 11 AV.EPS.= 0.0000592 F 8 = 5.(0.014699, 120) M CF. J.APPL.CRYST. 1(1968)108 F CF. J.APPL.CRYST. 12(1979)60 0 LINES ARE UNINDEXED CHECK IF THERE IS ANY COMMON FACTOR IN THE QUADRATIC FORMS CHECK CONVERGENCE IN THE REFINEMENT (EV. USE PROGRAM PIRUM OR PURUM) END OF CALCULATIONS USED CPU-TIME= 0. SEC.
TREOR output for bismuth zirconium vanadate
Lectures co-financed by the European Union in scope of the European Social Fund
Once a unit cell is found one must decide whether it is the correct cell. In order to do this one must determine the reduced cell (the simplest primitive unit cell) and then see if there are any other higher symmetry cells.
For every normal unit cell there may be many alternative cells, but for all of these there is only one reduced cell.
This is done routinely in single crystal diffraction but often forgotten in powder diffraction.
Today there automatic procedures for calculating the reduced cell.
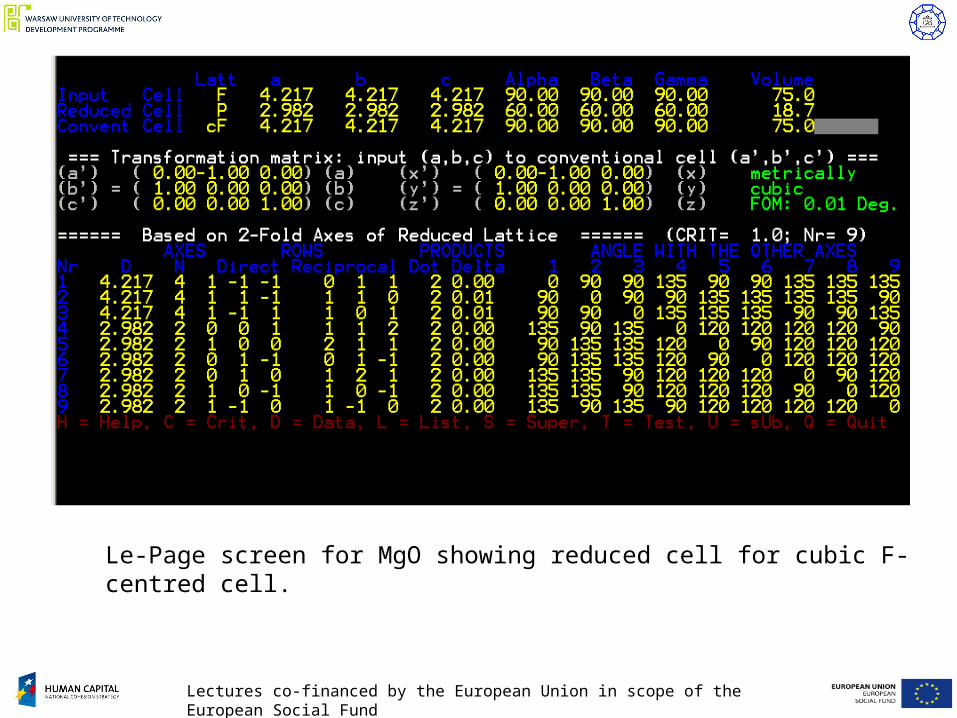
Le-Page is a freely available software package that will calculate the reduced cell and examine the parameters for higher metric symmetry.
Lectures co-financed by the European Union in scope of the European Social Fund
Le-Page screen for MgO showing reduced cell for cubic F-centred cell.
Lectures co-financed by the European Union in scope of the European Social Fund
Space Group Assignment
Space group assignment is carried out using systematic absences in the reflection data.
Intensity Extraction
Intensity extraction is usually carried using either the method of Pawley or Le-Bail. These will be dealt with in the next lectures.
Both methods use a Rietveld-like approach in that they fit the whole pattern, but with no structural model.
These methods rely on accurate high resolution data since peak overlap needs to be minimised.
The result is a set of quasi-single crystal data which can be analysed using standard single crystal packages.

Lectures co-financed by the European Union in scope of the European Social Fund
Determination of Initial Model
Three methods are now commonly used.
(1) Patterson vector density methods
(2) Direct methods
(3) Probabilistic methods
The first two are identical to the single crystal methods already discussed.
Lectures co-financed by the European Union in scope of the European Social Fund
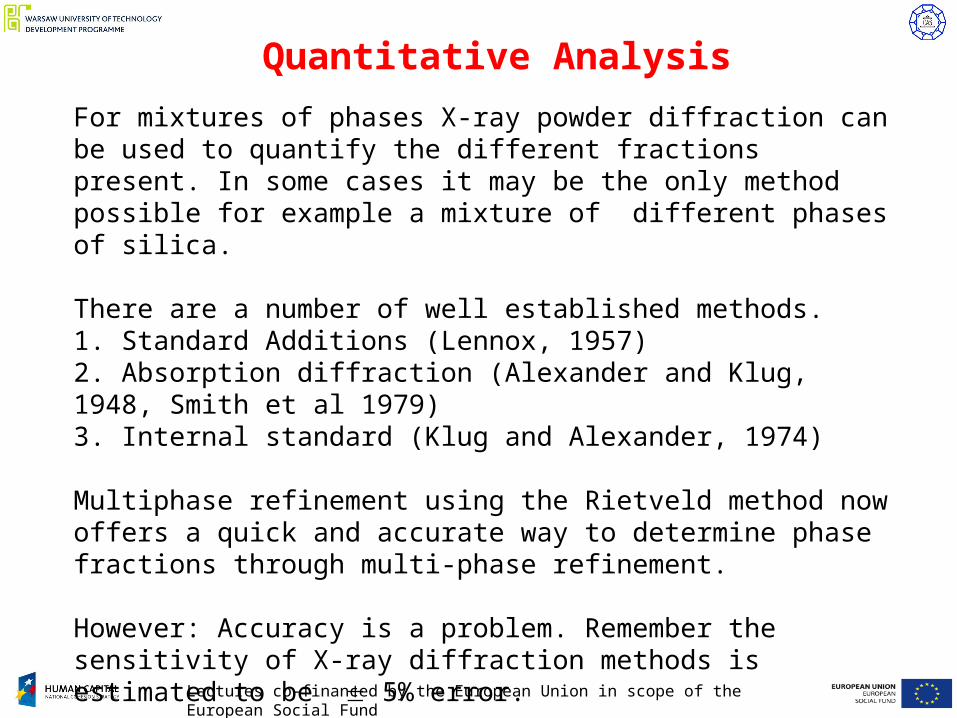
Quantitative Analysis
For mixtures of phases X-ray powder diffraction can be used to quantify the different fractions present. In some cases it may be the only method possible for example a mixture of different phases of silica.
There are a number of well established methods. 1. Standard Additions (Lennox, 1957)2. Absorption diffraction (Alexander and Klug, 1948, Smith et al 1979)3. Internal standard (Klug and Alexander, 1974)
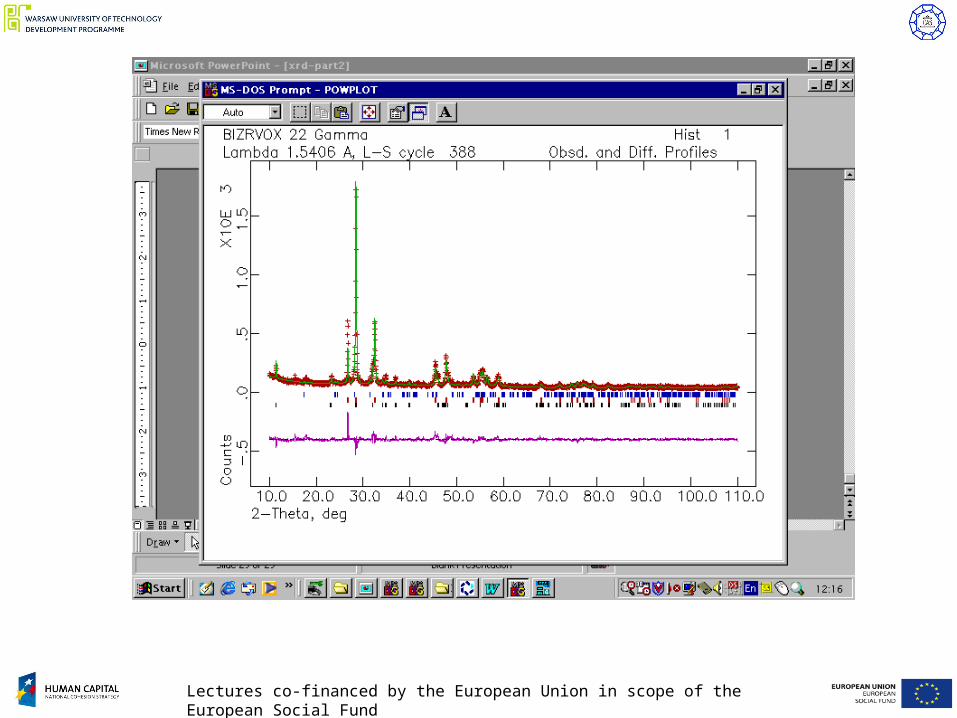
Multiphase refinement using the Rietveld method now offers a quick and accurate way to determine phase fractions through multi-phase refinement.
However: Accuracy is a problem. Remember the sensitivity of X-ray diffraction methods is estimated to be 5% error.

Lectures co-financed by the European Union in scope of the European Social Fund
In a multiphase Rietveld analysis individual scale factors Si are refined for each component i. The weight fraction Wi of each component is given by:
jjjj
iiii VS
VSW
2
2
Where is the density and V is the unit cell volume.
Lectures co-financed by the European Union in scope of the European Social Fund

Lectures co-financed by the European Union in scope of the European Social Fund
Final refinement x = 0.30
Phase 1 -Bi2Zr0.25V0.75O5.375, Fw = 564.97 Phase 2 Bi8V2O17, Fw = 2045.71 Phase 3 ZrO2, Fw = 123.22 Rwp = 0.1229, Rp = 0.0940, Rex = 0.1117, 2= 1.219, nvar = 30 Phase 1 a b c alpha beta gamma volume 3.94477 3.94477 15.44026 90.000 90.000 90.000 240.269 .00031 .00031 .00214 .000 .000 .000 .057 Phase 2 a b c alpha beta gamma volume 3.80731 3.80731 10.00677 90.000 90.000 120.000 125.621 .00029 .00029 .00092 .000 .000 .000 .022 Phase 3 a b c alpha beta gamma volume 5.14166 5.21076 5.31369 90.000 99.225 90.000 140.523 .00390 .00463 .00426 .000 .042 .000 .100 Phase/element fractions for phase no. 1 Wt. Frac.: .39231 Sigmas : .276381E-02 Phase/element fractions for phase no. 2 Wt. Frac.: .48831 Sigmas : .273864E-02 Phase/element fractions for phase no. 3 Wt. Frac.: .11938 Sigmas : .571275E-02 Mol % Phase 1 36.5% Phase 2 12.6% Phase 3 50.9%

Lectures co-financed by the European Union in scope of the European Social Fund
Phase Transition Studies
X-ray powder diffraction is ideally suited for examining crystallographic phase transitions
Both compositional and temperature dependence can be examined.
BIMEVOX
Lectures co-financed by the European Union in scope of the European Social Fund
Superlattices
Powder diffraction is often superior to single crystal diffraction in identifying superlattice reflections.
Superlattices occur when part of a structure orders on a larger length scale than the original subcell.
This ordering may be 1-, 2- or 3- dimensional and may be commensurate or incommensurate.
In diffraction data a superlattice manifests itself in the form of additional peaks.

Lectures co-financed by the European Union in scope of the European Social Fund
Superlattice peaks in -BiMgVOX
a = 6 am b = bam c = cam
In commensurate supercells, the supercell has a periodicity that is a simple integral multiple of the subcell.
e.g. -BIMEVOXes
Lectures co-financed by the European Union in scope of the European Social Fund
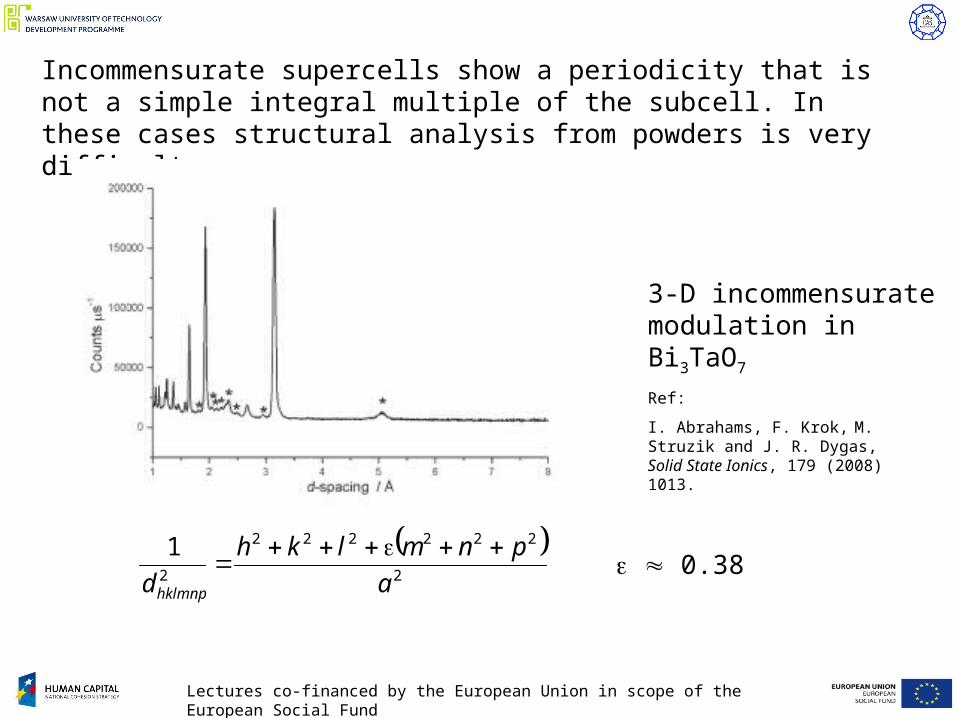
3-D incommensurate modulation in Bi3TaO7
Incommensurate supercells show a periodicity that is not a simple integral multiple of the subcell. In these cases structural analysis from powders is very difficult.
2
222222
2
1
a
pnmlkh
d hklmnp
0.38
Ref:
I. Abrahams, F. Krok, M. Struzik and J. R. Dygas, Solid State Ionics, 179 (2008) 1013.
Lectures co-financed by the European Union in scope of the European Social Fund
Kinetic Studies
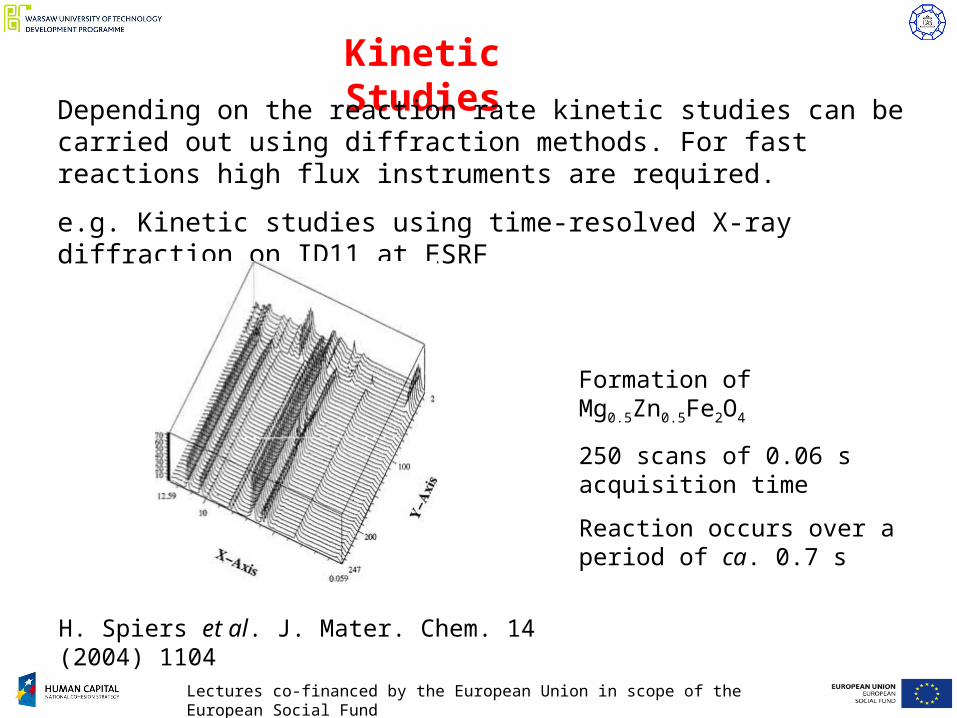
Depending on the reaction rate kinetic studies can be carried out using diffraction methods. For fast reactions high flux instruments are required.
e.g. Kinetic studies using time-resolved X-ray diffraction on ID11 at ESRF
H. Spiers et al. J. Mater. Chem. 14 (2004) 1104
Formation of Mg0.5Zn0.5Fe2O4
250 scans of 0.06 s acquisition time
Reaction occurs over a period of ca. 0.7 s
Lectures co-financed by the European Union in scope of the European Social Fund
Kinetic Studies
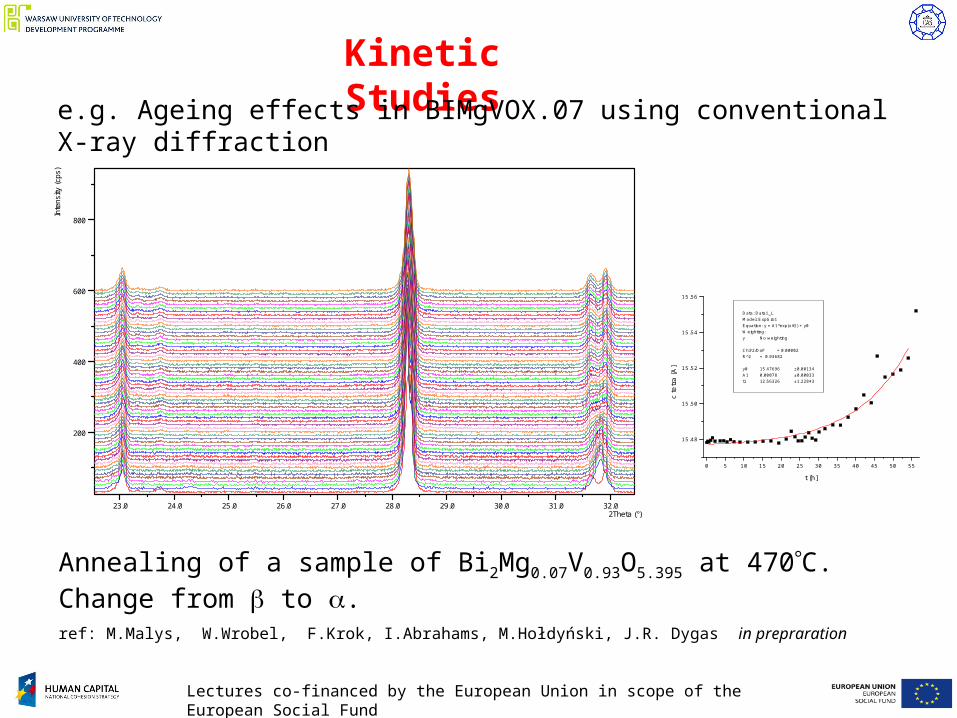
e.g. Ageing effects in BIMgVOX.07 using conventional X-ray diffraction
23.0 24.0 25.0 26.0 27.0 28.0 29.0 30.0 31.0 32.02Theta (°)
200
400
600
800
Inte
nsity
(cp
s)
0 5 10 15 20 25 30 35 40 45 50 55
15.48
15.50
15.52
15.54
15.56
Data: Data1_LModel: ExpGro1Equation: y = A1*exp(x/t1) + y0Weighting: y No weighting Chi^2/DoF = 0.00002R^2 = 0.93682 y0 15.47696 ±0.00134A1 0.00078 ±0.00033t1 12.56326 ±1.22843
c te
tra
[A]
t [h]
Annealing of a sample of Bi2Mg0.07V0.93O5.395 at 470C. Change from to . ref: M.Malys, W.Wrobel, F.Krok, I.Abrahams, M.Hołdyński, J.R. Dygas in prepraration
Lectures co-financed by the European Union in scope of the European Social Fund
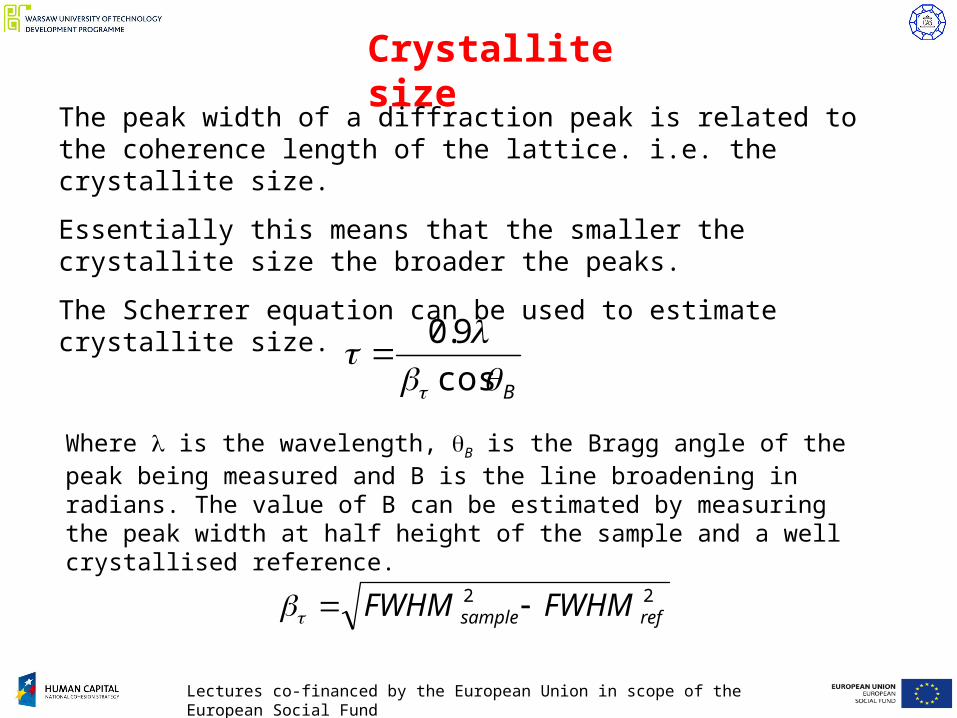
Crystallite size
The peak width of a diffraction peak is related to the coherence length of the lattice. i.e. the crystallite size.
Essentially this means that the smaller the crystallite size the broader the peaks.
The Scherrer equation can be used to estimate crystallite size.
B
cos
9.0
Where is the wavelength, B is the Bragg angle of the peak being measured and B is the line broadening in radians. The value of B can be estimated by measuring the peak width at half height of the sample and a well crystallised reference.
22refsample FWHMFWHM
Lectures co-financed by the European Union in scope of the European Social Fund
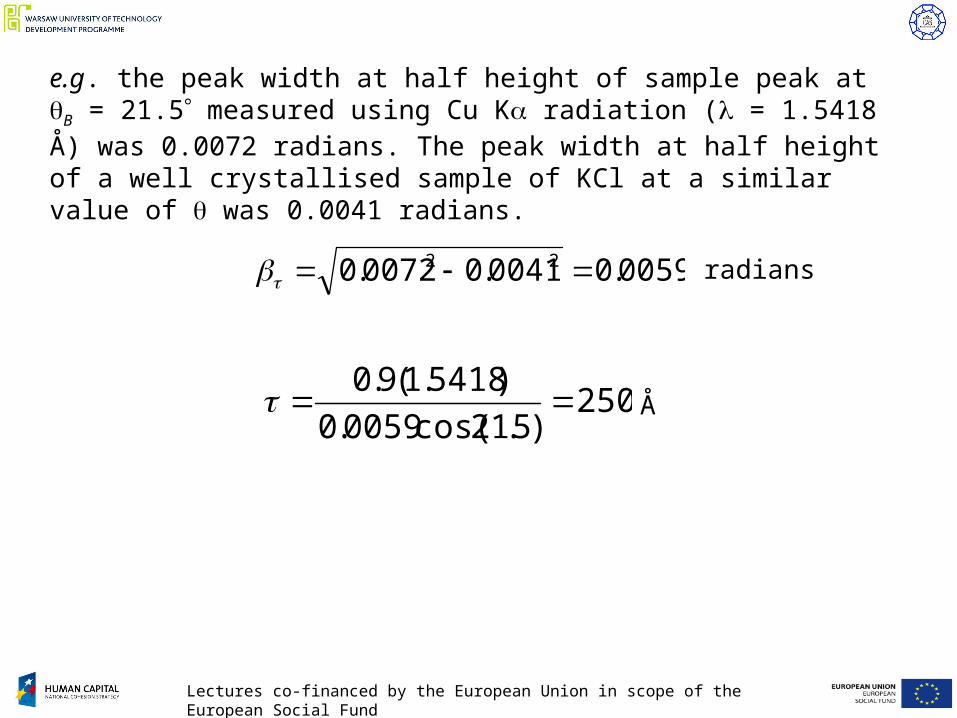
e.g. the peak width at half height of sample peak at B = 21.5 measured using Cu K radiation ( = 1.5418 Å) was 0.0072 radians. The peak width at half height of a well crystallised sample of KCl at a similar value of was 0.0041 radians.
0059.00041.00072.0 22
250)5.21cos(0059.0
)5418.1(9.0 Å
radians
Lectures co-financed by the European Union in scope of the European Social Fund
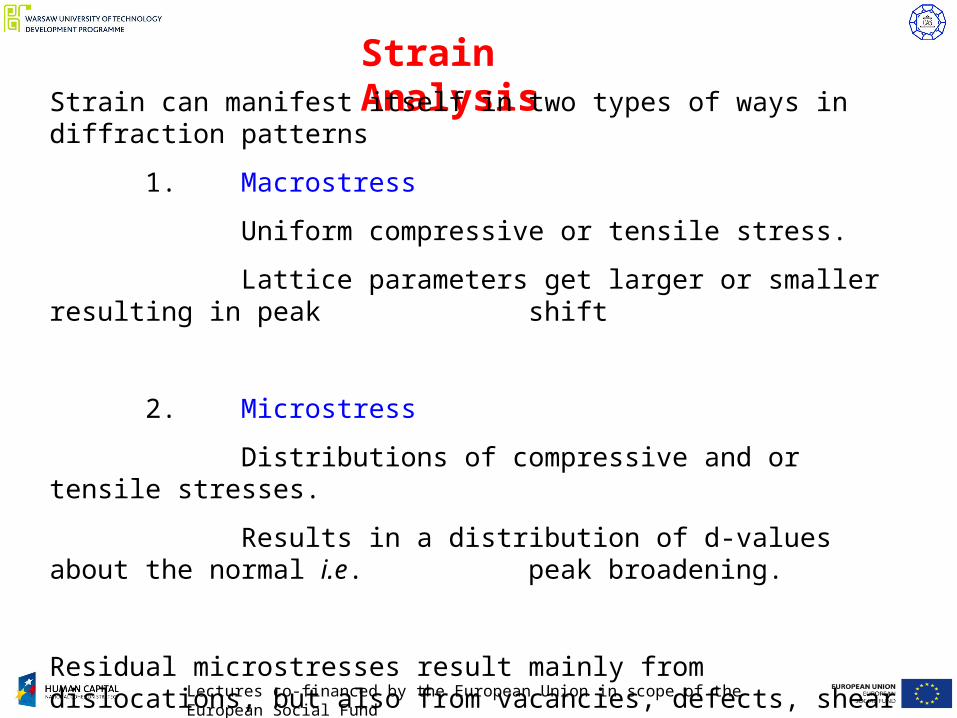
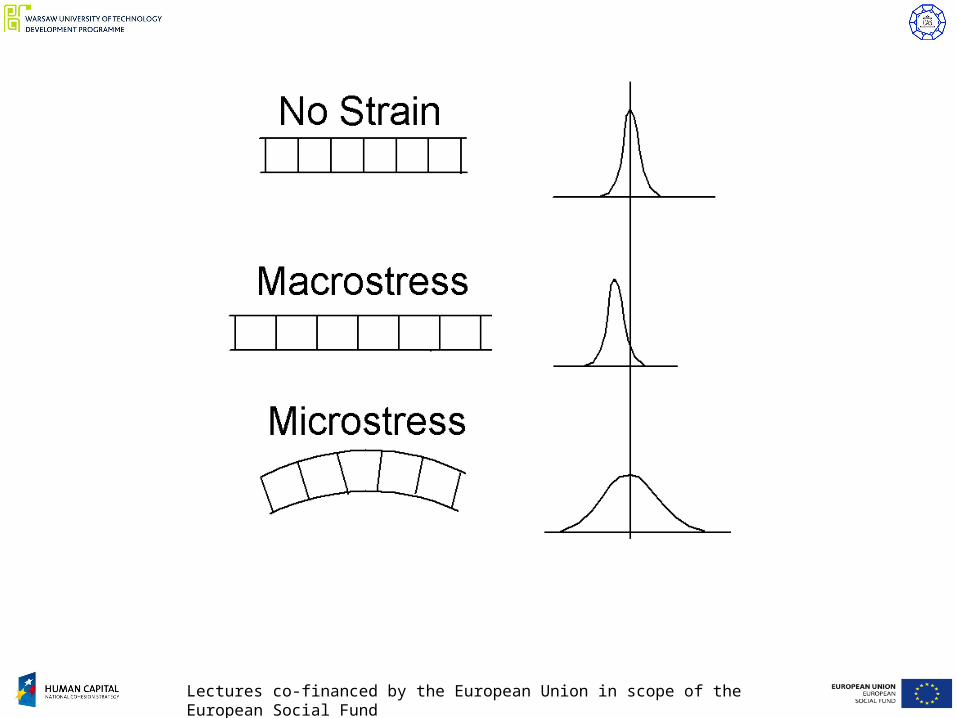
Strain AnalysisStrain can manifest itself in two types of ways in diffraction patterns
1. Macrostress
Uniform compressive or tensile stress.
Lattice parameters get larger or smaller resulting in peak shift
2. Microstress
Distributions of compressive and or tensile stresses.
Results in a distribution of d-values about the normal i.e. peak broadening.
Residual microstresses result mainly from dislocations, but also from vacancies, defects, shear planes, thermal expansion and contraction etc.
Lectures co-financed by the European Union in scope of the European Social Fund
Lectures co-financed by the European Union in scope of the European Social Fund
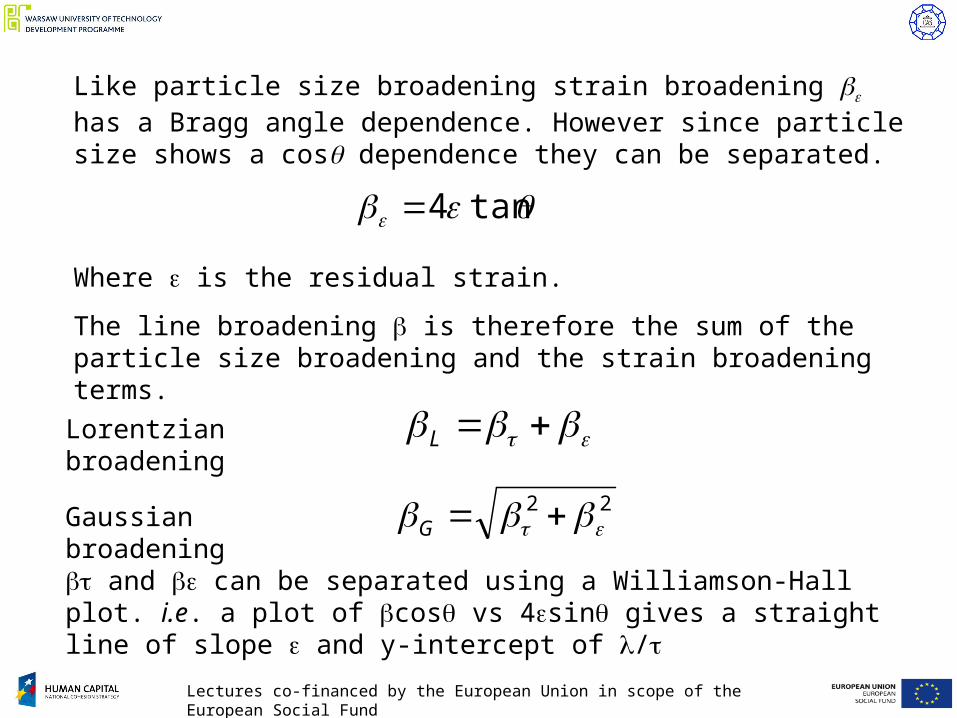
tan4
Like particle size broadening strain broadening has a Bragg angle dependence. However since particle size shows a cos dependence they can be separated.
Where is the residual strain.
The line broadening is therefore the sum of the particle size broadening and the strain broadening terms.
L
22 G
Lorentzian broadening
Gaussian broadening
and can be separated using a Williamson-Hall plot. i.e. a plot of cos vs 4sin gives a straight line of slope and y-intercept of /

Lectures co-financed by the European Union in scope of the European Social Fund
Preferred orientation: texture analysis
At the beginning of these lectures we described the powder diffraction experiment as occurring on a powder containing many randomly orientated crystallites.
In some cases this distribution of crystallites is quasi- or non-random.
For example where the crystallites show a needle like morphology, it is likely that the needles will lie flat on the specimen holder.
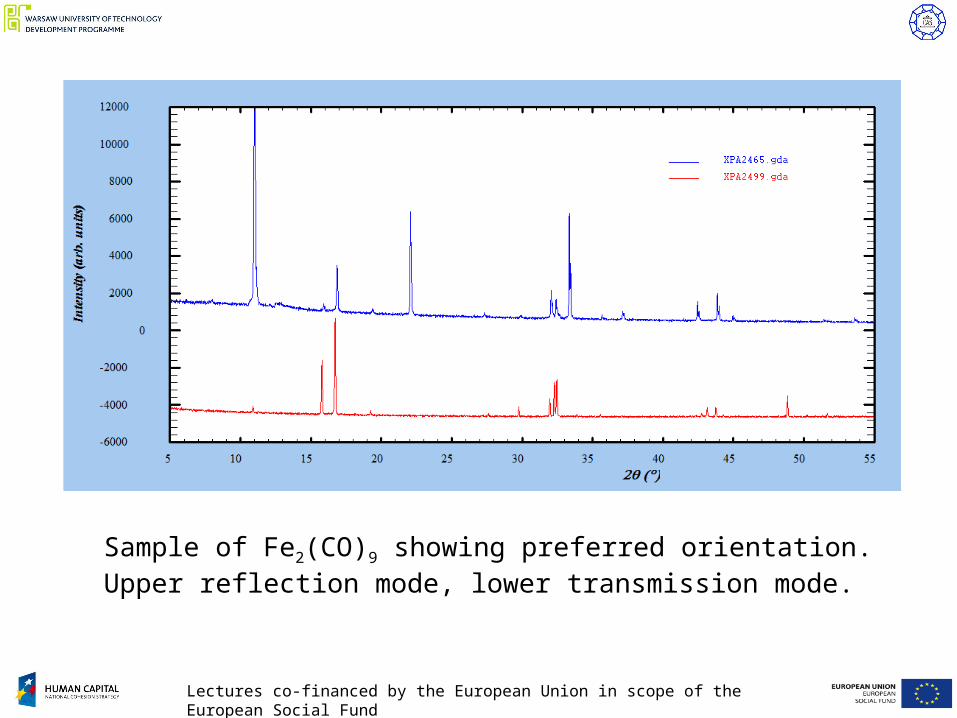
So if the needle axis was coincident with the c-axis for example, 00l peaks would be enhanced or suppressed with respect to the other hkl peaks depending on whether reflection or transmission geometry was used.
Lectures co-financed by the European Union in scope of the European Social Fund
Sample of Fe2(CO)9 showing preferred orientation. Upper reflection mode, lower transmission mode.
Lectures co-financed by the European Union in scope of the European Social Fund
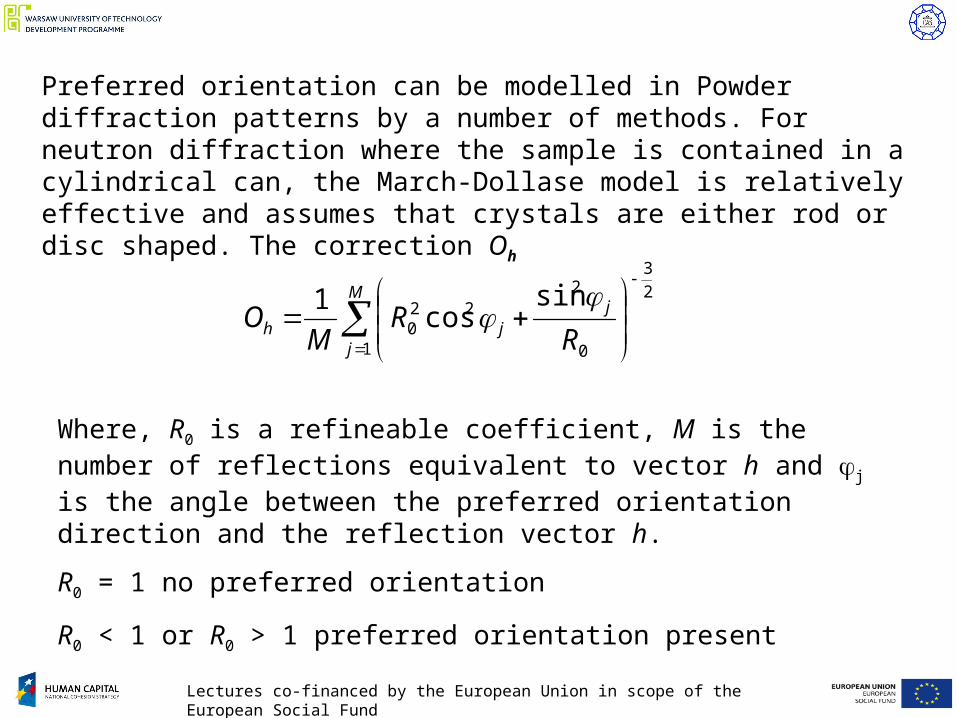
Preferred orientation can be modelled in Powder diffraction patterns by a number of methods. For neutron diffraction where the sample is contained in a cylindrical can, the March-Dollase model is relatively effective and assumes that crystals are either rod or disc shaped. The correction Oh
2
3
1 0
222
0
sincos
1
M
j
jjh R
RM
O
Where, R0 is a refineable coefficient, M is the number of reflections equivalent to vector h and j is the angle between the preferred orientation direction and the reflection vector h.
R0 = 1 no preferred orientation
R0 < 1 or R0 > 1 preferred orientation present

Lectures co-financed by the European Union in scope of the European Social Fund
Preferred orientation is particularly important in metals (sheets and wires) and also in thin film technology.
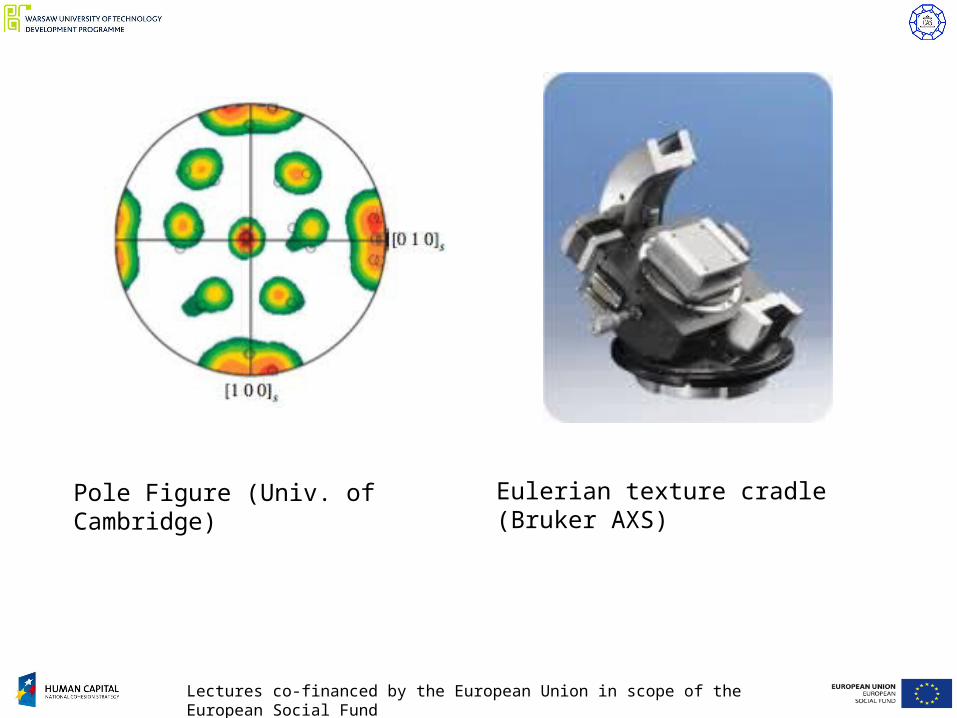
Analysis of texture involves the use of a texture cradle, which allows for rotation of the sample about its axes. This allows the intensity of a reflection as a function of sample orientation.
The detector is set to a particular 2 value so as to correspond to the particular reflection to be studied, and the sample rotated through the Debye ring.
111 Pole figure of 70-30 Brass
Ref: Elements of X-ray Diffraction, B.D. Cullity,Addison Wessley Publishing Co 1956.

Lectures co-financed by the European Union in scope of the European Social Fund
Consider a sheet of a cubic metal containing only 10 grains. If we plot the 100 intensity as a function of the sample rotation angle we would get a random distribution of spots if the grains were randomly orientated, or would see them clumped together if there was preferred orientation.
Note: because the crystal is cubic we see 3 x 10 spots for 100, 010 and 001
Lectures co-financed by the European Union in scope of the European Social Fund
Eulerian texture cradle (Bruker AXS)Pole Figure (Univ. of Cambridge)