Embed Size (px)
Citation preview

1
Leeds Joint Strategic Assessment 2018
Summary Report

2
Contents Introduction .................................................................................................................................................. 3
The purpose of the Joint Strategic Assessment (JSA) ............................................................................... 3
Accessing the JSA ...................................................................................................................................... 3
The JSA work programme ......................................................................................................................... 3
Structure of the JSA .................................................................................................................................. 4
Geographic Analysis .................................................................................................................................. 4
Headlines ...................................................................................................................................................... 6
Overall ................................................................................................................................................... 6
Population ............................................................................................................................................. 6
Inclusive Growth ................................................................................................................................... 7
Health and Wellbeing............................................................................................................................ 8
Child-Friendly City ................................................................................................................................. 8
Safe, Strong Communities ..................................................................................................................... 9
Housing ................................................................................................................................................. 9
Population ................................................................................................................................................... 11
ONS Projections v GP Registrations ........................................................................................................ 11
Rapid Growth in our most deprived communities ................................................................................. 11
A More Diverse Population ..................................................................................................................... 12
Population is still ageing ......................................................................................................................... 13
More Children and Young People ........................................................................................................... 14
Inclusive Growth ......................................................................................................................................... 16
Employment ........................................................................................................................................ 16
Earnings ............................................................................................................................................... 16
Skills and Occupational Change .......................................................................................................... 16
Business Performance – Growth, Diversity and Productivity ............................................................. 17
Health and Wellbeing ................................................................................................................................. 20
Life Expectancy and Infant Mortality ...................................................................................................... 22
Child-Friendly City ....................................................................................................................................... 31
Safeguarding of Children and Young People .......................................................................................... 31
Education and Learning .......................................................................................................................... 31
Safe, Strong and Vibrant Communities ....................................................................................................... 34
Housing ....................................................................................................................................................... 39

3
Introduction
The purpose of the Joint Strategic Assessment (JSA) The JSA aims to provide a live, interactive approach to the detailed analysis of key demographic, socio-
economic and health trends in Leeds. Its practical purpose is to shape priorities, inform commissioners
and guide the use of resources as part of the commissioning strategies and plans for the city. The
foundation of the JSA is in understanding the core drivers of health and wellbeing, with the primary
purpose to inform the two key strategies for Health and Wellbeing and Inclusive Growth.
Reducing health inequalities is central to our approach in Leeds, with improving the health of the
poorest fastest central to our ambition. Therefore in Leeds we have over the last decade adopted a
wider approach to the JSA, extending the analysis to cover the wider determinants of health to ensure
we gain a deeper insight into the relationship between health, wider-wellbeing, the economy and
environment. It also informs the Best City strategic framework, in which the Health and Wellbeing
Strategy plays a key part, alongside other strategies such as Inclusive Growth, Safer Leeds Plan, Children
and Young People’s Plan, Leeds Housing Strategy, Leeds Transport Strategy and the Better Lives
Strategy.
The JSA provides the most comprehensive and reliable source of data and analysis which the city can
use to inform and shape its priorities and interventions. We will adopt the city’s asset-based philosophy
to more effectively link quantitative and qualitative intelligence in ensuring the voices of our most
vulnerable are heard, and that the contribution and potential of our key assets is understood.
This Executive Summary provides an outline of key issues and implications identified in the latest data
and analysis available. It is supported by more detailed data, analysis, themed reports and geographic
profiles, which will be hosted on the Leeds Observatory website as we develop our approach.
Accessing the JSA Our intention is that all documents and source materials that inform the Leeds JSA will be on the Leeds
Observatory website - http://observatory.leeds.gov.uk . We are currently working to improve the
functionality of the Leeds Observatory, with the ultimate intention that we establish a web-based
approach to the JSA, where the analysis is updated as new information becomes available.
The JSA work programme The Joint Strategic Needs Assessment for 2015 made recommendations for further work in areas where
we need to gain more detailed insights, greater clarity and deeper understanding, particularly in relation
to the needs of a changing population. The recommendations included:
Work to deepen our knowledge about changes in the rates of population growth, age profiles,
ethnic composition, household make up, and those taking place, both within and between
communities, is critical. This analysis will improve our understanding of how factors such as
economic growth, labour market trends, and patterns of housing tenure all influence
demographic change, which in turn has a profound effect on service use and provision.

4
Gaining a better understanding of the health and wellbeing needs of those individuals belonging
to specific Communities of Interest (COI). These are groups of people who share an identity or
experience, which in turn may result in disadvantage, discrimination and challenges in accessing
mainstream services. A range of analysis has been undertaken or is in train including:
- Health within the Leeds Roma Community – 2016 - Health Needs Assessment of Sex Workers – 2016 - Leeds LGBT+ Mapping Project - 2017 - The State of Men’s Health in Leeds – 2017 - Women’s Health Needs Assessment - 2019
Carrying out a range of work looking at the challenges facing children and young people in the
city, including:
- Children and Young Peoples Emotional Mental Health HNA – 2016
- Children and Young Peoples Physical Activity HNA – 2016
- Maternal and Child Health Nutrition HNA - 2016
Undertaking further needs assessments, with a particular focus on mental health, including:
- Leeds in Mind: Adult Mental Health HNA - 2017
- Leeds Perinatal Mental Health HNA – 2017
The JSA builds on learning from the previous Joint Strategic Needs Assessment by adopting a continuous
approach to analysis and engagement rather than three-yearly set-piece reports. In addition to the
recommendations outlined above, the 2015 assessment reinforced the need to promote cross-policy
linkages and engage more effectively with city partners, both of which are central to the revised JSA
approach.
Structure of the JSA As stated above, we have adopted a broader approach to the JSA, extending the analysis of
determinants of health, to cover wider individual and community wellbeing, the economy and the
environment. The analysis is grouped under the following headings to facilitate linkages with our Best
City priorities:
Population
Inclusive Growth
Health and Wellbeing
Child-Friendly City
Safe, Strong and Vibrant Communities
Housing
Geographic Analysis The detailed analysis underpinning the JSA includes localised geographic analysis to help understand the
challenges and opportunities encountered in different localities and communities across the city. In

5
Leeds, as elsewhere, various geographies are used by different services and partners to both deliver
services and work with local communities. Beyond ward boundaries, these include Local Care
Partnerships, School Clusters, Priority Neighbourhoods and so on. The JSA adopts the most appropriate
boundary depending on the analytical theme, rather than attempting to ‘shoe-horn’ the analysis into a
single geography. The Leeds Observatory allows analysis to be mapped using a range of ‘administrative’
boundaries. The building blocks for the analysis are usually comprised of the statistical geographies of
either Lower Super Output Areas (LSOAs1) or Middle Super Output Areas (MSOAs2) depending on the
availability of data.
1 LSOAs typically have an average 1,500 residents and 650 households. There are 482 LSOAs in Leeds. 2 MSOAs are built up from 3-7 individual LSOAs. The average number of people living in an MSOA is 7,000. There are 107 MSOAs in Leeds.

6
Headlines
Overall The Leeds economy continues to grow and there are genuine strengths in our overall levels of
employment. There is continued growth in high quality jobs in digital, health, social care,
professional and managerial roles.
Our comparative position with other Core Cities on most health and social care indicators is
strong, although as with all Core Cities, stubborn challenges and inequalities remain.
There is evidence of an intensification of inequalities, confirming the very dynamic and multi-
faceted challenges often found in our most deprived communities and the requirement for us
and partners to respond more collaboratively – particularly at either end of the age-spectrum.
The assets we have in communities and our growing city centre reflect a confident and
ambitious city.
The analysis in this Joint Strategic Assessment supports the priorities and ambitions outlined in
our Health and Wellbeing and Inclusive Growth strategies.
Our ambition to improve the health of the poorest the fastest and drive compassionate,
inclusive economic growth is supported by the evidence from the JSA.
In particular, commissioners and policy makers need to better understand the actions they can
take in relation to the interplay between population growth in deprived areas, low skills, low-
waged employment, poor quality private rented accommodation and lifetime health.
Social capital in communities is a protective factor that mitigates the worst impacts of these
social determinants. So, how partners can better work together to create the conditions for
people to reshape the bonds of modern communities and build community assets will be a
central factor in successfully responding to these challenges.
Population Since 2011 there has been a disparity between ONS population estimates and data based on GP
registrations. The greatest variance in population numbers is found primarily in our most
deprived communities, particularly for the male population of these areas.
International immigration remains an important factor behind the city’s growth, with the
population continuing to become more ethnically diverse since the 2011 Census. EU countries
such as Romania, Poland, Italy and Spain make up a significant proportion of new arrivals, as do
countries from better-established migration routes from south Asia and parts of Africa.

7
The trend of the city’s ageing population continues, as the baby-boomer generation grows older
there will be a range of implications for service provision, not least a far more ethnically diverse
older population, with a greater concentration in the city’s inner areas.
The population of children and young people is growing at a faster rate than the population of
the city as a whole, and this is particularly acute in our most deprived communities. Across the
city as a whole the number of 11 year olds grew by 9% between 2011 and 2015, in the poorest
ten percent of neighbourhoods it grew by 33%, whilst in the poorest three percent of
neighbourhoods the number grew by 91%. This has implications for health and social care as
people age. International evidence shows a strong association between deprivation, income
inequality and a variety of health problems (substance misuse, mental health, earlier onset of
long term health conditions).
Leeds has the youngest age profile of the core cities. Whilst population growth in poorer
communities undoubtedly offers challenge, it also offers opportunities for longer term benefits,
for example if we can improve education and skills and maximise the potential of the city’s
young people, this will improve health over a lifetime.
Inclusive Growth 450,000 people work in Leeds, with three quarters in the private sector, putting the city in the
top five nationally for private sector employment. Very strong private sector growth since 2010
has maintained the city’s employment rate, with 77% of the working age population in
employment (June 2018), above regional and national averages.
Leeds continues to be the main driver of economic growth for the city-region, and has key
strengths in financial and business services, advanced manufacturing, health and creative and
digital industries, with a strong knowledge-rich employment base. These strengths, linked to
the city’s universities and teaching hospitals, are major innovation assets for Leeds. Leeds also
performs well in terms of business start-ups, with strong growth in digital and medical
technologies, telecoms and creative industries.
An area for concern is the ‘hollowing-out’ of skilled and semi-skilled occupations increasing
across a wider range of sectors. Recently this has been accompanied with growth in high
skilled/high valued jobs in the knowledge-based sectors, together with growth in lower
skilled/lower income jobs often in consumer-services, which combined with flexible
employment and perhaps the early impact of welfare reforms has seen a growth of in-work
poverty.
Despite our high levels of employment and doing relatively well in terms of productivity per
worker - reflecting our significant knowledge-base, our economic output growth has only been
mid-table amongst the core cities in recent years. This could be a hangover from the ‘great
recession’, since when key sectors particularly in financial and business services have faced
prolonged challenges, or due to recent employment and output growth being in ‘lower
productivity’ sectors e.g. consumer services.

8
There continues to be strong growth in quality jobs associated with digital, health and social
care, and professional and managerial roles.
Health and Wellbeing Realising our ambition for Leeds to be the best city for health and wellbeing requires
improvements in all the factors that support healthy lives: the social determinants - particularly
employment and skills; living conditions - such as housing, air quality, access to green space; and
lifestyle - including physical activity levels, food choices, alcohol intake and smoking.
Over 170,000 people in Leeds live in areas ranked amongst the most deprived 10% nationally.
One in five children in Leeds lives in poverty. Childhood poverty has lifelong implications for
health and wellbeing.
At the heart of our Health and Wellbeing Strategy is our ambition to improve the health of the
poorest, fastest. Analysis of key indicators confirms that, in line with wider national trends,
people living in deprived neighbourhoods continue to have poorer health outcomes. Whilst
there have been some improvements (smoking continues to reduce, more people are surviving
for longer with long term conditions) in other cases progress has slowed and the gaps have
widened.
A particular concern is the stalling of improvements in life expectancy for people living in
deprived areas.
The 2017/18 Annual Report from the Director of Public Health in Leeds identified a number of
areas of concern: infant mortality, multiple morbidities, life expectancy, deaths in men from
drug overdose, deaths in women from alcoholic liver disease, a rise in male suicides, and a rise
in women who self-harm.
Child-Friendly City More children in Leeds are now safe and secure in their families; children and young people have
a greater voice and influence; and an increasing number are achieving good outcomes. However,
this is an ongoing journey and we need to maintain this progress, staying focused on keeping
children safe and working collectively to ensure that families get the support they need.
Since 2011, the number of children looked after has reduced by 12% in Leeds compared to an 11%
rise over that period across England. More recently, numbers rose slightly during 2017/18 from
1,253 (76.6 per 10,000 children and young people) to 1,275 (77.4 per 10,000), broadly tracking
the general increase in the under-18 population in the city.
Educational attainment, particularly of more disadvantaged children, is still a significant
challenge. Performance at Foundation and Key Stage Two is below regional and national
averages, especially amongst disadvantaged children, with the gap in attainment towards the

9
bottom of the rankings. This performance recovers somewhat by Key Stage 4, where the city’s
performance (for non-disadvantaged children) is closer to the national average.
The Health Foundation note that the single most modifiable social determinant of health is a
person’s level of education and skill. With population growth most acute in the poorest areas of
the city, it will be necessary for commissioners of health, education and community services to
work together to understand the immediate and longer term implications for Leeds.
Safe, Strong Communities The analysis suggests some intensification of inequalities across the city and reaffirms the very
dynamic and multi-faceted challenges often seen in our most deprived communities and the
requirement for us and partners to respond more collaboratively – particularly at either end of
the age-spectrum.
Child poverty is at the root of many poor outcomes for children and young people and their
families. In 2015 almost 20% of children (under 16s, 28,000 children)) were estimated to live in
poverty in Leeds, compared to 17% nationally.
National estimates of ‘relative poverty after housing costs’ when applied to Leeds equate to
almost 172,000 people living in relative poverty.
More recently we have seen growth of in-work poverty, with an estimated 70,000+ working age
adults across the city being from working households and living in poverty
After a sustained period of crime reduction both nationally and locally, crime levels have started
to increase. In Leeds, we have seen total recorded crime rise over the last three years. In 2017,
there were 95,011 crimes, an increase of 11.7% on the previous year. The reasons for these
increases are not straight forward. Although there have been changes in how crimes are
reported, the nature and type of crime has also changed: cyber related crime has become more
prevalent and there are a multitude of platforms that are now used to exploit and groom
vulnerable people.
Housing The overarching challenge is to provide enough quality and accessible homes to meet the city’s
growing population, whilst protecting the quality of the environment and respecting community
identity. Within this context the need for affordable housing and affordable warmth are key
issues. Good quality housing is a pre-requisite for good health. People who live in clean, warm,
safe and affordable homes are less likely to experience housing-related ill health.
The mix of housing tenure has changed significantly over the last two decades. The significant
growth of the private rented sector is a key trend which has brought with it associated
challenges, particularly at the low cost end of the market where housing conditions can be poor.
The only reliable city-wide data is the 2011 Census, confirms growth in the private rented sector

10
almost doubled between 2001 and 2011 to 18%. It is likely that this rate of change has
continued if not accelerated more recently.
Research highlights the change in composition of our most deprived neighbourhoods influenced
by the growth of the private rented sector, with an expansion of ‘disconnected’
neighbourhoods. It is notable that some of our neighbouring authorities, particularly Wakefield,
have far more positive housing markets in their relatively deprived areas. The extent to which
these localities provide affordable ‘starter housing’ for a wider geography should be considered.

11
Population
ONS Projections v GP Registrations According to the Office for National Statistics (ONS) mid-year estimates for 2017, there were 785,000 people living in Leeds, up by over 33,000 from the 2011 Census. Our Public Health population model (based on GP registrations, but accounting for cross district registrations) puts the population at 846,000. Until 2011 the ONS mid-year estimates for Leeds population tallied closely with GP registration populations. Following the 2011 Census, ONS revised their figures downwards and since then there has been a disparity between ONS estimates and data based on GP registrations. Historically, duplicate registrations were a problem in GP registrations, though it is thought that over-
counting has been addressed in recent years. However, Leeds’s large student population is an added
element of over-counting, with the delay in the removal of student registrations being a factor. That
said it is unlikely the scale of the disparity can be fully explained by this over-counting.
Figure 1: 2017 Mid-year population estimates for Leeds (blue) and England and Wales (green)
Source: ONS mid-year estimate of population 2017
Rapid Growth in our most deprived communities The greatest variance in population numbers is found in areas of immigration and high population movement, primarily in our most deprived communities, particularly the male population of these areas. Either ONS is continually underestimating the immigration of people into poorer areas of Leeds, or the

12
GP registration data is significantly over-counting the population. This will be the subject of future research in collaboration with Leeds Institute of Data Analytics at the University of Leeds.
Intelligence regarding the demand for services confirms these very rapid demographic changes,
particularly in our most deprived communities, not only driven by immigration, but also influenced by
the local housing tenure, Figure 2 below illustrates these changes.
Figure 2: Population Change by Electoral Ward 2011-2016
Source: ONS Mid-Year Estimates 2011 & 2016
A More Diverse Population The population has continued to become more diverse since the 2011 Census, in terms of age, countries
of origin and ethnicity. The nationality breakdown of non-British National Insurance Number (NINo)
applicants, can be used to provide an indication of economic migration. Between 2011 and 2016, the
highest numbers of non-British NINo applicants in Leeds were Polish and Romanian nationals (see Figure
3 below).

13
Source: Department for Work & Pensions
Population is still ageing The backdrop to these localised pressures is the wider trend of the city’s ageing population: as the baby-
boomer generation grows older there will be a range of implications for service provision. The 65+ age
group is projected to grow by over 15,000 (+13%) between 2016 and 2026.
Source: ONS Mid-Year Population estimates 2008-2016 & Population Projections 2016
0
200
400
600
800
1000
1200
1400
1600
1800
2000
Romania Poland Italy India Spain Portugal China Lithuania Pakistan Greece
Figure 3: NINo applications by overseas nationals in Leeds10 largest nationality groups in 2017/18
2011/12 2012/13 2013/14 2014/15 2015/16 2016/17 2017/18
0
100
200
300
400
500
600
700
800
900
2008 2009 2010 2011 2012 2013 2014 2015 2016 2017 2018 2019 2020 2021 2022 2023 2024
Po
pu
lati
on
(Th
ou
san
ds)
Figure 4: Leeds population by age
Age 0-17 Age 18-34 Age 35-49 Age 50 - 69 Age 70+

14
There are currently higher numbers of older people in the city’s outer areas, however this may change
as the recent shifts in the composition and spatial concentration of the population work through,
resulting in a far more ethnically diverse older population, with a greater concentration in the city’s
inner areas.
Source: Index of Multiple Deprivation 2015 Mid-Year Population Estimates 2016
More Children and Young People Although the increase in the birth rate, from the early 2000s appears to have plateaued at around
10,000 per annum over the last six years, the child population is still growing at a faster rate than the
population of Leeds as a whole. Again this is most acute in our deprived communities. This is illustrated
by the variations in population growth for 11 year olds between 2011 and 2015 when, for the city as a
whole, the 11 year-old population grew by 9%, and, during the same period, it grew by almost a third in
our 10% most deprived communities as identified in the Index of Multiple Deprivation, and by a
staggering 91% in the 3% most deprived communities.
As the age-profile of these areas show a greater proportion of residents of childbearing age, combined
with higher housing densities as well as patterns of migration, it is no surprise the city’s most deprived
communities show higher birth rates than the Leeds average. However, it is the scale of the change that
has most impact on the provision of services.
Data from the city’s schools, shows there are more children and young people of black and minority
ethnic heritage, particularly Black African and White Eastern European. The number of children and
young people with English as an additional language (EAL) has increased from 13% in 2010 to 19% in
2017. After English, the main languages spoken are Urdu, followed by Polish, which has doubled since
2012. There have also been substantial increases, particularly in primary schools in the number of
0
20000
40000
60000
80000
100000
120000
140000
160000
180000
200000
1 2 3 4 5 6 7 8 9 10
Figure 5: Age Profile for each IMD 2015 decileMid-year population estimates 2016
0-15 Years 16-64 Years Over 65 Years

15
children speaking Kurdish or Romanian as their first language. Altogether nearly 200 languages are
spoken by children studying in Leeds schools.
In the last 10 years, the increase in the children’s and young people’s population has been in the primary
school age groups, with an increase of 19,435 children in the 0-10 age group (2007-2017).
Over the next 10 years, this increase will affect the secondary school age group, with a big rise in the
number of teenagers in Leeds. There will be a projected 18,348 more young people aged between 11
and 19 years old in 2027 compared to 2017.
Leeds also has one of the highest student populations in the UK with over 62,000 students attending the
city’s universities, with students heavily concentrated in the city centre and Inner West areas.

16
Inclusive Growth During the two decades prior to the global financial crisis, the city’s economy experienced significant growth, driven in large part by financial and business services. Leeds had established itself as a vibrant, diverse and dynamic city, with a strong knowledge-based economy. During the recession Leeds fared better than many of its neighbours, and workplace-based employment in the city is now estimated to have recovered to pre-recession levels.
However not everyone is benefitting from this economic success. Poverty and deprivation remain
significant challenges. Despite very strong performance in job creation, low pay is an increasing
problem, with people caught in a loop of low pay, low skills and limited career progression. These
challenges not only limit the opportunities for individuals, they hold back the economy, affect
productivity, cause skills shortages, and create additional costs for business and the public sector.
Employment Latest estimates suggest that 444,000 people work in Leeds, of which around three quarters are employed in the private sector, putting the city in the top five nationally for private sector employment. Indeed, Leeds has witnessed very strong private sector growth since 2010, which in turn has maintained the city’s employment rate, with 77%3 of the working age population in employment, well above regional and national averages. This strong employment performance is mirrored in the city’s unemployment rate which is relatively low, and only slightly above the national rate and amongst the lowest of the core cities. This position is further confirmed by the below national, regional and core city averages proportion of working-age households in the city where no-one is in employment, so called ‘workless households’.
Earnings In many ways the earnings of Leeds workers reflect the economic success of the city. Overall the average weekly earnings for those working in Leeds are close to the national average at £552 per week. Although the average weekly wage for workers who live in Leeds is slightly lower than the workplace average at £548, this gap is the lowest of all core cities. However, this relatively strong performance in earnings at a city-wide level masks some significant inequalities in the labour market. This is linked to the growth in low skilled jobs (see below) and flexible employment and perhaps the early impact of welfare reforms. For some people, the city’s strong employment rate, rather than providing a route out of poverty, has resulted in a growth of in-work poverty. It is estimated that over 71,000 working age adults across the city are from working households and in poverty. In addition an estimated 65,000 full-time workers in Leeds earned less than the Living Foundation’s Living Wage in 2017.
Skills and Occupational Change The qualification profile of the city’s workforce generally mirrors the national average, with 36% achieving NVQ level 4 or equivalent and over half qualified at level 3 or above. In contrast to our strong
3 June 2018

17
knowledge base, over 1 in 10 people in Leeds have no qualifications, above both regional and national averages. However, perhaps the key area for concern is the continually changing labour market, where in response, primarily to new technologies, there has been a ‘hollowing-out’ of skilled and semi-skilled occupations, traditionally in the manufacturing sector, but now increasingly across a wider range of sectors. In recent years this has been accompanied by growth in both high skilled, high valued jobs in the knowledge-based sectors, and lower skilled, lower income jobs often in consumer-services (see Figure 6).
Source: Annual Population Survey – workplace analysis
Business Performance – Growth, Diversity and Productivity Leeds continues to be the main driver of economic growth for the city-region, and has key strengths in financial and business services, advanced manufacturing, health and creative and digital industries, with a strong knowledge-rich employment base. These strengths linked to the city’s universities and teaching hospitals are major innovation assets for Leeds. Leeds also performs well in terms of business start-ups, with strong growth in digital and medical technologies, telecoms and creative industries.
-25 -20 -15 -10 -5 0 5 10 15 20 25
TOTAL
Elementary
Operatives
Sales
Person Services
Skilled
Admin/Secretarial
Assoc,…
Professional
Managerial
Figure 6: Total Employment Occupation Change 2007-2017
Leeds City Region Yorkshire & Humber Leeds

18
Source: WYCA Regional Econometric Model
The relative diversity of the Leeds economy has also been a key asset in its resilience to economic shocks, with the city being able to retain its manufacturing strength as well as consolidate its position as a major centre for finance and business services. However despite our relatively high levels of employment, like other northern cities our productivity remains a key issue, although Leeds does relatively well in terms of productivity per worker (GVA per head), perhaps a reflection of our significant knowledge-based economy, consistently being the strongest performing core city after Bristol. Our economic output growth has only been mid-table in relation to core cities in recent years, perhaps a hangover from the ‘great recession’, since when key sectors particularly in financial and business services have faced prolonged challenges. Figure 8 below illustrates the relationship between employment and productivity in England’s core cities, by indexing employment rates and GVA per head. Bristol performs relatively well against both indicators, Leeds benefits from a strong employment rate, whereas Manchester has relatively strong GVA performance.
-4.0%
-2.0%
0.0%
2.0%
4.0%
6.0%
8.0%
1998 1999 2000 2001 2002 2003 2004 2005 2006 2007 2008 2009 2010 2011 2012 2013 2014 2015 2016
Figure 7: Annual Growth Rate in nominal gross value added (GVA)
United Kingdom Yorkshire and The Humber Leeds

19
Source: Nomis, ONS
Birmingham
Bristol
Leeds
Liverpool
Manchester
Newcastle Upon TyneNottingham
Sheffield
0
10
20
30
40
50
60
70
80
90
100
0 10 20 30 40 50 60 70 80 90 100
Ind
exed
Gro
ss V
alu
e A
dd
ed (
per
hea
d)
>
Indexed Employment Rate - Working Age >
Figure 8: Productivity vs Employment

20
Health and Wellbeing The first task in addressing the challenges posed by population health trends is to understand what drives health and wellbeing, and our level of control or autonomy over these factors. Judged by increases in life expectancy we are healthier now than we have ever been. Historic improvements in sanitation, nutrition and vaccination followed by post-war increases in living standards and the introduction of free health care all played a part. More recently, reductions in smoking rates and better treatment for heart conditions and cancer have continued to drive reductions in premature mortality. However we have also seen a transition from mortality to morbidity, much of which is preventable, and a clearer understanding about how inequalities in morbidity are driven by a combination of socio-economic factors, community, social capital, behaviour, genetics and the health and social care system itself. The Kings Fund (2018) describes the four pillars of a population health system as:
The wider determinants of health;
Health behaviours and lifestyles;
An integrated care health and care system;
The places and communities we live in and with.
We have structured the JSA to understand how the city is performing against these ‘wider factors’ and how we might gain traction and exert pressure on the key issues that have arisen, as well as testing the robustness of our existing strategies and plans. In Leeds, health and wellbeing starts with people. The Leeds Health and Wellbeing Strategy describes how we collectively nurture our shared assets and put in place the conditions for people to live fulfilling and healthy lives. Becoming the Best City for health and wellbeing, one that improves the health of the poorest the fastest, requires improvements in the social determinants of health, living conditions and lifestyle choices. A stronger focus on social policies and place shaping will help us to live healthier lives, not just longer ones (Kings Fund, 2018). Leeds closely follows the pattern set across the UK in which significant inequalities exist on virtually every measure, despite an overall picture of improvement. The Office for National Statistics (2018) shows that, after a period when the gap between the most and least deprived narrowed, rates for age-standardised, avoidable mortality stabilised and have once again started to widen. The Kings Fund (2018) described ‘the double jeopardy of inequalities in health’ for people in poorer areas – with far shorter lives spent in poorer health – compared to those in richer areas. Our population in Leeds is nearly 800,000 people. Over 170,000 people in Leeds live in areas ranked amongst the most deprived 10% nationally. Our strategy describes the need for long term co-ordinated action to become a Child Friendly City, and this JSA describes how one in five of our children lives in poverty. Children living in deprived neighbourhoods are more likely to experience multiple disadvantages, die earlier, and spend more years in ill health. The opportunities and challenges presented by an ageing population are well-known. In high numbers, older people contribute in countless ways to rich and vibrant communities – through high levels of volunteering, unpaid caring roles and acting formally and informally as community connectors. We also know that many older people are also more likely to have multiple long term conditions. An Age Friendly City requires us to better understand how best to promote healthy ageing across the life-course

21
and the changing population at both ends of the age spectrum also provides opportunities for intergenerational work, ways to address loneliness and to promote social inclusion across all age groups. The majority of early deaths are related to unhealthy lifestyles which are themselves related to socio-economic factors such as poor housing, access to healthy food, green space and opportunities for exercise. Improving health simply cannot be achieved without improved social and economic conditions for all residents. Therefore we must enhance our focus on education, housing, skills and health improvement in our poorest neighbourhoods. Focusing our efforts on the conditions that create good health will enable us to address the problems related to anxiety and depression, insufficient fruit and vegetable consumption, low levels of physical activity, smoking and excessive alcohol use – all factors that are often present in people who develop long term health conditions. To be the best city for health and wellbeing everyone must work together to get mentally and physically healthier and this starts with understanding how the evidence revealed in this JSA might impact on all our residents, particularly people living in deprived areas. The reason why we must continue to focus on work, skills, population and housing as key building blocks for health is because the evidence is stark. If we neglect the socio-economic context the ramifications for lifetime health are clear. The Kings Fund (2018) outlines the following evidence, which clearly shows how health is impacted by social factors:
Every 10% increase in unemployment is associated with a reduction in life expectancy of one
year;
Every 10% increase in an area where housing was deemed unfit was associated with a two-
month reduction in life expectancy ;
Every 10% increase in the proportion of older people in an area claiming pension credit was
associated with a reduction in life expectancy of six months;
Education is the single most important modifiable social determinant of health, and skill levels
at age 18 correlate to life time health (Health Foundation, 2017);
Evidence shows that income plays a key role in managing health; managing on a low income is
stressful, related to unhealthier behaviours and the ability to buy health improving goods
(Wickham et al, 2016);
Economically worse-off children have worse cognitive, socio-behavioural and health outcomes
independent of other factors associated with child poverty, e.g. household and parental
characteristics (Mullainathan and Shafir, 2013).
The wider determinants of health and wellbeing are examined throughout the report. This section takes a lead from the Annual Report from the Director of Public Health by focusing on a number of health indicators to understand the current position in the city.

22
Life Expectancy and Infant Mortality Female Life Expectancy in Leeds -
Source: Leeds Public Health Intelligence Team
Female life expectancy has stagnated in recent years, with the gap between deprived communities and the city average widening during the period 2013-15. In ‘deprived Leeds’ (10% most deprived Index of Multiple Deprivation 2015) the life expectancy at birth figure has fallen overall since 2010-12, however none of these changes are classed as statistically significant. In terms of wider comparisons, Leeds remains one of the top three core cities for female life expectancy whilst a number of core cities have seen a more significant and continuing trends in the decline of this rate. Since 2006-08, Leeds has had a statistically significantly lower life expectancy at birth for females than England. The national trend for female life expectancy is stagnant with virtually no uplift for the last three years. Male Life Expectancy in Leeds
Source: Leeds Public Health Intelligence Team
3.4
3.6
3.8
4.0
4.2
4.4
4.6
4.8
76.0
77.0
78.0
79.0
80.0
81.0
82.0
83.0
84.0
85.0
2010-12 2011-13 2012-14 2013-15 2014-16
Gap
DSR
per
10
0 0
00
Figure 9a - Life expectancy at birth - Female
Gap Deprived Leeds Not Deprived
77.5
78.0
78.5
79.0
79.5
80.0
20
10-12
20
11-13
20
12-14
20
13-15
20
14-16
DSR
per
10
0 0
00
Figure 9b - Life expectancy at birth - Female - Deprived
Rate UCI LCI
4.4
4.6
4.8
5.0
5.2
5.4
5.6
5.8
6.0
6.2
71.0
72.0
73.0
74.0
75.0
76.0
77.0
78.0
79.0
80.0
81.0
2010-12 2011-13 2012-14 2013-15 2014-16
Gap
DSR
per
10
0 0
00
Figure 10a - Life expectancy at birth - Male
Gap Deprived Leeds Not Deprived
73.0
73.5
74.0
74.5
75.0
75.5
76.0
20
10-12
20
11-13
20
12-14
20
13-15
20
14-16
DSR
per
10
0 0
00
Figure 10b - Life expectancy at birth - Male -Deprived
Rate UCI LCI

23
Male life expectancy has also stagnated in Leeds. The major contribution to the city-wide levelling-off is a decrease in life expectancy in ‘deprived Leeds’. Once again, none of these changes in deprived Leeds is statistically significant, however the trend of year on year increases in the inequality gap is concerning. Looking more widely, Leeds is ranked third for male life expectancy within the core cities group, where the levelled off trajectory is also present. Compared to national trends, Leeds has lower rates than England (Leeds 78.2, England 79.5 – 2014-16) In summary, the widely reported recent slowing in life expectancy gains at a national level are reflected in the latest data for the city. The data also confirms the stubborn gap in life expectancy between our most deprived and least deprived communities emphasizing the need to improve the socio-economic conditions in our most challenging communities. Infant Mortality
Source: Leeds Public Health Intelligence Team
‘Infant mortality’ is the death of a live-born baby before their first birthday. Infant mortality rates have increased in Leeds. The gap between ‘deprived Leeds’ and the city-average has fluctuated but data for the most recent period (2014-16) has shown an increase. Although more broadly Leeds remains in the lowest three core cities for Infant Mortality, the latest analysis confirms the need to help ensure that parents are well prepared for pregnancy and that families with complex lives are identified early and supported.
0.0
0.5
1.0
1.5
2.0
2.5
0.0
1.0
2.0
3.0
4.0
5.0
6.0
7.0
2010-12 2011-13 2012-14 2013-15 2014-16
Gap
Infa
nt
Dea
ths
per
10
00
live
bri
ths
Figure 11a - Infant Mortality - Person
Gap Deprived Leeds Not Deprived
0.0
1.0
2.0
3.0
4.0
5.0
6.0
7.0
8.0
20
10-12
20
11-13
20
12-14
20
13-15
20
14-16
DSR
per
10
0 0
00
Figure 11b - Infant Mortality - Person -Deprived
Rate UCI LCI

24
Preventable Mortality
Source: Leeds Public Health Intelligence Team
Preventable deaths are a measure of the success of Public Health interventions where deaths could have been prevented. Preventable mortality remained fairly constant in Leeds during the 2012-2016 period. The one notable change was a slight increase in ‘deprived Leeds’, however, none of the changes were statistically significant. Though below the national average, Leeds is one of the better performing core cities. Deprivation is a key contributor to this indicator, looking at nationwide analysis, the most deprived communities (decile 1 IMD) show double of the rate of that in the least deprived communities (decile 10 IMD). Admissions for deliberate Self-Harm
Source: Leeds Public Health Intelligence Team
0.0
20.0
40.0
60.0
80.0
100.0
120.0
140.0
160.0
180.0
200.0
0.0
50.0
100.0
150.0
200.0
250.0
300.0
350.0
400.0
2012-14 2013-15 2014-16
Gap
DSR
per
10
0 0
00
Figure 12a - Mortality rate from causes considered preventable - Person
Gap Deprived Leeds Not Deprived
290.0
300.0
310.0
320.0
330.0
340.0
350.0
360.0
20
12-14
20
13-15
20
14-16
DSR
per
10
0 0
00
Figure 12b - Mortality rate from causes considered preventable - Person - Deprived
Rate UCI LCI
140.0145.0150.0155.0160.0165.0170.0175.0180.0185.0
0.0
100.0
200.0
300.0
400.0
500.0
2012-14 2013-15 2014-16 2015-17
Gap
DSR
per
10
0 0
00
Figure 13a - Emergency Hospital Admissions for Intentional Self-Harm - Female
Gap Deprived Leeds Not Deprived
300.0
320.0
340.0
360.0
380.0
400.0
420.0
440.0
20
12-14
20
13-15
20
14-16
20
15-17
DSR
per
10
0 0
00
Fig 13b- Emergency Hospital Admissions for Intentional Self-Harm - Female - Deprived
Rate UCI LCI

25
Source: Leeds Public Health Intelligence Team
Female rates of self-harm, as represented by hospital admissions are much higher than rates for males. In 2015-17 the rate for females in Leeds was 257, for males the rate was 158. Whilst the trajectories for females have been upward since 2013-15, the inequality gap has reduced as rates in non-deprived Leeds have increased more quickly. The inequality gap remains large. Whilst rates for males are lower than females overall, the inequality gap in Leeds has risen consistently since 2013-15. Leeds deprived now has over double the rate of non-deprived Leeds. Suicide Rates
Source: Leeds Public Health Intelligence Team
Female rates of suicide are too unstable to analyse at a sub-Leeds level. However, male suicides, due to the larger number are more statistically reliable. There is a growing inequality gap.
0.0
50.0
100.0
150.0
200.0
0.0
50.0
100.0
150.0
200.0
250.0
300.0
350.0
2012-14 2013-15 2014-16 2015-17
Gap
DSR
per
10
0 0
00
Figure 14a - Emergency Hospital Admissions for Intentional Self-Harm - Male
Gap Deprived Leeds Not Deprived
200.0
220.0
240.0
260.0
280.0
300.0
320.0
340.0
360.0
20
12-14
20
13-15
20
14-16
20
15-17
DSR
per
10
0 0
00
Figure 14b - Emergency Hospital Admissions for Intentional Self-Harm - Male - Deprived
Rate UCI LCI
6.6
6.8
7.0
7.2
7.4
7.6
7.8
8.0
8.2
0.0
5.0
10.0
15.0
20.0
25.0
2012-14 2013-15 2014-16
Gap
DSR
per
10
0 0
00
Figure 15a - Suicides - Male
Gap Deprived Leeds Not Deprived
0.0
5.0
10.0
15.0
20.0
25.0
30.0
20
12-1
4
201
3-15
20
14-1
6
DSR
per
100
000
Figure 15b - Suicides - Male - Deprived
Rate UCI LCI
26
Source: Leeds Public Health Intelligence Team
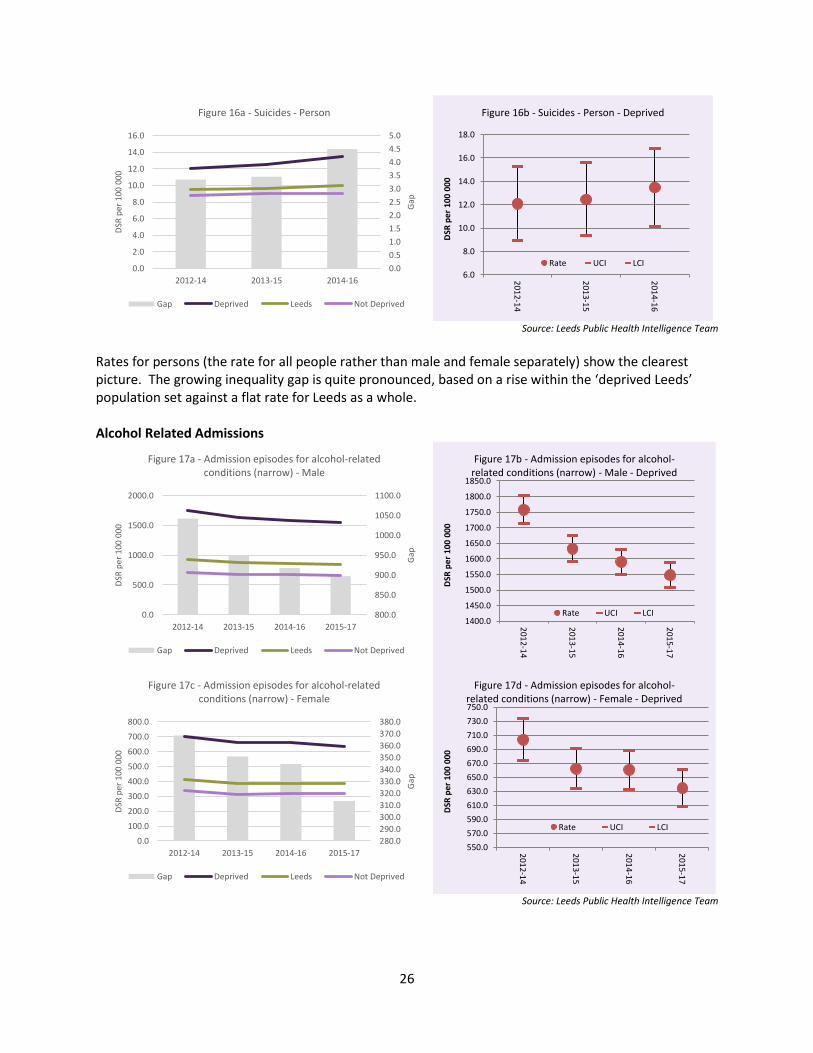
Rates for persons (the rate for all people rather than male and female separately) show the clearest picture. The growing inequality gap is quite pronounced, based on a rise within the ‘deprived Leeds’ population set against a flat rate for Leeds as a whole. Alcohol Related Admissions
Source: Leeds Public Health Intelligence Team
0.0
0.5
1.0
1.5
2.0
2.5
3.0
3.5
4.0
4.5
5.0
0.0
2.0
4.0
6.0
8.0
10.0
12.0
14.0
16.0
2012-14 2013-15 2014-16
Gap
DSR
per
10
0 0
00
Figure 16a - Suicides - Person
Gap Deprived Leeds Not Deprived
6.0
8.0
10.0
12.0
14.0
16.0
18.0
20
12
-14
20
13
-15
20
14
-16
DSR
per
10
0 0
00
Figure 16b - Suicides - Person - Deprived
Rate UCI LCI
800.0
850.0
900.0
950.0
1000.0
1050.0
1100.0
0.0
500.0
1000.0
1500.0
2000.0
2012-14 2013-15 2014-16 2015-17
Gap
DSR
per
100
000
Figure 17a - Admission episodes for alcohol-related conditions (narrow) - Male
Gap Deprived Leeds Not Deprived
1400.0
1450.0
1500.0
1550.0
1600.0
1650.0
1700.0
1750.0
1800.0
1850.0
201
2-14
201
3-15
201
4-16
201
5-17
DSR
pe
r 1
00
00
0
Figure 17b - Admission episodes for alcohol-related conditions (narrow) - Male - Deprived
Rate UCI LCI
280.0
290.0
300.0
310.0
320.0
330.0
340.0
350.0
360.0
370.0
380.0
0.0
100.0
200.0
300.0
400.0
500.0
600.0
700.0
800.0
2012-14 2013-15 2014-16 2015-17
Gap
DSR
per
10
0 00
0
Figure 17c - Admission episodes for alcohol-related conditions (narrow) - Female
Gap Deprived Leeds Not Deprived
550.0
570.0
590.0
610.0
630.0
650.0
670.0
690.0
710.0
730.0
750.0
201
2-14
201
3-15
201
4-16
201
5-17
DSR
pe
r 1
00 0
00
Figure 17d - Admission episodes for alcohol-related conditions (narrow) - Female - Deprived
Rate UCI LCI

27
Alcohol related admissions as represented by hospital admissions are falling, though rates for males are far higher than for females. Leeds is the best performing core city for this indicator and is currently on a similar trajectory and rate as England. Liver disease mortality
Source: Leeds Public Health Intelligence Team
Liver disease mortality for persons is following a similar inequalities pattern though rates are static; this is caused by a slight increase in the ‘less deprived’ Leeds rate year on year. Respiratory Disease Mortality
Source: Leeds Public Health Intelligence Team
Respiratory disease mortality is much higher in ‘deprived Leeds’ than the Leeds average, and is growing. This inequality gap is related to lifestyle factors such as smoking.
15.2
15.3
15.4
15.5
15.6
15.7
15.8
15.9
16.0
16.1
0.0
5.0
10.0
15.0
20.0
25.0
30.0
35.0
40.0
2012-14 2013-15 2014-16
Gap
DSR
per
10
0 0
00
Figure 18a - Under 75 mortality rate from liver disease -Person
Gap Deprived Leeds Not Deprived
25.0
27.0
29.0
31.0
33.0
35.0
37.0
39.0
41.0
201
2-14
201
3-15
201
4-16
DSR
per
10
0 0
00
Figure 18b - Under 75 mortality rate from liver disease - Person - Deprived
Rate UCI LCI
46.0
47.0
48.0
49.0
50.0
51.0
52.0
53.0
54.0
0.0
10.0
20.0
30.0
40.0
50.0
60.0
70.0
80.0
90.0
2012-14 2013-15 2014-16
Gap
DSR
per
100
000
Figure 19a - Under 75 mortality rate from respiratory disease - Person
Gap Deprived Leeds Not Deprived
0.0
10.0
20.0
30.0
40.0
50.0
60.0
70.0
80.0
90.0
100.0
20
12-1
4
20
13-1
5
20
14-1
6
DSR
per
100
000
Figure 19b - Under 75 mortality rate from respiratory disease - Person - Deprived
Rate UCI LCI

28
Communicable diseases mortality
Source: Leeds Public Health Intelligence Team
Communicable diseases mortality rates increased during 2014-16, although the inequality gap narrowed. Smoking Prevalence Smoking Prevalence (in adults) by calendar year – PHE Fingertips
Source: Leeds Public Health Intelligence Team
Leeds prevalence according to PHE, and using the ONS mid-year estimate population figures shows
Leeds to be very close to the regional rate, and not significantly higher than England. The trend is
generally downward for Leeds and England.
0.0
1.0
2.0
3.0
4.0
5.0
6.0
0.0
2.0
4.0
6.0
8.0
10.0
12.0
14.0
2012-14 2013-15 2014-16
Gap
DSR
per
10
0 0
00
Figure 20a - Mortality rate from a range of specified communicable diseases, including
influenza, - Person
Gap Deprived Leeds Not Deprived
0.0
2.0
4.0
6.0
8.0
10.0
12.0
14.0
16.0
18.0
20
12
-14
20
13
-15
20
14
-16
DSR
per
10
0 0
00
Figure 20b - Mortality rate from a range of specified communicable diseases, including
influenza, - Person - Deprived
Rate UCI LCI
0
5
10
15
20
25
30
2011 2012 2013 2014 2015 2016 2017
Pe
rce
nta
ge o
f A
du
lts
Fig 21: - Smoking Prevalence in adults - current smokers (APS)
Rate (%)
Lower CI
Upper CI
Yorkshire andthe Humber
England

29
Source: Leeds Public Health Intelligence Team
Local analysis of smoking in Leeds, based on the Leeds Public Health Intelligence audit of GP Practice
records shows a slightly higher rate of smoking for Leeds. The latest figure for April 2018 is 20.3% for
Leeds with a statistically significantly higher score of 32.4% for deprived Leeds.
Smoking Attributable Mortality
Mortality data from Primary Care Mortality Database (PCMD), NHS Digital/ ONS
Source: Leeds Public Health Intelligence Team
15.0%
17.0%
19.0%
21.0%
23.0%
25.0%
27.0%
29.0%
31.0%
33.0%
35.0%
Deprived Leeds Not Deprived Leeds Resident
Pe
rce
nta
ge o
f A
du
lts
Figure 22: Smoking Prevalence in Adults - GP Audit April 2018
Rate
UCI
LCI
0
10
20
30
40
50
60
70
80
100
110
120
130
140
150
160
170
180
190
20
06
-20
08
20
07
-20
09
20
08
-20
10
20
09
-20
11
20
10
-20
12
20
11
-20
13
20
12
-20
14
20
13
-20
15
20
14
-20
16
GA
P
DSR
PER
10
0 0
00
PER
SON
S
Figure 23: Smoking Attributable Mortality All Ages for Persons
Gap Leeds Deprived

30
As a consequence of lower smoking prevalence there has been a slow reduction in mortality from
smoking attributable deaths in Leeds.
Source: Leeds Public Health Intelligence Team
Notice however that the rate has not fallen as much for deprived Leeds and the gap has grown slightly
as a result.
0
50
100
150
200
250
20
06-20
08
20
07-20
09
20
08-20
10
20
09-20
11
20
10-20
12
20
11-20
13
20
12-20
14
20
13-20
15
20
14-20
16
DSR
Pe
r 1
00
00
0 P
ers
on
s
Fig 24: Smoking Attributable Mortality All Ages for Persons in Deprived Leeds
Rate(DSR)LowerCIUpperCI
31
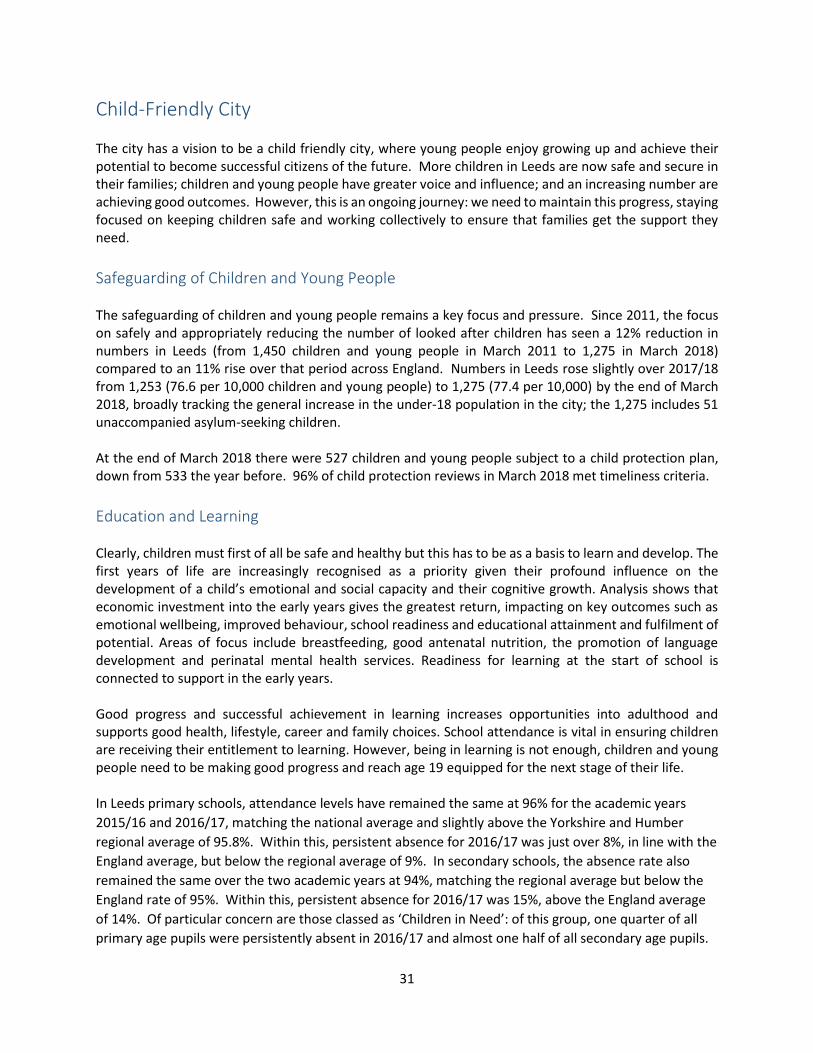
Child-Friendly City The city has a vision to be a child friendly city, where young people enjoy growing up and achieve their potential to become successful citizens of the future. More children in Leeds are now safe and secure in their families; children and young people have greater voice and influence; and an increasing number are achieving good outcomes. However, this is an ongoing journey: we need to maintain this progress, staying focused on keeping children safe and working collectively to ensure that families get the support they need.
Safeguarding of Children and Young People The safeguarding of children and young people remains a key focus and pressure. Since 2011, the focus on safely and appropriately reducing the number of looked after children has seen a 12% reduction in numbers in Leeds (from 1,450 children and young people in March 2011 to 1,275 in March 2018) compared to an 11% rise over that period across England. Numbers in Leeds rose slightly over 2017/18 from 1,253 (76.6 per 10,000 children and young people) to 1,275 (77.4 per 10,000) by the end of March 2018, broadly tracking the general increase in the under-18 population in the city; the 1,275 includes 51 unaccompanied asylum-seeking children. At the end of March 2018 there were 527 children and young people subject to a child protection plan, down from 533 the year before. 96% of child protection reviews in March 2018 met timeliness criteria.
Education and Learning Clearly, children must first of all be safe and healthy but this has to be as a basis to learn and develop. The first years of life are increasingly recognised as a priority given their profound influence on the development of a child’s emotional and social capacity and their cognitive growth. Analysis shows that economic investment into the early years gives the greatest return, impacting on key outcomes such as emotional wellbeing, improved behaviour, school readiness and educational attainment and fulfilment of potential. Areas of focus include breastfeeding, good antenatal nutrition, the promotion of language development and perinatal mental health services. Readiness for learning at the start of school is connected to support in the early years. Good progress and successful achievement in learning increases opportunities into adulthood and supports good health, lifestyle, career and family choices. School attendance is vital in ensuring children are receiving their entitlement to learning. However, being in learning is not enough, children and young people need to be making good progress and reach age 19 equipped for the next stage of their life. In Leeds primary schools, attendance levels have remained the same at 96% for the academic years
2015/16 and 2016/17, matching the national average and slightly above the Yorkshire and Humber
regional average of 95.8%. Within this, persistent absence for 2016/17 was just over 8%, in line with the
England average, but below the regional average of 9%. In secondary schools, the absence rate also
remained the same over the two academic years at 94%, matching the regional average but below the
England rate of 95%. Within this, persistent absence for 2016/17 was 15%, above the England average
of 14%. Of particular concern are those classed as ‘Children in Need’: of this group, one quarter of all
primary age pupils were persistently absent in 2016/17 and almost one half of all secondary age pupils.

32
Authorised absences in Leeds compare well at both primary and secondary levels (primary: 2.7% in
Leeds, below England’s 3.0% and the region’s 2.9%; secondary: 3.4% in Leeds, below England’s 3.8% and
the region’s 3.7%), reflecting our schools’ commitment to good attendance.
There has been a considerable increase in the proportion of children achieving a good level of development in Leeds at the Early Years Foundation Stage: from 51% in 2013 to 65% in 2017, though still below the national levels of 69% and 71% in 2016 and 2017 respectively. In 2013, Leeds was the poorest performing local authority on the ‘gap for lowest attaining children’ measure but the gap to national has reduced in every year since then, now standing at 1.6 percentage points. Figure 25: Early Years Foundation Stage Profile – children achieving a good level of development (2016-2017)
Source: Department for Education and Leeds City Council
The percentage of children reaching the expected standard at the end of primary school (Key Stage 2) in reading, writing and maths significantly improved in Leeds from 48% in the 2016 academic year to 56% in 2017, though remains below the national figures which went up from 53% in 2016 to 61% in 2017 and the Yorkshire and Humber regional 58% for 2017.
Figure 26: Key Stage 2 – pupils meeting expected standards (2016-2017)
Source: Department for Education and Leeds City Council
33
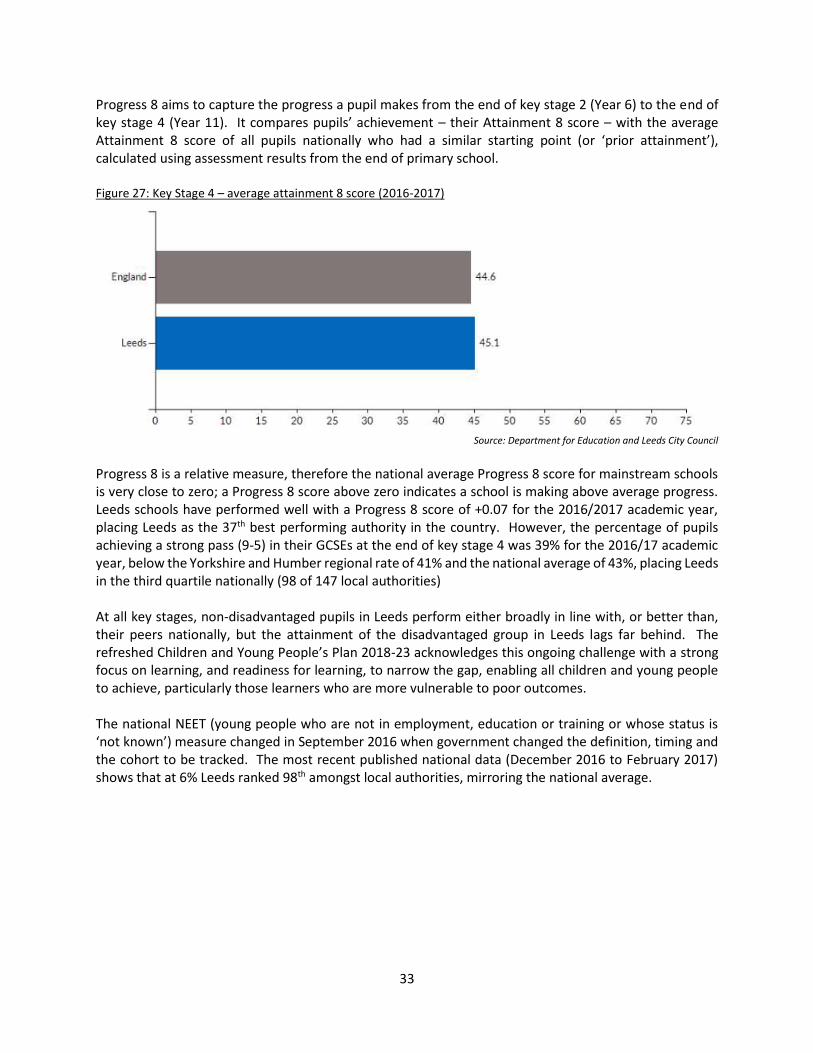
Progress 8 aims to capture the progress a pupil makes from the end of key stage 2 (Year 6) to the end of key stage 4 (Year 11). It compares pupils’ achievement – their Attainment 8 score – with the average Attainment 8 score of all pupils nationally who had a similar starting point (or ‘prior attainment’), calculated using assessment results from the end of primary school. Figure 27: Key Stage 4 – average attainment 8 score (2016-2017)
Source: Department for Education and Leeds City Council
Progress 8 is a relative measure, therefore the national average Progress 8 score for mainstream schools is very close to zero; a Progress 8 score above zero indicates a school is making above average progress. Leeds schools have performed well with a Progress 8 score of +0.07 for the 2016/2017 academic year, placing Leeds as the 37th best performing authority in the country. However, the percentage of pupils achieving a strong pass (9-5) in their GCSEs at the end of key stage 4 was 39% for the 2016/17 academic year, below the Yorkshire and Humber regional rate of 41% and the national average of 43%, placing Leeds in the third quartile nationally (98 of 147 local authorities) At all key stages, non-disadvantaged pupils in Leeds perform either broadly in line with, or better than, their peers nationally, but the attainment of the disadvantaged group in Leeds lags far behind. The refreshed Children and Young People’s Plan 2018-23 acknowledges this ongoing challenge with a strong focus on learning, and readiness for learning, to narrow the gap, enabling all children and young people to achieve, particularly those learners who are more vulnerable to poor outcomes. The national NEET (young people who are not in employment, education or training or whose status is ‘not known’) measure changed in September 2016 when government changed the definition, timing and the cohort to be tracked. The most recent published national data (December 2016 to February 2017) shows that at 6% Leeds ranked 98th amongst local authorities, mirroring the national average.

34
Safe, Strong and Vibrant Communities Leeds has an increasingly changing population, with people of different ages and from many different backgrounds, cultures and beliefs living and working alongside each other. In pursuing our ambition to build safer, stronger and more vibrant communities across the city we need strong local leadership, to increase community conversations to resolve problems and conflict locally, we need to continue to raise aspirations, creating better links to social and economic opportunities, and improve the city’s resilience to extremist narratives. Increasing opportunities for community engagement, working on strengths-based and asset-based community development will build more resilient communities across the city who are able to overcome their own challenges and reduce unnecessary dependence on public services. Socio-Economic Diversity Leeds’ diversity is reflected across all its communities and neighbourhoods, both in the physical identity of our neighbourhoods and in the variety of cultures and ethnic identities of our residents. However, it is the divergence in economic characteristics that is most prominent, and perhaps more so than most other core cities. Using the Index of Multiple Deprivation (IMD) 2015 to illustrate the divergent economic wellbeing of the city, highlights that although there are concentrations of relative deprivation, there are significant areas of the city which are relatively affluent. Figure 28 – Index of Multiple Deprivation 2015
Source: Index of Multiple Deprivation 2015

35
Analysis across a range of indicators suggests that there has been some intensification in the concentration of the most deprived and least deprived neighbourhoods across the city. Figure 29 provides a more detailed analysis in the relative changes in deprivation of neighbourhoods across deciles between the 2015 and 2010 IMD. Figure 29: LSOAs in each IMD decile in 2015 and 2010
Comparing the distributions in this way shows the extent of changes in relative rankings, and how large the changes are for those areas that have moved. The chart can be read down (for 2015) or across for 2010. For instance, in the 10% most deprived decile, 86 LSOAs have not changed and 2 have improved from 2010 and have moved into the second decile up. Conversely, 13 LSOAs have moved down from 10-20% into the worst 10%, and 1 LSOA has moved 2 deciles down. This analysis highlights the relative movement in rankings and also suggesting that there has been some intensification in the concentration of our most deprived and least deprived neighbourhoods. Poverty Poverty affects individuals, families and neighbourhoods in multiple ways, and it impacts people at different times in their lives. Child poverty is at the root of many poor outcomes for children, young people and their families. In 2016, it was estimated that over 17% of children (under 16s, 26,000 children) lived in poverty in Leeds, compared to 16% nationally. The proportion has remained fairly static in recent years, against a slight increase nationally. More broadly, taking the Government’s national estimates for ‘relative poverty after housing costs’ and applying them to Leeds, a national average of 22% equates to almost 172,000 people living in relative poverty in Leeds. In addition the Inclusive Growth analysis confirms growth of in-work poverty for some people in recent years, estimating that over 71,000 working age adults across the city are from working households and in poverty.
Most
Deprived
10%
10-20% 20-30% 30-40% 40-50% 50-60% 60-70% 70-80% 80-90%
Least
Deprived
10%
TOTAL
Most
Deprived
10%
86 2 88
10-20% 13 23 3 39
20-30% 1 10 25 8 44
30-40% 11 17 10 3 41
40-50% 4 12 7 4 27
50-60% 10 18 15 3 1 47
60-70% 10 23 14 2 49
70-80% 6 20 10 1 37
80-90% 3 24 14 41
Least
Deprived
10%
2 25 27
TOTAL 100 35 39 29 32 38 48 40 39 40 440
Number of LSOAs in each decile of the Index of Multiple Deprivation 2015 and the 2010 index
Number of
Lower Super
Output Areas
IMD 2015 Deciles
IMD
2010 d
ecil
es
Analysis is based on the 440 Lower Super Output Areas that have not undergone boundary changes since the 2010 Index
of Multiple Deprivation. The total number of LSOAs in each decile varies because of the differential impact of these
boundary changes

36
Data from the Leeds Food Aid Network suggests that almost 27,000 people accessed a foodbank during the 2016/17 period, an increase of almost 7% on the previous year. In terms of fuel poverty, the latest data from 2016 estimated that 13% of Leeds households were in fuel poverty (43,000 households), a slight reduction compared to the previous year. The city’s rate was slightly above the national average of 11%, primarily due to the nature of the housing stock. Safe Communities Making all our communities safe for everyone remains a central priority. In 2017, the Office of the Police and Crime Commissioner (OPCC) for West Yorkshire launched a new ‘Your Views’ survey. From data collected over the three quarters prior to March 2018, 82% of people in Leeds said that they felt ‘safe or very safe’ in their local area, slightly above the average for West Yorkshire. Across West Yorkshire, 75% of respondents said they were satisfied with their local area as a place to live (defined as a 15 minute walk from your home) with 11% dissatisfied. Leeds compares favourably with 79% being satisfied and 10% dissatisfied. To understand residents’ sense of positive community cohesion and wellbeing, the survey asked, ‘do people from different backgrounds get along well in your area?’ For West Yorkshire, just over half (54%) felt that they did get on well together. Leeds (58%) and Kirklees (59%) gave the strongest positive scores. The two tables below are drawn from data.police.uk and summarise the recent trends in reported crime in Leeds. Figure 30: Total crime rate (per 1000 population) over time in Leeds
Source: data.police.uk

37
Figure 31: Crime rates by type for Leeds (per 1000 population) Sep 2017 to Aug 2018
Source: data.police.uk
Over recent decades, there has been a fall in overall levels of crime, a trend that now looks to be levelling-off. However, this hides variations in different crime types. Over the last year, we have seen rises in some types of theft and in lower-volume but higher-harm types of violence. This is off-set by a fall in the high-volume offence of computer misuse. The volume of domestic violence and abuse incidents reported to police in Leeds rose by 9% between 2016/17 and 2017/18: 20,434 incidents were reported in the 12 months to March 2018 with a repeat victim rate of 46%. The level of self-reporting of domestic violence and abuse recorded by West Yorkshire Police fell slightly to 30% during 2017/18 compared to 32% in 2016/17. The relative stability in the rate of self-reporting is a perhaps a reflection of the confidence that victims have in West Yorkshire Police and the Safer Leeds Partnership. 18,709 ‘serious acquisitive crime’ (SAC) offences were recorded in Leeds in 2017/18 (equivalent to 25 offences per 1,000 population), an increase on the 18,334 offences (24 per 1,000 population) in 2016/17. Based on provisional figures - which do not represent the official data provided by the Home Office - the greatest increases in offences in 2017/18 were for burglary (up by 37%), and theft of a motor vehicle (up by 9%). (The Home Office uses a different measure of ‘serious acquisitive crime’ offences which excludes ‘burglaries’.) During 2017/18, the number of reported incidents of anti-social behaviour/nuisance concerns rose by 11% to 19,727, compared to 17,807 incidents reported during 2016/17. Of the total number of reported incidents, the two most frequently recorded categories were 'Youth Related' (38% – up from 36% the year before) and 'Neighbour Related' (17% – down from 19% in 2016/17). A hate crime is defined as a crime which is committed against someone due to their race, religion, gender, sexual orientation, age or disability. Almost 2,500 incidents were reported in the 12 months to March 2018, up by 11% on the year before but considerably lower than the rate of increase of 27% two years ago. During 2017/18, Police in Leeds recorded 1,892 Race hate incidents, 280 Sexuality hate incidents, 258 Disability hate incidents, 168 Faith hate incidents, and 51 Transphobic hate incidents. In March 2018, 257 hate incidents were reported compared to 199 in March 2017. This recent increase may be influenced by international and national events: for example, repeated malicious

38
communications targeting a specific faith group were reported in national media and widely condemned. A range of activities were carried out across Leeds to reassure communities. Overall, although ‘serious acquisitive crime’ increased slightly and the number of anti-social behaviour and nuisance concerns (particularly youth-related) reported increased too, this was against a fairly stable longer-term trend.

39
Housing The overarching challenge is to provide enough quality and accessible homes to meet the city’s growing population, whilst protecting the quality of the environment and respecting community identity. Within this overall context the need for affordable housing and affordable warmth are key issues. Good quality housing is a pre-requisite for good health. People who live in clean, warm, safe and affordable homes are less likely to experience a number of forms of ill-health. Leeds has 335,322 households listed for council tax. The mix of housing tenure has changed significantly over the last two decades. The significant growth of the private rented sector is a key trend which brings with it associated challenges, particularly at the low cost end of the market where housing conditions can be poor. The only reliable city-wide data is the 2011 Census, which confirms the private rented sector almost doubled between 2001 and 2010, to 18%. It is likely that this rate of change has continued if not accelerated. The private-rented sector across Leeds is complex. In Harehills and Chapeltown, there is a concentration of private-rented houses with a significant number of transient, often migrant, households. In contrast the private rental market in Headingley, Hyde Park and adjacent areas has traditionally been driven by demand from student households, resulting in considerably higher rents. In the City Centre, the rapid growth in the numbers of apartments developed since 2001 has created a new private rental market attracting yet another range of occupiers. Like most large cities, Leeds has a substantial amount of older housing, which tends to be concentrated in more deprived neighbourhoods. What sets Leeds apart from other places, though, is the large amount of back-to-back housing still in use across the city. Most of the 19,500 back-to-backs in Leeds are in the private-rented sector and were built before 1919. As a result, many of them are in poor condition, particularly in relation to their energy efficiency. The concentration of this type of housing, combined with the significant expansion of the private rented sector has a major impact on large areas of the inner city. This impact is illustrated by research commissioned under the More Jobs, Better Jobs collaboration between Leeds City Region and the Joseph Rowntree Foundation, undertaken by the University of Sheffield and Sheffield Hallam University. The research looked at the role residential mobility plays in determining neighbourhood structure. It identified neighbourhood typologies in deprived neighbourhoods (defined as the 20 per cent most deprived in the Index of Multiple Deprivation) into one of four types:
An escalator area is one where in-movers mainly come from areas that are more deprived while
most out-movers go to areas that are relatively less deprived. They can play an important role in
the upward progression through the housing market since movers often see them as a kind of
‘stopping off point’ on their way to affording a more expensive property.
gentrifier area is one where in-movers come from relatively less deprived areas and out-movers
go to similarly or more deprived areas. This may reflect a process of localised economic
opportunism as existing residents in ‘low value’ neighbourhoods are displaced by people moving
in from less deprived areas to take advantage of cheaper housing costs.

40
An isolate area is defined as an area where in-movers and out-movers come from and move to
similarly or more deprived areas. It is an ‘isolate’ area in the sense that it is relatively
disconnected from the wider housing market and residential mobility patterns, not in relation to
social cohesion. Therefore, its socio-economic composition is less likely to be altered by people
moving in or out. These areas have the highest average deprivation score out of all four types.
The final type is a transit area where both in-movers and out-movers are moving from and to
less deprived areas. This may reflect areas with high student populations or young households
getting onto the housing ladder for the first time.
Figure 31 below is taken from the research report. It highlights the change in composition of neighbourhood typologies between 2004 and 2015. The expansion of ‘isolate’ areas is striking, perhaps a reflection of the expansion of the private rented sector, which in-turn is heavily influenced by the nature of the housing stock. The implications of this change are keenly felt in some neighbourhoods. The research mapped these typologies across all of the UK. It is notable that some of our neighbouring authorities, most notably Wakefield have far more positive housing markets in their relatively deprived areas. The extent to which these localities provide affordable ‘starter housing’ for a wider geography should be considered. The full research can be found at https://www.jrf.org.uk/report/overcoming-deprivation-and-disconnection-uk-cities Figure 32:

41
The links between fuel poverty, poor housing and ill health are well established. Cold homes may exacerbate problems associated with cardiovascular illness and the onset of stroke or heart attacks, while damp and poorly ventilated homes are associated with a range of respiratory and allergic conditions such as bronchitis, pneumonia, and asthma. Cold homes may also impact on conditions such as rheumatism or arthritis and adversely affect people with poor mobility, increasing the risk of falls and other household accidents. Living in a cold, damp and poorly ventilated home is not only uncomfortable but may also be stressful and affect an individual’s mental health. This may be compounded by anxiety about high bills, fuel debt or other fuel poverty-related factors. The educational attainment of school age children may be adversely affected if they do not have a warm space to study and are forced to share general living space or need to take time off from school due to cold-related illness. The affordability of housing is of increasing importance, evidence suggests there is a continuing, and often growing gap between the income of families and individuals and the cost of housing, both in terms of access to mortgages and the cost of the rented sector.