Embed Size (px)
Citation preview

7-1
Distrubition System Plan
Present Situations of Distribution System
Present Operating Situations of Transmission / Distribution System in Jordan
Jordanian power system which is consisted by Transmission System (hereinafter refered to as T/L) and Distribution System (hereinafter refered to as D/L) is planned, designed, constructed, operated, and maintained by one T/L company (NEPCO) and three Distribution Companies (JEPCO (Jordanian Electric Power Co.), IDECO (Irbid District Electricity Co.), and EDCO (Electricity Distribution Co.)).
Each distribution company has responsibility for operating D/L in each region, and they have operation right of regional monopoly. In specific, Figure 7.1-1 shows the responsibility area of each distribution company.
JEPCO: Central region of Jordan (Amman, Zarqa, Salt, and so on) IDECO: North west region of Jordan (Irbid, Jarash, Mufraq, and so on) EDCO: Southern and Eastern region of Jordan (Aqaba, Ma’an, Tafila, Karak, Jordan Valley, Eastern
region)
Source: JICA Study Team
Figure 7.1-1 Responsible Area of Each Distribution Company
Overview of JEPCO
(1) Overview of JEPCO’s Operational Formation
JEPCO has a responsible for distributing electricity power which is supplied by NEPCO to end users, and they operate 33 kV, 11 kV, and 415 V electricity power facilities.
EDCO
JEPCO
IDECO
Legends:■:EDCO■:IDECO■:JEPCO
Jordan
7-2
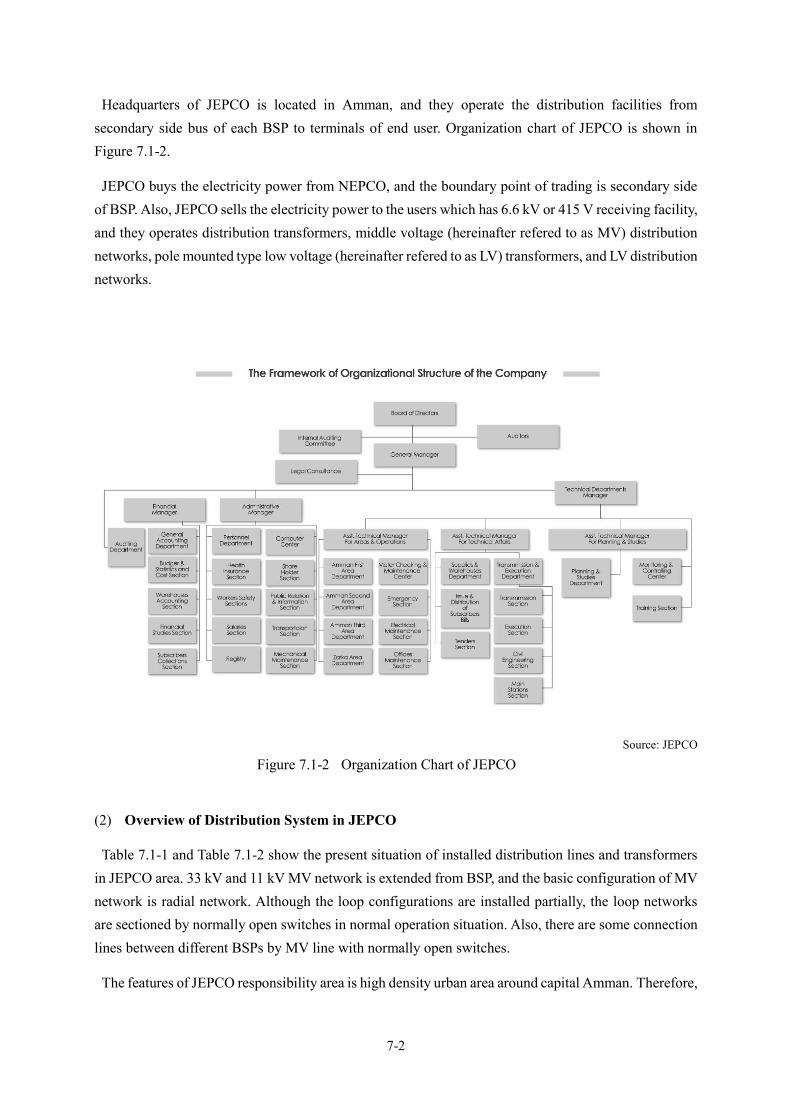
Headquarters of JEPCO is located in Amman, and they operate the distribution facilities from secondary side bus of each BSP to terminals of end user. Organization chart of JEPCO is shown in Figure 7.1-2.
JEPCO buys the electricity power from NEPCO, and the boundary point of trading is secondary side of BSP. Also, JEPCO sells the electricity power to the users which has 6.6 kV or 415 V receiving facility, and they operates distribution transformers, middle voltage (hereinafter refered to as MV) distribution networks, pole mounted type low voltage (hereinafter refered to as LV) transformers, and LV distribution networks.
Source: JEPCO
Figure 7.1-2 Organization Chart of JEPCO
(2) Overview of Distribution System in JEPCO
Table 7.1-1 and Table 7.1-2 show the present situation of installed distribution lines and transformers in JEPCO area. 33 kV and 11 kV MV network is extended from BSP, and the basic configuration of MV network is radial network. Although the loop configurations are installed partially, the loop networks are sectioned by normally open switches in normal operation situation. Also, there are some connection lines between different BSPs by MV line with normally open switches.
The features of JEPCO responsibility area is high density urban area around capital Amman. Therefore,

7-3
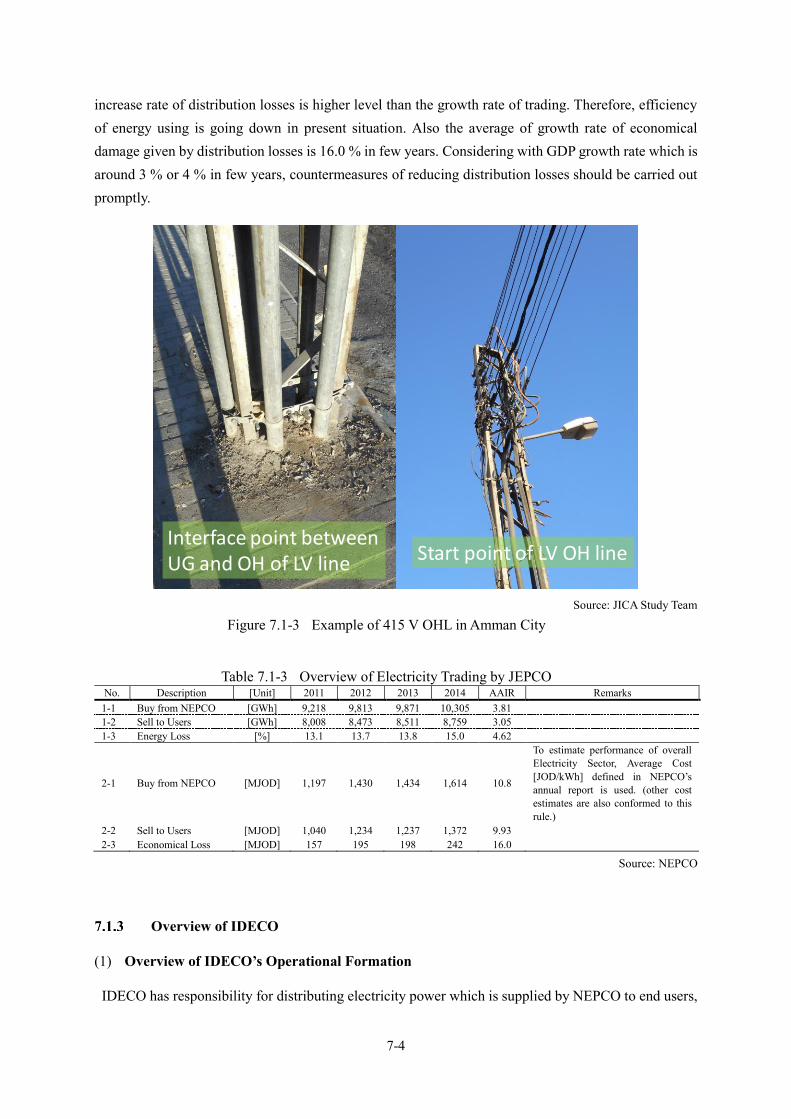
46% of 33 kV network and 74% of 11 kV network are installed on underground level. Mainly, 33 kV network is applied to high density user areas in Amman is rural areas, and 11 kV network is applied to other areas of Amman. On the other hand, 95% of LV networks are consisted by overhead lines which are extended from LV transformers installed on underground level, and LV lines are extended to end users. The present installation situation of LV lines in Amman city is shown in Figure 7.1-3. Although average distance of LV lines in Amman city is around 600 m, the average distance of LV lines in overall JEPCO area is over 1.0 km, also around 6.0 to 7.0 km LV lines are existing in JEPCO area as one of severe case.
JEPCO has SCADA for monitoring and controlling of their network. It is a unique feature of three distribution companies in Jordan.
Table 7.1-1 Present Situation of Installed D/Ls in JEPCO No. Description Quantity Unit Remarks
1 33 kV System 33kV Line 1) Overhead 1,953 km 2) Uuderground Cable 1,665 km Total 3,618 km 2. 11 kV System 11 kV Line 1) Overhead 1,015 km 2) Underground Cable 2,938 km Total 3,953 km 3 415 V System 415 V Line 1) Overhead 3,799 km 2) ABC Cable 3,662 km 3) Underground Cable 407 km Total 7,868 km Total 15,439 km
Source: CESI
Table 7.1-2 Present Situation of Installed Transformers in JEPCO No. Description Quantity Unit Remarks
1 33/11 kV Transformers 193 - 2 33/6.6 kV Transformers 3 - 3 33/0.415 kV Transformers 2,245 - 4 11/0.415 kV Transformers 7,160 - 5 33/0.240 kV Single Phase Transformers 9 - 6 11/0.240 kV Single Phase Transformers 7 - Total 9,617 -
Source: CESI
(3) Overview of Power Trading in JEPCO
Table 7.1-3 shows that actual results of electricity power trade which includes buying ([GWh], and [MJOD]), and selling ([GWh], and [MJOD]) and distribution losses ([GWh], and [MJOD]) in several years. Although the distribution losses are increasing along with growth of electricity power trading, the
7-4
increase rate of distribution losses is higher level than the growth rate of trading. Therefore, efficiency of energy using is going down in present situation. Also the average of growth rate of economical damage given by distribution losses is 16.0 % in few years. Considering with GDP growth rate which is around 3 % or 4 % in few years, countermeasures of reducing distribution losses should be carried out promptly.
Source: JICA Study Team
Figure 7.1-3 Example of 415 V OHL in Amman City
Table 7.1-3 Overview of Electricity Trading by JEPCO No. Description [Unit] 2011 2012 2013 2014 AAIR Remarks
1-1 Buy from NEPCO [GWh] 9,218 9,813 9,871 10,305 3.81 1-2 Sell to Users [GWh] 8,008 8,473 8,511 8,759 3.05 1-3 Energy Loss [%] 13.1 13.7 13.8 15.0 4.62
2-1 Buy from NEPCO [MJOD] 1,197 1,430 1,434 1,614 10.8
To estimate performance of overall Electricity Sector, Average Cost [JOD/kWh] defined in NEPCO’s annual report is used. (other cost estimates are also conformed to this rule.)
2-2 Sell to Users [MJOD] 1,040 1,234 1,237 1,372 9.93 2-3 Economical Loss [MJOD] 157 195 198 242 16.0
Source: NEPCO
Overview of IDECO
(1) Overview of IDECO’s Operational Formation
IDECO has responsibility for distributing electricity power which is supplied by NEPCO to end users,
Interface point betweenUG and OH of LV line Start point of LV OH line

7-5
and they operate 33 kV, 11 kV, and 415 V electricity power facilities.
The headquarters of IDECO is located in Irbid, and they operate the distribution facilities from secondary side bus of each BSP to terminals of end user.
IDECO buys the electricity power from NEPCO, and the boundary point of trading is secondary side of a BSP. Also, IDECO sells the electricity power to the users which has 6.6 kV or 415 V receiving facility, and they operates distribution transformers, MV distribution networks, pole mounted type LV transformers, and LV distribution networks.
(2) Overview of Distribution System in IDECO
Table 7.1-4 Present Situation of Installed D/Ls in IDECO No. Description Quantity Unit Remarks
1 33 kV System 33kV Line 1) Overhead 2,732 km 2) Uuderground Cable 238 km Total 2,970 km 2. 11 kV System 11 kV Line 1) Overhead Enough short km 2) Underground Cable Dominant km Total 330 km 3 415 V System 415 V Line 1) Overhead No Data km 2) ABC Cable No Data km 3) Underground Cable No Data km Total more than
4,000 km
Total more than 10,270
km
Source: CESI
Table 7.1-5 Present Situation of Installed Transformers in IDECO No. Description Quantity Unit Remarks
1 33/11 kV Transformers 31 - 2 33/0.415 kV Transformers 3,188 - 3 11/0.415 kV Transformers 396 - Total 3,615 -
Source: CESI
Table 7.1-4 and Table 7.1-5 show the present situation of installed distribution lines and transformers in IDECO area. 33 kV and 11 kV MV networks are extended from BSPs, and the basic configuration of MV network is radial network. Although the loop configurations are installed partially, the loop networks are sectioned by normally open switches in normal operation situation. Also, there are some connection lines between different BSPs by MV line with normally open switches.

7-6
11 kV feeders are mainly applied to high density urban area such as Irbid, and almost 11 kV cables are installed on underground level. Average distance of 11 kV feeders is 3.7 km, and the maximum distance is 14.0 km. On the other hand, in general, the length of 33 kV MV feeder is long because it is installed to supply electricity power to the rural area e.g. average length is 65.5 km and maximum length is 190 km.
IDECO doesn’t have own SCADA, and the upstream system in IDECO is monitored and controlled by NEPCO’s SCADA. However, system updating of NEPCO’s SCADA always doesn't follow the latest feeder installation situation in IDECO, so that the handled data in NEPCO’s SCADA has a little bit error from truth value.
(3) Overview of Power Trading in IDECO
Table 7.1-6 shows that actual results of electricity power trade which includes buying ([GWh], and [MJOD]), and selling ([GWh], and [MJOD]) and distribution losses ([GWh], and [MJOD]) in several years. Growth rate of electricity power trading is the highest out of all distribution companies in Jordan, and it means that developing speed of IDECO’s area is the highest out of all areas in Jordan. Although the distribution losses are also increasing, the level in IDECO is lower compared with average distribution losses in Jordan; 13.8 %. However the increase rate of economical losses given by distribution losses is 17.8 % and is the highest out of all distribution companies in Jordan, as well as it means that IDECO is facing the most serious situation. The considerable causes of this serious situation may be the rapidity of developing speed in this area, so that the future distribution system expanding plan should explicitly include the demand expansion by rapid developing speed.
Table 7.1-6 Overview of Electricity Trading by IDECO No. Description [Unit] 2011 2012 2013 2014 AAIR Remarks
1-1 Buy from NEPCO [GWh] 2,377 2,454 2,595 2,840 6.15 1-2 Sell to Users [GWh] 2,138 2,181 2,306 2,521 5.68 1-3 Energy Loss [%] 10.0 11.1 11.1 11.3 4.05 2-1 Buy from NEPCO [MJOD] 309 358 377 445 13.1 2-2 Sell to Users [MJOD] 278 318 335 395 12.6 2-3 Economical Loss [MJOD] 30.9 39.8 41.9 50.1 17.8
Source: NEPCO
Overview of EDCO
Although EDCO’s share rate of electricity distribution is around 20 %, the cover area of EDCO includes both high-density urban area such as Aqaba and low-density rural area. Therefore, EDCO’s area is preferable to study nation wide distribution system planning for Jordan, and JICA study team selected EDCO’s area.

7-7
(1) Overview of EDCO's Operational Formation
EDCO has a responsibility for distributing electricity power which is supplied by NEPCO to end users, and they operate 33 kV, 11 kV, and 415 V electricity power facilities.
Although the Headquarters of EDCO is located in Amman, the operation area is located in southern and eastern area of Jordan. And they operate the distribution facilities from secondary side bus of each BSP to terminals of end user. Organization chart of EDCO is shown in Figure 7.1-4.
Source: EDCO
Figure 7.1-4 Organization Chart of EDCO
EDCO buys the electricity power from NEPCO, and the boundary point of trading is secondary side of a BSP. Also, EDCO sells the electricity power to the users which has 6.6 kV or 415 V receiving facility, and they operate distribution transformers, MV distribution networks, pole mounted type LV transformers, and LV distribution networks.
Auditing Committee out of Board
Internal Auditing Department
Board of Directors
Director General
Manufacturing Department
Secretarial of Tendering
Legal Affairs Department
Executive Directorfor Aqaba Electricity
Distribution Area
Electricity Network Department
Maintenance and Operating Department
Financial and consumers services Department
Administrative services Department
Inspection and Claim Department
Executive Directorfor Ma’an Electricity
Distribution Area
Technical Department
Financial and consumers services Department
Wadi Musa Electricity Department
Inspection and Claim Department
Administrative services Department
Executive Director forAl-Karak ElectricityDistribution Area
Technical Department
Financial and consumers services Department
Inspection and Claim Department
Administrative services Department
Executive Directorfor Jordan Valley
Electricity
Distribution Area
Technical Department
Financial and consumers services Department
Inspection and Claim Department
Administrative services Department
Southern Shouneh Area Electricity Department
The Eastern Area Electricity Department
Tafila ElectricityDepartment
Assistant DirectorGeneral for
Technical Affairs
Project Department
Engineering Department
Assistant DirectorGeneral for
Regulating andPlanning Affairs
Regulating Department
Planning Department
Computer Department
Assistant DirectorGeneral for
Administrative
Affairs
Human ResourcesDepartment
InstitutionalServices
TransportationDepartment
Assistant DirectorGeneral for
Financial Affairs
FinancialDepartment
General AccountingDepartment
Commercial AffairsDepartment
Supplies andWarehousesDepartment

7-8
(2) Overview of Distribution System in EDCO
From Table 7.1-7 to Table 7.1-10 show the present situation of installed distribution lines and transformers in EDCO area. 33 kV and 11 kV MV networks are extended from BSP, and the basic configuration of MV network is radial network. Although the loop configurations are installed partially, the loop networks are sectioned by normally open switches in normal operation situation. Also, there are some connection lines between different BSPs by MV line with normally open switches.
EDCO area includes rural area positioned as majority part and urban area such as Aqaba positioned as minority part, and almost MV and LV networks are consisted by overhead lines except as high density urban area. Through Figure 7.1-5 to Figure 7.1-9 shows the bird’s eye viewing of MV system network for each EDCO’s area. According to figures through Figure 7.1-5 to Figure 7.1-9, the features of distribution network in EDCO’s area is existing very long MV lines to supply electricity power to each scattered load area because BSPs are not located near by each load area. Examples of extreme length MV lines are listed as following, and the areas which are supplied electricity power by them need to care for the MV system technical losses.
Tafila: Shedia (BSP) – Ezhaga Trans. (33 kV) aprx. 36.0 km Ma’an: Ma’an (BSP) – Alshheba 2 Trans. (33 kV) aprx. 63.2 km Eastern: Azraq (BSP) – Mahatat Al Tangiah Trans. (33 kV) aprx. 55.9 km Jordan Valley: Suweimeh (BSP) – Tlal Al Dahab Trans. (33 kV) aprx. 80.4 km Karak: Ghor Safi (BSP) – Abar Ber Mazkar Algarbe Trans. (33 kV) aprx. 85.3 km Also the rate of underground installation of LV network is almost less than 10% for each area except
as Aqaba urban area, so the non-technical losses such as illegal connection should also be cared deeply.
In Aqaba area, the rate for underground installation of distribution line is higher level, and the rate for 33 kV / 11 kV MV system is 42 % as well as for 415 V LV system is 51%.
EDCO doesn’t have own SCADA, and the upstream system in EDCO is monitored and controlled by NEPCO’s SCADA.
Table 7.1-7 Present Situation of Installed D/Ls in EDCO No. Description Quantity Growth
Rate [%] Remarks
2012 [km] 2013 [km] 1 33 kV System 33kV Line 1) Overhead 3,671 3,744 1.99 2) Uuderground Cable 585 598 2.22 Total 4,256 4,342 2.02 2. 11 kV System 11 kV Line 1) Overhead 531 539 1.51 2) Underground Cable 312 329 5.45 Total 843 868 2.97 3 415 V System 415 V Line 1) Overhead 5,568 5,763 3.50
7-9
No. Description Quantity Growth Rate [%]
Remarks 2012 [km] 2013 [km]
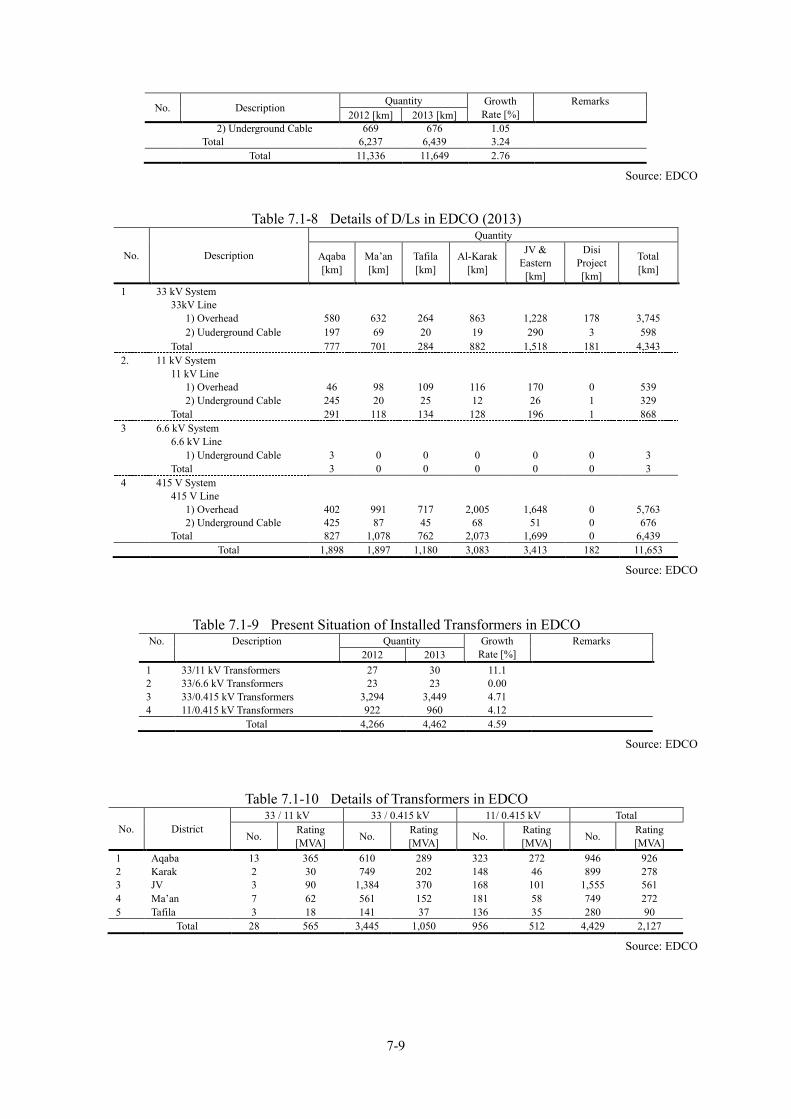
2) Underground Cable 669 676 1.05 Total 6,237 6,439 3.24 Total 11,336 11,649 2.76
Source: EDCO
Table 7.1-8 Details of D/Ls in EDCO (2013)
No. Description
Quantity
Aqaba [km]
Ma’an [km]
Tafila [km]
Al-Karak [km]
JV & Eastern
[km]
Disi Project [km]
Total [km]
1 33 kV System 33kV Line 1) Overhead 580 632 264 863 1,228 178 3,745 2) Uuderground Cable 197 69 20 19 290 3 598 Total 777 701 284 882 1,518 181 4,343 2. 11 kV System 11 kV Line 1) Overhead 46 98 109 116 170 0 539 2) Underground Cable 245 20 25 12 26 1 329 Total 291 118 134 128 196 1 868 3 6.6 kV System 6.6 kV Line 1) Underground Cable 3 0 0 0 0 0 3 Total 3 0 0 0 0 0 3 4 415 V System 415 V Line 1) Overhead 402 991 717 2,005 1,648 0 5,763 2) Underground Cable 425 87 45 68 51 0 676 Total 827 1,078 762 2,073 1,699 0 6,439 Total 1,898 1,897 1,180 3,083 3,413 182 11,653
Source: EDCO
Table 7.1-9 Present Situation of Installed Transformers in EDCO No. Description Quantity Growth
Rate [%] Remarks
2012 2013 1 33/11 kV Transformers 27 30 11.1 2 33/6.6 kV Transformers 23 23 0.00 3 33/0.415 kV Transformers 3,294 3,449 4.71 4 11/0.415 kV Transformers 922 960 4.12 Total 4,266 4,462 4.59
Source: EDCO
Table 7.1-10 Details of Transformers in EDCO
No. District 33 / 11 kV 33 / 0.415 kV 11/ 0.415 kV Total
No. Rating [MVA] No. Rating
[MVA] No. Rating [MVA] No. Rating
[MVA] 1 Aqaba 13 365 610 289 323 272 946 926 2 Karak 2 30 749 202 148 46 899 278 3 JV 3 90 1,384 370 168 101 1,555 561 4 Ma’an 7 62 561 152 181 58 749 272 5 Tafila 3 18 141 37 136 35 280 90 Total 28 565 3,445 1,050 956 512 4,429 2,127
Source: EDCO

7-10
Source: EDCO
Figure 7.1-5 Bird's Eye Viewing of 33 kV & 11 kV MV Network in Tafila
Source: EDCO
Figure 7.1-6 Bird's Eye Viewing of 33 kV & 11 kV MV Network in Ma'an
Shedia S/S
Al Hasa S/S
Ma’an S/S

7-11
Source: EDCO
Figure 7.1-7 Bird's Eye Viewing of 33 kV & 11 kV MV Network in Eastern
Source: EDCO
Figure 7.1-8 Bird's Eye Viewing of 33 kV & 11 kV MV Network in Jordan Valley
Azraq S/S
Safawi S/S
Rweshed S/S
Resha S/S
Waqas S/S
Suweimeh S/S
Subeihi S/S

7-12
Source: EDCO
Figure 7.1-9 Bird's Eye Viewing of 33 kV & 11 kV MV Network in Karak
(3) Overview of Power Trading in EDCO
Table 7.1-11 shows that actual results of electricity power trade which includes buying ([GWh], and [MJOD]), and selling ([GWh], and [MJOD]) and distribution losses ([GWh], and [MJOD]) in several years. Although the growth rate of distribution losses is increasing, the rate is the lowest out of all distribution companies in Jordan. Also the distribution losses rate is lower than the average of nationwide. However, the economical damage given by distribution losses is increasing around 15[%/year] because of growth of tariff rate and trading value. Therefore, EDCO also needs the countermeasures to reduce distribution losses promptly.
Table 7.1-11 Overview of Electricity Trading by EDCO No. Description [Unit] 2011 2012 2013 2014 AAIR Remarks
1-1 Buy from NEPCO [GWh] 2,667 2,846 2,979 3,160 5.82 1-2 Sell to Users [GWh] 2,363 2,492 2,612 2,777 5.54 1-3 Energy Loss [%] 11.4 12.4 12.3 12.1 2.16 2-1 Buy from NEPCO [MJOD] 346 415 433 495 12.8 2-2 Sell to Users [MJOD] 307 363 380 435 12.5 2-3 Economical Loss [MJOD] 39.5 51.6 53.4 60.0 15.5
Source: NEPCO
Karak S/S
Qatrana S/S
Ghor Safi S/S

7-13
Distribution System Planning
View Point of Distribution Planning in Jordan
Basically, Jordanian electric sector marks the outstanding indexes e.g. Access to electricity = 99.9%, and availability (power suplying ability and power supply reliability) = aprx. 99.9%, so that Jordanian electric sector has potential nearly equal to developed countries. These indexes are positioned as "Obligation" of electric sector, and JICA study team recognizes that the main issues in Jordanian electric sector are "Efficiency".
Table 7.2-1 is summary of Table 7.1-3, Table 7.1-6, and Table 7.1-11, as well as it shows the trends of distribution losses for each distribution company in few years. Table 7.2-1 shows the total economical damages given by distribution losses achieve to over 1% of GDP. It tells that the improvement countermeasures for reducing distribution losses are rally needed. Therefore, JICA study team mainly focuses on reduction of distribution losses as distribution system planning in this master plan project.
Table 7.2-1 Present Situation of Distribution Losses in nationwide of Jordan No. Description [Unit] 2011 2012 2013 2014 AAIR Remarks
1 JEPCO 1-1 Energy Loss [GWh] 1,209 1,341 1,360 1,545 8.65 1-2 Loss Rate [%] 13.1 13.7 13.8 15.0 4.62 1-3 Economical Loss [MJOD] 157 195 198 242 16.0 2 IDECO 2-1 Energy Loss [GWh] 238 273 289 320 10.4 2-2 Loss Rate [%] 10.0 11.1 11.1 11.3 4.05 2-3 Economical Loss [MJOD] 30.9 39.8 41.9 50.1 17.8 3 EDCO 3-1 Energy Loss [GWh] 304 354 367 383 8.14 3-2 Loss Rate [%] 11.4 12.4 12.3 12.1 2.16 3-3 Economical Loss [MJOD] 39.5 51.6 53.4 60.0 15.5 4 Total
4-1 Total Energy supplied by NEPCO [GWh] 14,261 15,113 15,445 16,305 4.58
4-2 Energy Loss [GWh] 1,752 1,968 2,016 2,248 8.77 4-3 Loss Rate [%] 12.3 13.0 13.1 13.8 3.96 4-4 Economical Loss [MJOD] 228 287 293 352 16.1
4-5 Economical Loss / GDP [%] 1.11 1.30 1.23 1.39 8.21
Source: NEPCO
Framework of Tariff System of Distribution Company and the Relationship with Distribution Losses
According to previous distribution losses studies5 , the tariff rate of distribution companies for users is set by Rate of Return (hereinafter refered to as RoR) mechanism under the approval of EMRC. In general,
5 Study the Energy Losses in Electricity Distribution Companies System in Jordan, CESI

7-14
RoR is defined as follows.
RoR =Revenue − Sales_Cost
Sales_Cost
Formula 7-1 Energy flows and cash flows of distribution company is summarized as Figure 7.2-1. Therefore,
revenue and sales cost are classified as follows.
Revenue Income of electricity sales: 𝐼tariff: Depend on the totally situation and approved by EMRC
Dependent Variable Sales Cost
Outgoing of electricity purchase: 𝑂NEPCO Outgoing of sellable electricity: 𝑂spl: Depend on the power demand Uncontrollable
parameter (Constant) Outgoing of distribution losses: 𝑂loss : Depend on the applied techniques of
countermeasures for distribution losses reduction Independent Variable Capital investment: 𝑂ivst : Depend on the applied techniques of countermeasures for
distribution losses reduction Independent Variable Salaries and Expenses: 𝑂exp: Uncontrollable parameter (Constant) Corporation Tax: 𝑂tax: Uncontrollable parameter (Constant)
Source: JICA Study Team
Figure 7.2-1 Overview of Energy and Cash Flow of Distribution Company
When all parameters defined as above are substituted in Formula 7-1, following formula is introduced. Also, it can be simplified as follows.
Dist. Co.Power buying
Invest. for Facility
To NEPCO
To Contractors
T/L Power From NEPCOD/L LossTo Air
D/L PowerTo User
O&M To Employee
GC To Employee
Tax for support ES To GovJ
Tax for other use To GovJ
Power sellingFrom User
red arrow: Energy flowgreen arrow: Cash flow
7-15
RoR =𝐼tariff − [(𝑂spl + 𝑂exp + 𝑂tax) + (𝑂loss + 𝑂ivst)]
(𝑂spl + 𝑂exp + 𝑂tax) + (𝑂loss + 𝑂ivst)=
𝐼tariff − 𝐶 − 𝑂(𝐿D)
𝐶 + 𝑂(𝐿D)
Formula 7-2 Where
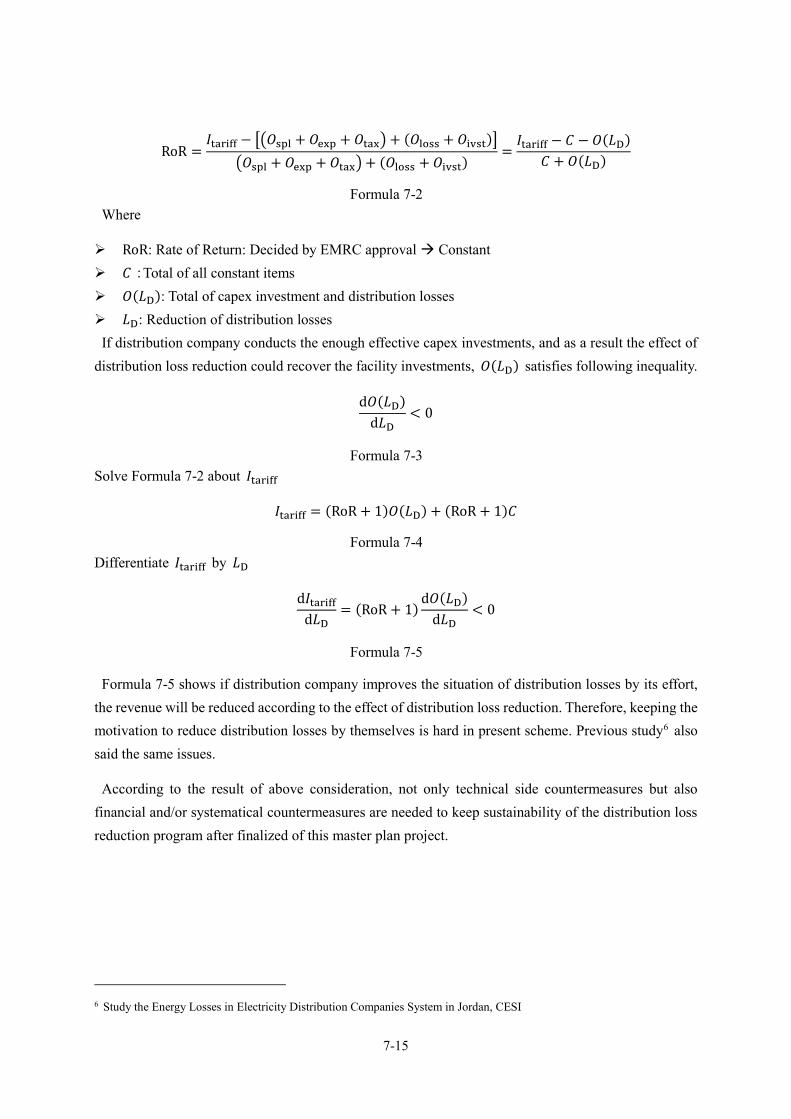
RoR: Rate of Return: Decided by EMRC approval Constant 𝐶:Total of all constant items 𝑂(𝐿D): Total of capex investment and distribution losses 𝐿D: Reduction of distribution losses If distribution company conducts the enough effective capex investments, and as a result the effect of
distribution loss reduction could recover the facility investments, 𝑂(𝐿D) satisfies following inequality.
d𝑂(𝐿D)
d𝐿D< 0
Formula 7-3 Solve Formula 7-2 about 𝐼tariff
𝐼tariff = (RoR + 1)𝑂(𝐿D) + (RoR + 1)𝐶
Formula 7-4 Differentiate 𝐼tariff by 𝐿D
d𝐼tariff
d𝐿D= (RoR + 1)
d𝑂(𝐿D)
d𝐿D< 0
Formula 7-5
Formula 7-5 shows if distribution company improves the situation of distribution losses by its effort, the revenue will be reduced according to the effect of distribution loss reduction. Therefore, keeping the motivation to reduce distribution losses by themselves is hard in present scheme. Previous study6 also said the same issues.
According to the result of above consideration, not only technical side countermeasures but also financial and/or systematical countermeasures are needed to keep sustainability of the distribution loss reduction program after finalized of this master plan project.
6 Study the Energy Losses in Electricity Distribution Companies System in Jordan, CESI

7-16
Present Situation of Distribution Losses in each Distribution Company
(1) Classification of Distribution Losses
In general, distribution losses are classified as following.
Technical Losses (hereinafter refered to as TL) Non-Technical Losses (hereinafter refered to as NTL)
TL is generated by flowing of the current on distribution lines and it is natural energy loss phenomena. In general, TL is increased by following causes.
High impedance of distribution line Small cross section of distribution line Long length of distribution line Low conductivity of distribution line material
Current on distribution lines is large: Voltage drop of distribution lines is high Power transmission ability of distribution lines is low compairing with load capacity
Rated voltage is low comparing with load capacity High impedance of distribution line
High impedance of distribution line Existing the heavy current on the distribution network because of no good network
configuration Low power factor
Normally, the distribution losses are increased by overlap of several causes simultaneously.
NTL is differential of total energy losses in distribution network and total TL of it. In Jordan, total energy losses are calculated by following formula.
(Purchased energy from NEPCO)-(Total of meter measuring result for all users)
Therefore, NTL is expressed as following formula.
(NTL) = (Purchased energy from NEPCO) : Incoming
- [ (Total of meter measuring result for all users) + (Total of TL) ] : Outgoing
In ideal situation, energy balance is always matching because generation energy and energy consumption is always same. Purchased energy from NEPCO is correct because it is always managed by NEPCO’s meter, and TL is also always correct because it is natural phenomena. Therefore, NTL is cumulative of meter measuring error. Assumable causes of meter measuring error are as follows.
Meter reading mistake Human error of meter reading staff Malfunction of meter

7-17
Failure of meter Tampering of meter
Meter is unreadable Not existing the meter
Illegal connection to the distribution network NTL is also including unpaid tariff except as meter measuring error.
(2) Present Situation of TL and NTL in Jordan7
Source: CESI
Figure 7.2-2 Contents of TL and NTL for each Distribution Company and Nationwide at FY2013
Figure 7.2-2 shows the contents of TL anc NTL in Jordan. There is no big difference situation between each distribution company and nationwide. According to Figure 7.2-2 , TL is around 75 % and NTL is around 25 % for each item. Although this figure said the necessity of countermeasures for TL because of it is a dominant factor, NTL has also a necessity of considering. NTL occupies 3.73 % of total losses in overall Electricity Sector at FY2013. Therefore, NTL also needs the countermeasures for reducing.
7 Study the Energy Losses in Electricity Distribution Companies System in Jordan, CESI
73%
27%
Loss Contents in Nationwide(Total Loss = 2,016[GWh])
Technical Loss
Non Technical Loss
72%
28%
Loss Contents in JEPCO(Total Loss = 1,360[GWh])
Technical Loss
Non Technical Loss
75%
25%
Loss Contents in IDECO(Total Loss = 289[GWh])
Technical Loss
Non Technical Loss
75%
25%
Loss Contents in EDCO(Total Loss = 367[GWh])
Technical Loss
Non Technical Loss

7-18
(3) Detail Analysis of TL in Jordan
According to 7.1, Jordanian distribution networks are configured by (1) 33 kV system, (2) 11 kV system, and (3) 415 V (LV) system. Although 6.6 kV systems were existing in Jordan, in present situation the area of this system is reducing gradually and it is minority. Therefore, this study does not pick up the 6.6 kV systems.
Source: CESI Figure 7.2-3 TL for each Voltage Class in Jordan at FY2013
Figure 7.2-3 shows the present situation of each voltage class TL for nationwide and each distribution company according to Figure 7.2-3, the dominant factor of TL is LV system losses for nationwide and all of distribution companies.
IDECO marks the lowest distribution losses rate in all of distribution companies according to Table 7.2-1. Also, the LV losses rate of IDECO is higest out of all distribution companies. Therefore, distribution losses in IDECO will be reduced to allowable level by carrying out the LV TL countermeasures selectively.
Although the LV TL is a dominant factor in JEPCO and EDCO, 11 kV losses in JEPCO and 33 kV losses in EDCO are also large factor. Therefore, MV system also has a potential to improve.
22%
20%58%
TL of each Voltage Classification in Jordan(Total TL = 1,291[GWh])
33 kV System
11 kV System
LV Lines
14%
27%59%
TL of each Voltage Classification in JEPCO(Total TL = 810[GWh])
33 kV System
11 kV System
LV Lines
28%
5%67%
TL of each Voltage Classification in IDECO(Total TL = 210[GWh])
33 kV System
11 kV System
LV Lines
38%
10%
52%
TL of each Voltage Classification in EDCO(Total TL = 271[GWh])
33 kV System
11 kV System
LV Lines
7-19
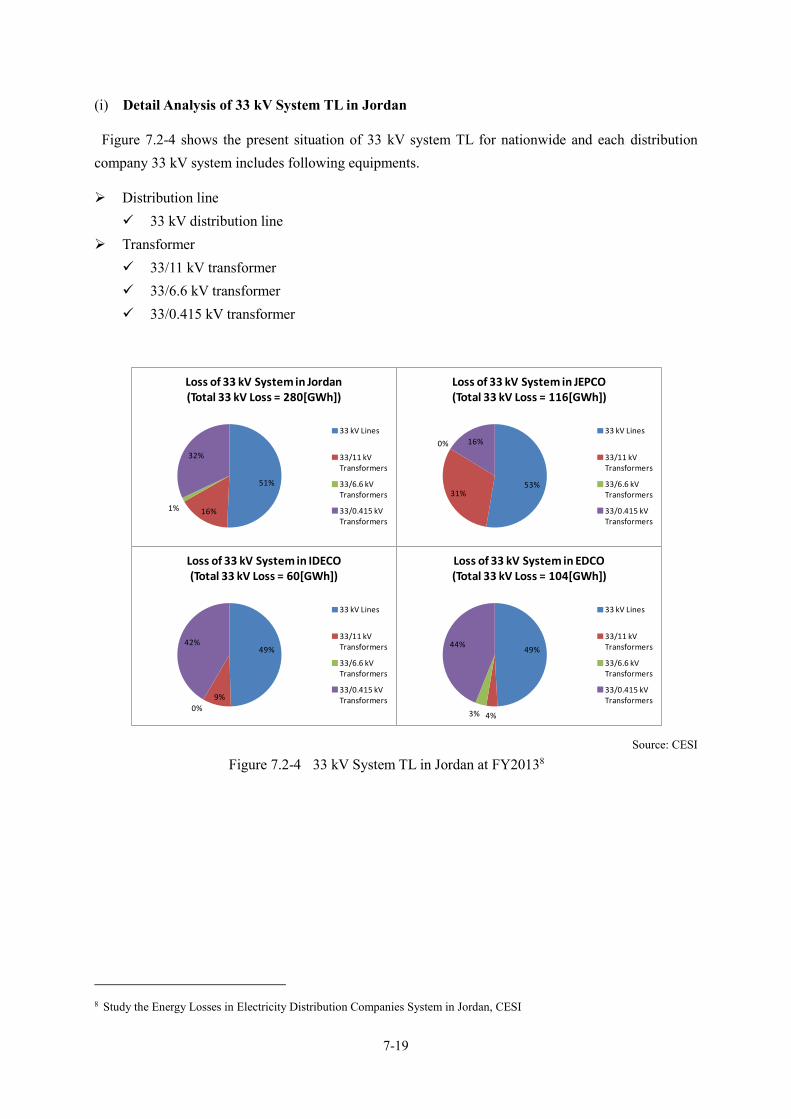
(i) Detail Analysis of 33 kV System TL in Jordan
Figure 7.2-4 shows the present situation of 33 kV system TL for nationwide and each distribution company 33 kV system includes following equipments.
Distribution line 33 kV distribution line
Transformer 33/11 kV transformer 33/6.6 kV transformer 33/0.415 kV transformer
Source: CESI
Figure 7.2-4 33 kV System TL in Jordan at FY20138
8 Study the Energy Losses in Electricity Distribution Companies System in Jordan, CESI
51%
16%1%
32%
Loss of 33 kV System in Jordan(Total 33 kV Loss = 280[GWh])
33 kV Lines
33/11 kV Transformers
33/6.6 kV Transformers
33/0.415 kV Transformers
53%31%
0% 16%
Loss of 33 kV System in JEPCO(Total 33 kV Loss = 116[GWh])
33 kV Lines
33/11 kV Transformers
33/6.6 kV Transformers
33/0.415 kV Transformers
49%
9%
0%
42%
Loss of 33 kV System in IDECO(Total 33 kV Loss = 60[GWh])
33 kV Lines
33/11 kV Transformers
33/6.6 kV Transformers
33/0.415 kV Transformers
49%
4%3%
44%
Loss of 33 kV System in EDCO(Total 33 kV Loss = 104[GWh])
33 kV Lines
33/11 kV Transformers
33/6.6 kV Transformers
33/0.415 kV Transformers

7-20
Source: JICA Study Team
Figure 7.2-5 Typical System Configuration of JEPCO’s Distribution Network
The rates of 33 kV TL for transformers and distribution lines are almost sharing half ratio at nationwide and each distriburtion company. Focusing on TL of 33 kV transformer, the dominant factor is step-down transformer for LV (33/0.415 kV transformer) in IDECO and EDCO, and the dominant factor is step-down transformer for MV (33/11 kV transformer) in only JEPCO. According to 7.1, the features of JEPCO’s network configuration is as Figure 7.2-5, and the features of IDECO/EDCO’s network configuration is as Figure 7.2-6. Although the ratio of equipment for 11 kV system in MV system at JEPCO achieves 50 %, the ratio of it at IDECO/EDCO is low ratio around 10 % to 15 %. Therefore, JEPCO has a unique feature of distribution losses compared with other distriburtion companies. According to Figure 7.2-3, 11 kV TL stands out in only JEPCO from the view point of absolute value of distribution losses. In either case, there is necessity of the countermeasures for both transformers and distribution lines because both facilities share almost same rate of TL.
132 kV
33 kV 33 kV
11 kV 11 kV
0.415 kV 0.415 kV 0.415 kV
BSP132/11 kV
Demarcation point
33/0.415 kV
α×2,245 sets
(0.5<α<1)
33/11 kV193 sets
11/0.415 kV
7,160 sets
33/0.415 kV
(1-α)×2,245 sets
(0.5<α<1)
End Users inAmman CentralHigh Density Area
End Users inRural AmmanMiddle Density Area
End Users inRural CitiesLow Density Area
Around Amman
7-21
Source: JICA Study Team
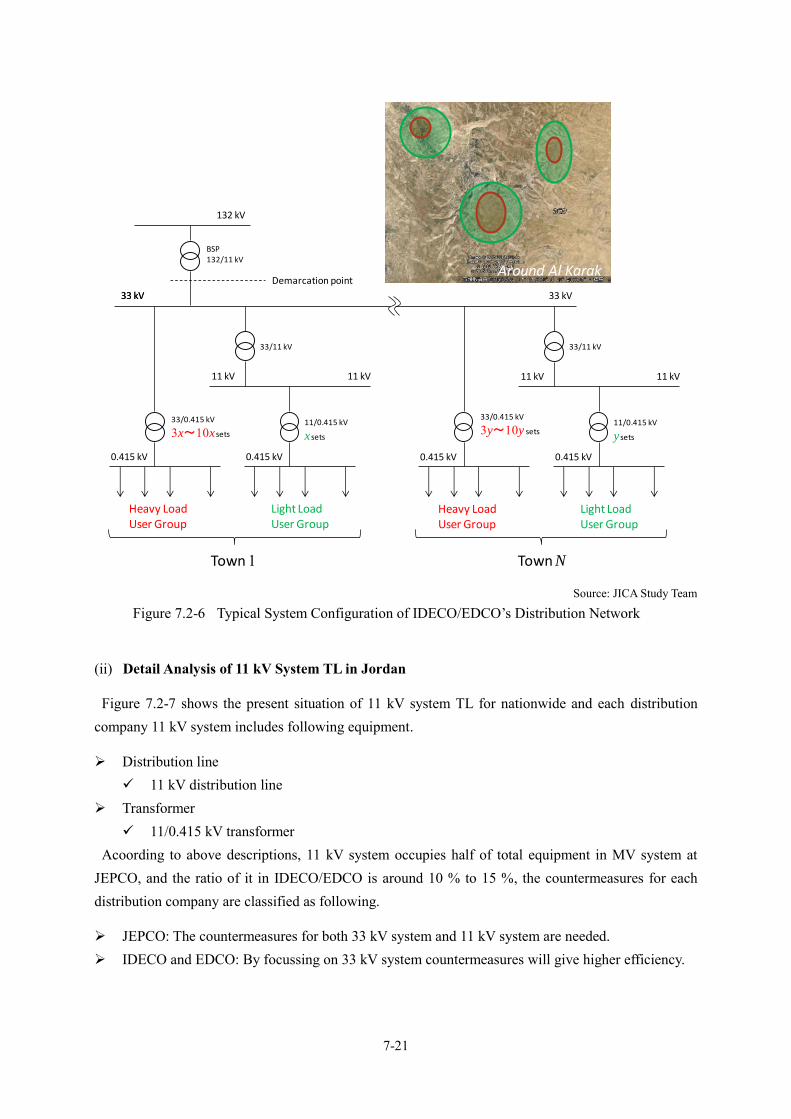
Figure 7.2-6 Typical System Configuration of IDECO/EDCO’s Distribution Network
(ii) Detail Analysis of 11 kV System TL in Jordan
Figure 7.2-7 shows the present situation of 11 kV system TL for nationwide and each distribution company 11 kV system includes following equipment.
Distribution line 11 kV distribution line
Transformer 11/0.415 kV transformer
Acoording to above descriptions, 11 kV system occupies half of total equipment in MV system at JEPCO, and the ratio of it in IDECO/EDCO is around 10 % to 15 %, the countermeasures for each distribution company are classified as following.
JEPCO: The countermeasures for both 33 kV system and 11 kV system are needed. IDECO and EDCO: By focussing on 33 kV system countermeasures will give higher efficiency.
BSP132/11 kV
132 kV
Demarcation point
33 kV
11 kV 11 kV
0.415 kV 0.415 kV
33/0.415 kV
3x~10x sets
33/11 kV
11/0.415 kV
x sets
Heavy LoadUser Group
Light LoadUser Group
11 kV 11 kV
0.415 kV 0.415 kV
33/0.415 kV
3y~10y sets
33/11 kV
11/0.415 kV
y sets
Heavy LoadUser Group
Light LoadUser Group
33 kV 33 kV
Town 1 Town N
Around Al Karak

7-22
Also, share rates of 11 kV system TL at JEPCO are divided to 60 % for distribution lines and 40 % for transformers, so that both equipments need the countermeasures.
Source: CESI
Figure 7.2-7 11 kV System TL in Jordan at FY20139
(iii) Conclusion of Detail TL Analysis
According to overall above discussions, JICA study team concluded the priority of TL reducing countermeasures as Table 7.2-2.
Table 7.2-2 Priority of TL Reducing Countermeasures MV System LV System
33 kV System 11 kV System 415 V System Lines Trans. Lines Trans Lines
JEPCO N N N N H IDECO N N L L VH EDCO N N L L H
VH: Very High Priority H: High Priority
N: Normal Priority L: Low Priority
Source: JICA Study Team
9 Study the Energy Losses in Electricity Distribution Companies System in Jordan, CESI
59%
41%
Loss of 11 kV System in Jordan(Total 11 kV Loss = 257[GWh])
11 kV Lines
11/0.415 kV Transformers 60%
40%
Loss of 11 kV System in JEPCO(Total 11 kV Loss = 221[GWh])
11 kV Lines
11/0.415 kV Transformers
32%
68%
Loss of 11 kV System in IDECO(Total 11 kV Loss = 10[GWh])
11 kV Lines
11/0.415 kV Transformers 59%
41%
Loss of 11 kV System in EDCO(Total 11 kV Loss = 26[GWh])
11 kV Lines
11/0.415 kV Transformers

7-23
Countermeasures for LV TL
(1) Detail Analysis and Policies of Countermeasures for LV TL
According to Table 7.2-2, LV TL reducing is positioned as urgent issue in all of distribution companies.
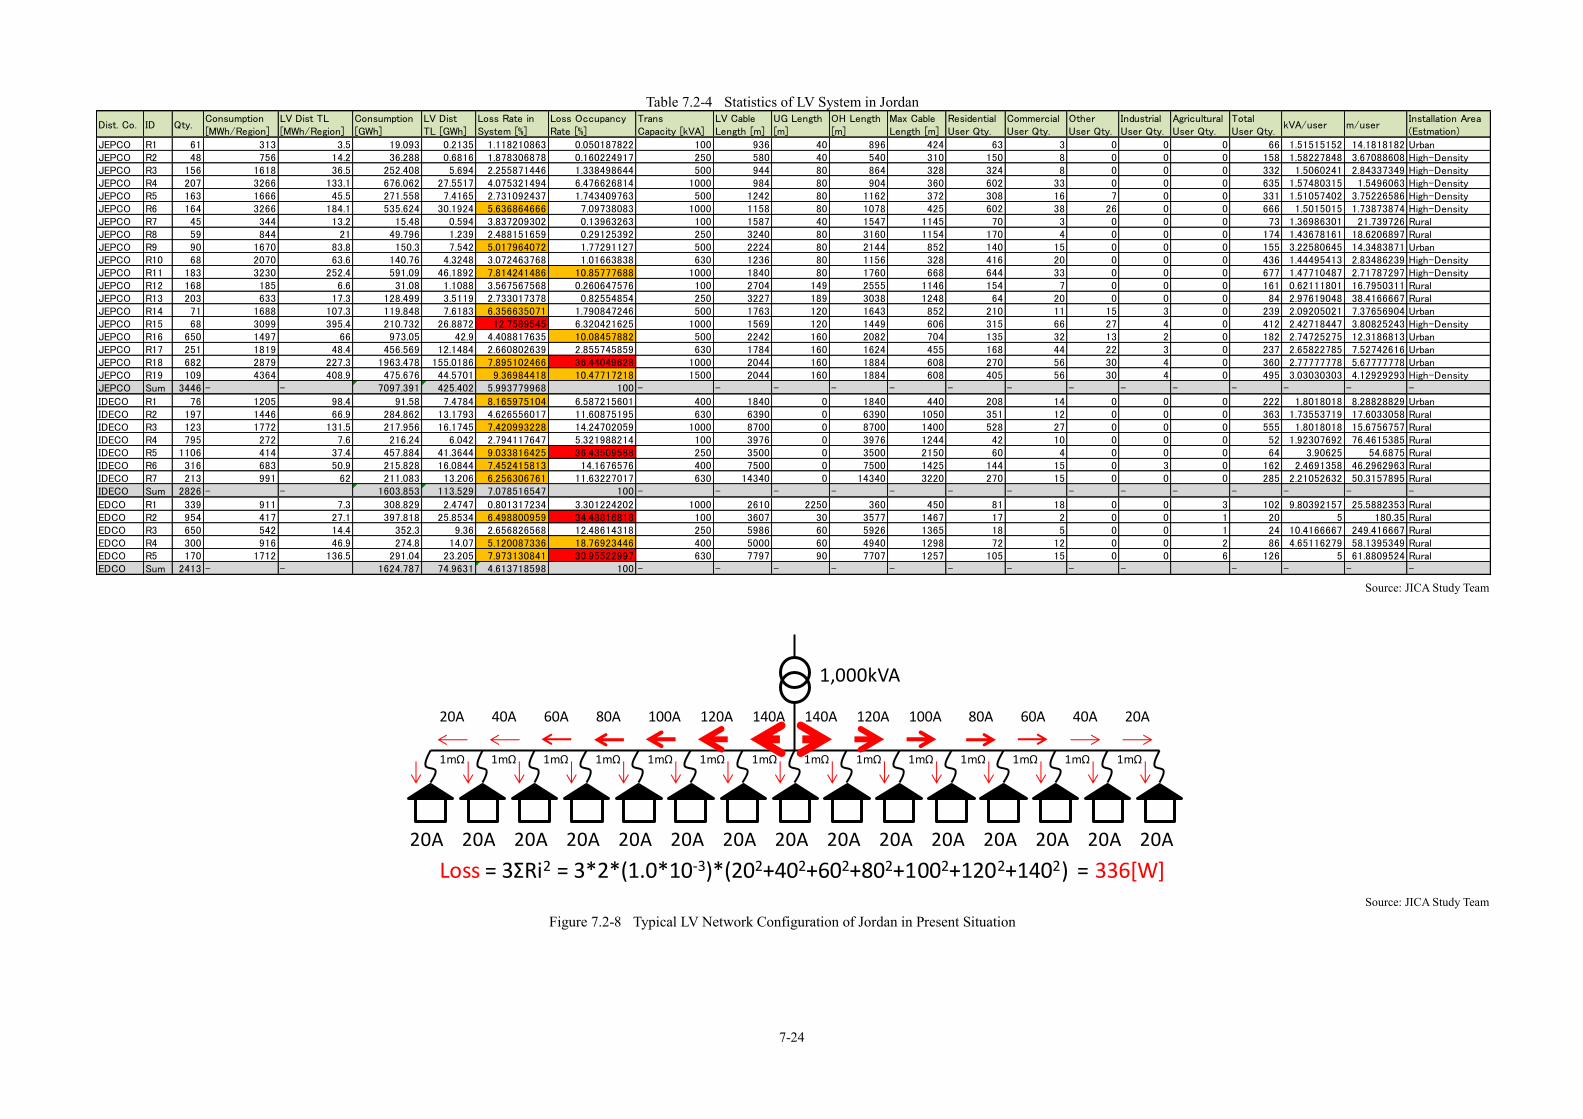
Table 7.2-4 shows the overview statistics of LV system in Jordan. Also, Table 7.2-3 shows the summarized table of Table 7.2-4 which indicates the user number classified by transformer capacity for each distribution company according to Table 7.2-3, Jordanian LV system has following features.
Capacity per unit is large (In Japan, capacity of almost transformers is around 100 kVA except as high-voltage receiving facilities.)
Connected user number per unit is large
Table 7.2-3 Connected User Number per Unit for each Distribution Company
Source: JICA Study Team
Figure 7.2-8 shows an extreme case of these features. According to this figure, the current is concentrated near by the transformer. And the TL of distribution line is proportion to line impedance and squared of flowing current. Therefore, especially, the losses are concentrated near by the transformer. According to above discussions, LV TL will be reduced by carried out the restructuring of the LV network which accords to the following policies.
Remove the heavy current from the system Specified measure 1: Distribute the overlapped current to light current portion
Reduce the LV line impedance Specific measure 2: Shorten the LV lines
JICA study team proposes the “Multi-Transformer System” (hereinafter refered to as MTrS) to realize listed specific measures in above.
CompanyTrans Capacity[kVA]
Qty. User Qty. User/Trans
100 274 34359 1.25E+02
250 310 34902 1.13E+02500 1130 254964 2.26E+02630 319 89135 2.79E+02
1000 1304 638096 4.89E+021500 109 53955 4.95E+02
100 795 41340 5.20E+01250 1106 70784 6.40E+01400 392 68064 1.74E+02630 410 132216 3.22E+02
1000 123 68265 5.55E+02
100 954 19080 2.00E+01250 650 15600 2.40E+01400 300 25800 8.60E+01630 170 21420 1.26E+02
1000 339 34578 1.02E+02
JEPCO
IDECO
EDCO

7-24
Table 7.2-4 Statistics of LV System in Jordan
Source: JICA Study Team
Source: JICA Study Team
Figure 7.2-8 Typical LV Network Configuration of Jordan in Present Situation
Dist. Co. ID Qty.Consumption[MWh/Region]
LV Dist TL[MWh/Region]
Consumption[GWh]
LV DistTL [GWh]
Loss Rate inSystem [%]
Loss OccupancyRate [%]
TransCapacity [kVA]
LV CableLength [m]
UG Length[m]
OH Length[m]
Max CableLength [m]
ResidentialUser Qty.
CommercialUser Qty.
OtherUser Qty.
IndustrialUser Qty.
AgriculturalUser Qty.
TotalUser Qty.
kVA/user m/userInstallation Area(Estmation)
JEPCO R1 61 313 3.5 19.093 0.2135 1.118210863 0.050187822 100 936 40 896 424 63 3 0 0 0 66 1.51515152 14.1818182 UrbanJEPCO R2 48 756 14.2 36.288 0.6816 1.878306878 0.160224917 250 580 40 540 310 150 8 0 0 0 158 1.58227848 3.67088608 High-DensityJEPCO R3 156 1618 36.5 252.408 5.694 2.255871446 1.338498644 500 944 80 864 328 324 8 0 0 0 332 1.5060241 2.84337349 High-DensityJEPCO R4 207 3266 133.1 676.062 27.5517 4.075321494 6.476626814 1000 984 80 904 360 602 33 0 0 0 635 1.57480315 1.5496063 High-DensityJEPCO R5 163 1666 45.5 271.558 7.4165 2.731092437 1.743409763 500 1242 80 1162 372 308 16 7 0 0 331 1.51057402 3.75226586 High-DensityJEPCO R6 164 3266 184.1 535.624 30.1924 5.636864666 7.09738083 1000 1158 80 1078 425 602 38 26 0 0 666 1.5015015 1.73873874 High-DensityJEPCO R7 45 344 13.2 15.48 0.594 3.837209302 0.13963263 100 1587 40 1547 1145 70 3 0 0 0 73 1.36986301 21.739726 RuralJEPCO R8 59 844 21 49.796 1.239 2.488151659 0.29125392 250 3240 80 3160 1154 170 4 0 0 0 174 1.43678161 18.6206897 RuralJEPCO R9 90 1670 83.8 150.3 7.542 5.017964072 1.77291127 500 2224 80 2144 852 140 15 0 0 0 155 3.22580645 14.3483871 UrbanJEPCO R10 68 2070 63.6 140.76 4.3248 3.072463768 1.01663838 630 1236 80 1156 328 416 20 0 0 0 436 1.44495413 2.83486239 High-DensityJEPCO R11 183 3230 252.4 591.09 46.1892 7.814241486 10.85777688 1000 1840 80 1760 668 644 33 0 0 0 677 1.47710487 2.71787297 High-DensityJEPCO R12 168 185 6.6 31.08 1.1088 3.567567568 0.260647576 100 2704 149 2555 1146 154 7 0 0 0 161 0.62111801 16.7950311 RuralJEPCO R13 203 633 17.3 128.499 3.5119 2.733017378 0.82554854 250 3227 189 3038 1248 64 20 0 0 0 84 2.97619048 38.4166667 RuralJEPCO R14 71 1688 107.3 119.848 7.6183 6.356635071 1.790847246 500 1763 120 1643 852 210 11 15 3 0 239 2.09205021 7.37656904 UrbanJEPCO R15 68 3099 395.4 210.732 26.8872 12.7589545 6.320421625 1000 1569 120 1449 606 315 66 27 4 0 412 2.42718447 3.80825243 High-DensityJEPCO R16 650 1497 66 973.05 42.9 4.408817635 10.08457882 500 2242 160 2082 704 135 32 13 2 0 182 2.74725275 12.3186813 UrbanJEPCO R17 251 1819 48.4 456.569 12.1484 2.660802639 2.855745859 630 1784 160 1624 455 168 44 22 3 0 237 2.65822785 7.52742616 UrbanJEPCO R18 682 2879 227.3 1963.478 155.0186 7.895102466 36.44049628 1000 2044 160 1884 608 270 56 30 4 0 360 2.77777778 5.67777778 UrbanJEPCO R19 109 4364 408.9 475.676 44.5701 9.36984418 10.47717218 1500 2044 160 1884 608 405 56 30 4 0 495 3.03030303 4.12929293 High-DensityJEPCO Sum 3446 - - 7097.391 425.402 5.993779968 100 - - - - - - - - - - - - - -
IDECO R1 76 1205 98.4 91.58 7.4784 8.165975104 6.587215601 400 1840 0 1840 440 208 14 0 0 0 222 1.8018018 8.28828829 UrbanIDECO R2 197 1446 66.9 284.862 13.1793 4.626556017 11.60875195 630 6390 0 6390 1050 351 12 0 0 0 363 1.73553719 17.6033058 RuralIDECO R3 123 1772 131.5 217.956 16.1745 7.420993228 14.24702059 1000 8700 0 8700 1400 528 27 0 0 0 555 1.8018018 15.6756757 RuralIDECO R4 795 272 7.6 216.24 6.042 2.794117647 5.321988214 100 3976 0 3976 1244 42 10 0 0 0 52 1.92307692 76.4615385 RuralIDECO R5 1106 414 37.4 457.884 41.3644 9.033816425 36.43509588 250 3500 0 3500 2150 60 4 0 0 0 64 3.90625 54.6875 RuralIDECO R6 316 683 50.9 215.828 16.0844 7.452415813 14.1676576 400 7500 0 7500 1425 144 15 0 3 0 162 2.4691358 46.2962963 RuralIDECO R7 213 991 62 211.083 13.206 6.256306761 11.63227017 630 14340 0 14340 3220 270 15 0 0 0 285 2.21052632 50.3157895 RuralIDECO Sum 2826 - - 1603.853 113.529 7.078516547 100 - - - - - - - - - - - - - -
EDCO R1 339 911 7.3 308.829 2.4747 0.801317234 3.301224202 1000 2610 2250 360 450 81 18 0 0 3 102 9.80392157 25.5882353 RuralEDCO R2 954 417 27.1 397.818 25.8534 6.498800959 34.48816818 100 3607 30 3577 1467 17 2 0 0 1 20 5 180.35 RuralEDCO R3 650 542 14.4 352.3 9.36 2.656826568 12.48614318 250 5986 60 5926 1365 18 5 0 0 1 24 10.4166667 249.416667 RuralEDCO R4 300 916 46.9 274.8 14.07 5.120087336 18.76923446 400 5000 60 4940 1298 72 12 0 0 2 86 4.65116279 58.1395349 RuralEDCO R5 170 1712 136.5 291.04 23.205 7.973130841 30.95522997 630 7797 90 7707 1257 105 15 0 0 6 126 5 61.8809524 RuralEDCO Sum 2413 - - 1624.787 74.9631 4.613718598 100 - - - - - - - - - - - - -
20A 20A 20A 20A 20A 20A 20A 20A 20A 20A 20A 20A 20A 20A 20A
20A 40A 60A 80A 100A 120A 140A 140A 120A 100A 80A 60A 40A 20A
1,000kVA
1mΩ 1mΩ 1mΩ 1mΩ 1mΩ 1mΩ 1mΩ 1mΩ 1mΩ 1mΩ 1mΩ 1mΩ 1mΩ 1mΩ
Loss = 3ΣRi2 = 3*2*(1.0*10-3)*(202+402+602+802+1002+1202+1402) = 336[W]


7-25
(2) Overview of MTrS
Source: JICA Study Team
Figure 7.2-9 Overview Sketch of MTrS Configuration
Figure 7.2-9 shows the present situation of LV system of Jordan in upper side, and after introducing MTrS policies to LV system in lower side. As per Figure 7.2-9, the policies of MTrS are as follows.
Separate the wide area covered by single large capacity transformer to several small network areas. Install the small capacity transformers to each separated network. Expected effects of introducing above ideas are as following, therefore the LV networks will be
according to the discussed policies as above.
Distrubuted the concentrated current near from transformer to each separated network Matching with specified measure 1
Shorten the LV lines in each network Matching with specified measure 2 In the case of Figure 7.2-9, LV TL is reduced to 1/30 by introducing MTrS.
This system configuration is generally introduced in Japan which marks very low level of TL compared with all of other countries in the world. Therefore, this system configuration has enough installation records, and the feasibility and effectiveness are enough expected.
20A 20A 20A 20A 20A 20A 20A 20A 20A 20A 20A 20A 20A 20A 20A
20A 40A 60A 80A 100A 120A 140A 140A 120A 100A 80A 60A 40A 20A
1,000kVA
1mΩ 1mΩ 1mΩ 1mΩ 1mΩ 1mΩ 1mΩ 1mΩ 1mΩ 1mΩ 1mΩ 1mΩ 1mΩ 1mΩ
before introducing MTrS...
Loss = 3ΣRi2 = 3*2*(1.0*10-3)*(202+402+602+802+1002+1202+1402) = 336[W]
20A 20A 20A 20A 20A 20A 20A 20A 20A 20A 20A 20A 20A 20A 20A
200kVA 200kVA 200kVA 200kVA 200kVA
20A 20A 20A 20A 20A 20A 20A 20A 20A 20A
1mΩ 1mΩ 1mΩ 1mΩ 1mΩ 1mΩ 1mΩ 1mΩ 1mΩ 1mΩ
after introducing MTrS...
Loss = 3ΣRi2 = 3*5*2*(1.0*10-3)*202 = 12[W]

7-26
(3) Introducing MTrS in Jordan
Jordanian LV TL: Table 7.2-4 is able to be classified by user density like as Figure 7.2-10. Figure 7.2-10 shows the present situation of user density distribution for nationwide and each distribution company.
Source: JICA Study Team
Figure 7.2-10 Distribution of TL in Jordan Classified by User Density
According to Figure 7.2-10, each distribution company needs different prioritized countermeasures because the user density distribution is different each other. But, in either case, all user density classes need countermeasures equally from the view point of nationwide. However, it will be difficult to introduce the same system configuration to all networks in Jordan because the original system configuration and/or peripheral environment are different between urban area and rural area.
31%
38%
31%
Nationwide(Total LV Loss = 614[GWh])
45%
53%
2%
JEPCO(Total LV Loss = 425[GWh])
0% 7%
93%
IDECO(Total LV Loss = 114[GWh])
0%0%
100%
EDCO(Total LV Loss = 75[GWh])
■High-Density (L≦5[m/user])■Urban (5[m/user]<L≦15[m/user])■Rural (L>15[m/user])

7-27
(i) Introducing MTrS in Rural Area
Source: JICA Study Team
Figure 7.2-11 MV/LV Transformer Installed in Rural Area (@ Jordan Valley Area Managed by EDCO)
Figure 7.2-11 shows the MV/LV transformer installed in rural area of Jordan. The features of this transformer are as following.
Table 7.2-5 Features of MV/LV Transformer Installed in Rural Area No. Type Feature 1 Package Type Transformer ・Over 1.0MVA large capacity available
・Needs wide installation area ・Needs to installed on ground because of heavy
weight 2 Ground Mounted Transformer ・Middle to large capacity available
・Although the body size is not too large, it needs wide installation area and surrounding fence to ensure enough clearance for security reason
・Needs to installed on ground level because it normally includes switch panel
3 Pole Mounted Transformer ・For small capacity ・Although the weight is light, two poles are needed to
support it Source: JICA Study Team
Type-A: Package TrArea: 2,000×4,000Capacity: 1,500kVA
Type-B: Ground Mounted TrArea: 4,000×4,000Capacity: 630kVA
Type-C: Pole Mounted TrTwo poles are needed to mountCapacity: 50kVA
Type-A: Package TransformerIt requires much land area, so it is difficult to install enough # in city. But rural area maybe available.
Type-B: Ground Mounted TransformerIt also requires much land area.
Type-C: Pole Mounted TransformerIt requires two poles to mount, so it maybe difficult to install enough # in city. But rural area maybe available.

7-28
According to the policies of MTrS introduction, the areas which are covered by No.1 and/or No.2 transformer(s) defined in Table 7.2-5 are positioned as the target areas for introducing MTrS. Therefore, No.1 and No.2 transformers will be replaced by many of No.3 transformers.
The No.3 pole mounted transformer is supported by two poles, and this supporting measure is different from Japanese case. Although this transformer needs wider installation area than Japanese case, space occupation problem will be able to be ignored to adopt the existing pole mounted type transformer for introducing MTrS because the average clearance between each user defined in Figure 7.2-10 is over 15m in rural area.
(ii) Issues of MTrS Introduction for Urban Area
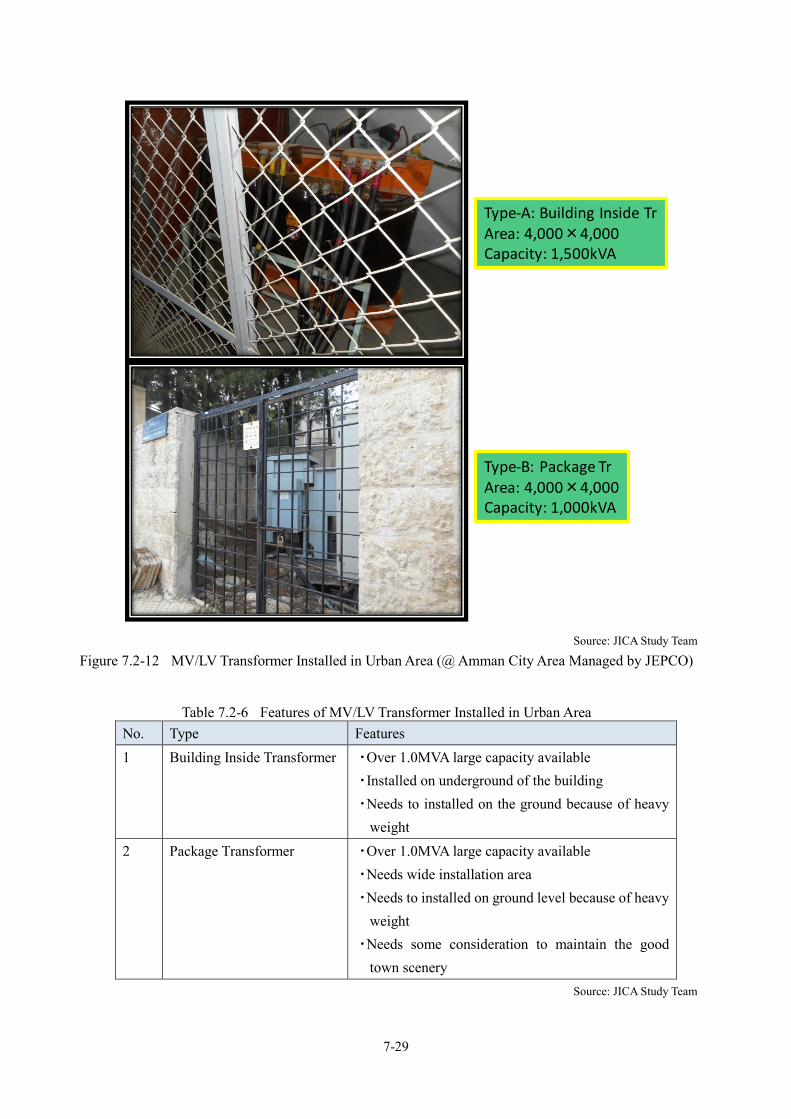
Figure 7.2-12 shows the MV/LV transformer which is installed in urban area of Jordan. The features of this transformer are listed in Table 7.2-6. Biggest difference between the transformers which are installed in rural area, there are no Pole mouted transformers. Considerable reasons of this situation are as follows.
Difficult to acquisition of necessary areas and occupy the space because it needs two poles Although the transformer installed on ground level because almost cables are installed on
underground level, there are not enough areas on the walkway to install the transformers. Distribution company will receive many complaints from peripheral citizens around the
transformer because they will concern about losing the good town scenery and losing their health by exposure of electromagnetic wave.
Therefore, also as a result of consideration of the economical evaluation, distribution company introduced the present LV system configuration which covers wide area and is covered by singular large capacity transformer instead of the Pole mounted transformers which needs lower cost and has small capacity.
7-29
Source: JICA Study Team
Figure 7.2-12 MV/LV Transformer Installed in Urban Area (@ Amman City Area Managed by JEPCO)
Table 7.2-6 Features of MV/LV Transformer Installed in Urban Area No. Type Features 1 Building Inside Transformer ・Over 1.0MVA large capacity available
・Installed on underground of the building ・Needs to installed on the ground because of heavy
weight 2 Package Transformer ・Over 1.0MVA large capacity available
・Needs wide installation area ・Needs to installed on ground level because of heavy
weight ・Needs some consideration to maintain the good
town scenery Source: JICA Study Team
Type-A: Building Inside TrArea: 4,000×4,000Capacity: 1,500kVA
Type-B: Package TrArea: 4,000×4,000Capacity: 1,000kVA

7-30
(iii) MTrS-U Introduce MTrS in Urban Area: MTrS-U
JICA study team proposes “MTrS for Urban area” (hereinafter refered to as MTrS-U) as a way to introducing MTrS in urban area which solves the issues discussed as above.
In Japan, MTrS-U technology is so called “Soft-Undergrounding Distribution”, and it was already introduced on 1) Hirai, Edogawa-ku, Tokyo, Japan, 2) Gen-nan Street, Shizuoka City, Shizuoka, Japan, and 3) Nishinosho, Suita City, Osaka and so on, Japan. Figure 7.2-13 shows the overview sketch of MTrS-U.
Source: Chubu Electric Power Company
Figure 7.2-13 Overview Sketch of MTrS-U
Basic requirements of MTrS-U configuration are as follows.
The basis of network configuration should be accord with MTrS, that is, separate large area to small areas.
Voltage transformation should be carried out by pole mounted transformer which can be mounted on singular pole.
A pole mounted transformer should be harmonizing with peripheral environment i.e. color, shape, and mounting measure should be considered well.
A pole mounted transformer should be able to be mounted on existing poles e.g. Street light pole, and so on.
The line of LV network should be overhead cable and/or underground cable according to existing LV system configuration.
OH Dist Facility OH service wire is extended from the wire along the street light pole
Small Tr is mounted onStreet light pole
UG LV cable
Street Light Pole
Installation Image of MTrS-U
UG MV cable

7-31
Figure 7.2-14 shows the Pole mounted transformer which is harmonizing with peripheral environment. This M/P project invited the NEPCO and each distribution company staffs to Gen-nan Street located in Shizuoka City as a part of the training program in Japan, and they confirmed the practice example of MTrS-U in the site. They really preferred the environmental harmonizing situation of the practice example.
Figure 7.2-16 (before introduction) and Figure 7.2-17 (after introduction) show the applying ways of MTrS to urban area. LV TL will be reduced by introduction of this technology because heavy current will be removed from the network and the area covered by singular transformer will be shrinked, and these effects are realized by voltage compensation at appropriate point on the network.
Source: JICA Study Team
Figure 7.2-14 Environmental Harmonized Type Pole Mounted Transformer for MTrS-U
Hirai, Edogawa-kuTokyo, Japan
Gen-nan St., Shizuoka CityShizuoka, Japan
Trans.
Trans.

7-32
Source: JICA Study Team
Figure 7.2-15 Circumstance of Training Program in Japan (15th January 2016, Gen-nan Street located in Shizuoka City)
Source: JICA Study Team
Figure 7.2-16 Present Network Configuration of LV System in Urban Area of Jordan
MV/LV Transformer(Ground Mount TypeLarge Capacity)UG MV cableUG LV cableStreet Light PoleRoad
Tr0
All area is covered by Tr0.Voltage drop @ terminal is highHeavy current flows near Tr0
TL is high!!But Tr cannot be installed anywherebecause land acquisition is verydifficult in urban area...
Pole mountable TrNew UG MV cableNew UG LV cable

7-33
Source: JICA Study Team
Figure 7.2-17 Network Configuration of LV System in Urban Area of Jordan After Introducing of MTrS-U
Tr0
Voltage of terminal section is compensated by pole mountable Trs.Trs can be installed on Street Light Pole, so no need to prepare new large land for Trs.
MV/LV Transformer(Ground Mount TypeLarge Capacity)UG MV cableUG LV cableStreet Light PoleRoadPole mountable TrNew UG MV cableNew UG LV cable


8-1
Promotion of Energy Saving
Background of energy-saving measures
Jordan must import almost all of the primary energy resources it needs, and spend nearly 15 to 18% of its GDP on the procurement cost of the primary energy resources. Therefore, there was a sense of crisis that the supply of energy would not be ensured because the energy demand in Jordan increased year by year. In this situation, the Jordanian government established “National Master Strategy of Energy Sector” in the year 2004, and decided to make active efforts to solve issues facing the energy sector. In 2004, “Energy Efficiency Strategy” was developed by MEMR in cooperation with National Energy Research Center in order to complement the “National Master Strategy of Energy Sector” with specific goals and policies to deal with the emerging energy challenge.
The key goals and the specific policies / tactics of “Energy Efficiency Strategy” are shown in Figure 8.1-1.
Source: “Regular Review of Energy Efficiency Policies (2010)” (Energy Charter Protocol on Energy Efficiency and Related Environmental Aspects (PEEREA)”
Figure 8.1-1 The key goals and the specific policies / tactics of “Energy Efficiency Strategy”
[Key Goals] ・ To reduce power consumption without negatively effecting production or the standard of living for Jordanians. ・ To improve the standards of living ・ To achieve a balance between imports and exports. ・ To reduce production cost and to improve competitiveness of local industries ・ Lower the investment needs in the generation, transmission and distribution of energy through efficiency
improvements. [Specific policies / tactics]
1. Tariff policy - Removing subsidies on petroleum products and electricity and applying a pricing structure based on actual cost.
2. Legislation To improve energy use efficiency and to increase the demand for high efficiency equipment and services, 1) Taxation policy, 2) Building standards, 3) Minimum energy performance standards for energy using equipment, and 4)
Custom policy
3. Awareness and Training - Implementation of awareness and training programmes for improving energy consumption through increasing awareness at
the sectoral level, such as investors and energy service suppliers, - Public awareness through media; education programmes; seminars and workshops as well as by involving private sector and
NGO - Establishing an integrated energy database to assist consumers and service suppliers to make informed decisions to optimise
consumption and invest. - Training and national capacity building to enhance the capacities of targeted groups - Provision of the needed experience and information to policy makers and legislators to develop and put into place the necessary
measures
4. Financial Policies - Increasing the awareness among local financing institutions of the importance of energy conservation projects and their
economic returns - Establishing a special fund to finance energy conservation projects with a shared capital from Government and donor
institutions to provide soft loans for such projects.

8-2
“National Master Strategy of Energy Sector” was amended and newly established as “Updated Master Strategy of Energy Sector in Jordan for the period (2007-2020)” in December, 2007. This Updated Strategy aims to reduce 20% of energy consumption in Jordan by 2020 as the goal of energy efficiency by promoting programs and projects that aim to reduce energy comsumption in all sectors such as private, industrial, commercial, public, transportation and water pumping.
Existing situation of energy-saving measures
Legal system and action plan for energy-saving
The strategy, legal system and action plan for energy-saving are shown in Figure 8.2-1.
Strategy Law, By-law Action Plan
Source: JICA Study Team
Figure 8.2-1 Strategy, legal system and action plan for energy-saving in Jordan
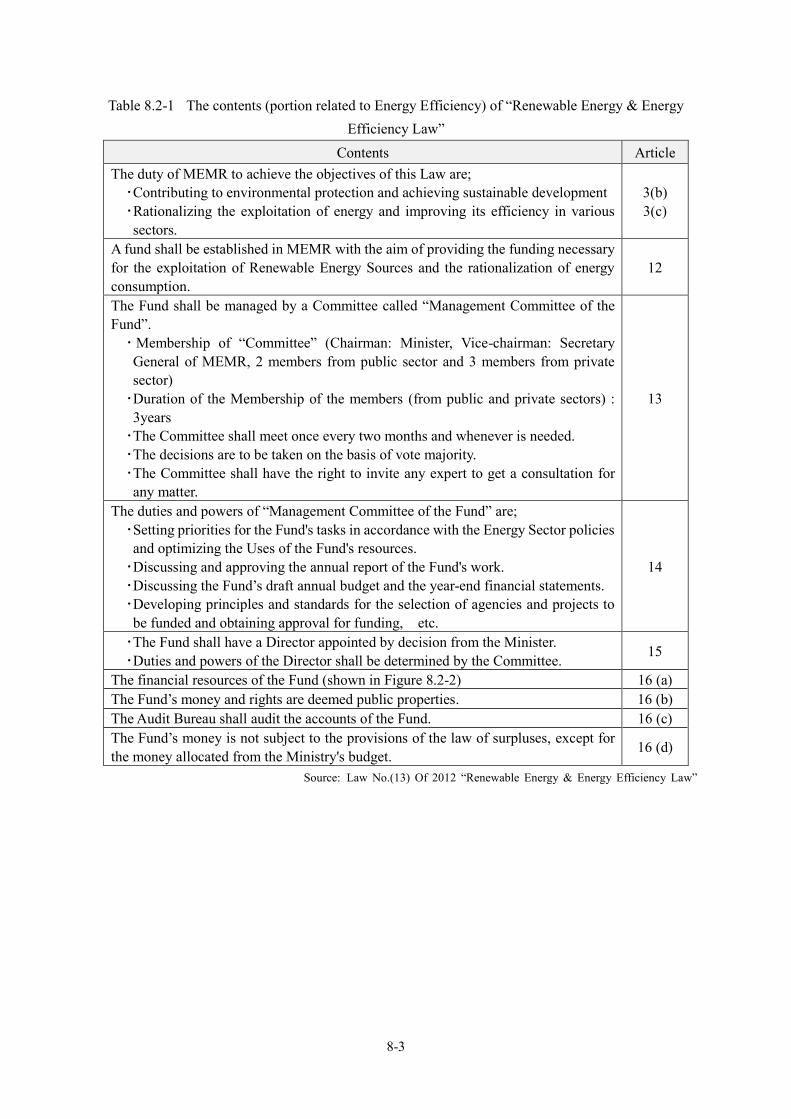
The contents (portion related to energy efficiency) of “Renewable Energy & Energy Efficiency Law” which was enacted in 2010 and amended in April 2012 are shown in Table 8.2-1 As a by-law on“Renewable Energy & Energy Efficiency Law”, “The Bylaw on Regulating Procedures
and Means of Conserving Energy and Improving Its Efficiency” that stipulates the efforts for energy-saving or energy efficiency is established. Measures for enegy-saving shown in Table 8.2-2 are to be promoted according to this by-law.
National Master Strategy of Energy Sector
(2004)
Updated Master Strategy of Energy Sector in Jordan
for the period (2007-2020) (Dec. 2007)
Energy Efficiency Strategy (Sep. 2004)
Renewable Energy & Energy Efficiency Law
(2010)
Amended
(Apr. 2012)
National Energy Efficiency Action Plan
(2013)
The By-law on Regulating Procedures and Means of Conserving Energy and Inproving Its Efficiency
(2012)
8-3
Table 8.2-1 The contents (portion related to Energy Efficiency) of “Renewable Energy & Energy Efficiency Law”
Contents Article The duty of MEMR to achieve the objectives of this Law are; ・Contributing to environmental protection and achieving sustainable development ・Rationalizing the exploitation of energy and improving its efficiency in various
sectors.
3(b) 3(c)
A fund shall be established in MEMR with the aim of providing the funding necessary for the exploitation of Renewable Energy Sources and the rationalization of energy consumption.
12
The Fund shall be managed by a Committee called “Management Committee of the Fund”. ・ Membership of “Committee” (Chairman: Minister, Vice-chairman: Secretary
General of MEMR, 2 members from public sector and 3 members from private sector) ・Duration of the Membership of the members (from public and private sectors) :
3years ・The Committee shall meet once every two months and whenever is needed. ・The decisions are to be taken on the basis of vote majority. ・The Committee shall have the right to invite any expert to get a consultation for
any matter.
13
The duties and powers of “Management Committee of the Fund” are; ・Setting priorities for the Fund's tasks in accordance with the Energy Sector policies
and optimizing the Uses of the Fund's resources. ・Discussing and approving the annual report of the Fund's work. ・Discussing the Fund’s draft annual budget and the year-end financial statements. ・Developing principles and standards for the selection of agencies and projects to
be funded and obtaining approval for funding, etc.
14
・The Fund shall have a Director appointed by decision from the Minister. ・Duties and powers of the Director shall be determined by the Committee. 15
The financial resources of the Fund (shown in Figure 8.2-2) 16 (a) The Fund’s money and rights are deemed public properties. 16 (b) The Audit Bureau shall audit the accounts of the Fund. 16 (c) The Fund’s money is not subject to the provisions of the law of surpluses, except for the money allocated from the Ministry's budget. 16 (d)
Source: Law No.(13) Of 2012 “Renewable Energy & Energy Efficiency Law”

8-4
Table 8.2-2 The contents of bylaw on regulating procedures and means of conserving energy and improving its efficiency
Content Article Support or effort by the government (Policy making, investment promotion, monitoring to energy audit system, summer-time, implementation of an emergency plan to reduce energy consumption, spreading national awareness on energy-saving and energy-efficiency, opine on energy-consuming project, Establishing database related to energy-saving and energy efficiency
3
Certification system for energy-saving and energy-efficiency 4 Energy audit system 5,6 Energy efficiency labeling system to introduce high energy-efficient apparatuses and equipment
7,8
Encouraging the replacement of electricity meters for DSM 9 Requirement of installation of a solar water heater(SWH) Building : 250m2 in area or more; Apartment : 150m2 in area or more; Office in commercial building : 100 m2 in area or more;
10
Energy-efficiency award program 12 Source: Bylaw on regulating procedures and means of conserving energy and improving its efficiency (Bylaw No.(73) For Year 2012)
National Energy Efficiency Action Plan (hereinafter referred to as “NEEAP”) was approved in June, 2013. NEEAP shows the national indicative target and the energy-efficiency measures for each sector. (shown in Table 8.2-3 and Table 8.2-4) The energy saving measures in Jordan is basically being promoted according to NEEAP.
Table 8.2-3 National Indicative target of each sector in NEEAP
Sector Baseline consumption (GWh / 5 year average)
National Indicative Target (2020) % GWh
1. Residential 4,447 25% 1,112 2. Industrial 3,013 15% 452 3. Commercial 1,875 12% 225 4. Water Pumping 1,668 23% 384 5. Street Lighting 288 30% 86
Total 11,291 20% 2,258 Source: National Energy Efficiency Action Plan (2012)

8-5
Table 8.2-4 Energy-efficiency measures for each sector in NEEAP
Sector Contents of main approaches to energy-efficiency
1. Residential
Energy-efficiency for lighting apparatuses(Replacement of 1.5 million incandescent lights with CFL10)
Labeling system for four home apparatuses (Refrigerators, Freezers, Air conditioners and Washing machines)
Solar Water Heating System 2. Industrial Energy & Environment audit system
3. Commercial Energy-efficiency for lighting apparatuses (Replacement of conventional ballasts with electric ballasts with fluorescent lamps11)
4. Water Pumping Public-private approaches to energy-saving in pumping stations through the leadership of WAJ12
5. Street Lighting Energy-efficiency for lighting apparatuses (Replacement of mercury
lamps by efficient high pressure sodium lamps, using automatic street lighting controllers)
Source: National Energy Efficiency Action Plan (2012)
Frameworks to promote energy-saving measures
Main entities except administrative agencies that promote energy-saving measures are as follows.
(1) National Energy Research Center
National Energy Research Center (hereinafter referred to as “NERC”) was established as a governmental organization in 1998. After that, it megered with other research institutions and became “National Energy Research Center” which is independent from any government agencies. The various efforts for energy efficiency are important tasks of NERC besides research, development and training in the field of new energy (oil-shale etc.) and renewable energy. NERC assists the energy efficiency efforts of private sectors such as factories, hotels, hospitals and commercial buildings. In concrete terms, NERC provides various services in the field of energy-saving such as implementing projects related to energy efficiency and solar thermal energy, energy audits, training programs, public awareness and assistance of project implementation and financing.
10 Compact Fluorescent Lamp 11 Conventional ballasts tend to increase power consumption after using more than 10 years, but the power consumption of electric ballasts hardly increases because they include an inverter circuit. 12 Water Authority of Jordan

8-6
Table 8.2-5 Services and Activities for Energy Efficiency by NERC
Energy Audits
・Free Preliminary Energy Studies for factories, hospitals, and hotels by distributing a questionnaire in order to specify the energy saving potentials ・“Detailed Energy Audits” based on detailed measurement to provide suitable
and practical recommendations after field survey
<Contents of “Detailed Energy Audits” > Collecting energy, water, and production data from the establishment Conducting detailed measurements for the energy consuming
equipment Presenting detailed report which includes analysis of the current energy
situation in the establishment and the needed actions which will improve the energy use efficiency in the form of specific "energy projects" which if implemented will yield the calculated savings
Implementation of Energy Conservation Projects
Financial feasibility studies for energy conservation projects
Assisting industry in obtaining financing (grants and soft loans) for “Detailed Energy Audits” studies and for implementing energy conservation projects
Setting specifications and querying offers for energy saving equipment
Supervising erection and commissioning
Conducting periodic and final measurements to ensure efficient implementation of energy conservation projects
Awareness
Preparing and carrying out an awareness campaign for the purpose of emphasizing the profit opportunities available by reducing specific energy consumption in industrial and commercial sectors which will result in increased competitiveness and reduction in environmental pollution
Publishing a News Letter 4 times a year and The Energy Saving Equipment Directory
Training
Training workshops for top management in the field of “Rational Use of Energy” and energy management strategy for the purpose of reducing expenses and increasing profits.
Training courses for engineers in the field of “Rational Use of Energy” in the industrial and commercial sector through improving energy utilization efficiency and avoiding energy waste.
Training Seminars to enhance and develop local skills in the field of energy conservation.
Source: NERC’s website

8-7
(2) Jordan Renewable Energy and Energy Efficiency Fund (JREEEF) Jordan Renewable Energy and Energy Efficiency Fund (hereinafter referred to as “JREEEF”) was
established in conformity with the regulation of the Article 14 of Renewable Energy & Energy Efficiency Law so that the establishment of a fund would provide the necessary investment for the development of renewable energy and energy efficiency projects. JREEEF was established as a legally independent entity with financial and administrative autonomy to
acquire movable and immovable assets necessary to achieve its objectives. And it is also allowed to receive donors’ grants and financial assistance. JREEEF aims to contribute to the development of renewable energy sources and energy efficiency activities in Jordan through investing in projects and conducting preliminary studies.
The overall of JREEEF’s activities is shown in Figure 8.2-2.
Source: JORDAN’S ENERGY EFFICIENCY STRATEGY (Regional workshop WEC-ADEME“Evaluation of Energy Efficiency Policies in the MENA Region”organised by ANME with the support of UNDP, Tunis, 15-16 March 2010)
Figure 8.2-2 Overall of JREEEF’s activities
[Financial resources of the Fund] ・ Allocations from the national budget
・ Return on investment from the Fund’s own investment
・ Contributions, donations and grants from various sources subjects to the approval of the Cabinet if provided by foreign sources
・ Any other financial resources provided that it is approved by the Cabinet
・ JREEEF is granted the same privileged exemptions as all other public entities
[Five main components of JREEEF; RE: Renewable Energy, EE: Energy Efficiency]
(1) Renewable Energy Subsidy – will support deployment of renewable (wind) power in Jordan by closing gap between offered price and acceptable purchase price – RE support.
(2) Studies and Technical Cooperation – will provide grants for feasibility studies; training, DSM program development; other programs and initiatives to support RE and EE development.
(3) RE and EE Guarantee Faclity – will provide resources to facilitate access for borrowing from commercial banks for the development of RE and EE.
(4) RE and EE Interest Rate Subsidy – interest rate subsidies on commercial loans to reduce the overall cost of RE and EE programs and projects.
(5) Equity – will deploy funds as “Public Equity” into privately managed investment funds to encourage deployment of private capital.

8-8
(3) EDAMA EDAMA, an Arabic word meaning “sustainability”, is a Jordanian business association that seeks
innovative solutions for energy and water independence and environmental conservation. EDAMA13 Association strives to advance Jordan’s movement towards a green economy via creating a vibrant new economic sector of energy businesses, driving applied research, developing and commercializing Jordanian technologies, building public awareness and advocating for policies that will make Jordan a model of energy efficiency, water conservation and environmental stewardship. EDAMA Association provides a platform for a large number of public, private and NGO sector representatives to discuss the future development of the Energy, Water and Environment sectors in Jordan with particular emphasis on renewable energy.
Table 8.2-6 Vision, Mission and Core Values of EDAMA Association
Vision To be the NGO most recognized for creating a healthy business environment in the Energy, Water and Environment sectors in Jordan.
Mission To ensure the establishment and growth of vibrant private Energy and Water sectors reflecting positive environmental realities in Jordan.
Core Values
•It is only through an active, effective and efficient public-private partnership that Jordan will maximize its benefits in the Energy, Water and Environment sectors.
•EDAMA as part of the national NGO ecosystem, will be most effective if it cooperates with other relevant NGOs to benefit Jordan.
•Working for the benefit of all our members is the surest way to sustainability and growth. Source: EDAMA’s website
13 EDAMA is sometimes described as “Energy, Water and Environment Productivity Association”
8-9
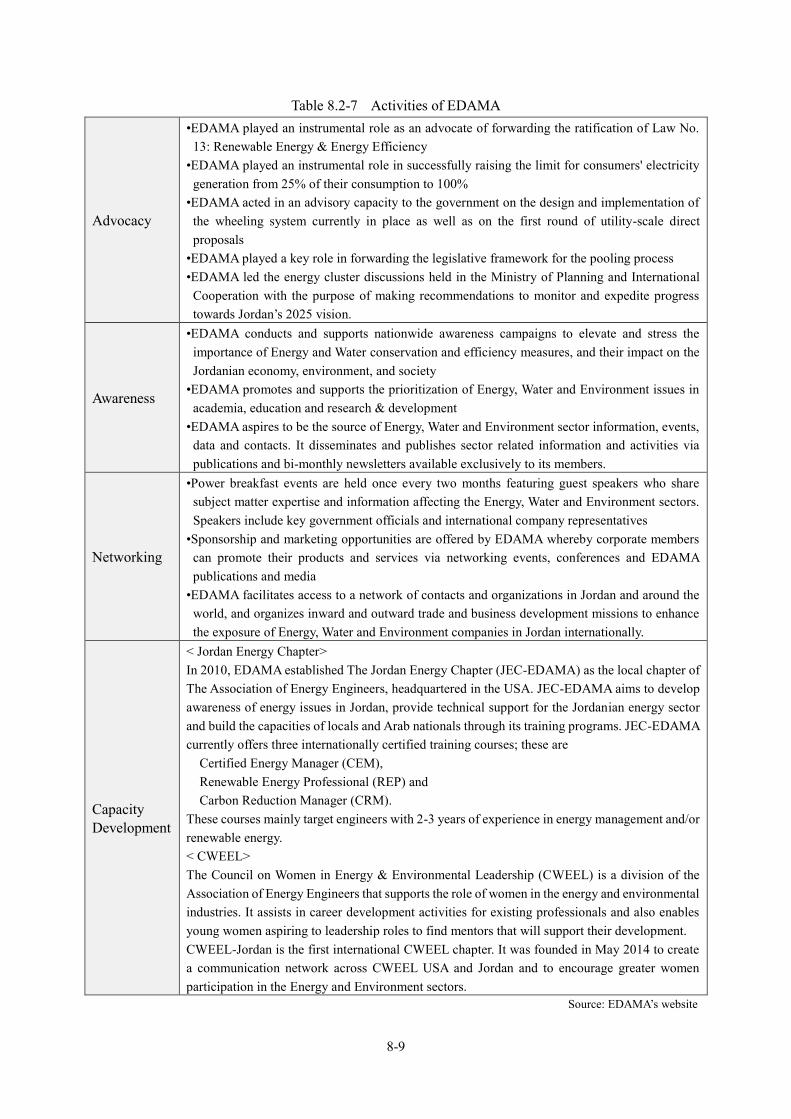
Table 8.2-7 Activities of EDAMA
Advocacy
•EDAMA played an instrumental role as an advocate of forwarding the ratification of Law No. 13: Renewable Energy & Energy Efficiency
•EDAMA played an instrumental role in successfully raising the limit for consumers' electricity generation from 25% of their consumption to 100%
•EDAMA acted in an advisory capacity to the government on the design and implementation of the wheeling system currently in place as well as on the first round of utility-scale direct proposals
•EDAMA played a key role in forwarding the legislative framework for the pooling process •EDAMA led the energy cluster discussions held in the Ministry of Planning and International
Cooperation with the purpose of making recommendations to monitor and expedite progress towards Jordan’s 2025 vision.
Awareness
•EDAMA conducts and supports nationwide awareness campaigns to elevate and stress the importance of Energy and Water conservation and efficiency measures, and their impact on the Jordanian economy, environment, and society
•EDAMA promotes and supports the prioritization of Energy, Water and Environment issues in academia, education and research & development
•EDAMA aspires to be the source of Energy, Water and Environment sector information, events, data and contacts. It disseminates and publishes sector related information and activities via publications and bi-monthly newsletters available exclusively to its members.
Networking
•Power breakfast events are held once every two months featuring guest speakers who share subject matter expertise and information affecting the Energy, Water and Environment sectors. Speakers include key government officials and international company representatives
•Sponsorship and marketing opportunities are offered by EDAMA whereby corporate members can promote their products and services via networking events, conferences and EDAMA publications and media
•EDAMA facilitates access to a network of contacts and organizations in Jordan and around the world, and organizes inward and outward trade and business development missions to enhance the exposure of Energy, Water and Environment companies in Jordan internationally.
Capacity Development
< Jordan Energy Chapter> In 2010, EDAMA established The Jordan Energy Chapter (JEC-EDAMA) as the local chapter of The Association of Energy Engineers, headquartered in the USA. JEC-EDAMA aims to develop awareness of energy issues in Jordan, provide technical support for the Jordanian energy sector and build the capacities of locals and Arab nationals through its training programs. JEC-EDAMA currently offers three internationally certified training courses; these are
Certified Energy Manager (CEM), Renewable Energy Professional (REP) and Carbon Reduction Manager (CRM).
These courses mainly target engineers with 2-3 years of experience in energy management and/or renewable energy. < CWEEL> The Council on Women in Energy & Environmental Leadership (CWEEL) is a division of the Association of Energy Engineers that supports the role of women in the energy and environmental industries. It assists in career development activities for existing professionals and also enables young women aspiring to leadership roles to find mentors that will support their development. CWEEL-Jordan is the first international CWEEL chapter. It was founded in May 2014 to create a communication network across CWEEL USA and Jordan and to encourage greater women participation in the Energy and Environment sectors.
Source: EDAMA’s website

8-10
Support to energy-saving approaches by other donors
In Jordan, support activities to energy-saving approaches are being implemented by other donors such as USAID, EU, French or Germany donor organization. In particular, “Energy Sector Capacity Building Program (hereinafter referred to as “ESCB”)” promoted by USAID, efforts are being progressed as shown in Table 8.2-8.
Table 8.2-8 Outline of ESCB Project name Energy Sector Capacity Building Program Budget scale USD 19 million Project period 4 years from July, 2013 Counterpart organizations
MEMR, EMRC, NEPCO and 3 distribution companies (JEPCO, IDECO and EDCO)
Purpose / Content (Excerpt of those are related to energy-saving)
Governmental endorsement of “Demand Side Mechanism (DSM) for establishing programs with energy utilities to support consumer adoption of energy efficiency
Consultations with commercial and industrial sector on energy efficiency and trust in energy utilities
First detailed energy use survey on over 2,500 Jordanian households Development of a financial model for utilities to conduct cost-benefit
analysis for energy conservation programs Analysis of policy gaps in existing legislation and regulations on
renewable energy and energy efficiency
Existing situations of energy-saving approaches
Energy-saving approaches in Jordan as of April, 2015 are shown in Table 8.2-9 by item.

8-11
Table 8.2-9 Existing situations of energy-saving main approaches in Jordan (as of April, 2015) Items Existing situations
Energy efficiency labeling system 14 to introduce high energy-efficient apparatuses and equipment
The labels of the following home electronic apparatuses have been prepared;
dryers, electric washing machines, washing machines with dryers, dish washers, electric furnaces, bulbs, freezers and refrigerators, TV sets and air conditioners
The apparatuses the labeling system of which has already begun are refrigerators and washing machines. And the labeling system of TVset and air conditioners are scheduled to begin in 2016.
Energy manager system (hereinafter described)
Energy audit system
The stakeholder committee has been established to promote the energy audit system for main building of some governmental ministries
Training workshops for liaison officers to tell how to conduct energy audit
Implementation of energy audits for 3 ministries and institutions by MEMR in cooperation with ESCB in December, 2014 (and obtaining the approval ESCB to implement energy audit to three other government institutions)
Implementation of 23 energy audits for factories through the Energy and Environment Program clinic in Amman Chamber of Industry.
Introduction of solar water heaters
Installation of two thousand solar heaters in cooperation and coordination with the Jordan River Foundation.
Energy-saving measures for water pumping stations
Studies to reduce energy consumption in water pumping stations of the water authority.
Preferential taxation
As for renewable-energy and its equipment, rationalization of energy consumption and its products, the exemption or the reduction of customs duties or general sales tax were approved by the prime minister.
Public awareness activities (Publication or education)
Implementation of awareness and education program in the field of energy-saving for 3 government institutions on December, 2014 (Ministry of Industry and Trade, Ministry of Health and Ministry of Transport)
Implementation of awareness media plan for the rationalization of energy consumption for all segments of society (targeting schools, universities and others)
Four TV spots to rationalize energy consumption were prepared and presented to the Jordanian on TV and radio.
Guideline to rationalize energy consumption and awareness brochures were prepared and distributed to all segments of society.
Each of NEPCO, JEPCO and so on appeals electricity-saving or energy-saving by its website. (Refer to Table 8.2-10 and Table 8.2-11)
14 UNDP assisted NERC to create Energy efficiency labeling system through the project “Energy Efficiency Standards and Labeling in Jordan” from July, 2010 to December, 2014.
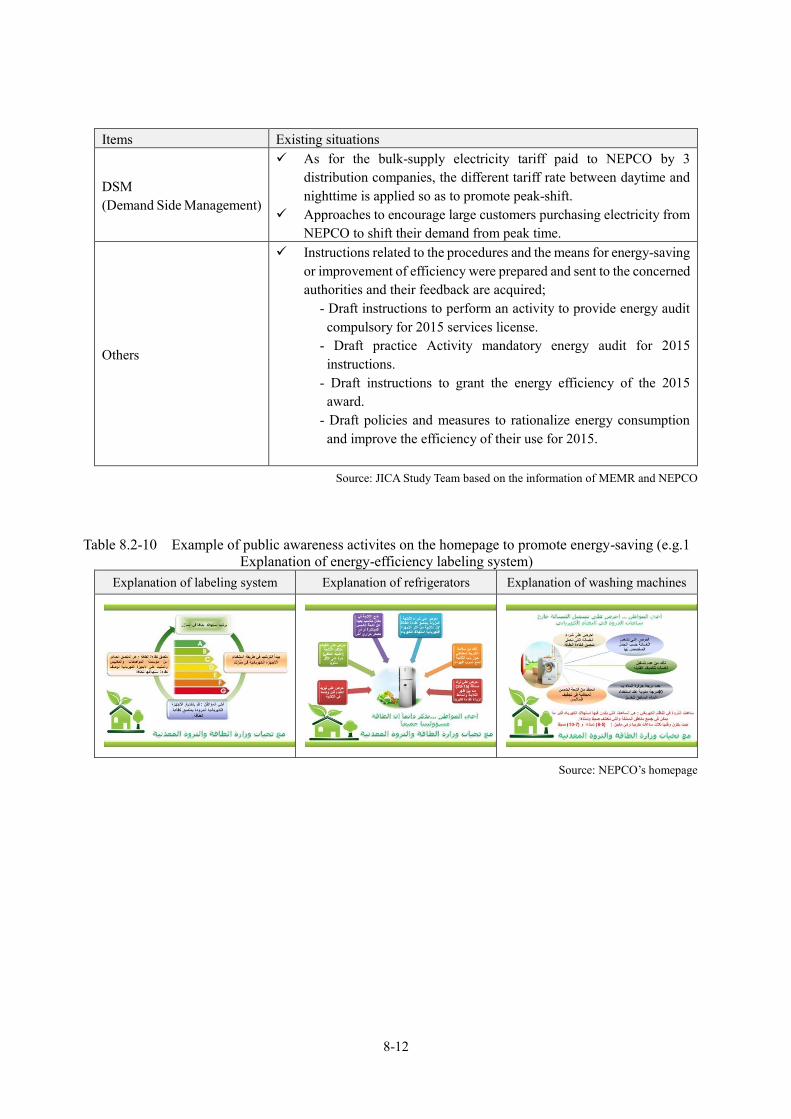
8-12
Items Existing situations
DSM (Demand Side Management)
As for the bulk-supply electricity tariff paid to NEPCO by 3 distribution companies, the different tariff rate between daytime and nighttime is applied so as to promote peak-shift.
Approaches to encourage large customers purchasing electricity from NEPCO to shift their demand from peak time.
Others
Instructions related to the procedures and the means for energy-saving or improvement of efficiency were prepared and sent to the concerned authorities and their feedback are acquired;
- Draft instructions to perform an activity to provide energy audit compulsory for 2015 services license.
- Draft practice Activity mandatory energy audit for 2015 instructions.
- Draft instructions to grant the energy efficiency of the 2015 award.
- Draft policies and measures to rationalize energy consumption and improve the efficiency of their use for 2015.
Source: JICA Study Team based on the information of MEMR and NEPCO
Table 8.2-10 Example of public awareness activites on the homepage to promote energy-saving (e.g.1 Explanation of energy-efficiency labeling system)
Explanation of labeling system Explanation of refrigerators Explanation of washing machines
Source: NEPCO’s homepage

8-13
Table 8.2-11 Example of public awareness activites on the homepage to promote energy-saving (e.g.2 Provision of information for good usage of electricity)
Appliance Explanation
Heating And
Cooling
Keep blinds, shades and drapes closed during the hottest part of the day in the summer. (And open southfacing blinds on sunny winter days!)
Use area rugs on cold floors – if your feet are cold, your body will feel cold If you feel cool, put on a sweater rather than simply turning up the heater To save more on central AC costs, try cooling your home to only 24 or 25 °C instead of
the low 20's. Each degree below 26 °C will noticeably increase your electricity use Turn off unnecessary lights in the house (they produce a lot of heat which works against
the AC. Water Heater Showers save hot water – a typical bath uses approximately 75 liters of hot water, while
a 5-minute shower with an efficient showerhead will use about half of that Be sure to use the vacation setting or turn off the water heater when you are out of town Set the temperature for only as cold as you need check manufacturer's recommendations
Refrigeration Don't overfill the refrigerator, as this blocks air circulation. Conversely, a full freezer will perform better than an empty one
Check your refrigerator's door seal by closing the door. If it's held tightly in place, the seal's OK; if not, the door should be adjusted or the seal replaced
Clean your refrigerator's coils (back) and air intake grill (below the doors) every 3 months
Keep refrigerators and freezers out of direct sunlight, and allow at least 5 centimeters all around (or as recommended by the manufacturer) to allow heat to escape from the compressor and condensing coil
Allow hot foods to cool before putting them in the refrigerator. When using the stove, be sure to put lids on pots in order to keep the heat in the pot, which enables you to use lower heat settings
Computer And
Electrical
Appliances
Less energy is consumed when computers and monitors are turned on and off (as often as required) than when left on over time. In fact, all electronic devices use more energy when left on, as opposed to being turned on and off as needed. Make sure you enable your computer's energy-saving features
Be sure to at least shut off the computer screen, as 60% of the power used by a computer is used by the monitor! (The other 40% is used to keep your hard drive spinning and to power the electronics.)
Unplug infrequently used TVs, as many continue to draw power even when turned off. Computers and related components use electricity even when they are not in use. Plug each computer component into a power bar that can be shut off, to avoid wasting electricity with the 'standby' power feature
Lighting Use compact fluorescent light bulbs. They cost more than regular light bulbs but can use 75% less electricity and last years longer. One compact fluorescent bulb can save you three times its cost in electricity
For outside lighting, install a motion sensor that turns the lights on automatically when somebody walks by, then turns the lights off automatically after 1 to 5 minutes
Dimmer switches are not just a great way to set the mood, they're an inexpensive way to save energy. (Don't use with compact fluorescent bulbs.)
Turn off lights whenever you leave a room or don't need them, even for just a few minutes
Opening your blinds is a free way to brighten up a room For any light that must be on all night (e.g., stairways), replace the bulbs with the lowest
wattage bulbs that you're comfortable with or consider a compact fluorescent or a nightlight
Keep light fixtures clean – a cleaner bulb is a brighter bulb Source: JEPCO’s homepage (English version)

8-14
[Energy manager system]
Jordan Enterprise Development Corporation (hereinafter referred to as “JEDCO”) implements Certified Energy Manager (hereinafter referred to as “CEM”) system in Jordan funded by EU. The CEM training program is mainly open to workers who work at small and medium-size enterprises in Jordan, and CEM system aims to build capabilities of them and to promote rational use of energy in Jordan. According to the announcement of CEM training program in JEDCO’s website, the application
requirements for CEM training program are shown in Table 8.2-12.
Table 8.2-12 Application requirements for CEM traininig program
Enterprise
・To be operating in the industrial sector, agricultural industrial sector, or services sector, registered in Ministry of Industry, Trade and Supply
・It must have been registered at least two years
・The total number of employees must be more than 10, and less than 250, (Only employee registered in the Social Security Corporation)
Applicant for CEM training course
・He/She has a University Degree in one of the fields of Engineering
・He/She has a practical experience of not less than 3 years in the field of energy management (manufacturing, maintenance or consulting)
・He/She has a practical experience of not less than 8 years in the field of energy management for the technicians, or those without a degree in engineering.
・He/She is fluent in English
Source: JEDCO’s website
JEDCO implements CEM program via outsourcing to EDAMA.CEM training period is five days. Recently, the 11th CEM training course was held from April 10 to April 14 in 2016, and the 12th course from May 29 to June 2 in 2016. The number of attendees on the 11th CEM training course was twenty-eight.
As one of the human resource development efforts in ESCB project, USAID covers the participation cost of CEM training course for its C/Ps (MEMR employees at “Renewable Energy and Energy Efficiency” directorate, Energy Efficiency officers at other governmental agencies) so that they can acquire the knowledge and skills necessary for energy saving or energy efficiency efforts. (For example, in the 9th CEM training course in January 2016, the USAID ESCB program supported nine attendees from the public sector, whereas the total number of attendees was twenty-five.)
According to the material of USAID, the overall of CEM training course is as shown in Table 8.2-13.

8-15
Table 8.2-13 Overall of CEM training course
Course Objectives
At the end of the course, attendees should be able to discuss and evaluate; ・ Energy supplies, uses, and management in commercial and institutional
buildings and industries. ・ How energy can be used more efficiently in commercial and institutional
buildings and industries. ・ Relationships between energy and the environment in buildings, as well as basic
design concepts involved with construction of green buildings and facilities. ・ Different energy-using systems and equipment for buildings and manufacturing
plants.
Training Course Outlines
[Day1] Instructor Welcome and Introduction
Section A The Need for Energy Management/The Certified Energy Manager Examination Section B Energy Audits (or Surveys) & Energy Management Programs Section C Energy Audit Instrumentation Section D Energy Codes and Standards Section E Energy and Energy Purchasing Section F Energy Accounting and Benchmarking Section J CEM Exam Sample Questions
[Day 2] Section G Energy Rate Structures Section H Electric Rate Structures Section I Economic Analysis and Life Cycle Costing Section K Electrical Systems And Electric Energy Management
Section L Part I: Lighting Basics Part II: Lighting System Improvements
Section O HVAC Basics (HVAC: Heating, Ventilation and Air Conditioning) Section J CEM Exam Sample Questions
[Day3] Section O HVAC System Efficiency Improvement
Section M Part I: Electric Motors, and Motor Management Part II: Motors and Variable Speed Drives
Section T Combined Heat and Power and Renewable Energy Sources Section Q Compressed Air & Pumping Systems Section J CEM Exam Sample Questions
[Day 4] Section P Boilers and Thermal Systems; Boiler Efficiency Improvement Section R Building Envelop Section U Part I: Maintenance & Commissioning Section S Thermal Energy Storage
[Day 5] Section N Sustainable Green Buildings Section W Alternative Financing Section X Energy Management Software Section V Building Automation and Control Systems Section J CEM Exam Sample Questions CEM Examination
Outcomes Upon passing the exam at the end of the training course the participant will be certified Energy Manager.
Source:Course Catalogue “MEMR's & Energy Officers Capacity Building Needs” (USAID Energy Sector Capacity Building Project)
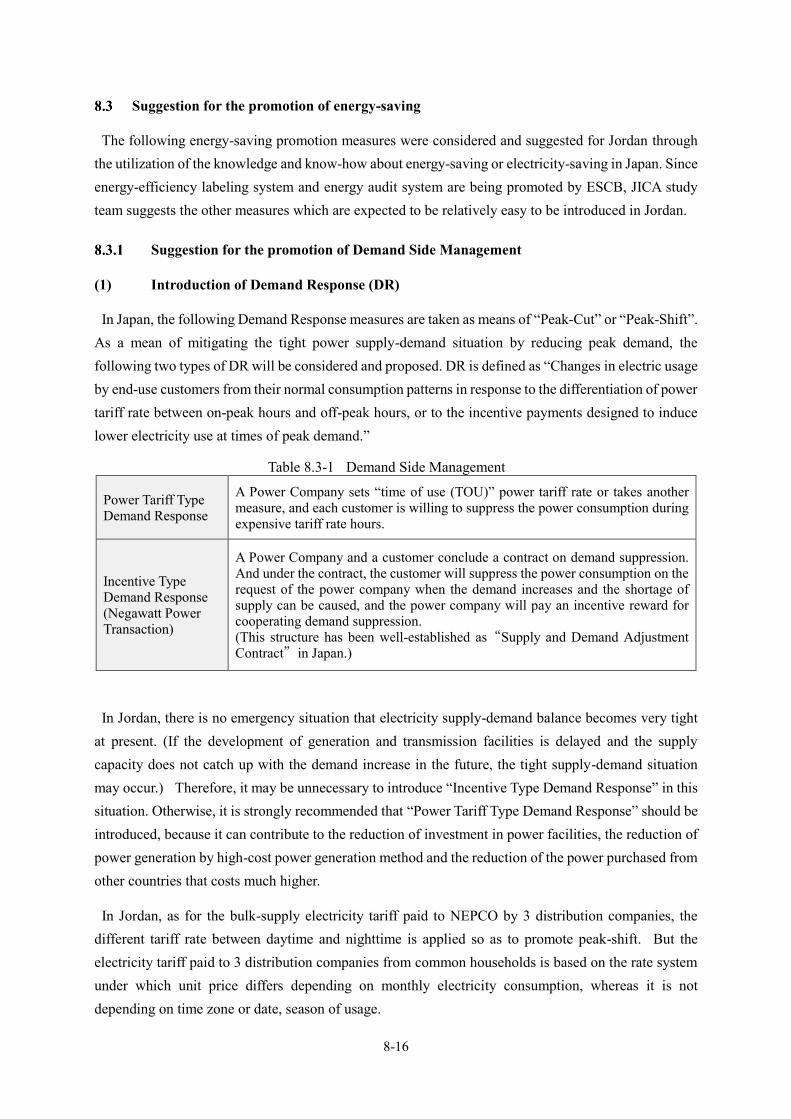
8-16
Suggestion for the promotion of energy-saving
The following energy-saving promotion measures were considered and suggested for Jordan through the utilization of the knowledge and know-how about energy-saving or electricity-saving in Japan. Since energy-efficiency labeling system and energy audit system are being promoted by ESCB, JICA study team suggests the other measures which are expected to be relatively easy to be introduced in Jordan.
Suggestion for the promotion of Demand Side Management
(1) Introduction of Demand Response (DR)
In Japan, the following Demand Response measures are taken as means of “Peak-Cut” or “Peak-Shift”. As a mean of mitigating the tight power supply-demand situation by reducing peak demand, the following two types of DR will be considered and proposed. DR is defined as “Changes in electric usage by end-use customers from their normal consumption patterns in response to the differentiation of power tariff rate between on-peak hours and off-peak hours, or to the incentive payments designed to induce lower electricity use at times of peak demand.”
Table 8.3-1 Demand Side Management
Power Tariff Type Demand Response
A Power Company sets “time of use (TOU)” power tariff rate or takes another measure, and each customer is willing to suppress the power consumption during expensive tariff rate hours.
Incentive Type Demand Response (Negawatt Power Transaction)
A Power Company and a customer conclude a contract on demand suppression. And under the contract, the customer will suppress the power consumption on the request of the power company when the demand increases and the shortage of supply can be caused, and the power company will pay an incentive reward for cooperating demand suppression. (This structure has been well-established as“Supply and Demand Adjustment Contract”in Japan.)
In Jordan, there is no emergency situation that electricity supply-demand balance becomes very tight at present. (If the development of generation and transmission facilities is delayed and the supply capacity does not catch up with the demand increase in the future, the tight supply-demand situation may occur.) Therefore, it may be unnecessary to introduce “Incentive Type Demand Response” in this situation. Otherwise, it is strongly recommended that “Power Tariff Type Demand Response” should be introduced, because it can contribute to the reduction of investment in power facilities, the reduction of power generation by high-cost power generation method and the reduction of the power purchased from other countries that costs much higher.
In Jordan, as for the bulk-supply electricity tariff paid to NEPCO by 3 distribution companies, the different tariff rate between daytime and nighttime is applied so as to promote peak-shift. But the electricity tariff paid to 3 distribution companies from common households is based on the rate system under which unit price differs depending on monthly electricity consumption, whereas it is not depending on time zone or date, season of usage.

8-17
For example, optional electricity service contract menus such as “Time Zone Contract” and “Peak-Shift Contract” shown in Table 8.3-2 are provided to customers who use low-voltage single-phase electric power, and each customer can select the contract type from these optional contract menus or the normal contract. This measure contributes the demand suppression in the peak-demand time zone.
In Jordan, electricity demand for heating is notably high in nighttime in winter, especially in the day when air temperature is very low. Therefore, for example, if “peak-shift menu” that tariff rate is set lower in other seasons and time zones instead of higher tariff rate in nighttime in winter is introduced, the peak load can be suppressed and high aforementioned cost-effectiveness can be obtained. (Turning up the preset temperature of a heating apparatus or using alternative heat source other than electricity is an effective measure for electricity-saving in this situation.)
In case that a conventional electromechanical meter or electronic meter has to be used, it is necessary to replace it with a single-purpose meter to correspond a specific tariff menu within the complex tariff system. For example, for the purpose of utilizing a tariff menu by season and time zone, a multi time zone meter and/or a time-switch must be installed. But if a smart meter is installed, it enables the setting of various tariff menus without replacement of the meter.
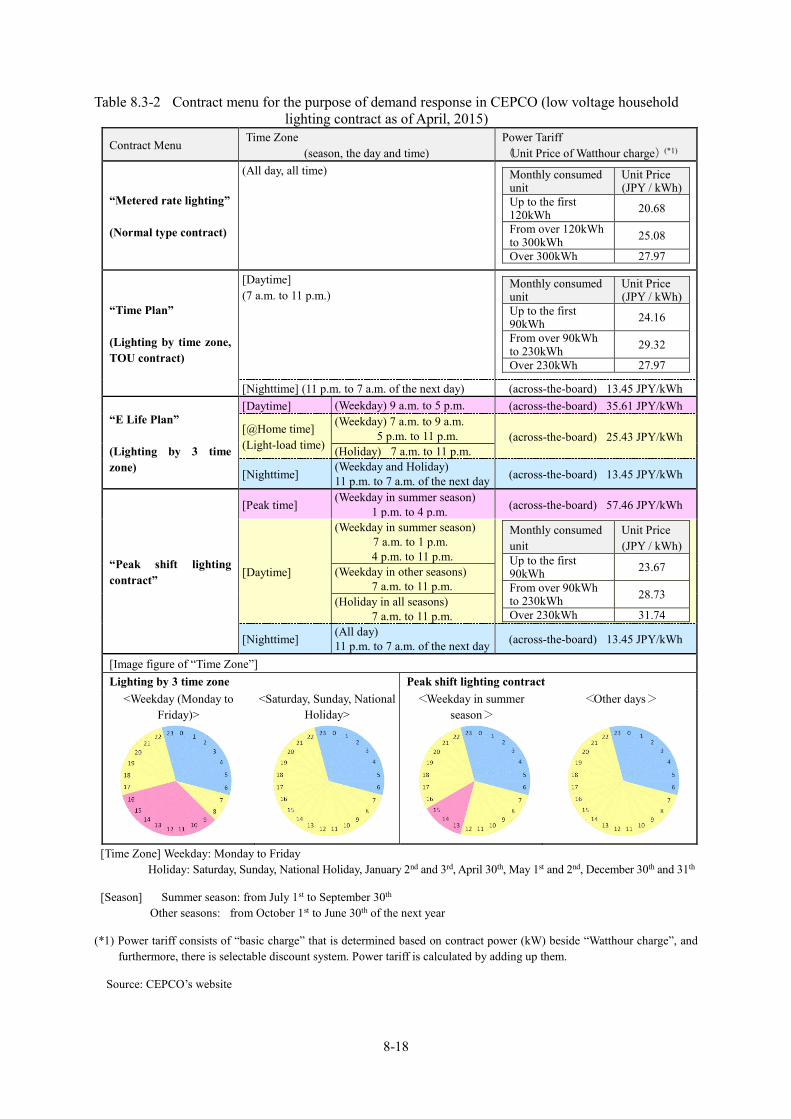
8-18
Table 8.3-2 Contract menu for the purpose of demand response in CEPCO (low voltage household lighting contract as of April, 2015)
Contract Menu Time Zone
(season, the day and time) Power Tariff (Unit Price of Watthour charge)(*1)
“Metered rate lighting” (Normal type contract)
(All day, all time)
Monthly consumed unit
Unit Price (JPY / kWh)
Up to the first 120kWh 20.68
From over 120kWh to 300kWh 25.08
Over 300kWh 27.97
“Time Plan” (Lighting by time zone, TOU contract)
[Daytime] (7 a.m. to 11 p.m.)
Monthly consumed unit
Unit Price (JPY / kWh)
Up to the first 90kWh 24.16
From over 90kWh to 230kWh 29.32
Over 230kWh 27.97
[Nighttime] (11 p.m. to 7 a.m. of the next day) (across-the-board) 13.45 JPY/kWh
“E Life Plan” (Lighting by 3 time zone)
[Daytime] (Weekday) 9 a.m. to 5 p.m. (across-the-board) 35.61 JPY/kWh
[@Home time] (Light-load time)
(Weekday) 7 a.m. to 9 a.m. 5 p.m. to 11 p.m. (across-the-board) 25.43 JPY/kWh (Holiday) 7 a.m. to 11 p.m.
[Nighttime] (Weekday and Holiday) 11 p.m. to 7 a.m. of the next day (across-the-board) 13.45 JPY/kWh
“Peak shift lighting contract”
[Peak time] (Weekday in summer season) 1 p.m. to 4 p.m. (across-the-board) 57.46 JPY/kWh
[Daytime]
(Weekday in summer season) 7 a.m. to 1 p.m. 4 p.m. to 11 p.m.
Monthly consumed unit
Unit Price (JPY / kWh)
Up to the first 90kWh 23.67
From over 90kWh to 230kWh 28.73
Over 230kWh 31.74
(Weekday in other seasons) 7 a.m. to 11 p.m. (Holiday in all seasons) 7 a.m. to 11 p.m.
[Nighttime] (All day) 11 p.m. to 7 a.m. of the next day (across-the-board) 13.45 JPY/kWh
[Image figure of “Time Zone”] Lighting by 3 time zone Peak shift lighting contract
<Weekday (Monday to Friday)>
<Saturday, Sunday, National Holiday>
<Weekday in summer season>
<Other days>
[Time Zone] Weekday: Monday to Friday Holiday: Saturday, Sunday, National Holiday, January 2nd and 3rd, April 30th, May 1st and 2nd, December 30th and 31th
[Season] Summer season: from July 1st to September 30th Other seasons: from October 1st to June 30th of the next year
(*1) Power tariff consists of “basic charge” that is determined based on contract power (kW) beside “Watthour charge”, and furthermore, there is selectable discount system. Power tariff is calculated by adding up them.
Source: CEPCO’s website

8-19
(2) Measures for the industry with high electricity consumption
Electricity consumption in Jordan from 2011 to 2014 is shown in Table 8.3-3. Companies in cement industry and companies in fertilizer industries making use of phosphate rock mined abundantly in Jordan are cited as large electricity consumers.
Table 8.3-3 Electricity consumption in Jordan (Actual result from 2011 to 2014)
Consumer Electricity Consumption (Annual, GWh)
2011 2012 2013 2014 1. Consumers in EDCO area (Total) 2362.5 2491.7 2612.0 2777.0 2. Consumers in JEPCO area (Total) 8008.4 8472.7 8510.7 8759.1 3. Consumers in IDECO area (Total) 2138.3 2181.1 2306.3 2520.7 4. Industrial Companies 963.1 1054.4 1065.4 1294.6
Refinery 102.8 106.9 98.5 98.4 Jordan Cement Company / Al-Fuheis plant 145.2 122.0 49.8 23.6 Jordan Cement Company / Al-Rashadieh plant 47.9 41.7 98.3 125.1 Al-Hadeetha Cement Company 0.1 34.6 86.0 111.3 Al-Rajhi Cement Company 17.8 169.2 122.4 138.5 Qatrana Cement Company -- -- 63.8 133.4 El-Hasa Phosphate 50.6 42.4 43.2 39.6 Sheidiyah Phosphate 69.5 65.4 49.0 42.9 Potash Co. 390.7 337.1 326.5 378.6 Fertilizer Company 102.1 96.8 85.9 90.2 Indo-Jordan Chemicals Company 36.4 38.3 42.0 46.3 Indo-Jordan Fertilizer Company -- -- -- 60.5 AAEPCO (IPP3) -- -- -- 5.0 AES Levant (IPP4) -- -- -- 1.2
5.Queen Alia Airport 61.9 76.2 69.7 66.8 6.Haraneh 0.6 0.5 0.2 0.8 7.Others 0.1 0.1 0.1 0.2 Total Consumption 13534.9 14276.7 14564.4 15419.2
Source: NEPCO Annual Report (2014)
In spite of increase or decrease in annual electricity consumption of each company, electricity consumption totally increases. Therefore, there is much significant value to promote energy-saving measures for such large consumers. The energy audit system for these large consumers is planning, and the following two categories are suggested as additional energy saving measures.
a) Appointment of an energy manager(s) (provisional title)
In Japan, business facilities and factories energy consumption of which is more than the designated amount are obliged to appoint an energy manager(s) or an energy managing staff. Furthermore, well-planned and voluntary energy management is thoroughly implemented by periodical report on the situation of energy consumption and preparation and submission of a medium- to long- term energy saving plan to achieve planned energy-saving target. The energy management system is adopted in other countries such as China, Thailand and India aside from Japan.
In Jordan, as previously mentioned, there is a CEM system targeted at engineers of small and medium-

8-20
sized enterprises, and energy managers are fostered. But it is only the qualification system, and there is no energy manager system under which a concrete target value of improving energy-efficiency is set, preparation and submission of a medium- to long- term energy saving plan to achieve planned energy-saving target, and a periodical report on the situation of energy consumption are implemented, these are the same in Japan and other Asian countries. The approaches to energy saving are left to voluntary efforts by each company, and the framework of administrative control of checking the energy-saving situation and as-needed direction or guidance has not been introduced.
JICA study team proposes the appointment of an energy manager(s) (provisional title) who play(s) an important role in promoting energy-saving in each site in order to implement energy management thoroughly. The effort such as the participation in energy management training courses helps the human resource development for prospective energy manager(s).
b) Energy-saving tips in cement production process
Cement industry is a typical energy-intensive industry with high proportion of energy costs to total production costs. As for energy-saving measures of the cement industry in Japan, for the first time in the world of the cement industry, it has been addressed as a top priority. Japanese cement industry has performed the development and introduction of a variety of new technology so far, the results have been carried out a thorough energy efficiency improvement measures even in the existing facilities, energy efficiency of Japan is the top class in the world. Therefore, in order to promote energy efficiency of the cement industry, which has become a large-
scale customer in Jordan, energy-saving measures efforts of which are being carried out in Japan are introduced.
In the cement production step, there are three processes, the energy of both heat and electricity is consumed in each process.
1) Raw Materials Process: Drying, grinding and mixing raw materials 2) Burning Process: Producing intermediate product, clinker by firing raw materials 3) Finishing Process: Adding gypsum into clinker and finishing cement products by
grinding them
Energy-saving measures in cement production process have been promoted in two aspects; 1) Introduction of productive equipment with high energy-saving performance, 2) efficient use of heat energy by using exhaust heat collection and recovery system.
Table 8.3-4 shows examples of productive equipment with high energy-saving performance introduced in cement production process.

8-21
Table 8.3-4 Examples of productive equipment with high energy-saving performance introduced in cement production process
Process productive equipment with high energy-saving performance
Usage Effect of energy-saving
Raw material process
Vertical roller mills for raw materials
Grinding raw materials (lime stone and clay)
Electric energy consumption can be reduced approximately 30% as compared with ball mill.
Burning process
Vertical roller mills for coal
Grinding coal used as fuel to fine powder so that the burning efficiency should be improved.
Electric energy consumption can be reduced 20 to 25% as compared with ball mill.
Air beam type clinker cooler Cooling clinker after burning Electric energy consumption can be reduced by approximately 0.5 to 1.5 kWh / t-clinker as compared conventional air chamber type.
Finishing process
Pre-grinding roller mill systems
Roughly crushing cement into smaller pieces before grinding
Electric energy consumption can be reduced 10 to 20%.
Vertical roller mills for grinding of blast furnace slag.
Grinding cement Electric energy consumption can be reduced by approximately 40 kWh / t-cement.
Upgrading of separators of ball mill
Improved mechanism of the apparatus for separating mass and particles of cement
Electric energy consumption can be reduced 10 to 20%.
Source: Extraction from materials of Japan Cement Association (JCA)
In addition, the effective measures of energy-saving in the cement production process is the recovery and reuse of thermal energy generated in large amount.The waste heat is recovered in the production process, and is reused in the raw material preheating and drying process, in preheating coal process. And part of recycled heat is used for private power generation and is used for supply of heat to the area. As a result, the effective utilization rate of heat in the cement production process has reached more than 80%.

8-22
(3) Electricity-saving measures for public facilities or street lights
o Public facilities
It is said that air conditioning accounts for approximately 28%, lighting 40%, and other equipment /outlets 32% of total electricity consumption of office buildings in Japan. According to the electricity demand curve in Jordan, the electricity demand for cooling in summer season in Jordan seems to be not as high as in Japan. However, much electricity is consumed for heating and cooling demand, lights and so on in Jordan, the electricity saving methods (examples) in buildings of public facilities such as schools, libraries, hospitals and social welfare facilities are proposed.
As is the case in large-scale factories, introduction of energy management system for large-scale buildings is effective to promote energy-saving measures. The energy management system enables 1) Grasping status of energy use, 2) Formulation of energy management policy, 3) Setting management standard on each facility, 4) Preparation of middle and long term plan for energy management and 5) Evaluation and improvement of the situation of energy management.
Furthermore, it is proposed that a Building Energy Management System (hereinafter referred to as “BEMS”) be introduced into a public facility building that supervises and controls power distribution equipment, air conditioning equipment, lighting equipment, ventilation equipment and office automation equipment etc. on a real-time basis. BEMS enables following activities;
1) The situation of electricity consumption of the whole building is visualized on a real-time basis.
2) The control (on-off control, or increasing/ decreasing output control) of each electric apparatus becomes possible
3) A certain amount of electricity consumption can be shifted from electricity peak-demand time by adjusting operation time zone of each electric apparatus.
o Street lights
The installation of light reflection materials to utilize light effectively without waste, LED lighting with photovoltaic generation system under which power is generated and stored in daytime and used in nighttime, and so on can be conceivable as the electricity saving measures for street lights, besides the introduction of high energy-efficient lighting apparatuses (ex. replacement of mercury lamps with high-pressure sodium lamps, introduction of automatic lighting devices) that are listed in NEEAP.

8-23
Table 8.3-5 Examples of electricity-saving methods in public facilities (buildings) Category Electricity-saving methods Explanation
Air conditioning
Control of operating hours and preset cooling and heating temperature
Control of preset cooling and heating temperature (ex. Preset temperature in cooling is uniformly 28 degree centigrade.)
Thorough control of operating hours (ex. Switching on an air conditioner immediately before
the facility is opened, and switching off an air conditioner immediately after the facility is closed.)
Introduction of night purge ventilation system
Since the difference between air temperature in daytime and in nighttime in summer season is large in Jordan15, it seems to be possible to reduce electricity consumption necessary for cooling in daytime by taking in cooler air from outside during nighttime by means of night purge ventilation16.
Shielding of solar radiation by using window blind equipment
The heat load caused by entering of solar radiation can be effectively restrained by shielding solar radiation by using blind or heat shielding films.
Periodical cleaning of a filter or an air supply and exhaust opening structure of air conditioning equipment
Reducing power consumption by improving an aeration property
Replacement of air conditioning equipment with one that has higher energy-saving performance
Reducing power consumption
Lighting
Turning off unnecessary lighting apparatuses
Turning off the lights at a place where there is no person
Non-use of lighting apparatuses at a place where sunlight can be collected sufficiently in daytime
Taking measures such as lowering the luminance of lights or curtailing the number of use of lights in case that it is too bright in a room
Reducing the number of lights by removing lamps, turning off a light in case of too excessive lighting situation
Reducing energy consumption
Turning off lighting apparatuses outside the utilization time or in lunch break
Diligently turning off electricity outside the utilization time or in lunch break
Replacement of existing lighting devices with high efficiency lighting devices
Replacement of existing apparatuses with LED lamps or CFL lamps with high efficiency
Replacement of a lighting apparatus in multi-purpose area with light-controllable type
Reducing power consumption by controlling amount of light depending on the situation
Inverter-type ballast (electronic ballast) for lighting devices
The electricity consumption of a conventional ballast tends to increase after used more than 10 years, whereas the electricity consumption of an electric ballast hardly increases by virtue of using an inverter circuit.
Periodical cleaning of a lighting apparatus
Improving degree of reflection and transmission factor
15 For example in summer season in Amman, air temperature in daytime can reach about 35 degree centigrade, but go down to about 20
degree centigrade in nighttime even in such a day. In this case, the defference comes to about 15 degree centigrade. 16 In hot season when cooling is necessary, In case that night-time outside air temperature is less than preset cooling temperature inside a
building in daytime, cooling load in the next day can be reduced by night-time building ventilation by taking in nighttime outside air into the building and exhausting heated air to outside. The system is called “night purge” (outside air cooling), and one of the effective measures for energy-saving.
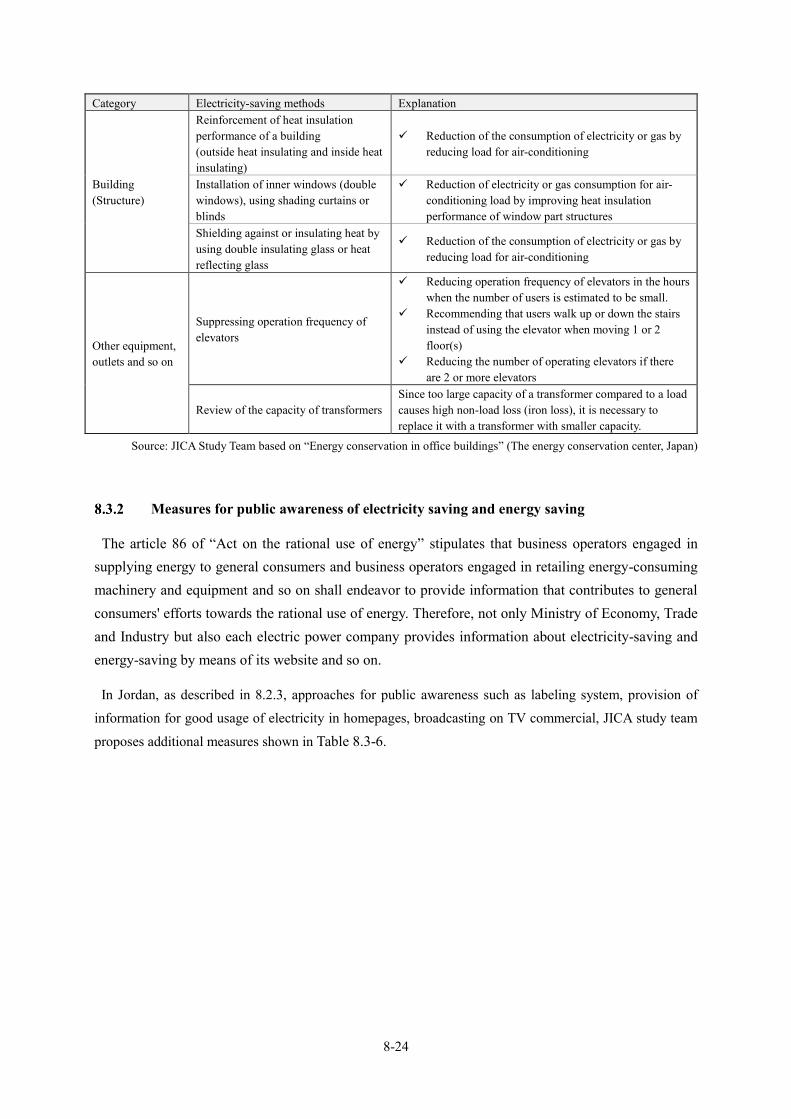
8-24
Category Electricity-saving methods Explanation
Building (Structure)
Reinforcement of heat insulation performance of a building (outside heat insulating and inside heat insulating)
Reduction of the consumption of electricity or gas by reducing load for air-conditioning
Installation of inner windows (double windows), using shading curtains or blinds
Reduction of electricity or gas consumption for air-conditioning load by improving heat insulation performance of window part structures
Shielding against or insulating heat by using double insulating glass or heat reflecting glass
Reduction of the consumption of electricity or gas by reducing load for air-conditioning
Other equipment, outlets and so on
Suppressing operation frequency of elevators
Reducing operation frequency of elevators in the hours when the number of users is estimated to be small.
Recommending that users walk up or down the stairs instead of using the elevator when moving 1 or 2 floor(s)
Reducing the number of operating elevators if there are 2 or more elevators
Review of the capacity of transformers Since too large capacity of a transformer compared to a load causes high non-load loss (iron loss), it is necessary to replace it with a transformer with smaller capacity.
Source: JICA Study Team based on “Energy conservation in office buildings” (The energy conservation center, Japan)
Measures for public awareness of electricity saving and energy saving
The article 86 of “Act on the rational use of energy” stipulates that business operators engaged in supplying energy to general consumers and business operators engaged in retailing energy-consuming machinery and equipment and so on shall endeavor to provide information that contributes to general consumers' efforts towards the rational use of energy. Therefore, not only Ministry of Economy, Trade and Industry but also each electric power company provides information about electricity-saving and energy-saving by means of its website and so on.
In Jordan, as described in 8.2.3, approaches for public awareness such as labeling system, provision of
information for good usage of electricity in homepages, broadcasting on TV commercial, JICA study team
proposes additional measures shown in Table 8.3-6.

8-25
Table 8.3-6 Proposal concerning activities for public awareness of electricity-saving and energy-saving
Item Contents
PR activity for requesting electricity-saving in heavy loading season
In the heavy load season when the reserve rate showing the reserve power supply capacity available for the power demand may become urgency level,PR activity for requesting electricity-saving shall be implemented by means of the website of each electric power company, TV commercial, newspaper advertisement and so on.
Provision of information about realtime electricity supply-demand situation
In the same manner as each electric power company in Japan, electric power companies or other organizations in Jordan shall provide realtime information about electricity supply-demand situation (power demand, power supply capacity, power reserve rate and so on) by means of the website in order to gain general users’ understanding of the necessity of electricity-saving.
Appeal for reducing standby electricity consumption
In addition to introducing energy saving method for each home apparatus, electric power companies or other organizations in Jordan shall appeal for reducing standby electricity consumption by the effort such as unplugging electric equipment that is not being used.
Provision of information about electricity tariff or past electricity consumption records to each customer
The information about electricity tariff and past electricity consumption records is put into database and provided to each customer after executing an authentication for identification by the website so that customer can consult these pieces of information prior to their voluntary efforts toward electricity-saving or energy-saving.
And calculation tools shall be provided so that each customer can easily calculate the electricity tariff reduction effect in case that he or she takes energy-saving measures.
For example, CEPCO provides online membership service named “KatEne” with general households. In “KatEne”, CEPCO develops the service to give members information about monthly power consumption and tariff amount, and advice for power saving and suitable tariff menu. In Jordan, if a power distribution company makes similar efforts, general power users’ consciousness of the need to save electricity can be raised. (Refer to Figure 8.3-1)
Promotion of energy-saving education
It is important to have given nations an education since they are children to establish consciousness of electricity-saving or energy-saving on their lifestyle. Therefore special emphasis shall be given to public awareness activities in school education, and energy-saving education shall be forcefully advanced.
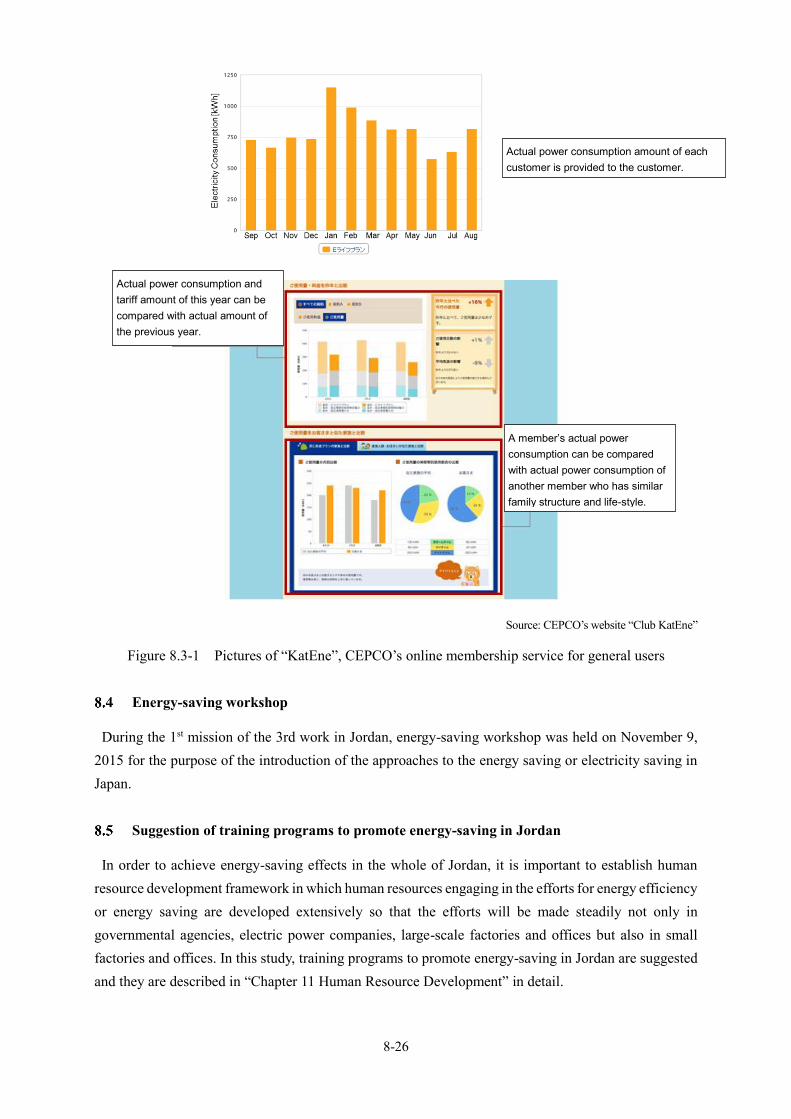
8-26
Source: CEPCO’s website “Club KatEne”
Figure 8.3-1 Pictures of “KatEne”, CEPCO’s online membership service for general users
Energy-saving workshop
During the 1st mission of the 3rd work in Jordan, energy-saving workshop was held on November 9, 2015 for the purpose of the introduction of the approaches to the energy saving or electricity saving in Japan.
Suggestion of training programs to promote energy-saving in Jordan
In order to achieve energy-saving effects in the whole of Jordan, it is important to establish human resource development framework in which human resources engaging in the efforts for energy efficiency or energy saving are developed extensively so that the efforts will be made steadily not only in governmental agencies, electric power companies, large-scale factories and offices but also in small factories and offices. In this study, training programs to promote energy-saving in Jordan are suggested and they are described in “Chapter 11 Human Resource Development” in detail.
Actual power consumption amount of each customer is provided to the customer.
Actual power consumption and tariff amount of this year can be compared with actual amount of the previous year.
A member’s actual power consumption can be compared with actual power consumption of another member who has similar family structure and life-style.

9-1
Environmental and Social Considerations
Legislative and Institutional Framework of Environmental and Social Considerations in Jordan
*Descriptions in 9.1 were prepared by referring to relevant laws and regulations, and documents disclosed including following
reports:
-Ministry of Environment (2009): State of Environment Report 2009
-World Bank (2011.4): Red Sea-Dead Sea Water Conveyance Study Environmental and Social Assessment, Preliminary Draft
Environmental and Social Assessment (ESA) – Main Report.
-World Bank (2014.1): Hashemite Kingdom of Jordan - Emergency Services and Social Resilience Project (JESSRP)
Environmental Policy
In Jordan, planning and policy formulation prior to the 1990s were based on sector-specific approaches with little consideration for environmental concerns. It can be stated that environmental planning and policy formulation came to age in 1992, when the National Environmental Strategy (NES) was formulated by the Ministry of Municipalities, Rural Affairs and the Environment with support of IUCN and USAID.
The NES was the first environmental strategy in Jordan and in the Arab region. Based on the NES, Jordan was in a good political and strategic position to sign and then ratify the Convention on Biological Diversity (CBD) and the UN Framework Convention on Climate Change (UNFCCC) in 1992 during the Earth Summit. Two years later, Jordan signed and then ratified the UN Convention to Combat Desertification (UNCCD) in 1996.
The National Environmental Action Plan (NEAP) was also prepared in a national consultation process coordinated by the Ministry of Planning and it included a prioritized action plan based on results. The NEAP provided a comprehensive assessment of environmental problems and remediation opportunities in Jordan, combined with a prioritized and phased plan of action for addressing the issues.
National Agenda 21 was prepared in 2002 under the supervision of the General Corporation for Environment Protection (Currently MoEnv) and the assistance of UNDP. The Agenda called for promoting the participatory approach at all levels to ensure success and sustainability. The Agenda also reflected the integrated approach to environment and development and converged with objectives of poverty alleviation and sustainable human development.
In 2006 National Agenda (2006 -2015) was also formulated comprising a comprehensive political and socio-economic reform plan for the country until 2015. The National Agenda contained a special section on environmental sustainability including the arid and desertified zones. At the same time, it aimed to enhance environmental integration into other sectors.
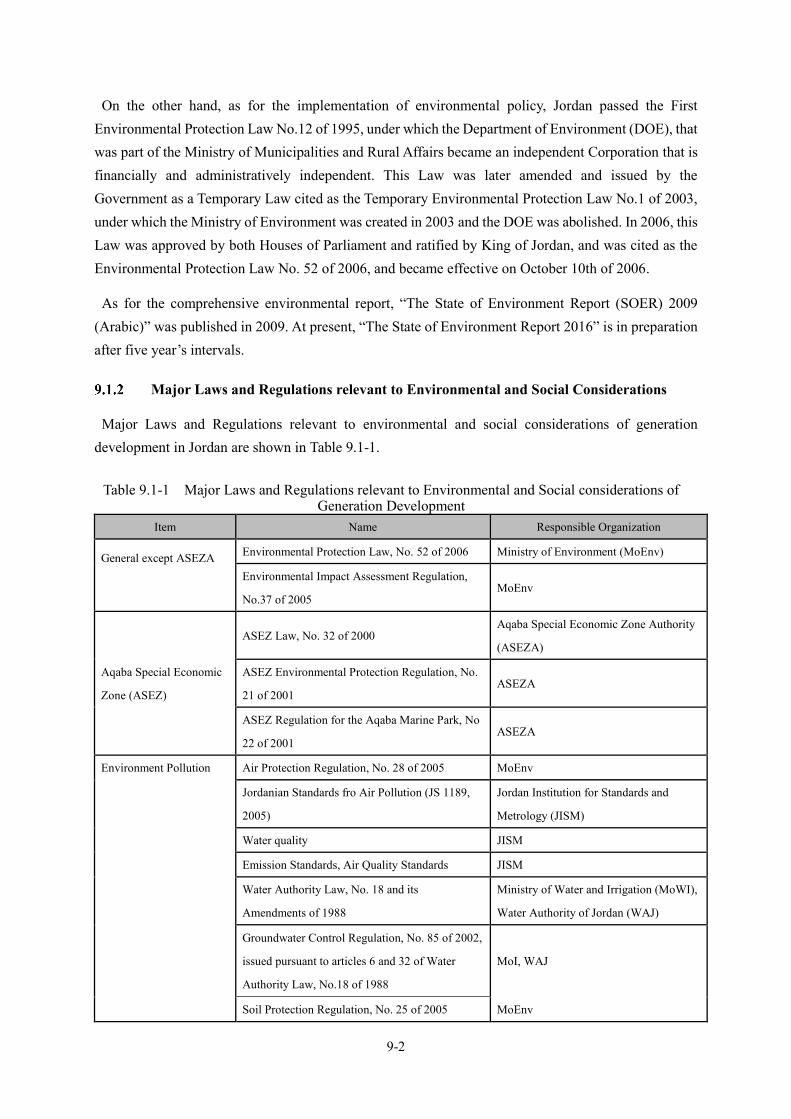
9-2
On the other hand, as for the implementation of environmental policy, Jordan passed the First Environmental Protection Law No.12 of 1995, under which the Department of Environment (DOE), that was part of the Ministry of Municipalities and Rural Affairs became an independent Corporation that is financially and administratively independent. This Law was later amended and issued by the Government as a Temporary Law cited as the Temporary Environmental Protection Law No.1 of 2003, under which the Ministry of Environment was created in 2003 and the DOE was abolished. In 2006, this Law was approved by both Houses of Parliament and ratified by King of Jordan, and was cited as the Environmental Protection Law No. 52 of 2006, and became effective on October 10th of 2006.
As for the comprehensive environmental report, “The State of Environment Report (SOER) 2009 (Arabic)” was published in 2009. At present, “The State of Environment Report 2016” is in preparation after five year’s intervals.
Major Laws and Regulations relevant to Environmental and Social Considerations
Major Laws and Regulations relevant to environmental and social considerations of generation development in Jordan are shown in Table 9.1-1.
Table 9.1-1 Major Laws and Regulations relevant to Environmental and Social considerations of Generation Development
Item Name Responsible Organization
General except ASEZA
Environmental Protection Law, No. 52 of 2006 Ministry of Environment (MoEnv)
Environmental Impact Assessment Regulation,
No.37 of 2005 MoEnv
Aqaba Special Economic
Zone (ASEZ)
ASEZ Law, No. 32 of 2000 Aqaba Special Economic Zone Authority
(ASEZA)
ASEZ Environmental Protection Regulation, No.
21 of 2001 ASEZA
ASEZ Regulation for the Aqaba Marine Park, No
22 of 2001 ASEZA
Environment Pollution Air Protection Regulation, No. 28 of 2005 MoEnv
Jordanian Standards fro Air Pollution (JS 1189,
2005)
Jordan Institution for Standards and
Metrology (JISM)
Water quality JISM
Emission Standards, Air Quality Standards JISM
Water Authority Law, No. 18 and its
Amendments of 1988
Ministry of Water and Irrigation (MoWI),
Water Authority of Jordan (WAJ)
Groundwater Control Regulation, No. 85 of 2002,
issued pursuant to articles 6 and 32 of Water
Authority Law, No.18 of 1988
MoI, WAJ
Soil Protection Regulation, No. 25 of 2005 MoEnv

9-3
Item Name Responsible Organization
Noise Level Control Regulation, 2003 JISM
Regulation concerning Solid Waste Management,
No. 27 of 2005 MoEnv
Regulation of Harmful and Hazardous Waste
Management, Transfer and Handling, No. 54 of
2002 and No.47 of 2008
MoEnv
Global warming/climate
change
Regulation of Control of the Use of Ozone
Depleting Materials 2003 MoEnv
Land use The Zoning of Cities and Villages Law, No. 79 of
1966 MoMA
Land
Acquisition/Resettlement
Land Acquisition Law (LAL) 1987 (Decree (12)
of 1987)
Department of Lands and Surveys (DLS),
Ministry of Finance (MoF)
Cultural property and
heritage
The Antiquities Law, No. 21 of 1988, as amended
by Law No.23, 2004
Ministry of Tourism and Antiquities
(MoTA), Department of Antiquities
Protection of Sensitive
Areas and Endangered
Species
The Natural Reserves & National Parks
Regulation, No. 29 of 2005 MoEnv, Council of Ministers
Marine Environment and Coastal Protection
Regulation, No.23 of 2003 MoEnv
Agricultural Law, No.44 of 2002 and Regulation
of Categorizing Birds and Animals Banded from
Hunting, No.43 of 2008
MoEnv
Public Health Public Health Law, No. 47 of 2008 Ministry of Health (MoH)
Working Condition
Labor Law, No.8 of 1996 Ministry of Labor (MoL), MoH
Protection and Safety from Industrial Tools and
Machines and Work Sites No.43of 1998 MoH
Regional Development
Control
ASEZ Law No. 32 of the year 2000 ASEZA
ASEZ Environmental Protection Regulation No.
21 of 2001 Development Zone Authority (DZA)
ASEZ Regulation for the Aqaba Marine Park, No
22 of 2001 Joint Service Councils (JSCs)
Jordan Valley Development Law No. 19/1988
and its Amendments in 2001 Jordan Valley Authority (JVA)
Hazard/Risks/Accidents
The Protection of the Environment from Pollution
in Emergency Situations Regulation No. (26) of
2005
MoEnv
Water resources Water Authority Law No. 18 and its Amendments
of 1988 MoWI, WAJ

9-4
Item Name Responsible Organization
Groundwater Control Regulation No. 85, 2002,
issued pursuant to articles 6 and 32 of Water
Authority Law, No.18 of 1988
MoWI, WAJ
Energy and mineral
resources
Mining Regulation, No.131 of 1966 Natural Resources Authority (NRA)
Regulation of Natural Resources Affairs, No.12
of 1966 NRA
General Electricity Law, No.64 of 2002
Electricity Regulatory Commission
(ERC), Ministry of Energy and Mineral
Resources (MEMR)
Renewable Energy and Energy Efficiency Law,
No.13 of 2012 ERC, MEMR
Infrastructure and
Industry
Transport Law, No.89 of 2003
National Construction Law, No.7 of 1993
Housing Corporation Law, No.27 of 1968
Municipalities Law, No.29 of 1955
Law of the Housing and Urban Development
Agriculture Law, No. 44 of 2002 Ministry of Agriculture (MoA)
Crafts and Industry Laws, No. 16 of 1953
Civil Defense Law, No.18 of 1999
International / Bilateral
Conventions, Treaties and
Agreements
Refer to 9.1.7. MoPI, MoEnv
Nuclear Energy Radiation Protection, Nuclear Safety and Security
Law No. 43 of 2007 Nuclear Energy Commission
Source: JICA Study Team
Environmental Conservation Laws and Regulations
(1) The Environmental Protection Law (EPL), No. 52, 2006
The EPL is the highest level framework for environmental protection and grants the MoEnv its strong mandate as the responsible body for protecting the environment.
The EPL was enacted as first environmental protection law in 1995, under which the Department of Environment (DOE), that was part of the Ministry of Municipalities and Rural Affairs.
Major provisions are as follows:

9-5
Article 2: Definition of Terms and Acronyms
-Basic concepts such as environment, pollution, environmental protection, and sustainable development, technical were defined.
Article 3 to 5: Role and function of MoEnv as the competent party to protect environment
-The ministry is deemed the competent party to protect the environment in the Kingdom and the official and public bodies shall execute the instructions and decisions issued by virtue of the law and the regulations issued by virtue thereof, at the risk of legal liability as provided for herein and in any other legislation.
-For the purpose of achieving the goals of environmental protection and the improvement of its various elements in a sustainable manner the Ministry, in cooperation and coordination with the competent parties, shall carry out the following duties
Article 6: Prohibition of hazardous wastes
-Hazardous waste is not permitted to be entered into Jordan.
Article 7: Assigns the MoEnv with the environmental monitoring and inspection responsibilities, and grants its employees the right to enter any facility for inspection needs
-The specialized officer named by the minister in writing upon the recommendation of the secretary general shall be granted police powers and he or she may enter any place to ensure its compliance and the compliance of its activities with the standard environmental conditions.
Article 8: Prohibition of marine and coastal water pollution
-Subject to the provisions of any other legislation, it is forbidden at the risk of legal liability to discharge any material polluting or harmful to the marine environment in the territorial waters of the kingdom or on the beach within the boundaries and distances set by the minister
Article 11: Handling and disposal of harmful materials
-It is forbidden to dump, dispose of, or collect any materials harmful to the environment, whether such materials are solid, liquid, gaseous, radioactive or thermal, in the sources of water and the proximity of water sources
Article 13: Requirements for conducting Environmental Impact Assessment for projects.
-Every corporation or company or establishment or any entity established after the coming into force of this law and which conducts activities that negatively impact the environment is obligated to prepare an environmental impact assessment report for its projects and submit such report to the ministry to take the appropriate decision in its regard.
9-6
Article 15: Establishment of a Consultative Committee
-The council of ministers, upon the recommendation of the minister, may form a consultative committee on which are represented those entities concerned with the environment, provided that its members have competence and expertise. The number of members and the appointment of the chairman of the committee, as well as its duties and powers, and all other matters relating to that committee shall be defined by instructions issued for that purpose.
Article 16-17: Establishment of Environmental Protection Fund
-There shall be established at the ministry a fund referred to as the environment protection fund, from which money shall be spent on protecting the environment and its elements within the aims of achieving the goals and objects set forth in this Law and the regulations issued by virtue thereof
Article 18: Violation and punishment in the Protected Areas
-Any person who violates the provisions of the regulations and instructions related to environmental protection in natural reserves and national parks shall be punishable.
Article 19: Obligation of necessary measures to prevent environmental pollution
-The owners of factories or vehicles or workshops or any entity that conducts activities with a negative impact on the environment and emits environmental pollutants must install equipment or take the necessary measures to prevent or reduce the emission of such pollutants therefrom, and to control such pollutants before emission from such factories or vehicles into the air to within the limits permitted based on the set standards.
Article 22 to 24: Delegation of duties and powers to other organizations
-The ministry, upon the approval of the council of ministers, may delegate any of its duties and powers to any ministries, corporation or volunteer organizations concerned with the field of environmental protection, provided that such delegation shall be specific and in writing. The licensing and the renewal of the licensing of non-governmental organizations operating in the field of environmental protection shall be carried out by the competent authorities after obtaining prior approval from the ministry, in accordance with instructions issued by the minister for that purpose.
Article 25: To mandate MoEnv to issue a number of bylaws
-The council of ministers shall issue the regulations necessary for the execution of the provisions of this law, including the following regulations as shown in Table 9.1-2.

9-7
Table 9.1-2 Regulations necessary for the Execution of the EPL 1 Nature Protection Regulations.
2 Environment Protection from Pollution in Emergency Situations
Regulations.
3 Water Protection Regulations.
4 Air Protection Regulations.
5 Marine Environment and Coastal Protection Regulations.
6 Natural Reserves and National Parks Regulations
7 Management, Transport and Handling of Harmful and Hazardous
Materials Regulations.
8 Management of Solid Waste Regulations.
9 Environmental Impact Assessment Regulations.
10 Soil Protection Regulations.
11 Charges and Wages Regulations.
12 Environmental Protection Fund Regulations.
Source: EPL No. (52) of 2006
Environmental Impact Assessment Regulations (EIAR)
Based on the Article 23 of the EPL (2003 amended version), Environmental Impact Assessment Regulations (EIAR) of 2005 (By-law No.37 of 2005) was enacted in March of 2005. The EIAR is composed of 21 articles and 5 Annexes.
(1) Outline of the EIAR
Outline of the EIAR are described below in order of the main articles
Article 2: Terms and Expressions
-Definitions and meanings such as Technical Committee, Environmental Approval, Significant impact, Terms of Reference (TOR) and EIA document.
Article 3 Purpose and Meaning of EIA
-The EIA means any procedure that aims to identify the impact of all the phases of the establishment of a certain project, and describe and study this impact on the project and its impact from the social and economic aspects, and identify the methods for limiting any adverse impact on the Environment. The assessment shall be conducted during the preparation of the economic feasibility study, and planning, design, implementation, operation and removal of the project.
Article 4: Necessity of Environmental Approval prior to Project Implementation
-No industrial, agricultural, commercial, housing or tourism project or any construction development project or any of the projects specified in Annexes 2 and 3 of these Regulations may commence

9-8
operations with the services relevant thereto, until it obtains the Environmental Approval required for this purpose from the Ministry.
-Annex 2 and 3 of the EIAR are shown in Table 9.1-3 and 9.1-4.
-The Ministry, upon the recommendation of the Secretary General, may require the owner of the project not from among those specified in Annexes 2 and 3 of these Regulations to conduct an environmental impact assessment study based on the nature or location of the project, or the nature of the impact that may result therefrom.
Table 9.1-3 Projects, which need an comprehensive EIA (full EIA) study (Annex 2) 1 Raw petroleum refining.
2 Electricity generating plants.
3 An establishment designed as permanent stores or as landfills for the irradiant nuclear wastes.
4 Iron and steel factories.
5 Establishments for extracting, treatment, conversion the asbestos and the substances which
asbestos part of its structure.
6
Integrated chemical industries such as:
1) Petrochemicals.
2) Fertilizers, pesticides and peroxides industries.
3) Chemical products, petrochemicals and petroleum storage facilities.
7 Roads, airports and rails constructing projects.
8 Hazardous wastes treatment plants and disposal from these wastes.
9 Establishing the industrial cities.
10
Extraction industries
1) The excavating processes for water and the geo- thermal digging except the digging for
investigating the soil.
2) Mining processes and relevant industries.
3) Natural fortunes extraction.
11
Generating energy industries.
1) The industrial establishments producing electricity, vapor, hot water.
2) The industrial establishments conveying gas, vapor, hot water and electrical energy.
3) Natural gas surface storage.
4) Flammable gases storage underground surface.
5) Fossil fuels surface storage.
12 Tanning (leathers) factories.
13 Sugar factories.
14 Yeast factories.
15 Building up Marine ports.
16 Establishing ships and boats for industrial and recreational purposes.

9-9
17 Sea dumping for using the land in industrial and recreational uses.
18 Glass factories.
19 Establishing slaughterhouses (abattoirs).
Source: Annex (2), EIA Regulation No. (37) of 2005
Table 9.1-4 Projects, which need an preliminary EIA (Initial Environmental Examination, IEE) study (Annex 3)
1
Agriculture Projects:
1) Poultry Farms if the capacity exceeds 30.000 poultries,
2) Cows Farms if the capacity exceeds 50.000 cows.
3) Sheep Farms if the capacity exceeds 1.000 sheep.
2
Minerals treatment projects:
1) Iron and steel works including galvanizing, varnish factories.
2) Establishments producing non-irony minerals including production, purification (washing),
liquefying, demonetizing (pulling) and galvanizing processes.
3) Compressing Bullions.
4) Treatment of minerals surfaces and covering (coating).
5) Boilers, cisterns, tanks, industrialized from minerals plates.
6) Establishments for felting and scorching (roasting). Raw minerals
7) Complexes industry and aligning (collecting).
3
Food Industries:
1) Oils, animal and vegetarian fats.
2) Bottling, Packaging the animal and vegetarian products.
3) Milk products industry.
4 Fabric, leather, wood, papers and tissues industries.
5 Rubber industry.
6 Infrastructure projects including housing projects.
7
Other projects:
1) Municipal landfills
2) Landfill for disposal from junk.
3) Sports activities centers.
4) Junk storage establishments.
8 Any additions, amendments on the projects that mentioned in this annex
Source: Annex (3), EIA Regulation No. (37) of 2005
-Projects relevant to electric power generation correspond to List No. 2, 10 and 11in Table 9.1-3, which are required for a full EIA study.
Article 5 Role and Function of the Technical Committee
-A technical committee shall be formed at the ministry, chaired by the secretary general, and the

9-10
membership of experienced and specialized persons from the ministries and entities as shown in Table 9.1-5.
Table 9.1-5 Members of the Technical Committee 1 Ministry of the Environment
2 Ministry of Planning and International Cooperation
3 Ministry of Municipal Affairs
4 Ministry of Health
5 Ministry of Agriculture
6 Ministry of Industry and Trade
7 Ministry of Energy and Mineral Resources
8 Ministry of Water and Irrigation
9 Ministry of Tourism and Antiquities
10 Ministry of Public Works and Housing
11 Any other concerned entity specified by the Minister
Source: EIA Regulation No. (37) of 2005
Article 8 to 20: Descriptions of Processes for Environmental Approval
-From article 8 to 20 following processes are provided: submission of application of the project proposal to MoEnv, categorization of the project by site survey, reviewing and screening by MoEnv, conducting necessary EIA study and preparing EIA document by registered EIA consultants, submission the EIA document to MoEnv, reviewing the document by the technical committee, and determination to issue environmental approval.
(2) Processes of Obtaining the Environmental Approval
(i) Submission of the Project Brief to MoEnv
The project proponent (project owner) should submit an application of the project brief with general
information (Annex 1) described below to MoEnv
Project description - Nature of project including land use, production processes, expected quality and
quantity of wastes processes, and emissions, number of employees, vehicles and equipment
Project alternatives - Alternatives including design, location and the used techniques
Anticipated most important environmental impacts – public health, infrastructure, flora, fauna, soil,
water, air, weather parameters, natural aspects and the ancient monument and the interrelationships
between these aspects

9-11
(ii) Categorization of the Projects (Article 8)
Based on the project brief submitted by the proponent, MoEnv conducts screening and secretary general
categorize of the project through the discussion by the technical committee as follows:.
-Category 1: A comprehensive environmental impact assessment (full EIA) is required for the projects
referred to in Annex 2 (Table 9.1-3) or the projects based on a determination by the MoEnv that significant
impacts are anticipated after preliminary EIA (IEE) was conducted.
-Category 2: A preliminary environmental impact assessment (IEE) is required for the projects referred to in
Annex 3 of EIAR (Table 9.1-4).
-Category 3: Neither an IEE nor a full EIA is required.
(iii) Obtaining the Site Approval
On the other hand, based on the project brief, MoEnv conducts the survey and data collection on proposed site. If the site is appropriate, the Ministry should issue “Site Approval” to the proponent (See Figure 9.1-1).
Source: JICA Study Team based on EIA Regulation No.37 of 2005
Figure 9.1-1 Procedures of Site Approval in Jordan according to the EIAR
(Disapproval)
Note: Proponent
Project Plan of S ite Use
Ministry of Environment(MoEnv)
Site Visit (MoEnv)
Licensing Committee
EIA Required Approval Disapproval
Projects need to change ofexisting land use
EIA TechnicalCommittee
Higher Court of Zoning
EIA Classification Approval
Site License
Ministry of Environment

9-12
(iv) Full EIA and Environmental Approval (Article 9 to 10)
If a project is classified as category 1, the ministry shall advise the proponent in writing, requesting him to conduct a full EIA for the project. Then, the proponent shall submit a preliminary draft of the Terms of Reference (TOR) for the full EIA study to the ministry and explain to concerned stakeholders, if required.
The technical committee shall review the TOR and recommend to the minister to issue the appropriate decision for conducting a full EIA study.
Procedures for the EIA Approval is shown in Figure 9.1-2.
Source: JICA Study Team based on EIA Regulation No.37 of 2005
Figure 9.1-2 Procedures for the EIA Approval
(After obtaining Site Approval)
Approval
Note: Proponent
Review & Comments
Decision by Director General
EIA Approval
Ministry of Environment
No IEE/EIA required
IEE Report Preparation of Scoping/TOR
Review & Comments
Conduct EIA study
IEE Required
Draft EIA Report
Preparation of SFA(Special Form of Application)
Ministry of Environment
EIA Technical Committee
Review & Screening
Full EIA required

9-13
(v) Conducting comprehensive (full) EIA Study (Article 10)
A full EIA study should be conducted by EIA consultants, who have certification from MoEnv, onbehalf of the proponents. After the EIA study, the proponent should submit the draft EIA document to MoEnv. The EIA document should include items of contents shown in Annex 5 (Table 9.1-6) at least.
Table 9.1-6 Contents of EIA Documents (In general) Contents
1 Non-Technical summary including two versions of Arabic and English
2 Policy, legal and administrative framework
3 Project description
4 Environmental baseline data
5 Analysis of alternatives
6 Identification and evaluation of anticipated environmental impacts
7 Mitigation measures and environmental management plan
8 Environmental monitoring and post auditing plan
10 Appendices
Source: Annex (5), EIA Regulation No. (37) of 2005
(vi) Review and Decision of Issuing Environmental Approval (Article 11)
The technical committee shall review and analyze the draft EIA document and if the document fulfills all of the requirements of the provisions of these regulations, the minister shall issue environmental approval.
(vii) IEE and Environmental Approval (Article 13)
If the project is classified as category 2, the MoEnv shall request the proponent to conduct an IEE of the project. If the result of IEE reveals that the project has a potential significant impact, the proponent is requested to conduct a full EIA. If the result reveals that it is not likely for the project to have a significant impact, the proponent shall obtain the environmental approval.
(viii) Category 3 Projects (Article 14)
If the project is classified as category 3, the ministry shall inform the proponent that his project does not require an IEE or a full EIA, and the project is considered to be issued the environmental approval.

9-14
(ix) Implementation of Environmental Management Plan (EMP) and Environmental Monitoring Plan (EMoP) (Article 16)
After the EIA approval, the proponent is required to implement the EMP and EMoP and to report to MoEnv periodically.
The MoEnv shall regularly monitor the extent of the compliance of the project owner with all the conditions and requirements stipulated in the environmental approval during any of the activities of the project including its implementation, operation, and disassembling.
(3) Regulation of Strategic Environmental Assessment
In Jordan, as described above for environmental impact assessment (EIA) regulation and institutional arrangement for environmental impact assessment (EIA) have been established. However, those for Strategic Environmental Assessment (SEA) have yet been established, although there are found some SEA reports in case of funding by international donors such as World Bank.
An effort to incorporate SEA into legislation scheme was done by cooperation between MoEnv and EU in 2008, which was “SEA- a Roadmap for Jordan, Working Draft”, December 2008 (refer to the description in 9.2.6).
Other Laws and Regulations related to Environment
(1) Laws and Regulations related to Environmental Conservation other than Environmental Protection Law and EIA Regulation*
(i) Environmental Pollution
a) Air Quality -Air Protection Regulation No. (28) of 2005 - Any facility shall ensure that no emission of air pollutants occurs beyond the permissible limits. Regulators should ensure that the location where a project is being built is appropriate for its activities, that the permissible limits for air pollutants are not exceeded, and, in all cases, that the total pollution from facilities in the specific area do not exceed the permissible limits.
b) Water Quality -At present law or regulation of water quality is not established in Jordan, although some effluent and drinking water standards were established.
c) Solid Waste -Regulation concerning Solid Waste Management No. (27) of 2005: The objective of this regulation is to ensure the management of solid waste in a way that maintains environment protection and public health. Among others, it lists responsibilities and, tasks to be undertaken including observing and collecting operations, transportation of wastes, permitting, supervising, scheduling and archiving of solid waste quantities.

9-15
- Regulation concerning Hazardous Waste Management and Handling No. (43) of 1999: Although in existence before the environmental law of 2003 & 2006, this regulation still comes under its general umbrella by setting general procedures for hazardous waste producers for storing, handling, collecting, transporting and disposing of hazardous wastes.
(ii) Natural Environment
a) Soil protection - Soil Protection Regulation No. 25 of 2005: MOE, in coordination MOA and any other relevant institution, is empowered to establish and run special zones for the protection, development and propagation of certain types of wild plants in order to stabilize the soil. Soil maps from the national project for soil mapping and land use shall be used by the relevant body to determine the degree of suitability of an area for agriculture, grazing and other human activities.
b) Water resources - Water Authority Law No. 18 and its Amendments of 1988: This law established WAJ and granted it a mandate to research, develop and manage all aspects of water resource use except irrigation. This entails the development of water resources in the Kingdom and their exploitation for domestic and municipal use (‘municipal’ includes all waters that are used for domestic, commercial, industrial and touristic purposes that are supplied through the public networks) including springs & wells, treated and desalinated waters. - Groundwater Control Regulation No. 85, 2002, issued pursuant to articles 6 and 32 of Water Authority Law No.18, 1988 confirms that groundwater is owned and controlled by the state and its abstraction or utilization is prohibited except by license issued under this regulation. The regulation also stipulates the requirements for obtaining licenses as well as the fees and service charges associated with licensing.
c) Protection of Plants, Animals and Biodiversity as well as Environmentally Sensitive Areas - The Natural Reserves & National Parks Regulation no. 29 of 2005: The establishment or amendment of any natural reserves or national park boundaries is the decision of the council of ministers based on a recommendation by MoEnv. The ministry in coordination with the competent authorities organizes placement related to the purchase, rental or easement of owned lands within the boundary of the natural reserve or the national park. Otherwise, the owners of these lands have the right to use their land so long that it does not interfere with the objectives of protection and the management plan of the natural reserve or national park. The minister of environment may consider any site as a habitat for the revival of the rare plant, animal or aesthetically pleasing landscape, whatever the area, and declare the latter of special significance in order to regulate matters relating to the protection and management under the instructions issued by the minister for this purpose. Subject to the provisions of any other legislation, it is unlawful for any person, without obtaining the required approval, to engage in any activities within the boundary of the natural reserve or the national park, including the exploitation of any natural resources in it.

9-16
(iii) Social Environment
a) Land use
- The Zoning of Cities and Villages Law, No. 79 of 1966 sets out the detailed procedures for the preparation of physical plans for all settlements. In general, land use is controlled by the HPC as described above, using a national master plan in conjunction with municipal and regional master plans prepared by MoMA. The HPC declares planning areas, MoMA then prepares land use zoning plans and master plans and the regional and local levels of government review and comment. The law describes three levels of planning: a structural plan that should be prepared every ten years showing land uses, infrastructure, areas for economic development, provision for social services and utilities, and protected areas; a detailed plan that might cover part of a structural planning area and show public buildings, land to be expropriated for public use, and development control measures; and regional plans that are to be prepared for new towns or villages or to restrict the growth of existing towns or villages and show the main areas for industry, commerce, residential areas and utilities and infrastructure. MoMA must authorize any amendment to a master plan, most of which were prepared in the 1980s, while within any declared planning area any proposed development of land is licensed by the local planning authority. In accordance with the Land Use Planning Regulation No. (6) / 2007, no entity can change or transfer the status of any land use except in accordance with the instructions issued by the council of ministers based on a recommendation by the council. Land-uses are mapped and classified as follows: (i) Agricultural areas, (ii) Rural areas; (iii) Marginal areas; (iv) Desert areas; and (v) Forests.
b) Land acquisition and resettlement
-These issues are described separately in 9.1.5.
c) Cultural property and heritage sites
- The Antiquities Law, No. 12, 1988, as amended by Law No.23, 2004 is the key legal act for the protection of antiquities in Jordan. Article 13 requires that significant archaeological sites should be documented and protected by a buffer zone of 5 m to 25 m. In addition, it states: “it is prohibited to set up any dangerous industry, lime furnaces and stone quarries at a distance less than 1 km from the location of the antique site”. The department of antiquities gives permits for any fieldwork necessary to identify archaeological sites that may be impacted by a development, beginning with the archaeological survey of the project land. Any sites discovered at this stage must be assessed by the department of antiquities as to their significance, and what measures need to be taken to record, conserve or preserve in situ. These measures may include thorough mapping, test excavation and/or full scale excavation. Equally, sites discovered during building and mining operations must be reported to the department for a decision on whether the site is significant enough to be studied or protected.

9-17
(iv) Standards and/or Guidelines related to Environment Protection In Table 9.1-7 to 9.1-13, major standards and guidelines related to environmental protection are shown.
Table 9.1-7 Standards and Guidelines related to Environmental Protection Item Standards/Guidelines Responsible Organization
Air Quality Ambient air quality standards No.1140/2006
Jordan Institution for
Standards and Metrology
(JISM)
Air pollutants
emission
Maximum allowable limits for ambient air of
pollutants emitted from stationary sources
standards No.1189/2006
JISM
Domestic
wastewater
Reclaimed domestic wastewater standards,
No.893/2006 JISM
Industrial
wastewater
Industrial reclaimed wastewater standards,
No.202/2007 JISM
Drinking water Drinking water standards, No.286/2008 MoH
Drinking water
Higher Committee for Microbiological Water
Quality Guidelines of drinking water for surface
and groundwater sources, July 2001
MoH
Irrigation water
quality
Food and Agriculture Organization (FAO)
Guidelines for Irrigation Water Quality MoWI
Sludge Uses of treated sludge and sludge disposal,
No.1145/2006 WAJ
Source: JICA Study Team
Table 9.1-8 Air Emision Standards for Staionary Sources (Maximum Allowable Concentration) Air pollutant Unit Jordanian World Bank
(1) Natural Gas
NOx mg/Nm3 200 125
CO mg/Nm3 - -
PM/PM10 mg/Nm3 50 50
SO2 mg/Nm3 6,500 2,000
(2) Distillate Fuel Oil
NOx mg/Nm3 200 165
CO mg/Nm3 - -
PM/PM10 mg/Nm3 50 50
SO2 mg/Nm3 6,500 2,000
Note: Units - mg/Nm3 under condition at 15% O2 dry
Source: Jordan Institution for Standards and Metrology (JISM)

9-18
As for environmental regulation for power generation by oil shale burning, emission and ambient air quality
standards were established by MoEnv in 2014 as shown in Table 9.1-6 and 9.1-7. One of the reasons is that
it is a new scheme of power generation in Jordan introduced from Estonia and there are no experiences in
operation and pollution control of power generation by oil shale burning in Jordan.
Table 9.1-9 Emission Standards of Air Pollutants for the Power Generation using Direct Combustion of Oil Shale
Pollutants Maximum Limits of Emissions
(mg/Nm3)
1 SO2 400
2 TSP 30
3 Nitrogen Oxides (NOx as NO2) 510
4 HCl 35
5 Ammonia 50
6 Dioxin 1 x10⁻⁶
7 PAH (Benzo-a-pyrene) 50
8 VOCs 100
9 Hg 0.1
10 Cd 0.05
11 Pb 0.5
12 Cu 1
13 Ni 2
14 Zn 5
15 As 0.1
16 Cr 0.2
17 V 0.2
Source: MoEnv (2014)

9-19
Table 9.1-10 Comparison of Ambient Air Quality Standard of Oils Shale Burning (IFC) and Jordan and Japan
Note: * Ministry of Environment (2014) decided that IFC standards is applicable to ambient quality standards for oil shale burning power generation instead of Jordanian standards.
Source: JICA Study Team
Averagingtime
Guideline Value (μg/Nm3)
Jordan**(μg/Nm3)
ppmJapan**(μg/Nm3)
ppm
1-year 105 0.04125 (interim target-1) 0.14 1 time/year 105 0.0450 (interim-target -2)20 (interim-target -3)
1-hour 786 0.33 times/ anyconsecutive 12months
262 0.1
10-minute 500 (guideline)1-year 40 (guideline) 106 0.05
24-hour 151 0.083 times/ anyconsecutive 12months
75-1130.04-0.06
(dailyaverage)
1-hour 200 (guideline) 445 0.21 3 times/ anyconsecutive 12
70 (interim target-1) 7050 (interim-target -2)30 (interim-target -3)20 (guideline)
150 (interim target-1) 1203 times/ anyconsecutive 12months
100 (interim-target -2)75 (interim-target -3)50 (guideline)35 (interim target-1) 1525 (interim-target -2)15 (interim-target -3)10 (guideline)
75 (interim target-1) 653 times/ anyconsecutive 12months
50 (interim-target -2)37.5 (interim-target -3)25 (guideline)
8-hourdaily
160 (Interim target-1)
maximum 100 (guideline)
Pollutant
IFC (WHO) Ambient Air QualityGuidelines*
Air Quality Standards of Jordan Japan Air QualityStandards of Japan
Sulfurdioxide(SO2)
24 hour 367
0.06(photochemical oxidants)
Nitrogendioxide(NO2)
ParticulateMatter(PM10)
1-year
24-hour
100 (dailyaverage
for hourlyvalues)
ParticulateMatter(PM2.5)
1 year 15 (1-year)
24-hour35 (24-hour)
Ozone 118

9-20
Table 9.1-11 Ambient Air Quality Standard Parameter Period Standard Number of allowable exceedances
SO2
1 hour 0.3ppm 3 times/ any consecutive 12 months
24 hours 0.14ppm 1 time / year
One year 0.04ppm
TSP 24 hours 0.26mg/m3 3 times/ any consecutive 12 months
One year 0.075mg/m3
PM10 24 hours 0.12mg/m3 3 times/ any consecutive 12 months
One year 0.07mg/m3
PM2.5 24 hours 0.065mg/m3 3 times/ any consecutive 12 months
One year 0.015mg/m3
NO2
1 hour 0.21ppm 3 times/ any consecutive 12 months
24 hours 0.08ppm 3 times/ any consecutive 12 months
One year 0.05ppm
CO 1 hour 26 ppm 3 times/ any consecutive 12 months
8 hours 9 ppm 3 times/ any consecutive 12 months
Pb
Seasonal
(3 months) 0.001mg/m3
One year 0.0005mg/m3
Cd One year 0.005ug/m3
Source: Jordan Institution for Standards and Metrology (JISM)
Table 9.1-12 Ambient Noise Standards
Area Limit for Equivalent Sound Level dB(A)
Day (6:00-20:00) Night (20:00-6:00)
Residential areas in cities 60 50
Residential areas in suburbs 55 45
Residential areas in villages 50 40
Residential areas that have some workshops or simple vocations or
business and commercial and administrative areas and downtown 65 55
Industrial areas (heavy industrial) 75 65
Tuition, worshipping and treatment places and hospitals 45 35
Source: Jordan Institution for Standards and Metrology Organization (JISM)

9-21
Table 9.1-13 Drinking Water Quality Standards
Parameters Acceptable level Maximum allowable
level
(1) Microbiological
Free-living organisms Free
Fungi Free
Total Coliform count < 1/100 ml
Membrane filtration Free
Pathogenic enteric viruses and bacteria Negative
Pathogenic intestinal parasite Free
Pathogenic protozoa Free
Thermotolerant bacteria < 0/100 ml
(2) Physical
Color 10 units 15 units
Taste and odour acceptable to most
consumers
Turbidity (NTU) 1 NTU 5 NTUs
(3) Chemical
Detergents (linear alkyl sulfonate) 0.2 mg/l 0.5 mg/l
pH 6.5-8.5
Residual chlorine 0.1-1.0 mg/l
Total dissolved solids (TDS) 500 mg/l 1500 mg/l
Total Hardness 300 mg/l 500 mg/l
Total Trihalomethanes (TTHMs) 0.15 mg/l
Ag 0.1 mg/l
Al 0.1 mg/l
As 0.01 mg/l
B 2 mg/l
Ba 1.5 mg/l
Cd 0.003 mg/l
Cl 200 mg/l 500 mg/l
CN 0.07 mg/l
Cr 0.05 mg/l
Cu 1.0 mg/l 1.5 mg/l
F 2 mg/l

9-22
Parameters Acceptable level Maximum allowable
level
Fe 0.3 mg/l 1.0 mg/l
Hg 0.002 mg/l
Mn 0.1 mg/l 0.2 mg/l
Na 200 mg/l 400 mg/l
NH3 0.5 mg/l
Ni 0.07 mg/l
NO2 2 mg/l
NO3 50 mg/l 70 mg/l
Pb 0.01 mg/l
Sb 0.005 mg/l
Se 0.05 mg/l
SO4 200 mg/l 500 mg/l
Zn 3 mg/l 5 mg/l
(4) Pesticides etc.
Aldrin 0.03 μg/l
Benzene 10 μg/l
DDT 2.0 μg/l
Dieldrin 0.03 μg/l
Endrin 2.0 μg/l
Ethylbenzene 500 μg/l
Heptachlor epoxide and Heptachlor 0.03 μg/l
Lindane 4.0 μg/l
Parathion 35 μg/l
Tetrachloroethylene 5.0 μg/l
Toluene 300 μg/l
Trichloroethylene 5.0 μg/l
Xylene 700 μg/l
2,4-D 90 μg/l
2,4,5-T 9.5 μg/l
Source: Ministry of Health (2005), JS 286 (JISM, 2008)

9-23
Land Acquisition and Resettlement
In Jordan any land acquisition is undertaken in accordance with Decree 812) of 1987, commonly referred to as the Land Acquisition Law (LAL) and its amendments. The LAL applies in all cases of land acquisition and to all concerned institutions.
(1) Land and Properties for Land Acquisition
(i) Private land
Article 7 of the LAL specifies that the owner of the property is the person in whose name the property
is registered and documented at the Land Registry. If the property is not registered, the person seizing
the land on the day of issuance of the Council of Ministers’ Resolution to acquire shall, for the purposes
of compensation, be considered the owner.
Article 11 does not place limit on what a land owner can be compensated for. However, it permits
expropriation without compensation for up to 25% of the area of a plot if the purpose of the
expropriation is for:
a) Linear projects, e.g. the construction, or expansion/widening of a road, or
b) The construction of a government housing project.
Article 12 stated that, if for the above purposes all the area is expropriated or if what is left is not of use, compensation shall be paid in full for the whole property without any part being acquired for free.
In case of dealing with the multiple owners as a body, it is the general practice of the government to ask them to select a representative to act and negotiate on their behalf. Nonetheless, all owners or shareholders will be entitled to property compensation according to their shares.
(ii) Government lands
The process of acquisition of government lands and assets will be handled through intra- government discussions and agreements.
(iii) Tribal lands and Land by Tribal Use
In Jordan, there are tribal lands which is claimed by the tribe and lands used traditionally such as range
land in desert lands. However, there are no specific provisions in the LAL or other legislation for tribal
lands to be acquired or for the loss of traditional use rights.
In case of land acquisition all the tribal lands and lands by tribal use are surveyed and registered by
DLS to owners or government organizations.
(iv) Farmland, Trees, Crops, Well, Water Rights, etc.
Compensation for farmlands may include separately itemized compensations for features such as walls,

9-24
greenhouses, wells, water rights, etc. Under the LAL, tree and annual crops are subject to compensation
but no guidelines are defined except that the expropriation shall be in consideration of an equitable
compensation.
(v) Renters
The LAL restricts the awards to renters proportionately as a percentage of the compensation for the
plot. The highest amounts payable to renters are:
(a) 15% of the compensation of the plot, if the payment is to compensate for property occupied for
industrial or commercial purposes,
(b) 5% of the compensation of the plot, if the payment is to compensate for property occupied for any
other purpose.
(2) Procedures for Land Acquisition and Roles and Responsibility of Concerned Organizations
Jordanian law allows for the appropriation of land for the public benefit conditional on fair and just compensation. As described above, any potential land acquisition is undertaken in accordance with the LAL, and must be approved by the Council of Ministers. The Department of Lands and Surveys (DLS) has been established to oversee the acquisition, compensation payment and ultimate registration of the land.
The Council of Ministers requires demonstration of the public interest (benefits), evidence that the purchasing authority has the capacity to pay and agreement between contracting parties on the issue of appropriate compensation. In the event that an agreement cannot be reached, or there is dispute over payment of money promised, the case would be referred to the Primary Court that has jurisdiction in the area, and to higher courts if necessary.
The process of acquisition involves a number of actions and steps, as follows as shown in 9.1-14.
-Publication by the DLS of the intent to acquire land in the public interest; -Submittal of a request for approval from the Prime Ministry to acquire the land (15 days after the
announcement date); -A committee led by the DLS determines the value of the land and fair compensation (considering the
market price on the day of publication of intent to acquire the land and the value of nearby sites); -Appeals procedure (if the owner disagrees with the estimated cost, and arbitration fails, the courts will
take up the issue and must reach a resolution within three months); and -Payment by the relevant Government department to DLS, which in turn pays the owner and finalizes
the registration of land for the Ministry.

9-25
Table 9.1-14 Summary of Actions and Roles and Responsibility of Concerend Organizations in Land Acquisition
Actions for land acquisition Entity or persons
having intention
to acquire land
(Proponent)
Relevant
Government
Organizations
Land Owner
(Project
Affected
Person)
1) The appropriate proponent provides detailed
information on the land and properties to be
expropriated
X
2) Department of Lands and Surveys (DLS) announces the
desire to expropriate the land in two daily newspapers,
providing full details on the land involved.
X
3) Any objection to the acquisition on principle must be
lodged within 15 days of the publication of the intent to
acquire.
X
4) 15 to 90 days later, the case is presented the Prime
Ministry for the approval. The Prime Ministry has 6
months (from 15 days after the announcement) to ratify
the expropriation of the land.
X
5) After decision ratified by the Prime Ministry, it is
published in the official newspaper. X
6) DLS forms Valuation Committee to estimate the
compensation. All evaluation for compensation are based
on current land values and prices in surrounding areas.
X
7) Detail information of the land including names of owner,
the name number of the land unit, are announced X
8) Land owner must examine and discuss compensation
with concerned organizations within 30 days. The owner
has the right to object, and appeal against the estimation
results of the compensation.
X
9) DLS may form second Valuation Committee to conduct
a second evaluation. X
10) Agreement between the proponent and land owner with
the level of compensation is finalized after ratification by X X X

9-26
the Ministry of Finance.
11) Disburse compensation fee by the proponent through the
DLS to land owner without any delay. X X X
12) If no agreement is reached, the owner has the right to take
the matters to the Courts X X X
Note: X – applicable. Source: JICA Study Team referred to the following reports. 1) Ministry of Public Works and Housing (2004): Land
Acquisition & Resettlement Plan Update for the Amman Development Project, 2) Jordan (2008): Land Acquisition & Compensation Plan (LACP) Update Based on Resettlement Policy Framework of 2006 for the Amman East Power Plant
Project, 3) Jordan (2013): Emergency Services and Social Resilience Project – Resettlement Policy Framework.
(3) Resettlement
Jordan employs a resettlement policy, which is based on the World Bank OP 4.12, following any land acquisitions as mentioned above. In outline, a Resettlement Policy Framework (RPF) is prepared which outlines overall resettlement objectives and principles as well as funding mechanisms and organizational arrangements. Any resettlement plan is governed by the following principles same as the resettlement policy of the JICA Guidelines:
-Involuntary resettlement is avoided wherever feasible, or minimized, exploring all viable alternative project designs.
-Where it is not feasible to avoid involuntary resettlement, activities are conceived and executed as sustainable development programs, providing sufficient investment resources to enable people adversely affected by the project to share project benefits. Displaced persons are to be meaningfully consulted and have opportunities to participate in the planning and implementing of resettlement programs affecting them.
-Displaced persons should be assisted in their efforts to improve their livelihoods and standards of living, or at least to restore them, in real terms, to pre-displacement levels or to levels prevailing prior to the beginning of project implementation, whichever is higher.
International/Bilateral Conventions, Agreements and Treaties
Jordan government policy acknowledges the importance of its natural and cultural heritage and Jordan has become a signatory to a number of International and Regional Conventions, Treaties and Agreements to protect and conserve such assets. Such instruments enable multilateral coordination, cooperation and action in tackling environmental issues that are of international cross-boundary, regional or global interest as shown in Table 9.1.-15

9-27
Table 9.1-15 List of International/Bilateral Conventions, Agreements and Treaties Name
1) UN Convention on Climate Change;
2) Vienna Convention and Montreal Protocol for the Protection of the Ozone Layer;
3) Convention for the Protection of the Marine Environment;
4) Convention for the Protection of the Coastal Region of the Mediterranean;
5) Convention on Oil Pollution Preparedness, Response and Cooperation;
6) Convention for the Prevention of Pollution of the Sea by Oil;
7) Convention for the Prevention of Pollution from Ships;
8) Convention for the Protection of Biological Diversity;
9) The Biosafety Protocol, also known as the Cartagena Protocol;
10) Ramsar Convention on Wetlands;
11) Convention on the Conservation of Migratory Species of Wild Animals;
12) Convention Concerning the Protection of the World Cultural and Natural Heritage;
13) Convention for the Protection of New Varieties of Plants; and
14) Convention to Combat Desertification.
Source: MoEnv.
Institutional framework
(1) Ministry of Environment (MoEnv) Under the legislation of 1995, to integrate environmental management policy, Environmental
Protection Authority was established. Their roles were focused to sewerage and solid waste management in order to protect vital and scarce water resources in the country.
As mentioned in 9.1.1, however, the MoEnv was established in 2003 as Jordan’s lead institution for environmental management. The MoEnv is the responsible body for protecting the environment through setting policies and legislation as well as ensuring proper enforcement through licensing, monitoring and inspection processes.
It is responsible for designating and supervising the management of national parks, reserves and other protected areas although it may delegate these tasks to other bodies. The MoEnv is also responsible for developing relevant information management programs, raising public awareness, and promoting co-operation with relevant national, regional and international parties.
The MoEnv chairs two national committees that are in charge of project planning and approval decisions, namely: the central licensing committee and the EIA committee.
Figure 9.1-3 shows the organization chart of MoEnv. The directorate of licensing & pollution prevention under MoEnv is responsible for supervision and EIA approval.
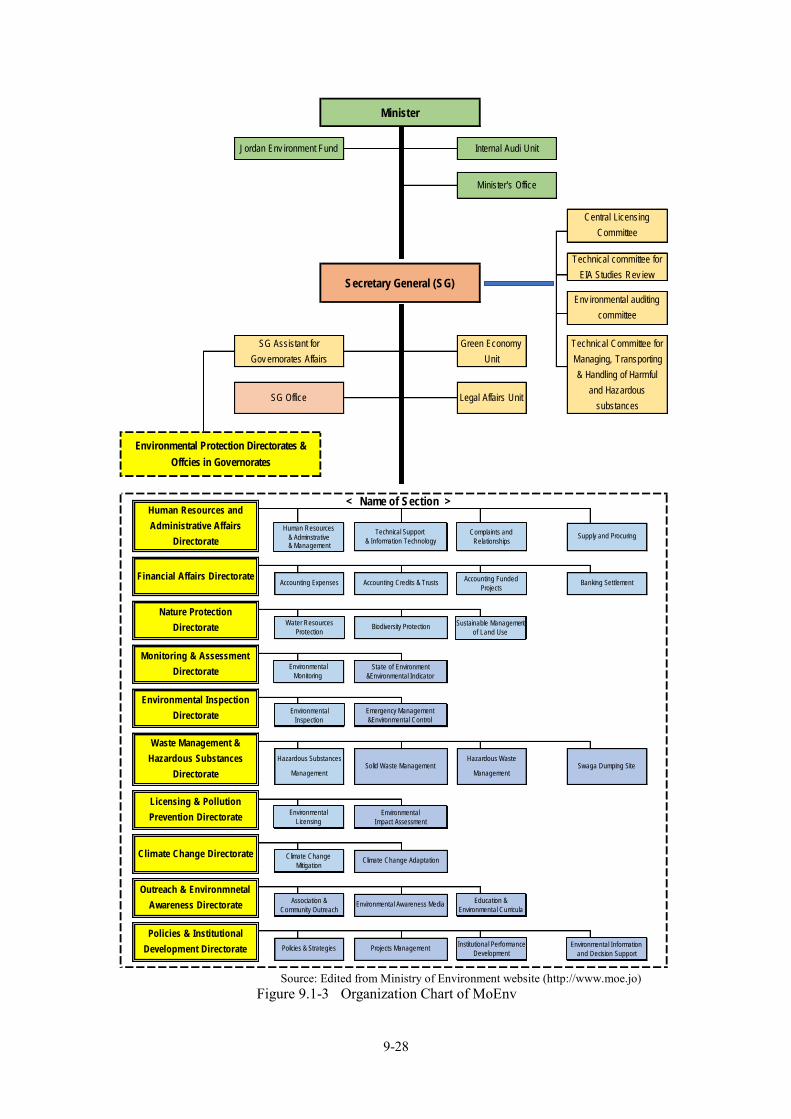
9-28
Source: Edited from Ministry of Environment website (http://www.moe.jo)
Figure 9.1-3 Organization Chart of MoEnv
Outreach & Environmnetal
Awareness DirectorateAssociation &
Community OutreachEnvironmental Awareness Media
Education &
Environmental Curricula
Policies & Institutional
Development Directorate Policies & Strategies Projects ManagementInstitutional
Performance
Renvironmental Information
and Decision Support
Licensing & Pollution
Prevention Directorate Environmental licensingEnvironmental Impact
Assessment
Climate Change Directorate Climate Change
MitigationClimate Change Adaptation
Waste Management &
Hazardous Substances
Directorate
Hazardous Substances
ManagementSolid Waste Management
Hazardous Waste
ManagementSwaga Dumping Site
Environmental Inspection
DirectorateEnvironmental
Inspection
Emergency Management
&Environmental Control
Monitoring & Assessment
DirectorateEnvironmental
Monitoring
State of Environment
&Environmental Indicator
Financial Affairs DirectorateAccounting Expenses Accounting Credits & Trusts
Accounting Funded
ProjectsBanking Settlement
Supply and Procuring
Nature Protection
DirectorateWater Resources
ProtectionBiodiversity Protection
Sustainable
Management of Land
< Name of Section >Human Resources and
Administrative Affairs
Directorate
Human Resources &
Administrative &
Technical Support
& Information Technology
Complaints and
Relationships
Minister
Jordan Env ironment Fund Internal Audi Unit
Minister's Office
SG Assistant for
Gov ernorates Affairs
Green Economy
Unit
Central Licensing
Committee
Technical committee for
EIA Studies Rev iewSecretary General (SG)
Env ironmental auditing
committee
Environmental Protection Directorates &
Offcies in Governorates
SG Office Legal Affairs Unit
Technical Committee for
Managing, Transporting
& Handling of Harmful
and Hazardous
substances
Human Resources
& Adminstrative& Management
Sustainable Management
of Land Use
Technical Support
& Information Technology
Complaints and
Relationships
Accounting Funded
Projects
Water Resources
Protection
Environmental
Monitoring
Environmental
Inspection
Environmental
Licensing
Climate Change
Mitigation
State of Environment
&Environmental Indicator
Emergency Management
&Environmental Control
Association &
Community Outreach
Education &
Environmental Curricula
Institutional Performance
Development
Environmental Information
and Decision Support
Environmental
Impact Assessment

9-29
(2) Other Major National Level Bodies
(i) Natural Resources Authority (NRA)
The NRA is responsible for policies to investigate, develop and exploit energy and mineral resources. As part of this, the NRA issues permits and licenses for mining and quarrying.
(ii) Ministry of Agriculture (MoA)
The MOA is responsible for managing public rangelands and forests, protecting soil resources, pastureland and flora, permitting pesticides, protecting and managing wildlife, issuing fishing and hunting licenses, determining capacity and setting ‘take’ limits.
(iii) Ministry of Water and Irrigation (MWI) including Water Authority of Jordan (WAJ)
MWI and WAI work in determining National Water policy, monitoring and protecting water against pollution, in addition to studying water supplies, irrigation and sewerage. Groundwater, aquifer management and abstraction monitoring and licensing
(iv) Ministry of Municipal Affairs (MOMA)
MOMA monitors the financial, administrative and organizational performance of municipalities and supports them in dealing with all aspects of planning and supervision of infrastructure development within their boundaries. There is a decentralization program underway in Jordan. This will allocate more responsibilities to MOMA, which will be renamed the Ministry of Local Government, and to the municipalities to implement development projects directly.
(v) The Higher Planning Council (HPC) A national land-use master plan for Jordan has been prepared to ensure that development considers factors such as the physical environment, population distribution and proper management of agriculture and natural resources. The HPC is chaired by the Minister of MOMA and is responsible for promulgation of the master plan, approval of regional planning proposals and licensing of land development.
(3) Sub-National Level Administration
(i) Aqaba Special Economic Zone Authority (ASEZA)
ASEZA and Aqaba Special Zone (ASEZ) were established in 2001 to attract and facilitate investment in Aqaba in the areas of tourism development, industry, port development, infrastructure, utilities and commercial services. ASEZA has five governing Commissioners, one of whom is dedicated to the Environmental Management of the Zone, and a Department for Environment and Health Control responsible for environmental management and protection of the terrestrial and marine resources of the area (See Figure 9.1-4). One important aspect of ASEZA’s regime is the prohibition of any discharges to the marine environment. This ‘zero-discharge policy’ was designed to ensure that only brine from desalination
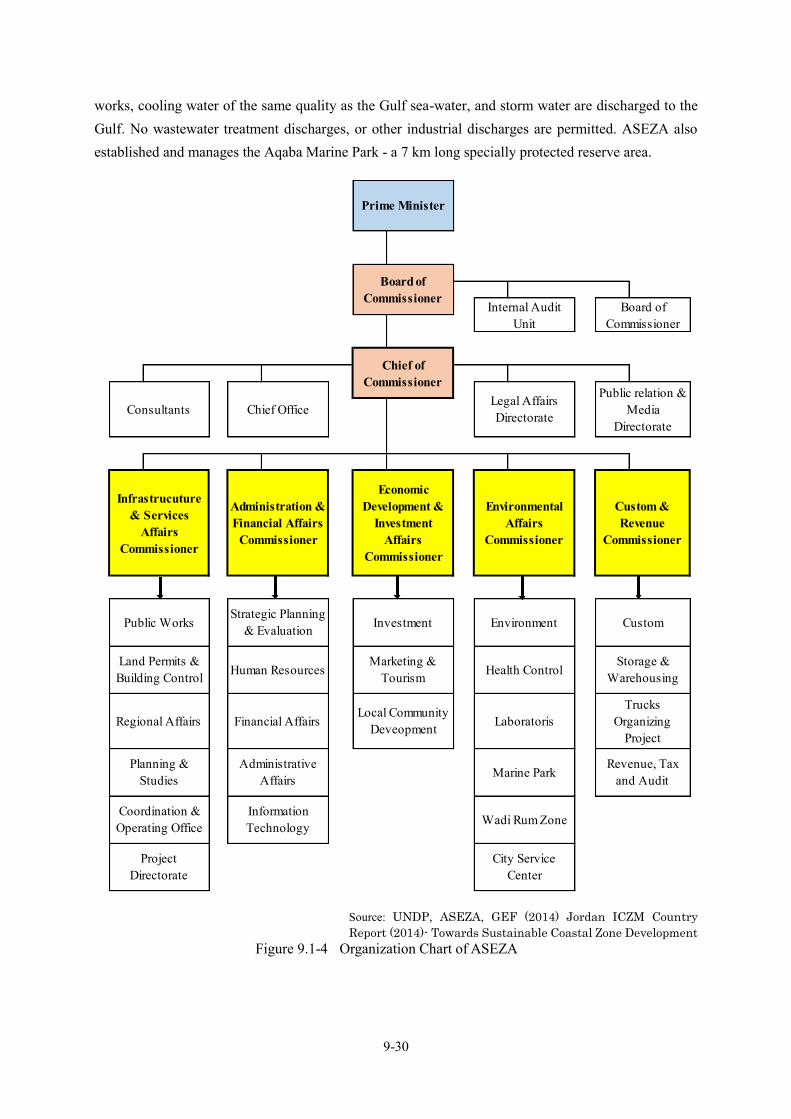
9-30
works, cooling water of the same quality as the Gulf sea-water, and storm water are discharged to the Gulf. No wastewater treatment discharges, or other industrial discharges are permitted. ASEZA also established and manages the Aqaba Marine Park - a 7 km long specially protected reserve area.
Source: UNDP, ASEZA, GEF (2014) Jordan ICZM Country
Report (2014)- Towards Sustainable Coastal Zone Development Figure 9.1-4 Organization Chart of ASEZA
Regional Affairs Financial AffairsLocal Community
Deveopment Laboratoris
Coordination &Operating Office
InformationTechnology Wadi Rum Zone
ProjectDirectorate
City ServiceCenter
TrucksOrganizing
Project
Planning &Studies
AdministrativeAffairs Marine Park
Revenue, Taxand Audit
Public WorksStrategic Planning
& Evaluation Investment Environment Custom
Land Permits &Building Control Human Resources
Marketing &Tourism Health Control
Storage &Warehousing
Prime Minister
Board ofCommissioner
Internal AuditUnit
Board ofCommissioner
Chief ofCommissioner
Consultants Chief OfficeLegal AffairsDirectorate
Public relation &Media
Directorate
Infrastrucuture& Services
AffairsCommissioner
Administration &Financial Affairs
Commissioner
EconomicDevelopment &
InvestmentAffairs
Commissioner
EnvironmentalAffairs
Commissioner
Custom &Revenue
Commissioner

9-31
(ii) Jordan Valley Authority (JVA)
The JVA was established was established in 1977 before the creation of MWI, with a mandate of comprehensive development of the Jordan Valley, but it is now within MWI. It is responsible for the development and utilization of water resources in the Jordan Valley, irrigation, water resources protection and conservation, distribution networks, tourism planning and development and hydroelectric power generation. JVA has owned and managed significant land assets in the Jordan Valley most of which are unoccupied, but some are leased to farmers.
(iii) Governorates
There are twelve regional Governorates in Jordan. Within these Governorates, the Greater Amman Municipality, and the Aqaba Special Economic Zone have power to set laws and regulations in some areas, including environmental management. The other Governorates are mainly concerned with coordinating the implementation of national legislation and providing support and advice to municipalities, particularly with regard to public safety, public health and long-term sustainability issues.
(iv) NGOs
Royal Society for the Conservation of Nature (RSCN) is one of the most well established environmental NGOs in Jordan. It is empowered to establish and manage protected areas under the supervision of the MoEnv.
Strategic Environmental Assessment and Planning Process
Background and Role of SEA
The need to address the environmental impact of policy, and plans, and programs is widely acknowledged. Regional and national plans are subject to environmental assessment procedures to identify, at a strategic level, potential environmental impacts likely to arise during implementation of the policy or plan. This level of environmental assessment is often referred to as Strategic Environmental Assessment (SEA). In other word, SEA is a system of incorporating environmental considerations into policies and plans.
In this regards, SEA term of “environment” is used as a wider meaning of description which covers not only natural and social conditions but also economic and financial engineering (technological) aspects. Currently, SEA is widely accepted in many countries as a tool to integrate environmental and social considerations into a decision-making process. It is generally understood as a process for assessing the environmental impacts caused by a policy, plan and program. SEA should be recognized as a supportive method to conduct appropriate decision-making from the point of view of environment and sustainable development.
An increasing number of countries and international organizations including World Bank, ADB and JICA have introduced SEA system. However, there are differences in the scope, comprehensiveness,
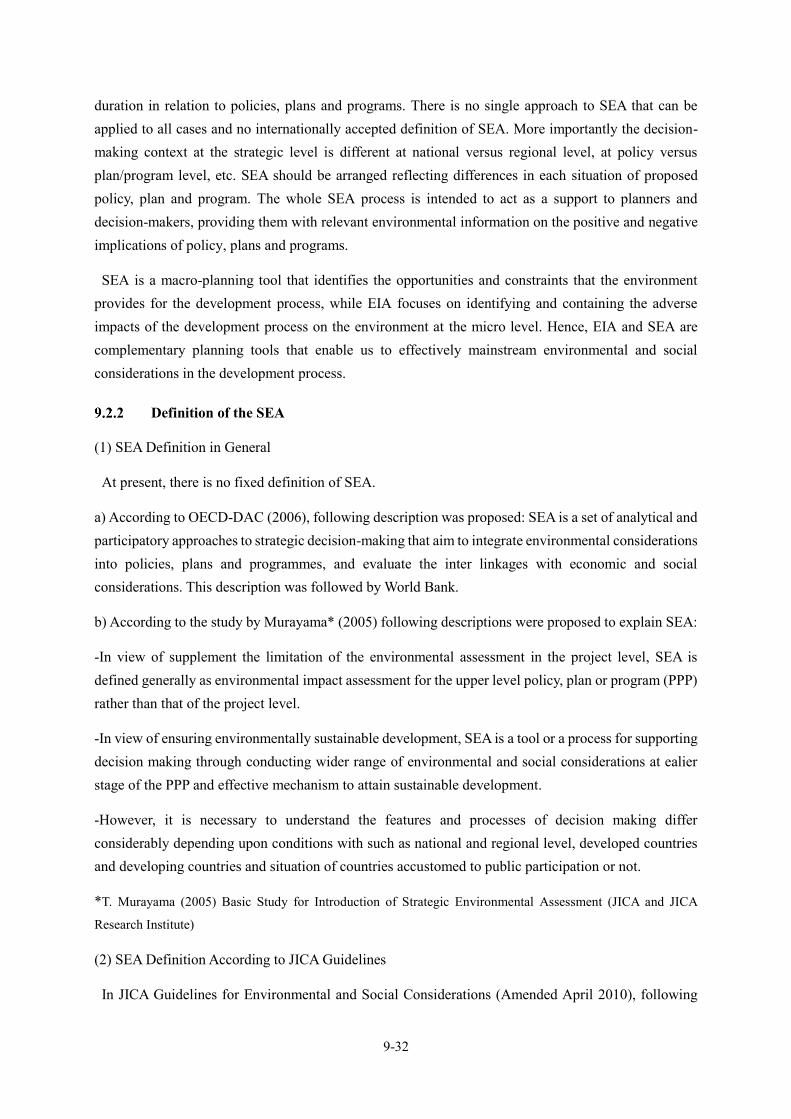
9-32
duration in relation to policies, plans and programs. There is no single approach to SEA that can be applied to all cases and no internationally accepted definition of SEA. More importantly the decision-making context at the strategic level is different at national versus regional level, at policy versus plan/program level, etc. SEA should be arranged reflecting differences in each situation of proposed policy, plan and program. The whole SEA process is intended to act as a support to planners and decision-makers, providing them with relevant environmental information on the positive and negative implications of policy, plans and programs.
SEA is a macro-planning tool that identifies the opportunities and constraints that the environment provides for the development process, while EIA focuses on identifying and containing the adverse impacts of the development process on the environment at the micro level. Hence, EIA and SEA are complementary planning tools that enable us to effectively mainstream environmental and social considerations in the development process.
Definition of the SEA
(1) SEA Definition in General
At present, there is no fixed definition of SEA.
a) According to OECD-DAC (2006), following description was proposed: SEA is a set of analytical and participatory approaches to strategic decision-making that aim to integrate environmental considerations into policies, plans and programmes, and evaluate the inter linkages with economic and social considerations. This description was followed by World Bank.
b) According to the study by Murayama* (2005) following descriptions were proposed to explain SEA:
-In view of supplement the limitation of the environmental assessment in the project level, SEA is defined generally as environmental impact assessment for the upper level policy, plan or program (PPP) rather than that of the project level.
-In view of ensuring environmentally sustainable development, SEA is a tool or a process for supporting decision making through conducting wider range of environmental and social considerations at ealier stage of the PPP and effective mechanism to attain sustainable development.
-However, it is necessary to understand the features and processes of decision making differ considerably depending upon conditions with such as national and regional level, developed countries and developing countries and situation of countries accustomed to public participation or not.
*T. Murayama (2005) Basic Study for Introduction of Strategic Environmental Assessment (JICA and JICA
Research Institute)
(2) SEA Definition According to JICA Guidelines
In JICA Guidelines for Environmental and Social Considerations (Amended April 2010), following

9-33
definition and explanation are given:
-1.3 Definitions 7. A “strategic environmental assessment” is an assessment that is implemented at the policy, planning, and program levels, but not at project-level EIA.
-1.4 Basic Principles Regarding Environmental and Social Considerations. As one of seven principles to be very important, “measures for environmental and social considerations must be implemented from an early stage to a monitoring stage”.
-JICA applies a Strategic Environmental Assessment (SEA) when conducting master plan Studies and encourages project proponents to ensure environmental and social considerations from an early stage to the monitoring stage. However, there are no further detailed description of SEA in the JICA Guidelines.
Components of SEA
In general, major components of SEA are the following:
-Comprehensive assessment with integrated evaluation by environmental and social considerations as
well as economic, financial and technical factors at the program, plan and policy levels;
-Impact assessment at the early decision-making stage (e.g. planning stage);
-Consideration of alternatives;
-Public participation and information disclosure at the earlier stages;
-Assessment of accumulated impacts beyond one project, if sub-projects are involved.
Regarding major components of SEA, as for comprehensive assessment it is conducted by applying
evaluation instrument such as MCA or WASP as described later.
As for public participation and information disclosure at the earlier stage frequent meetings with
stakeholders were already held with JCC meetings, seminars and other workshops in this master plan
Study.
Role of SEA and Plans for Administrative Decision Level
As mentioned above SEA can also be applied to formulation of policies, plans and programs at a higher administrative level. Contents and evaluation factors for SEA are somewhat changed depending on the targeted levels of policies, plans and programs such as administrative, spatial and/or sectarian level. In view of SEA for necessary environmental and social considerations relation of policies and plans with environmental and social considerations are shown inTable 9.2-1.

9-34
Table 9.2-1 Development Plan and Strategic Environmental Assessment PPPs for Development SEA/
EIA
Environmental and Social
Considerations Level Policy, Plan, Program, Project etc.
1 National Level National Policy, Plan, Program etc. SEA National Environmental Policy etc.
2 Regional
Level
Regional development policy, master
plan for several regions and cities SEA
Regional level SEA -Regional
environmental management policy, plan
3 Sector level
Master plan of nationwide and/or
regional energy/electric power sector,
etc.
SEA
Sector level SEA - Evaluation of policy,
plan, program for nationwide and/or
regional energy/electric power sector
master plan
4
Selection of
Prioritized
Plan or Project
Alternative energy/electric power
plans and projects (energy/power
plants, transmission line, distribution
system etc.)
SEA/
EIA
SEA/EIA of plan and/or project
alternatives - Evaluation of development
plans/projects for energy/power plants,
transmission line, distribution system etc.
5 Implementatio
n of Project
Specific project (Feasibility Study)
with pre-determined site and process
etc.
EIA
EIA of projects (development of
energy/power plant, transmission line,
distribution system etc.
Source: JICA Study Team
Application of SEA for PPPs and Projects in Jordan
At present neither relevant law or regulation of SEA nor institutional arrangement is established in Jordan.
However, in 2008 a working draft named as “SEA - a roadmap for Jordan” was prepared in partnership with MoEnv and EU. The Roadmap has been developed with technical input from the Short and Medium Term Priority Environmental Action Programme III Technical Assistance (SMAP III TA), an EC funded three-year program which addresses sustainable development policy enhancement and ICZM (Integrated Coastal Zone Management) in the MEDA region in the context of the Euro-Mediterranean Partnership.
According to the working draft following description were
(1) Purpose of the Roadmap In recognition that Jordan is at an early stage in the SEA implementation process, the roadmap plots a
path for the phased introduction of SEA in Jordan over a period of two to three years. The roadmap seeks to build on the capacity and potential that already exists in Jordan, and to ensure SEA is applied with careful consideration to the Jordanian context.
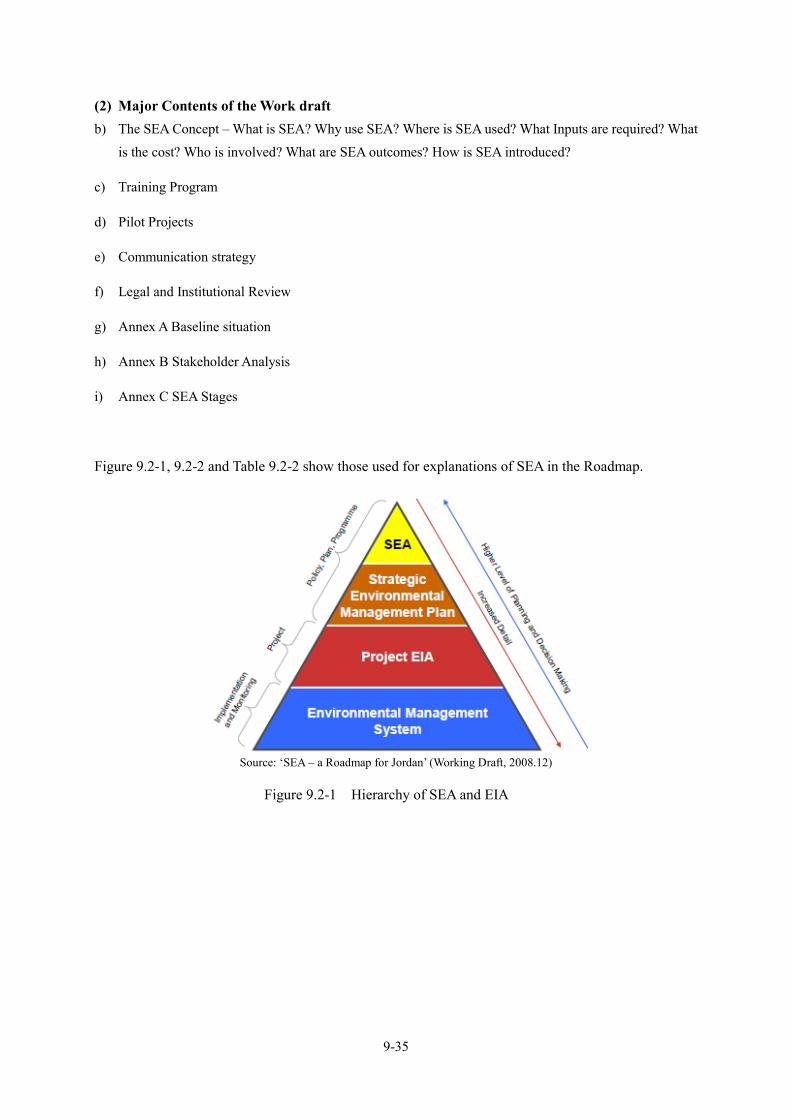
9-35
(2) Major Contents of the Work draft b) The SEA Concept – What is SEA? Why use SEA? Where is SEA used? What Inputs are required? What
is the cost? Who is involved? What are SEA outcomes? How is SEA introduced?
c) Training Program
d) Pilot Projects
e) Communication strategy
f) Legal and Institutional Review
g) Annex A Baseline situation
h) Annex B Stakeholder Analysis
i) Annex C SEA Stages
Figure 9.2-1, 9.2-2 and Table 9.2-2 show those used for explanations of SEA in the Roadmap.
Source: ‘SEA – a Roadmap for Jordan’ (Working Draft, 2008.12)
Figure 9.2-1 Hierarchy of SEA and EIA

9-36
Source: ‘SEA – a Roadmap for Jordan’ (Working Draft, 2008.12)
Figure 9.2-2 Parallel versus Integrated SEA Processes
Table 9.2-2 Tasks and Purpose with SEA Stages Stages in the SEA Process
SEA stages and tasks Purpose
Scoping: setting the context and objectives, establishing the baseline and deciding on the scope
Identifying other relevant plans,
programmes and environmental
protection objectives
Establish how the plan or programme is affected by outside
factors, to suggest ideas for how any constraints can be
addressed, and to help to identify SEA objectives.
Collecting baseline information
Provide an evidence base for environmental problems,
prediction of effects, and monitoring; to help in the
development of SEA objectives.
Identifying environmental problems
Help focus the SEA and streamline the subsequent stages,
including baseline information analysis, setting of the SEA
objectives, prediction of effects and monitoring.
Developing SEA objectives Provide a means by which the environmental performance of
the plan or programme and alternatives can be assessed.
Consulting on the scope of the SEA Ensure that the SEA covers the likely significant
environmental effects of the PPP.
Assessment: developing and refining alternatives and assessing effects
Testing the plan or programme
objectives against SEA objectives
Identify potential synergies or inconsistencies between the
objectives of the plan or programme and the SEA objectives
and help in developing alternatives.
Developing strategic alternatives Develop and refine strategic alternatives.

9-37
Predicting the effects of the plan or
programme, including alternatives Predict the significant environmental effects of the plan or
programme and alternatives.
Evaluating the effects of the plan or
programme, including alternatives
Evaluate the predicted effects of the plan or programme and its
alternatives and assist in the refinement of the plan or
programme.
Mitigating adverse effects Ensure that adverse effects are identified and potential
mitigation measures considered.
Proposing measures to monitor the
environmental effects of plan or
programme implementation
Detail the means by which the environmental performance of
the plan or programme can be assessed.
Preparing the Environmental Report
Present the predicted environmental effects of the plan or
programme, including alternatives, in a form suitable for
public consultation and use by decision-makers.
Decision-Making: consulting on the draft plan or programme and the Environmental Report
Consulting the public and Consultation
Bodies on the draft plan or programme
and the Environmental Report
Give the public and Consultation Bodies an opportunity to
express their opinions on the findings of the Environmental
Report and to use it as a reference point in commenting on the
plan or programme. To gather more information through the
opinions and concerns of the public.
Assessing significant changes
Ensure that the environmental implications of any significant
changes to the draft plan or programme at this stage are
assessed and taken into account.
Making decisions and providing
information
Provide information on how the Environmental report and
consultees’ opinions were taken into account in deciding the
final form of the plan or programme to be adopted.
Monitoring: monitoring implementation of the plan or programme
Developing aims and methods for
monitoring
Track the environmental effects of the plan or programme to
show whether they are as predicted; to help identify adverse
effects.
Responding to adverse effects Prepare for appropriate responses where adverse effects are
identified.
Source: ‘SEA – a Roadmap for Jordan’ (Working Draft, 2008.12)
(3) SEA Policy Statement
In order to establish the ministry of environment’s position with respect to SEA, following SEA policy statement is expressed.
The MoE is committed to mainstreaming environmental concepts into all public decisions and
undertakings (policies, plans or programs). This commitment recognizes the importance of

9-38
environmental mainstreaming as an essential prerequisite for the achievement of sustainable
development in Jordan.
The strategic environmental assessment concept has been identified as being of particular relevance to
the achievement of environmental mainstreaming in Jordan. Effective implementation of the SEA
concept will fundamentally change the nature of planning in Jordan, through consideration of strategic
environmental issues at an early stage in the planning process.
Key benefits associated with effective implementation of the strategic environmental assessment
concept include:
(a) enhanced sustainability of natural resources; (b) prevention of costly mistakes; (c) conservation of limited time and money; (d) simplification of project-level environmental impact assessments; (e) promotion of sectoral and cross-sectoral plan or programme compatibility and transboundary cooperation; (f) enhancement of development strategies; (g) improved public sector performance through increased accountability and transparency; (h) fulfilment of requirements set by development cooperation organizations; and (i) enhanced credibility of decision-making process.
(4) A workshop for SEA was held
According to the roadmap a workshop based on the roadmap was conducted on December 10th, 2007 in Amman, and attended by 52 professionals from 26 institutions covering almost all the environmental spectrum in Jordan, and all potential stakeholders to be involved in the SEA process.
(5) Present Situation of the Roadmap in Jordan
At present it is not clear that the results of the roadmap is recognized or accepted and its outcome is shared within MoEnv from the hearing to EIA division of the MoEnv.
SEA for master plan Study Formulation in General
In conducting an environmental evaluation of the master plan, a SEA will be applied as a systematic process for comprehensively evaluating, at the earliest appropriate stage in the planning process. Several alternative options for the overall transport development project, thereby ensuring a full integration of the relevant environmental and social considerations as well as economic, engineering and financial aspects of the proposed master plan.
In accordance with the SEA concept, environmental considerations are sufficiently incorporated into the master plan. While a project-level EIA will be implemented after specifying the detailed transport development projects such as road and railway construction along designated route alignment in the master plan, the SEA introduces early and strategic environmental considerations before the details of plans of route alignments and their specifications are decided. In other words, the SEA method allows the planner to focus on the environmental affects for the optimum formulation of the master plan before specific transport development projects are finalized. Thus, in comparison with a project-level EIA, the SEA can take into account a broader range of alternative plans and projects and mitigation measures in

9-39
the procedures of formulating the master plan.
As shown in Table 9.2-1 required contents of environmental and social considerations and SEA are changeable depending upon scope of PPPs and/or the master plan.
In the formulation of master plan two kind of SEAs (Provisionally as SEA-1 and SEA-2) are required depending upon whether information of the site location is included or not as schematically shown in Figure 9.2-3. In this master plan the site location data are not included in generation development plans. Thus, the required SEA is considered to correspond to the SEA-1.
< Policy, Plan, Programme (PPP) Level >
(Formulation of Master Plan (Master Plan Study)
< PPPs and Projects > < Environmental and
Social Considerations
Formulation of Policy, Plan, Program (PPPs) SEA -1
MP - 1 Selection of Options (Plans/ Scenarios) SEA - 1
MP -2 Site Selection of the Options SEA - 2/EIA
< Project Level >
Basic Design EIA
Detailed Design EIA/EMP
Construction EMP, Monitoring
Operation EMP, Monitoring, Audit
Decommission Monitoring, Audit
Note: (a) SEA -1; SEA with facilities and utilities only, without information about site location, (b) SEA - 2; SEA with information about site location
Source: JICA Study Team Figure 9.2-3 Role of SEA in the master plan study
SEA Studies for Generation Development Plan in JICA projects
According to the reports of JICA projects SEA was applied to evaluate generation development plans in developing countries such as Vietnam, Indonesia, Sri Lanka and Zambia as shown in Table A9.2-1 of Appendix 9.2.1.
Among the countries Vietnam and Sri Lanka have established SEA legislation. Although the SEA legislation has not been established in Indonesia and Zambia, it is required to conduct SEA level study for decision making and/or formulation of the PPP. Types of SEA applied were those mixed of both SEA -1 and SEA -2 (refer to Figure 9.2-1).

9-40
Existing Environmental Conditions in Jordan
Social environment
Description of the social environment below was prepared with referring mainly to the following reports:
-Department of Statistics, Jordan (2015) Statistical Year Book 2014
-Department of Statistics, Jordan (2016) Jordan in Figures 2015
-Department of Statistics, Jordan (2015) Statistical Year Book 2014
-Ministry of Environment and UNDP (2014): Integrated Investment Framework for sustainable Land Management in Jordan
-Jordan, GEF and UNP (2015) Jordan’s Third National Communication on Climate Change
-Ministry of Environment (2009) The State of Environment Report 2009
(1) Regime and Administration system
Jordan is an Arab Muslim country, located in the north of the Arabian Peninsula and in West Asia. Bordered by Syria to the north, Iraq to the east, Saudi Arabia to the south and south-east, and Palestine (the West Bank) to the west. Jordan is named to the Jordan River, which passes on its western border, and Amman is capital.
Jordan is a constitutional monarchy based on the constitution promulgated on January 8, 1952. The constitution concentrates a high degree of executive and legislative authority in the King, who determines domestic and foreign policy.
The legislative power is vested in the bicameral national assembly and the king. the national assembly consists of a chamber of deputies and a senate.
Regime in the Hashemite Kingdom of Jordan parliament heritable Royal. Sits Majesty King Abdullah II on the throne of the Kingdom of the top three authorities, also serves as the supreme commander of the armed forces.
(2) Administrative divisions
Jordan is divided into 12 governorates (muhafazah) by the administrative divisions system of the
ministry of interior as shown in Table 9.3-1and Figure 9.3-1. In 1994, four new governorates were created: Jerash, Ajloun, Madaba and Aqaba. Jerash governorate and Ajloun governorate were split from Irbid governorate, Madaba governorate was split from Amman governorate and Aqaba governorate was
split from Ma'an governorate.

9-41
Table 9.3-1 Features of Regions and Governorates in Jordan Region/Governorate Capital Area (km2) Ratio (%)*
Central Region 14,400 16.2
Amman Amman 7,579 8.5
Balqa Salt 1,120 1.3
Zarqa Zarqa 4,761 5.4
Madaba Madaba 940 1.1
North Region 28,953 32.6
Irbid Irbid 1,572 1.8
Mafraq Mafraq 26,551 29.9
Jerash Jerash 410 0.5
Ajloun Ajloun 420 0.5
South Region 45,441 51.2
Karak Al Karak 3,495 3.9
Tafilah Tafilah 2,209 2.5
Ma'an Ma'an 32,832 37
Aqaba Aqaba 6,905 7.8
Jordan as a whole Amman 88,794 100
Note: * Ratio to area of the whole country
Source: Department of Statistics (2015) Jordan Statistical Year Book 2014
Source: Wikimedia commons/Atlas of Jordan
Figure 9.3-1 Map of Governorates in Jordan

9-42
(3) Demography
Most recent data about demographic conditions are as follows:
According to statistics of the population in Jordan, in 2014 the number of Jordan's population is about 6.68 million persons excluding Syrian Refugees. Although the annual population growth rate (Averaged from 2004 to 2014) was 2.2%/year, the population increased sevenfold from that in 1961 due to refugees form Palestine, Iraq and other countries.
On the other hand, according to the most recent results of the Population and Housing Census 2015*, which was conducted in November 2015, the population of Jordan increased drastically to 9 million and 559 thousand persons (female 47% and male 53%). Among them number of Jordanian citizens are about 6.6 million (70%), and that of non-Jordanian are about 2.9 million (30%), which is mostly due to contribution of refugees from Syria, Egypt, Palestine, Iraq, Yemen, Libya etc.
*1) Department of Statistics (2016.6) Jordan in Figures 2015, Jordan Population and Housing Census 2015, 2) UNICEF Jordan
Country Office, Jordan Population and Housing Census, February 22th, 2016
In Table 9.3-2 some basic indicators are shown.
Table 9.3-2 Basic Indicators of Population Indicator Year Value
Population growth rate 1952 - 1961 4.8%
1961 - 1979 4.8%
1979 - 1994 4.4%
1994 - 2004 2.6%
2004 - 2014 2.2%
Male in total population 2014 51.5%
Urban population 2014 82.6%
Population density 2014 75.2 person/km2
Source: Department of Statistics (2015): Jordan Statistical Year Book 2014
As shown in Figure 9.3-2 the Jordanian population pyramid (structure) reflects the youthfulness of the population, around 13% of the population is under 4 years of age, and almost 25% is under 14 years of age, 3% of the population is over 65 years old. 60% of the population is between 15-64 years, representing the dominant group. This last age group represents the demographic opportunity, which provides insights about political and social stability, as well as economic development as this group is the one entering the workforce and contributing to economic growth.

9-43
Source: Department of Statistics (2015) Jordan Statistical Year Book 2014
Figure 9.3-2 Population Pyramid (2014) in Jordan
(4) Races and Religion
The majority of Jordanian are Arabs descended from the various tribes that have migrated to the area over the years from all directions. In addition, there are Caucasians, descendants of Muslim refugees from the Tsarist Russian invasion of the Caucasus in the 19th century, and a much smaller group of Chechens. Jordan also has a small Armenian population.
The official religion is Islam so that accounted for Sunni Muslims (92%). While not exceed followers of other Islamic sects of the Druze (2%). The Christian (6%) of the population, most of which follow the Orthodox Church.
(5) Regional and Governorate Distribution of Population
Table 9.3-3 shows regional and governorate distribution of population.
Jordan’s population is highly urbanized. In 1952, almost 40% of the population lived in urban areas but by 2013 the figure had reached nearly 83%. This has been due to rural to urban migration and the influx of refugees. Urban inhabitants within Amman, Irbid and Zarqa governorates now account for 3.4 million people, comprising more than 60% of the population.

9-44
Table 9.3-3 Regions/Governorates and Distribution of Population
Region/Governorate Area (km2)
Population (2014) Population
density
(Person/km2) Population Ratio (%)*
Urban/Rural
Population
Urban Rural
Central Region 14,400 4,193,200 62.8 3,810,600 382,600 291.2
Amman 7,579 2,584,600 38.7 2,430,100 154,500 341.0
Balqa 1,120 447,200 6.7 321,200 126,000 399.1
Zarqa 4,761 994,500 14.9 940,200 54,300 208.9
Madaba 940 166,900 2.5 119,100 47,800 177.6
North Region 28,953 1,855,600 27.8 1,347,800 505,300 64.1
Irbid 1,572 1,188,100 17.8 985,300 202,800 755.9
Mafraq 26,551 313,700 4.7 123,000 190,700 11.8
Jerash 410 200,300 116500.0 125,500 74,800 488.8
Ajloun 420 153,500 2.3 114,000 37,000 365.8
South Region 45,441 626,200 9.4 352,500 273,700 13.8
Karak 3,495 260,400 3.9 91,100 169,300 74.5
Tafilah 2,209 93,400 1.4 66,700 26,700 42.3
Ma'an 32,832 126,900 1.9 69,600 57,300 3.9
Aqaba 6,905 145,500 2.2 125,100 20,400 21.1
Total 88,794 6,675,000 100 5,510,900 1,161,600
75.2 82.60% 17.40%
Note: * Ratio (%) to total population of the whole country Source: Department of Statistics (2015) Jordan Statistical Year Book 2014
(6) Socio-economic Conditions
Changes in some of socio-economic indicators are shown in Table 9.3.-4.
Per capita Gross National Income (GNI) increased from 2,530 USD (2005) to 4,530 USD (2014). On the
other hand, growth rate of real GDP decreased from 8.2% (2005) to 2.4 % (2014).

9-45
Table 9.3-4 Change of Several Socio-economic Indicators by Year Indicator 2005 2012 2013 2014 2015
Growth rate of population(%) 3.1 3.4 3.1 2.8 2.4
Life expectancy at birth (age) 73 74 74 74 n.a.
Maternal mortality rate (per100,000) 62 59 59 59 58
Mortality rate, infants(per 1,000 live births) 20.8 16.5 16 15.8 15.4
Ratio of undernourished people (% of population) 5.0 5.0 5.0 5.0 5.0
Gross enrollment ratio of higher education (Aged 18
to 23, %) 38.9 47.6 n.a. n.a. n.a.
Adult literacy rate, male aged 15 and over (%) 95.2 98.4 n.a. n.a. n.a.
Adult literacy rate, female aged 15 and over (%) 87 97.4 n.a. n.a. n.a.
Ratio of Unemployment (%) 14.9 12.2 12.6 11.1 n.a.
Human Development Index (World Ranking of
Human Development Index of 2013 was 80th in 188
countries)
0.773 0.746 0.748 0.748 n.a.
GDP(Million USD) 12,589 30,937 33,594 35,827 37,517
Per capita GNI(USD) 2,530 4,210 4,420 4,590 4580
Growth Rate of Real GDP(%) 8.2 2.7 2.8 3.1 2.4
Composition of Industrial Structure(Ratio of GDP, %)
Agriculture 3.1 3.1 3.4 3.8 4.2
Industry 28.6 30.1 29.7 29.8 29.6
Services 68.3 66.8 66.9 66.4 66.2
Ratio of Military expenditure to GDP (%) 4.8 4.3 4.3 4.3 4.3
Nominal exchange rate (JD per USD, Period
Average) 0.71 0.71 0.71 0.71 0.71
Note: n.a. – not available Source: JICA LibraryPortal Site (2016.7) Major Socio-economic Indicators
of Jordan, World Bank (2016) World Development Indicators

9-46
Per capita Gross National Income (GNI) increased from 2,530 USD (2005) to 4,530 USD (2014). On the
other hand, growth rate of real GDP decreased from 8.2% (2005) to 2.4 % (2014).
In 2014 contribution to GDP by agriculture sector is about 4%, and by industrial sector is about 30%. In industrial sector, major activities are mining and production of copper, potassium, phosphate and iron etc., which support construction activities and export. However, major player in Jordan economy is service sector such as tourism industry, which accounts for about 60 % of GDP.
One of the most important factors shaping the household’s social conditions are the household expenditures and income. In Jordan, the average annual household income was about JD 8,842 in 2010, (12,488 USD) which represent a 10.5% increase from income measured in 2008 (JD7911). Gender plays a significant role in determining the level of household expenditure and income. Being a female household head means less income (by JD 1,992) and thus less expenditure by JD 1,677. This situation is referred to as the gender gap (the differences between male and female in all social and economic aspects). Unemployment, underemployment, differences in wages and occupational segregation are the four main factors in the economy that impact women’s level of labor.
In addition, in 2014 unemployment ratio was 11% and that for 15 to 24 years old people showed a higher ratio. Unemployment ratio for female (20.7%) is twofold of that for male (10.1%)
(7) Land use
Land use coverage in Jordan falls into five broad categories: non-cultivated rangelands (93.30%); urban areas (1.89%); forests (1.50%); water surfaces (Dead Sea and Gulf of Aqaba – 0.62%); and, agricultural lands (2.61%). The form of this land use coverage reflects, to a large extent, climate, topography, soils and, most importantly, the availability of water resources. A map of land use and economic activities is shown in Figure 9.3-3.
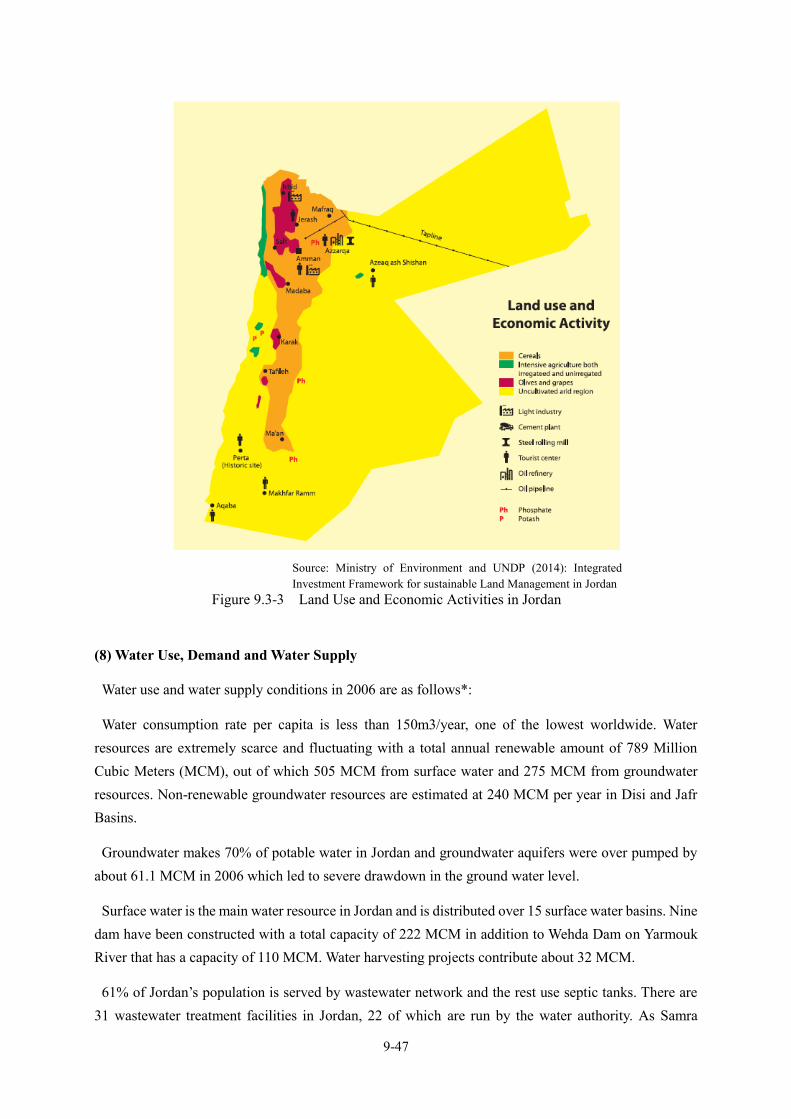
9-47
Source: Ministry of Environment and UNDP (2014): Integrated Investment Framework for sustainable Land Management in Jordan
Figure 9.3-3 Land Use and Economic Activities in Jordan
(8) Water Use, Demand and Water Supply
Water use and water supply conditions in 2006 are as follows*:
Water consumption rate per capita is less than 150m3/year, one of the lowest worldwide. Water resources are extremely scarce and fluctuating with a total annual renewable amount of 789 Million Cubic Meters (MCM), out of which 505 MCM from surface water and 275 MCM from groundwater resources. Non-renewable groundwater resources are estimated at 240 MCM per year in Disi and Jafr Basins.
Groundwater makes 70% of potable water in Jordan and groundwater aquifers were over pumped by about 61.1 MCM in 2006 which led to severe drawdown in the ground water level.
Surface water is the main water resource in Jordan and is distributed over 15 surface water basins. Nine dam have been constructed with a total capacity of 222 MCM in addition to Wehda Dam on Yarmouk River that has a capacity of 110 MCM. Water harvesting projects contribute about 32 MCM.
61% of Jordan’s population is served by wastewater network and the rest use septic tanks. There are 31 wastewater treatment facilities in Jordan, 22 of which are run by the water authority. As Samra

9-48
wastewater treatment plant is the largest in the country and treats about 75.3 % of all generated wastewater.
There is a potential to desalinate 75 MCM of the brackish water from north Dead Sea area.
Water network cover 98% of Jordan’s population and it conveyed 290.6 MCM in 2006. This indicates that the per capita consumption rate is 139 liters /day including all unaccounted water which is about 46.1 liters/day.
Agriculture activities consumed 588.4 MCM (64% of total water consumed) in 2006. About 44.6% of the water for agriculture came from surface water, 41.7 from groundwater, and 13.7% from treated wastewater.
The main industries (e.g. Phosphates, Potash, Fertilizers, etc.) used about 40 MCM from its own wells in 2006.
* Ministry of Environment (2009) The State of Environment Report 2009
On the other hand, above mentioned water use and supply conditions became more severe in 2010*:
In 2010 per capita water consumption is only 147 m3/person/year. Renewable water resources are less than 130 m3/person/year. Current total uses exceed the renewable supply. The difference (the water used that is not renewable) comes from nonrenewable and fossil groundwater extraction and the reuse of reclaimed water. If supply remains constant, per capita domestic consumption is projected to fall to 90 m3/person/year by 2025, putting Jordan in the category of having an absolute water shortage that could constrain economic growth and potentially endanger public health.
Due to the ongoing Syrian situation, the number of Syrian refugees in Jordan is expected to triple to 1.2 million by the end of the year (2014) according to UN officials. This magnifies the stress applied on the water and sanitation services and infrastructure.
* The Hashemite Kingdom of Jordan, Global Environment Fund and UNDP (2015) Jordan’s Third National Communication
on Climate Change.
In addition, due to a rapid increase in urban population, domestic water supply demand is likely to increasing
and irrigation use is decreasing as shown in Figure 9.3-4. As for balance of water supply and demand it has
been disrupting since 2010 and the situation of water deficit in 2010 is expected to expand in 2020 and 2040
as shown in Figure 9.3-5.
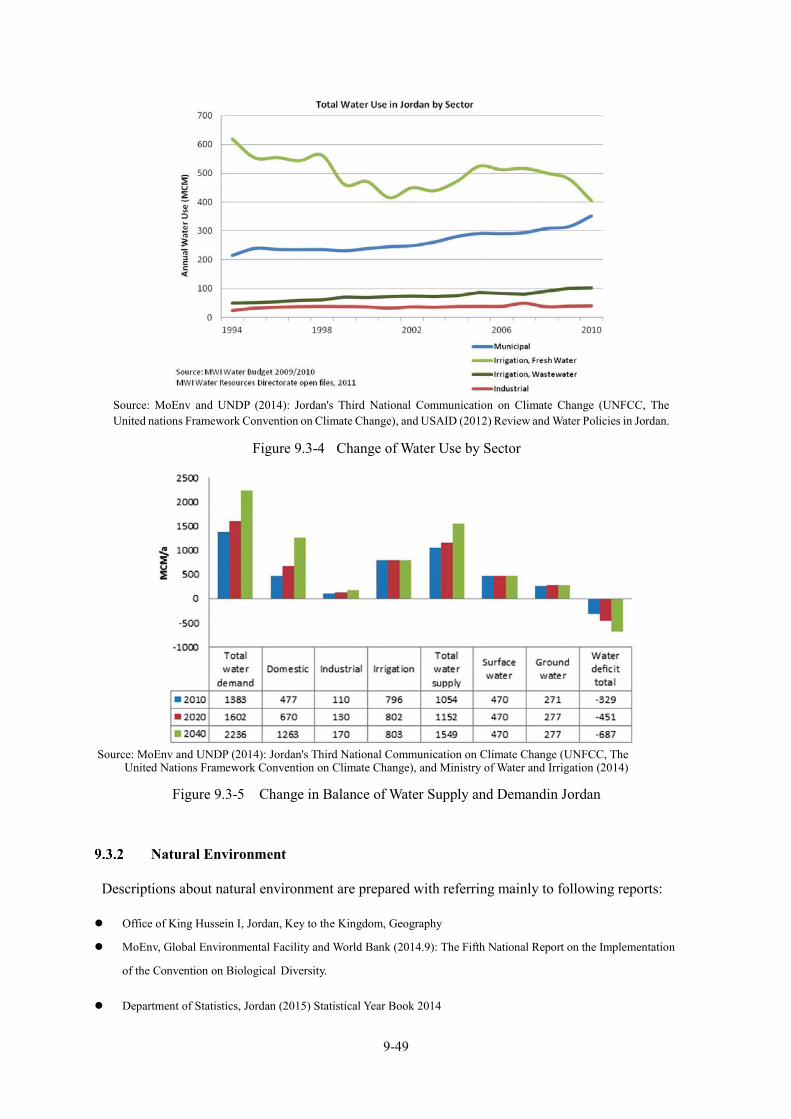
9-49
Source: MoEnv and UNDP (2014): Jordan's Third National Communication on Climate Change (UNFCC, The United nations Framework Convention on Climate Change), and USAID (2012) Review and Water Policies in Jordan.
Figure 9.3-4 Change of Water Use by Sector
Source: MoEnv and UNDP (2014): Jordan's Third National Communication on Climate Change (UNFCC, The
United Nations Framework Convention on Climate Change), and Ministry of Water and Irrigation (2014)
Figure 9.3-5 Change in Balance of Water Supply and Demandin Jordan
Natural Environment
Descriptions about natural environment are prepared with referring mainly to following reports:
Office of King Hussein I, Jordan, Key to the Kingdom, Geography
MoEnv, Global Environmental Facility and World Bank (2014.9): The Fifth National Report on the Implementation
of the Convention on Biological Diversity.
Department of Statistics, Jordan (2015) Statistical Year Book 2014

9-50
Ministry of Environment and UNDP (2014): Integrated Investment Framework for sustainable Land Management in
Jordan
Ministry of Environment and UNDP (2014): Integrated Investment Framework for sustainable Land Management in Jordan
Ministry of Environment (2009) The State of Environment Report 2009
(1) Geographic Features
Topographical Features in Jordan is shown in Figure 9.3-6. Country of Jordan can be broadly divided into three topographic regions.
Source: Ministry of Environment and UNDP (2014): Integrated Investment Framework for Sustainable Land Management in Jordan
Figure 9.3-6 Topographical Features in Jordan
(i) The Jordan Rift Valley (JRV)
The Jordan Valley, which extends down the entire western flank of Jordan, is the country’s most distinctive natural feature. The Jordan Valley forms part of the Great Rift Valley of Africa, which extends down from southern Turkey through Lebanon and Syria to the salty depression of the Dead Sea, where

9-51
it continues south through Aqaba and the Red Sea to eastern Africa. This fissure was created 20 million years ago by shifting tectonic plates.
(ii) The Mountainous Region
The highlands of Jordan separate the Jordan Valley and its margins from the plains of the eastern desert. This region extends the entire length of the western part of the country, and hosts most of Jordan’s main population centers, including Amman, Zarqa, Irbid and Karak. We know that ancient peoples found the area inviting as well, since one can visit the ruins of Jerash, Karak, Madaba, Petra and other historical sites which are found in the Mountain Heights Plateau. These areas receive Jordan’s highest rainfall, and are the most richly vegetated in the country.
(iii) The Eastern (Badi) and Southern Desert
Comprising around 75% of Jordan, this area of desert and desert steppe is part of what is known as the North Arab Desert. It stretches into Syria, Iraq and Saudi Arabia, with elevations varying between 600 and 900 meters above sea level. Climate in the Badia varies widely between day and night, and between summer and winter. Daytime summer temperatures can exceed 40°C, while winter nights can be very cold, dry and windy. Rainfall is minimal throughout the year, averaging less than 50 millimeters annually. Although all the regions of the Badia (or desert) are united by their harsh desert climate, similar vegetation types and sparse concentrations of population, they vary considerably according to their underlying geology.
(2) Climate Conditions
The country’s climate is a result of both its geographical location in the Eastern Mediterranean region and its relief, which ranges from 416m at the Dead Sea shoreline to 1800m in the Southern Highlands.
The climate of Jordan can be categorized into three climatic zones:
(i) The Jordan Rift Valley It has sub-tropical climate, featuring mild winters and very hot summers. The northern part of the valley witnesses relatively good rainfall during the months October to May.
Average rainfall ranges from 350mm/year in the north, to 200mm around the Dead Sea and less than 50mm in the South towards the Red Sea.
(ii) The Northern and Southern Highlands They have rather cool, rainy winters and warm summers. Ajloun receives the most rainfall (more than
600mm/year on average), while rthe rest of the highlands receive between 300 and 200mm. In winter, snowfall is not uncommon.
(iii) The Eastern (Badi) and Southern Desert They have cool winters and very hot summers. Average total rainfall is below 50 mm, and maximum
temperature may exceed 50 °C in the summer. 80 % of the land area of Jordan belongs to this climate zone.

9-52
A map of annual Rainfall in Jordan is shown in Figure 9.3-7.
Source: Ministry of Environment (2009): Fourth National Report on Implementation of
the Convention on Biological Diversity Figure 9.3-7 Map of Annual Rainfall in Jordan
(3) Biological Environment
(i) Plant and Animal Species
The total number of wild species occurring in Jordan is approximated to 4,000 species from terrestrial and marine flora and fauna. Of Jordan’s 2,622 recorded species of vascular plants, representing about 1% of world flora, 100 are endemic, including Iris nigricans, Jordan’s floral emblem. There is a total of 644 animal species of which, 83 are mammal species, including the globally threatened species such as Capra nubiana, Gazella dorcus, Gazella subgutturosa, Gazella
gazelle and Oryx leucoryx. Avifauna composition is especially rich in Jordan because of its geographical location associated with the Great Rift Valley and lying on a major migratory bird route. Key bird species include Geronticus eremita, Chlamydotis macqueenii, Nephron percnopterus, Serinus syriacus and Vanellus gregarius
The Gulf of Aqaba hosts more than 348 species of fish, 151 species of hard corals and 120 species of soft corals, in addition to a variety of invertebrate’s species including snails, crabs and sea worms. A total of three threatened species of sea turtles were recorded in the Gulf of Aqaba. The rate of endemism is considered high among the Red Sea fishes and represents 13.7% of the total fish species recorded with seven species of fishes recognized as endemic to the Gulf of Aqaba. More than 20% of mollusks and echinodermata as well as several species of algae occurring in the Gulf may be endemic.
Freshwater diversity is also high with 15 of species recorded including the endemic Aphanius sirhani. Further, Jordan hosts 110 species of herpeto‐fauna including three species of amphibians, 107

9-53
species of reptiles where the later constitutes of 37 snakes, one tortoise, one terrapin and 68 species of lizards; including the flagship species of the Uromastyx aegyptia and Varanus griseus.
(ii) Biogeographic Zones
Based on the biophysical characteristics prevailing in the country, Jordan is subdivided into four biogeographic zones: Mediterranean, Irano‐Turanian, Saharo‐Arabian and Subtropical Sudanian. The following includes a brief description of the four bio‐geographical zones (regions) in Jordan:
a) Mediterranean Zone
This region is restricted to the highlands extending from Irbid in the north to Ras El‐Naqab in the south in addition to some isolated representation in the mountains of Wadi Rum. The altitude ranges from 700‐1850 m above sea level. The rainfall ranges from 300‐600 mm. The minimum annual temperature ranges from 5‐10º C and mean annual maxima range from 20‐30º C. Soil is dominated by the red Mediterranean soil (terra rosa) and the yellow Mediterranean soil (rendzina). This region comprises the most fertile part of the Kingdom and contains 90 percent of the population.
b) Irano‐Turanian Zone
A narrow strip of variable width that surrounds all the Mediterranean ecozone except in the north. It is characterized by being treeless. The vegetation is mainly small shrubs and bushes such as Artemisia herba‐alba, and Anabasis syriaca. Altitudes range from 500‐700 m, and rainfall ranges from 150‐300 mm. Mean annual minimum temperatures range from 5‐2º C, and mean annual maxima range from 15‐25º C. Soils are mostly calcareous or transported by wind.
c) Saharo‐Arabian Zone
This is the eastern desert or Badia and comprises the largest part of Jordan encompassing almost 80% of its total area. It is flat except for a few hills or small mountains, the result of volcanic eruptions. Altitude ranges between 500‐700 m. The mean annual rainfall ranges from 50‐200 mm, mean annual minimum temperatures range from 15‐2º C and mean annual maxima range from 25‐40 ºC. Soil is mostly poor, either clay, hamada, saline, sandy or calcareous. Vegetation is dominated by small shrubs and small annuals in the wadi beds.
d) Subtropical Sudanian Zone
It starts from the northern part of the Dead Sea and ends at the tip of the Gulf of Aqaba in the south along the Dead Sea depression and Wadi Araba. The most important characteristic of this region is the altitude, considered the lowest point on earth (410 m below sea level near the Dead Sea). Rainfall ranges from 50‐100 mm, the mean annual minimum temperature ranges from 10 to 29 oC, and mean annual maximum temperatures range from the minimal 20 to 35 ºC. Soils are mostly alluvial, saline, sandy and granitic. The only inland sand dunes are in this region.
The vegetation is characterized by a tropical tree element such as Acacia spp. and Ziziphus spina‐

9-54
christi in addition to some shrubs and annual herbs. The following map demonstrates the four bio‐geographic regions of Jordan:
Source: MoEnv, Global Environmental Facility and World Bank (2014.9) Fifth National Report on Biodiversity
Figure 9.3-8 Biogeographic Zones in Jordan
(iii) Vegetation Types
The classification of Jordan biodiversity is based on its eco‐regions, ecosystems and vegetation types. The vegetation map of Jordan developed by Al‐Eisawi in 1985 and 1996 represent the prime scientific reference to the classification of floral biodiversity. It was also the biological foundation mainly used in the development of the national protected areas network in its revised version of 2009 as shown in Figure 9.3-9. The original number of 12 vegetation types was updated to become 13 in light of a strategic review undertaken by RSCN in cooperation with MoEnv, academia and other international partners.

9-55
Source: MoEnv, Global Environmental Facility and World Bank (2014.9) Fifth National Report on Biodiversity
Figure 9.3-9 Vegetation Map of Jordan
(iv) Important and Biodiversity Areas (IBAs)
27 IBAs were identified with their associated number of bird species. Table 9.3-5 shows the key attributes of Jordan IBAs:
Table 9.3-5 Features of IBAs Item Number of Birds
Total number of birds 329 Globally threatened birds 10 Land birds 226 Seabirds 24 Migratory 270 Water birds 100 Number of IBAs 27 Number of EBAs 1 Levantine mountains
Source: MoEnv, Global Environmental Fund and World Bank (2014.9) Fifth National Report on Biodiversity

9-56
(4) Protected Areas
The Table 9.3-6 and Figure 9.3-10 illustrate the national progress made on the establishment of protected areas as identified by the 2009 national protected areas network report:
Table 9.3-6 List of Protected Areas
No Name of Protected Areas Date of establishment
Area (km2)
1 Shoumari Wildlife Reserve 1975 21 2 Azraq Wetland Reserve 1978 12 3 Mujeb Biosphere Reserve 1985 212 4 Ajloun Forest Reserve 1987 12 5 Dana Biosphere Reserve 1989 292 6 Wadi Rum World Heritage Site 1997 729 7 Aqaba Marine Park 1997 2.5 8 Dibbin Forest Reserve 2004 8.5 9 Yarmouk Forest Reserve 2010 21 10 Qatar Nature Reserve 2011 110 11 Fifa Nature Reserve 2011 26
Total 1,420
Source: MoEnv, Global Environmental Facility and World Bank (2014.9) Fifth National Report on Biodiversity

9-57
Source: MoEnv, Global Environmental Facility and World Bank (2014.9) Fifth National Report on Biodiversity Figure 9.3-10 Protected Areas in Jordan
Data of the above mentioned environmentally sensitive areas from (i) to (v) are integrated and is shown in Figure 9.3-11.
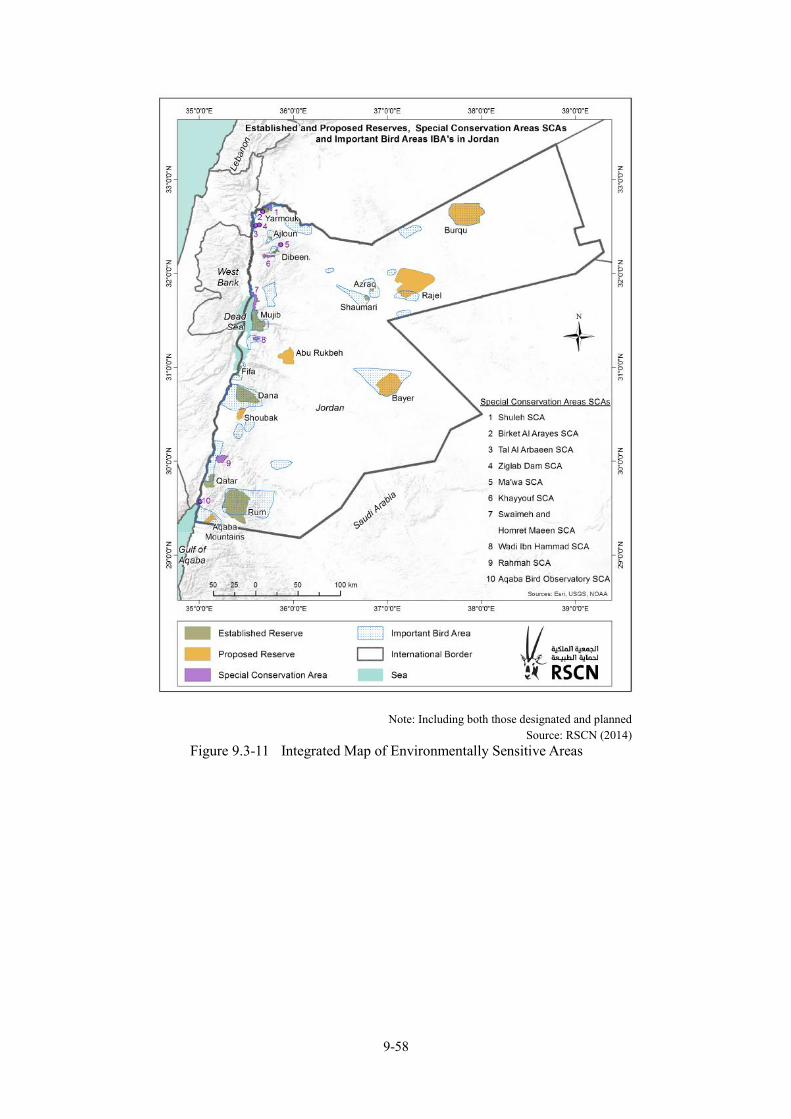
9-58
Note: Including both those designated and planned Source: RSCN (2014)
Figure 9.3-11 Integrated Map of Environmentally Sensitive Areas
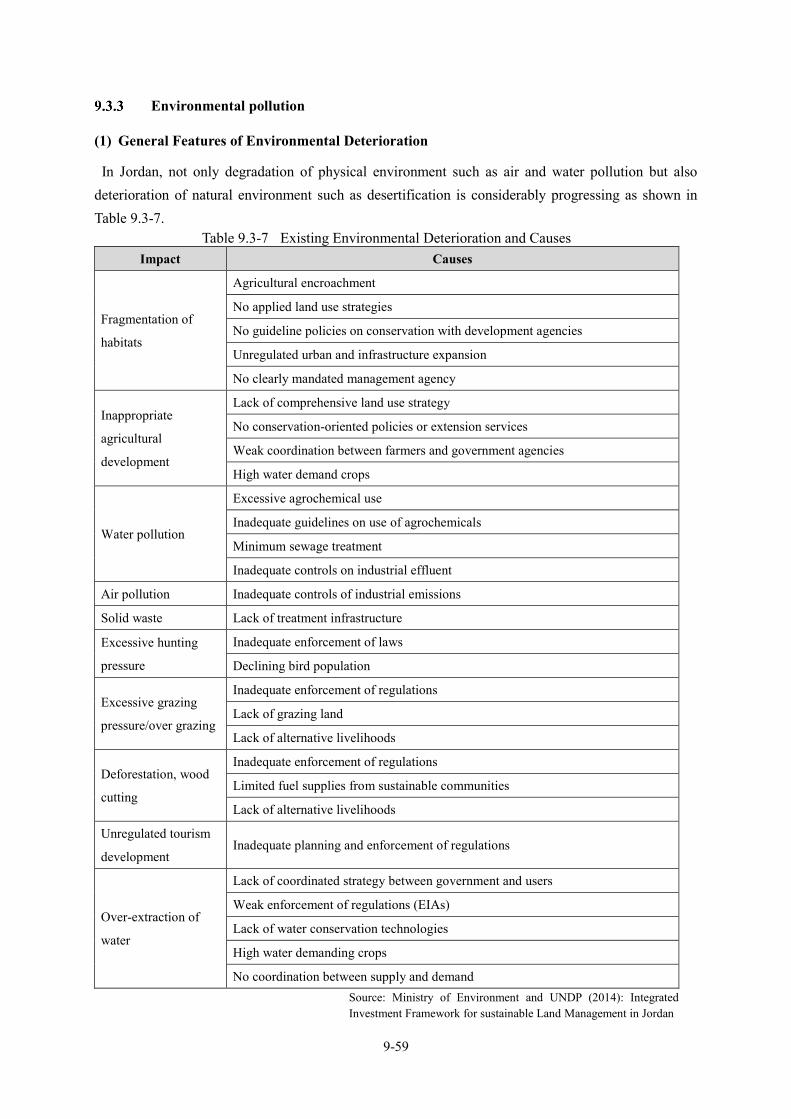
9-59
Environmental pollution
(1) General Features of Environmental Deterioration
In Jordan, not only degradation of physical environment such as air and water pollution but also deterioration of natural environment such as desertification is considerably progressing as shown in Table 9.3-7.
Table 9.3-7 Existing Environmental Deterioration and Causes Impact Causes
Fragmentation of
habitats
Agricultural encroachment
No applied land use strategies
No guideline policies on conservation with development agencies
Unregulated urban and infrastructure expansion
No clearly mandated management agency
Inappropriate
agricultural
development
Lack of comprehensive land use strategy
No conservation-oriented policies or extension services
Weak coordination between farmers and government agencies
High water demand crops
Water pollution
Excessive agrochemical use
Inadequate guidelines on use of agrochemicals
Minimum sewage treatment
Inadequate controls on industrial effluent
Air pollution Inadequate controls of industrial emissions
Solid waste Lack of treatment infrastructure
Excessive hunting
pressure
Inadequate enforcement of laws
Declining bird population
Excessive grazing
pressure/over grazing
Inadequate enforcement of regulations
Lack of grazing land
Lack of alternative livelihoods
Deforestation, wood
cutting
Inadequate enforcement of regulations
Limited fuel supplies from sustainable communities
Lack of alternative livelihoods
Unregulated tourism
development Inadequate planning and enforcement of regulations
Over-extraction of
water
Lack of coordinated strategy between government and users
Weak enforcement of regulations (EIAs)
Lack of water conservation technologies
High water demanding crops
No coordination between supply and demand Source: Ministry of Environment and UNDP (2014): Integrated Investment Framework for sustainable Land Management in Jordan

9-60
(2) Air Pollution
Air pollution is a localized, but significant, issue in Jordan. Air quality is deteriorating in urban areas, such as Amman and Aqaba. Air pollution comes from both stationary and mobile sources, such as industry and vehicles, as well as natural sources such as sand and dust storms. The most damaging source, however, is due to the growing fleet of vehicles that emit high levels of pollutants. Poorly maintained vehicles consume poor quality fuels. Vehicle emissions regulations are poorly enforced, and air quality monitoring stations are few and poorly maintained and funded.
Under the supervision of MoEnv ambient air quality monitoring are conducted for items of SO2, NO2,
PM10, PM2.5 etc. at 29 monitoring stations. In addition, monitoring at emission sources is also conducted at cement factory, bromine factory and thermal power plants (4 IPPs).
On the other hand, in Aqaba Special Economic Zone (ASEZ), where thermal power plants, cement and kali and potassium production factories are located is under the supervision of ASEZA. Thus, air quality monitoring for items of SO2, NO2, PM10 and others has been carried out by cooperation with EU since 2007.
(3) Water Pollution As mentioned in 9.3.3 (3), Jordan has been facing problems of water with both quantity and quality.
Surface water quality is considerably deteriorated by the increase in salinity and pollution resulting in being not suitable to drinking.
Groundwater quality is also deteriorated due to increase in salinity and subject to salinity monitoring in nationwide.
Domestic wastewater and industrial wastewater are also considerably polluted. In addition, dilution of raw wastewater by river water is difficult due to lack of amount. Therefore, the role of sewage treatment and wastewater treatment is important to cope with keeping cleaner water resources. Up to now Water Authority of Jordan (WAJ) has constructed more than 100 facilities of sewage and wastewater treatment in Jordan, but not enough especially in rural area.
In Aqaba Bay area, there is strict regulation of direct discharge to sea area to conserve marine environment including coral leaf by ASEZA. Water quality monitoring has been conducting at 11 stations in coatsl area.
(4) GHG Emissions Climate change is one of major threats to environment in Jordan, since ecosystem productivity and
water resources are highly dependent on the hydrological cycle. It is known that greenhouses gases (GHG) emission is also one of main causes to give rise climate change through global warming.
The most important GHG directly emitted by humans include CO2, CH4, nitrous oxide (N2O), sulphur
hexafluoride (SF6), perfluorocarbons (PFCs) and hydrofluorocarbons (HFCs).

9-61
Jordan’s share in global greenhouse gas emissions was 28,717 Gg of CO2 eq., which is 28.72 million ton (Mt) of CO2 equivalent in 2006. However, Jordan’s bulk share of GHGs represents only around 0.06% of global total.
Among GHG emissions emission of CO2 emission accounts for about 84% in 2006 as shown in Table 9.3-8.
Table 9.3-8 GHG Emissions by Gases in Jordan (2006)
GHG Gg in CO2
Equivalent % Main sources of GHG
CO2 24,003 83.6 Main source of CO2 is combustion of fossil fuels
(Contribution of energy sector at 87.1%).
Methane (CH4) 147 10.8 Main sources are decomposition of organic
substances from animals and plants
Nitrous Oxide 5,248 5.5 Mainly from agriculture, which were
accountable for 80% of the total N2O emissions
Source: The Hashemite Kingdom of Jordan (2014) Jordan’s Third National Communication on Climate Change (2014)
As shown in Table 9.3-9 and Figure 9.3-12, energy (including transport)-related activities have the
dominant share of GHG emissions in Jordan totaling 73% followed by almost close percentage for both
waste and industrial activities totaling 10% and 9% respectively. Activities from agriculture and LULUCF
(land use, land use change and forestry) have the lowest, also close percentages, of 5% and 3.0 %
respectively.
Table 9.3-9 GHG Emissions in Jordan by Sector (2006) 1 Energy 20,938 72.9
2 Industrial processes 2,550 8.9
3 Agriculture 1,318 4.6
4 Waste 3,045 10.6
5 LULUCF (Land Use, Land Use
Change and Forestry) 866 3.0
Source: The Hashemite Kingdom of Jordan (2014) Jordan’s Third National Communication on Climate Change (2014)

9-62
Source: The Hashemite Kingdom of Jordan (2015) Intended Nationally Determined Contribution (INDC)
Figure 9.3-12 GHG Emissions by Sector (2006)
The GHG emissions are expected to grow according to the 2006 baseline scenario to 38,151 Gg, 51,028 Gg and 61,565 Gg of CO2 eq. in the years 2020, 2030 and 2040 respectively. Contribution of the energy sector and sub-sectors as the leading emitter of GHGs is expected to increase in the future from 73 % of total emissions in the year 2006 to 83 % in the year 2040. Thus, it is anticipated to focus the mitigation efforts of the country on this sector.
(5) Solid Wastes
According to the SOER 2009, solid wastes generated in Jordan are the domestic wastes, solid waste from agricultural sector, medical and hazardous wastes. Total solid waste generated in Jordan is about 3,850 ton/day out of which 2,000 tons are generated in the greater Amman area. In terms of consumption, 52% of all solid waste is organics and this percentage increase in the areas outside Amman. Currently 20 dump sites exist in Jordan. Except Ghabawi land fill, all others do not meet the requirements for a sanitary landfill. One hazardous waste land fill site exit in Swaqa, 125 km south Amman and it receives hazardous wastes generated in factories, hospitals, universities, and research centers. Wastes are neutralized and chemically treated and then kept in lined ponds.
Agricultural waste is characterized by the high number of plastic bags generated. The number of plastic “green” houses in the Jordan valley is around 40 thousand.
Medical waste management in Jordan include separation, packaging in colored containers, transportation and then incinerated at temperatures from 900 to 1,000 Co.

9-63
SEA and IEE of Generation Development Plan
Targeted Generation Development Plan
In this Study following eight generation development plans are subject to conducting IEE.
1) Thermal power generation – Gas fired (Natural gas/LNG)
2) Thermal power generation – Oil fired (Heavy fuel oil/diesel)
3) Thermal power generation – Coal fired
4) Thermal power generation – Oil shale fired
5) Hydropower generation – Sea water pumping storage
6) Wind power generation
7) Solar power generation
8) Power transmission and distribution
Among the above, power transmission and distribution is included as an essential component to power generation development plan.
Checklist of Environmental and Social Considerations for SEA-1
As mentioned in 9.2.6, in the formulation of master plan two kind of SEAs (Provisionally as SEA-1 and SEA-2) are required depending upon whether information of the site location is included or not. In this master plan study the site location data are not included in generation development plans. Thus, the required SEA is considered to correspond to the SEA-1.
(1) Items for Confirmation of Environmental and Social Considerations (ESC) for SEA/IEE in the JICA Guidelines
In the JICA guidelines, environmental checklist was proposed to evaluate environmental and social impacts
for the master plan Study as well as for the project level studies.
In JICA Environmental Checklist the check items for ESC are (1) Permit and Explanation, (2) Pollution Control, (3) Natural Environment, (4) Social Environment and (5) Others. Those items are summed up and shown with sectors relevant to generation development plans in Table 9.4.1. In the IEE, ESCs for the PPPs and/or proposed projects should be conducted comprehensively for all items. Results of confirmation of ESCs for generation development plans by the JICA environmental checklist is compiled into matrix expression of each check item and each plan and is shown in Table 9.4-1 and Appendix 9.4-1

9-64
Table 9.4-1 Summary of JICA Environmental Checklist relevant to Electric Sector
Source: JICA Environmental Checklist (2010)
(2) Items to be re-considered in SEA/IEE of the Generation Development Plans
However, at earlier stage of the preparation generation development plans, contents of the plans are mostly composed of required conditions inherit in generation development as shown in Table 9.4-2.
1 2 3 4 5 6 7 10 11 13 14
Min
ing
Indu
stry
Ther
mal
Pow
er S
tatio
n
Hyd
ropo
wer
Sta
tions
,D
ams
and
Res
ervo
irs
Geo
ther
mal
Pow
erSt
atio
n
Oth
er E
lect
ricG
ener
atio
n
Pow
er T
rans
mis
sion
and
Dis
tribu
tion
Line
s
Roa
ds
Ports
and
Har
bors
Riv
er a
nd S
and
Eros
ion
Con
trol
Was
te M
anag
emen
t
Wat
er S
uppl
y
Industry
EIA and Environmental Permits 〇 〇 〇 〇 〇 〇 〇 〇 〇 〇 〇
Explanation to the Local Stakeholders 〇 〇 〇 〇 〇 〇 〇 〇 〇 〇 〇
Examination of Alternatives 〇 〇 〇 〇 〇 〇 〇 〇 〇 〇 〇
Air Quality 〇 〇 〇 〇 〇 〇 〇 〇
Water Quality 〇 〇 〇 〇 〇 〇 〇 〇 〇 〇 〇
Wastes 〇 〇 〇 〇 〇 ○ 〇 〇 〇 〇
Soil Contamination 〇 〇
Noise and Vibration 〇 〇 〇 〇 〇 〇 〇 〇
Subsidence 〇 〇 〇 〇 〇 〇 〇
Odor 〇 〇 〇 〇 〇 〇
Sediment 〇
Protected Areas 〇 〇 〇 〇 〇 〇 〇 〇 〇 〇 〇
Ecosystem 〇 〇 〇 〇 〇 〇 〇 〇 〇 〇 〇
Hydrology 〇 〇 〇 〇 〇 〇
Topography and Geology ○ 〇 〇 〇 〇 〇 〇 〇
Management of Abandoned Sites 〇
Resettlement 〇 〇 〇 〇 〇 〇 〇 〇 〇 〇 〇
Living and Livelihood 〇 〇 〇 〇 〇 〇 〇 〇 〇 〇 〇
Heritage 〇 〇 〇 〇 〇 〇 〇 〇 〇 〇 〇
Landscape 〇 〇 〇 〇 〇 〇 〇 〇 〇 〇 〇
Ethnic Minorities and IndigenousPeoples
〇 ○ 〇 〇 〇 〇 〇 〇 〇 〇 〇
Working Conditions 〇 ○ 〇 〇 〇 〇 〇 〇 〇 〇 〇
4 SocialEnvironment
Check items
Power Generation and Transmission Infrastructure
1 Permits andExplanation
2 PollutionControl
3 NaturalEnvironment
Impact during construction 〇 〇 〇 〇 〇 〇 〇 〇 〇 〇 〇
Accident Prevention Measures 〇 〇 〇 〇
Monitoring 〇 〇 〇 〇 〇 〇 〇 〇 〇 〇 〇
5 Others
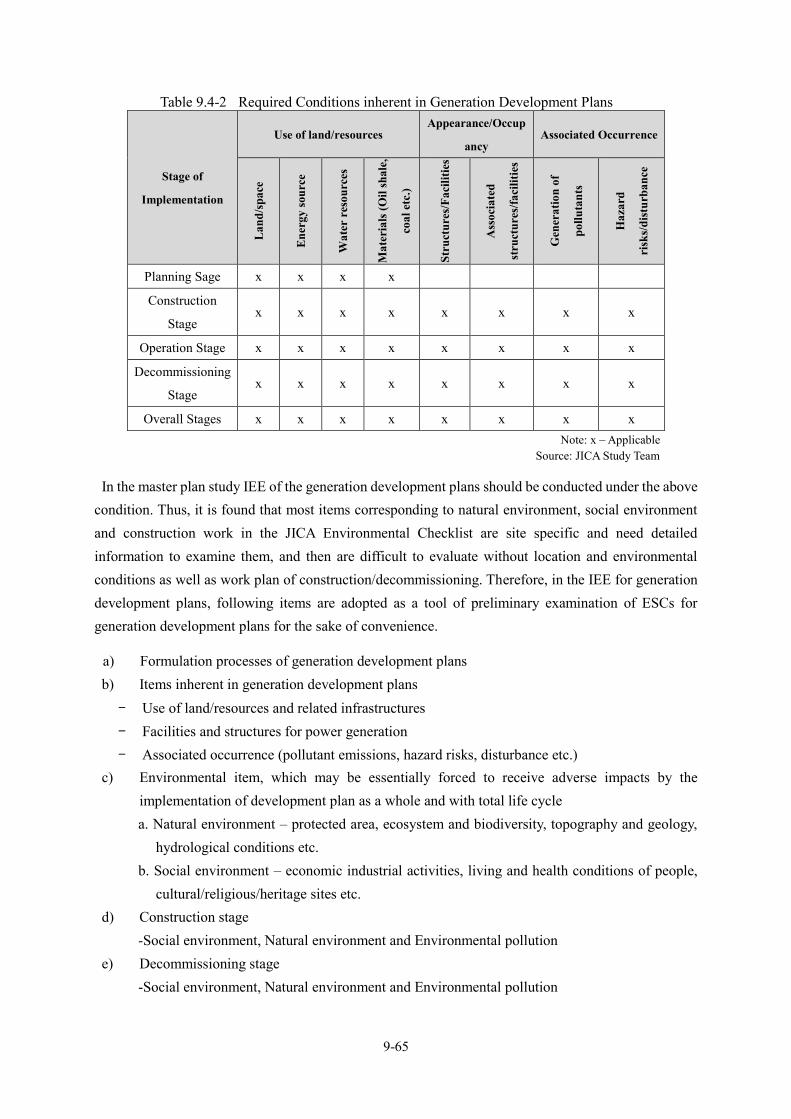
9-65
Table 9.4-2 Required Conditions inherent in Generation Development Plans
Stage of
Implementation
Use of land/resources Appearance/Occup
ancy Associated Occurrence
Lan
d/sp
ace
Ene
rgy
sour
ce
Wat
er r
esou
rces
Mat
eria
ls (O
il sh
ale,
coal
etc
.)
Stru
ctur
es/F
acili
ties
Ass
ocia
ted
stru
ctur
es/fa
cilit
ies
Gen
erat
ion
of
pollu
tant
s
Haz
ard
risk
s/di
stur
banc
e
Planning Sage x x x x
Construction
Stage x x x x x x x x
Operation Stage x x x x x x x x
Decommissioning
Stage x x x x x x x x
Overall Stages x x x x x x x x Note: x – Applicable
Source: JICA Study Team
In the master plan study IEE of the generation development plans should be conducted under the above condition. Thus, it is found that most items corresponding to natural environment, social environment and construction work in the JICA Environmental Checklist are site specific and need detailed information to examine them, and then are difficult to evaluate without location and environmental conditions as well as work plan of construction/decommissioning. Therefore, in the IEE for generation development plans, following items are adopted as a tool of preliminary examination of ESCs for generation development plans for the sake of convenience.
a) Formulation processes of generation development plans b) Items inherent in generation development plans
- Use of land/resources and related infrastructures - Facilities and structures for power generation - Associated occurrence (pollutant emissions, hazard risks, disturbance etc.)
c) Environmental item, which may be essentially forced to receive adverse impacts by the implementation of development plan as a whole and with total life cycle a. Natural environment – protected area, ecosystem and biodiversity, topography and geology,
hydrological conditions etc. b. Social environment – economic industrial activities, living and health conditions of people,
cultural/religious/heritage sites etc. d) Construction stage
-Social environment, Natural environment and Environmental pollution e) Decommissioning stage
-Social environment, Natural environment and Environmental pollution

9-66
(3) Checklist for Preliminary Examination of the Generation Development Plans in SEA (PPP level)
Based on the items mentioned in 9.4.2 (3), tabulated checklist for preliminary examination of the generation development plans was prepared. In Table 9.4-3 the checklist is shown assuming oil shale power generation. In the table rough evaluation of anticipated adverse environmental impacts due to generation development plan can be identified and evaluated roughly. Evaluation of the impacts is according to following rating: a) A - Item with significant adverse impact is anticipated. b) B - Item with not significant but considerable adverse impact is anticipated. c) C - (i) Item that adverse impact is unknown at present. However, it needs to re-examine extent
of impact later. (ii) Item that little impact is anticipated at present. However, there is a possibility to increase in extent of impact later.
d) D – Item with no or negligible impact is anticipated.
Table 9.4-3 Checklist for Preliminary Examination in SEA (PPP level) Check Items relevant to
Generation Development Plan
Check Items of
Environmental Impacts Rating* Reasons**
(1) Planning Process
1 Contents of PPPs (Policy/Plan/Program) including technical,
economic and financial aspects, and alternatives C Maturity of technology, cost etc.
2 Baseline Environmental Information C Distribution data of oil shale mining
in Jordan
3 Consistency with Upper PPPs/Other development PPPs C Tourism development plan, regional
environmental management plan
4 Consultation with relevant Stakeholders C Stakeholders to be subjected
5 Information disclosure C Contents of disclosure and timing
6 Permit/approval C
Procedures of approval, responsible
agencies (NEPCO, MEMR, MoEnv,
MoPI, ASEZA etc.)
(2) Items inherent in the Generation Development Plan (Operation stage, without site location)
1) Land/resource/related infrastructure
1 Use of land/space/Right-of-
Way
Land acquisition, resettlement,
leasing, easement/ wayleaves,
migration of population
A Use of oil shale mining in Jordan
2 Use of energy resources
Fuel, mineral resources (oil
shale etc.) and solar and wind
resources etc.
A Extraction of shale oil and power
generation by burning

9-67
3
Use of water resources
(surface and underground
water, wastewater)
Surface water, groundwater and
wastewater A
Process, cooling, wastewater
treatment, sprinkling ash etc.
4
Associated
structures/facilities relating
to storage, transport etc.
Hazardous waste
storage/disposal sites, gas
pipeline etc.
B Storage of ash, reservoir, power
plant and related facilities
2) Generation of Pollutants, Risk, Disturbance etc.
1 Emission of air pollutants Air quality A Air pollutants including toxic
/hazardous components
2 Discharge of wastewater
including thermal effluents Water quality B
Water pollutants including toxic
/hazardous components
3 Generation of solid waste
Storage and disposal of
industrial solid waste, hazardous
waste etc.
A Solid wastes including toxic
/hazardous components
4 Generation of noise and
vibrations
Ambient noise, low frequency
vibration B
Noise and vibration by extraction
and burning
5 Emission of greenhouse
gases (CO2, CH4 etc.) Global warming, climate change A Emission of CO2, CH4 etc.
6
Movement of
pollutants/waste, cross-
border resource and
migration
Transboundary pollution B Transboundary pollution by air
pollutants
7 Hazards/Disturbance Accidents etc. A Safety and security management
extraction and power generation
(3) Impacts due to Electric Generation Development Plan as a whole (Site specific, based on detailed plan)
1) Natural Environment
Protected areas, Important Bird
and Biodiversity Area (IBA),
Special Conservation Area etc.
C In general site specific
2) Social Environment
Living and health conditions of
local communities and Jordan
people
C In general site specific
3) Construction Work Pollution (Air, water, noise and
vibration, solid waste etc.) C Based on detailed plan
4) Decommissioning Pollution (Air, water, noise and
vibration, solid waste etc.) C Based on detailed plan
Note 1: Assuming thermal power generation by oil shale burning. Note 2: * Rating – Based on evaluation of the impacts described above.
Source: JICA Study Team

9-68
Regarding the Checklist for Preliminary Examination in SEA (PPP level) with each generation development plan is shown in Appendix 9.4.2.
(4) Comparison of the Results of SEA Scoping of Generation Development Plans
Preliminary examination for eight generation development plans was conducted and results is compiled in Table 9.4-4.
Table 9.4-4 Comparison of the Results of SEA Scoping of Generation Development Plans
Check Items relevant to
Generation Development
Plan
Check Items of
Environmental Impacts
Thermal Power
Hyd
ropo
wer
Renewa
ble
Energy
Tra
nsm
issi
on/ D
istr
ibut
ion
Gas
Oil
Coa
l
Oil
Shal
e
Win
d
Sola
r
(1) Planning Process
1
Contents of PPPs (Policy/Plan/Program) including
technical, economic and financial aspects, and
alternatives
C C C C C C C C
2 Baseline Environmental Information C C C C C C C C
3 Consistency with Upper PPPs/Other development PPPs C C C C C C C C
4 Consultation with relevant Stakeholders C C C C C C C C
5 Information disclosure C C C C C C C C
6 Permit/approval C C C C C C C C
(2) Items inherent in the Generation Development Plan (Without location and environmental baseline data)
1) Land/resource/related infrastructure
1 Use of land/space/Right-
of-Way
Land acquisition,
resettlement, leasing,
easement/ wayleaves,
migration of population
B B A A B B B B
2 Use of energy resources
Fuel, mineral resources (oil
shale etc.) and solar and
wind resources etc.
A A A A A D D D
3
Use of water resources
(surface and underground
water, wastewater)
Surface water, groundwater
and wastewater A A A A A C C C
4
Associated
structures/facilities
relating to storage,
transport etc.
Hazardous waste
storage/disposal sites, gas
pipeline etc.
A A A A B D D D

9-69
2) Generation of Pollutants, Risk, Disturbance etc.
1 Emission of air pollutants Air quality B A A A D D D D
2
Discharge of wastewater
including thermal
effluents
Water quality A A A A B D D D
3 Generation of solid waste
Storage and dis posal of
industrial solid waste,
hazardous waste etc.
B B A A A C C C
4 Generation of noise and
vibrations
Ambient noise, low
frequency vibration B B B B B C C C
5 Emission of greenhouse
gases (CO2, CH4 etc.)
Global warming, climate
change B A A A D D D D
6
Movement of
pollutants/waste, cross-
border resource and
migration
Transboundary pollution A A A A D D D D
7 Hazards/Disturbance Accidents etc. B B B B B B B B
(3) Impacts due to Electric Generation Development Plan as a whole (Site specific, based on detailed plan)
1) Natural Environment
Protected areas, Important
Bird and Biodiversity Area
(IBA), Special
Conservation Area etc.
C C C C C C C C
2) Social Environment
Living and health
conditions of local
communities and Jordan
people
C C C C C C C C
3) Construction Work
Pollution (Air, water, noise
and vibration, solid waste
etc.)
C C C C C C C C
4) Decommissioning
Pollution (Air, water, noise
and vibration, solid waste
etc.)
C C C C C C C C
Note: Ratings are same as those in Table 9.4-3 Source: JICA Study Team

9-70
Initial Environmental Examination (IEE) of Generation Development Plans
In this section conduct the IEE of each generation development plan by assuming the implementation of the plan (the project level).
(1) Contents and Procedures of the IEE in the SEA -1 of the Generation Development Plans
Procedures of the IEE in the SEA-1 are almost the same as that for the project. Major difference with the IEE between Project and Plan is whether the feedback for revision and/or correction of the plan is capable or not. The role of the IEE in the SEA-1 is at first to identify and evaluate roughly anticipated impacts due to
the plan, to make clear necessary data and information, and to consider proper mitigation measures. Then, the results of the IEE should be fed back to the plan for revision or correction complying with required environmental and social considerations. The purpose and contents of the IEE in the master plan study is as follows:
a) To make clear anticipated activities generated by the generation development plan for each implementing stage (planning, construction, operation and decommissioning stage);
b) To set the environmental items considering both the JICA Guidelines and Jordanian legislations as well as existing environmental conditions in Jordan in order to grasp the whole features of impacts on social environment, natural environment and environmental pollution;
c) To express extent of anticipated impacts through environmental impact matrices by comparing anticipated activities with environmental items one by one;
d) To conduct preliminary scoping for each plan;
-identify and evaluate anticipated impacts for each environmental item. The evaluation should be based on the evaluation criteria according to the JICA Guidelines. However, there will be some difficulties with the identification and evaluation accompanied with immaturity of the plan such as lack of location data and contents. -Based on the above, to compile further necessary data and information to be collected, and desirable mitigation measures, which are available. In Figure 9.4-1 procedures of IEE in SEA-1 is shown.

9-71
Note: Blue colored arrows indicate possibility of feedback to PPPs
Source: JICA Study Team Figure 9.4-1 Procedures of IEE in SEA
(2) Setting of Environmental Components and Items for IEE
As mentioned in 9.4.1 (1), to grasp whole features of possible environmental impacts caused by the
project, it is necessary to identify and evaluate environmental component and item, which compose of
environmental and social considerations, one by one and to integrate the impacts.
According to the JICA Guidelines for Environmental and Social Considerations, possible impacts to
be assessed include those on human health and safety, as well as on the natural environment, which are
transmitted through air, water, soil, waste, accidents, water usage, climate change, ecosystems, fauna
and flora, including trans-boundary or global scale impacts. These also include social impacts, including
migration of population and involuntary resettlement, local economy such as employment and livelihood,
utilization of land and local resources, social institutions such as social capital and local decision-making
institutions, existing social infrastructures and services, vulnerable social groups such as poor and
indigenous peoples, equality of benefits and losses and equality in the development process, gender,
children’s rights, cultural heritage, local conflicts of interest, infectious diseases such as HIV/AIDS, and
working conditions including occupational safety.
In addition to the direct and immediate impacts of projects, the derivative, secondary, and cumulative impacts as well as impacts associated with indivisible projects will also be assessed with regard to environmental and social considerations, so far as it is rational to do so.
Core Parts of IEE in SEA
Examine Further Necessary Information and Mitigation
Measures
Necessary Considerations for Implementation of PPPs
including incorporation of SEA system
Legislation of Jordan / JICA
Guidelines
Environmnetal Baseline Data
Collection
PPPs of Electric Power
Sector
Existing Environmnetal Conditions Anticipated Activities
Identify and Evaluate Negative Impacts

9-72
In this examination by taking into consideration the JICA Guidelines, and relevant laws and regulations
of Jordan, together with environmental condition of Jordan, three environmental components and 37
items (Social Environment 17, Natural environment 9, and Environmental pollution 11) as indicators
expressing environmental and social conditions as shown in Table 9.4.5. In the table the impacts on
"Gender" and "Children's Right" might be related to all items of social environment.
Table 9.4-5 Selected Environmental Items Environmental item Remarks
(1) Social Environment
1 Involuntary Resettlement (Land
Acquisition and Resettlement)
Land acquisition and/or resettlement to secure Right of
Way and land for transport related facilities and structures
2 Local economy such as employment and
livelihood etc. Situation of employment and livelihood etc.
3 Energy use Fuels and minerals for energy sources
4 Water use Surface and groundwater use, treated water use,
desalination
5 Land use and utilization of local resources Change of land use and utilization of local resources
6
Social institutions such as social
infrastructure and local decision-making
institutions, a split of communities
Social infrastructure and local decision-making
institutions, split of communities
7 Existing social infrastructures and services Other than Transport infrastructures and services
8 The poor, refugees, indigenous of ethnic
people
1) Peoples living in slum areas and below poverty level, 2)
dignity, human rights, economics and cultures of ethnic
minority group
9 Misdistribution of benefit and damage Equality of benefits and losses and equality involved in
development process
10 Local conflict of interests Possible cause for destruction of community structures
11 Cultural property and heritage Cultural, religious, archaeological and heritage sites
12 Fishing Rights, Water Rights and Rights of
Common Existence of rights ownership
13 Public health and Sanitation Health condition, prevalence of diseases and sanitary
condition
14 Infectious diseases such as HIV/AIDS
Other developing countries infection of HIV/AIDS were
often reported due to contact of workers with HIV/AIDS
affected people at their camp.
15 Working condition Including occupational safety
16 Hazard/risk (disaster, security) Including cyclone, seismicity, free from danger (safety and
security)

9-73
17 Accidents Traffic accidents and accidents during construction work
(2) Natural Environment
18 Topography and Geology Specific/valuable feature of topography and geology
19 Soil erosion/sand movement Susceptibility to erosion or landslide
20 Movement of water/Hydrological situation 1) River and canal flow, 2) storm-water drainage water
conditions
21 Coastal zone Mediterranean and Red Sea coastal zone
22 Environmentally sensitive areas (Protected
Areas, IBAs etc.)
1) National Parks, Nature Reserves, Bird Sanctuaries etc.
2) Praks1) Valuable and endangered species, 2) Trees and
greens along the roads and surrounding area
23 Flora, Fauna, Ecosystem and Biodiversity 1) Valuable and endangered species, 2) Ecosystem and
biodiversity
24 Landscape and visual amenity Esthetic value of green area and landmarks
25 Micro-climate Change of local climate condition
26 Global Warming/Climate Change Greenhouse gas emissions from vehicles and construction
machines
(3) Environmental pollution
27 Air pollution
Air pollutants emissions such as NOx and PM from
generation development activities and
construction/decommissioning work
28 Water Pollution
Discharge of water pollutants to waterbodies from
generation development activities and
construction/decommissioning work
29 Soil contamination Contamination of toxic materials in soil
30 Bottom sediment contamination Contamination of toxic materials in bottom sediment of
water bodies
31 Solid waste Solid waste from generation development activities and
construction/decommissioning work
32 Noise and Vibration Noise and vibration generation development activities and
construction/decommissioning work
33 Ground Subsidence Situation of foundation and pumping up of groundwater
34 Offensive odor Bad smell from generation development activities and
construction/decommissioning work
35 Sunshine inhibition Blocking sunshine due to generation development
activities and construction/decommissioning work
36 Electromagnetic interference Interference with receiving radio wave
37 Safety from Electromagnetic Field Potential health effect of electromagnetic field
Source: JICA Study Team
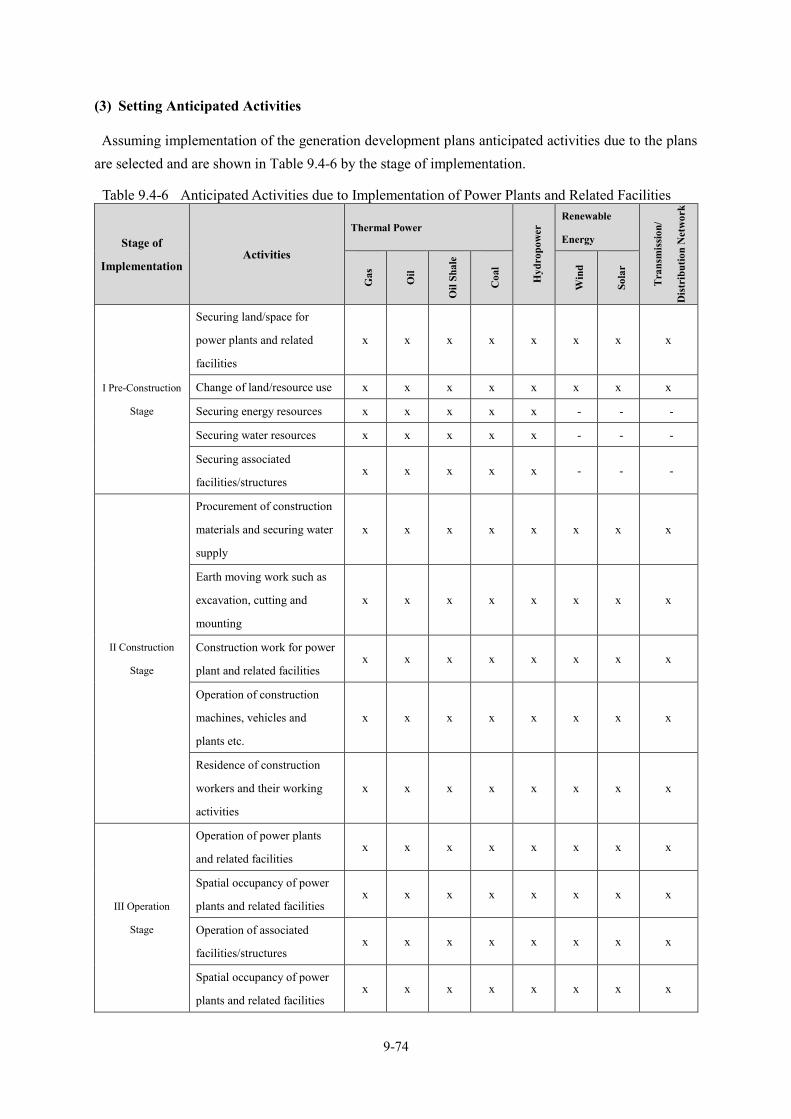
9-74
(3) Setting Anticipated Activities
Assuming implementation of the generation development plans anticipated activities due to the plans are selected and are shown in Table 9.4-6 by the stage of implementation.
Table 9.4-6 Anticipated Activities due to Implementation of Power Plants and Related Facilities
Stage of
Implementation Activities
Thermal Power
Hyd
ropo
wer
Renewable
Energy
Tra
nsm
issio
n/
Dis
trib
utio
n N
etw
ork
Gas
Oil
Oil
Shal
e
Coa
l
Win
d
Sola
r
I Pre-Construction
Stage
Securing land/space for
power plants and related
facilities
x x x x x x x x
Change of land/resource use x x x x x x x x
Securing energy resources x x x x x - - -
Securing water resources x x x x x - - -
Securing associated
facilities/structures x x x x x - - -
II Construction
Stage
Procurement of construction
materials and securing water
supply
x x x x x x x x
Earth moving work such as
excavation, cutting and
mounting
x x x x x x x x
Construction work for power
plant and related facilities x x x x x x x x
Operation of construction
machines, vehicles and
plants etc.
x x x x x x x x
Residence of construction
workers and their working
activities
x x x x x x x x
III Operation
Stage
Operation of power plants
and related facilities x x x x x x x x
Spatial occupancy of power
plants and related facilities x x x x x x x x
Operation of associated
facilities/structures x x x x x x x x
Spatial occupancy of power
plants and related facilities x x x x x x x x
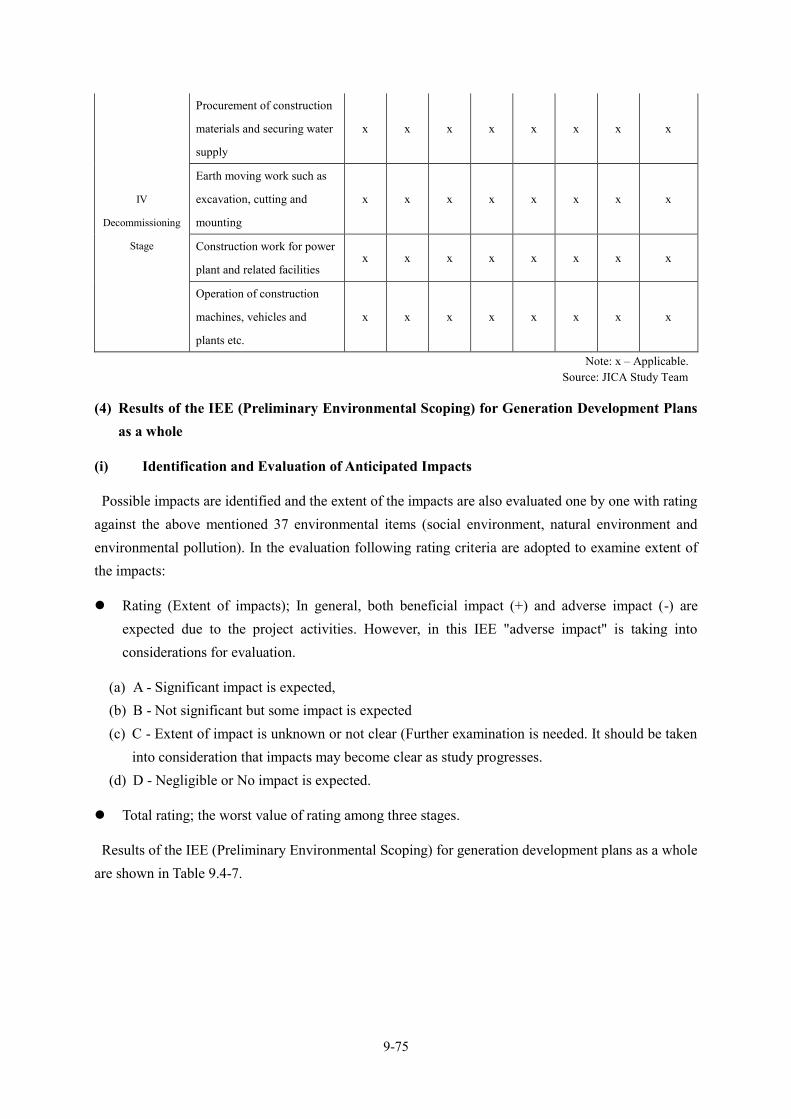
9-75
IV
Decommissioning
Stage
Procurement of construction
materials and securing water
supply
x x x x x x x x
Earth moving work such as
excavation, cutting and
mounting
x x x x x x x x
Construction work for power
plant and related facilities x x x x x x x x
Operation of construction
machines, vehicles and
plants etc.
x x x x x x x x
Note: x – Applicable. Source: JICA Study Team
(4) Results of the IEE (Preliminary Environmental Scoping) for Generation Development Plans as a whole
(i) Identification and Evaluation of Anticipated Impacts
Possible impacts are identified and the extent of the impacts are also evaluated one by one with rating against the above mentioned 37 environmental items (social environment, natural environment and environmental pollution). In the evaluation following rating criteria are adopted to examine extent of the impacts:
Rating (Extent of impacts); In general, both beneficial impact (+) and adverse impact (-) are expected due to the project activities. However, in this IEE "adverse impact" is taking into considerations for evaluation.
(a) A - Significant impact is expected, (b) B - Not significant but some impact is expected (c) C - Extent of impact is unknown or not clear (Further examination is needed. It should be taken
into consideration that impacts may become clear as study progresses. (d) D - Negligible or No impact is expected.
Total rating; the worst value of rating among three stages.
Results of the IEE (Preliminary Environmental Scoping) for generation development plans as a whole are shown in Table 9.4-7.

9-76
Table 9.4-7 Preliminary Environmental Scoping - 1 Identification and Evaluation of Expected Impacts (Degeneration Development Plan as a Whole)
Environmental item
*, **
Rating ***, **** Reasons ***
T I II III IV
(1) Social Environment
1) Land acquisition
and resettlement
(Involuntary
resettlement)
A/B A/B D D D (T) To secure the lands/spaces for planned power plants and
related facilities, there is a possibility of involuntary
resettlement including land acquisition and resettlement as
well as wayleaves, generation of Project Affected Persons
(PAPs), although it depends on the details of the plan (site
location/route, scale, components etc.).
2) Local economy
such as employment
and livelihood etc.
C C C C C (T) Beneficial impacts are expected on local economy; (i)
creation of employment opportunity for civil work during
construction and decommissioning stage, (ii) new power
generation may improve living condition. However, extent
of impact is unknown at present.
3) Energy use A/B A/B A/B A/B C (T) To procure energy resources by exploitation, storage
and/or transportation, there is a possibility to generate
negative impact on environment. However, extent of impact
depends on the plan of power plants and related facilities.
4) Water use A/B A/B A/B A/B C (T) Jordan has very limited water resources and available
water resources continue to fall with population growth
everywhere in the country. Thus, to secure water supply for
use such as processing, cooling, sprinkling etc. of power
plants and related facilities, it is expected to face severe
competence with other water supply and may cause
considerable negative impact on environment.
5) Land use and
utilization of local
resources
A/B A/B A/B A/B C (V) Some alteration of existing land use and utilization of
local resources is expected. However, extent of impact
depends on the plan of power plants and related facilities.
6) Social institutions
such as social
infrastructure and
local decision-making
C C C C C (T) Beneficial impacts such as contribute to creation of
employment opportunity for construction and
decommissioning work and improvement living condition
by supply of electricity through power plants and related
facilities. However, there is a possibility of missing
acceptance by the communities, if the plan is not properly
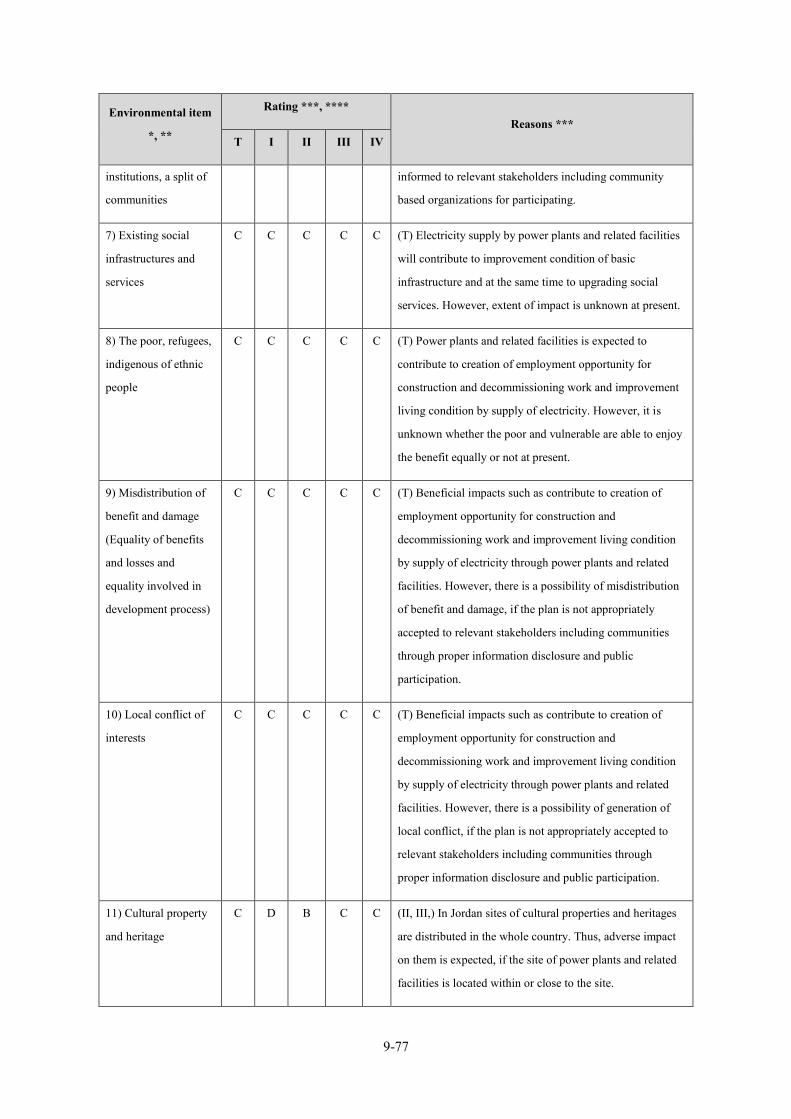
9-77
Environmental item
*, **
Rating ***, **** Reasons ***
T I II III IV
institutions, a split of
communities
informed to relevant stakeholders including community
based organizations for participating.
7) Existing social
infrastructures and
services
C C C C C (T) Electricity supply by power plants and related facilities
will contribute to improvement condition of basic
infrastructure and at the same time to upgrading social
services. However, extent of impact is unknown at present.
8) The poor, refugees,
indigenous of ethnic
people
C C C C C (T) Power plants and related facilities is expected to
contribute to creation of employment opportunity for
construction and decommissioning work and improvement
living condition by supply of electricity. However, it is
unknown whether the poor and vulnerable are able to enjoy
the benefit equally or not at present.
9) Misdistribution of
benefit and damage
(Equality of benefits
and losses and
equality involved in
development process)
C C C C C (T) Beneficial impacts such as contribute to creation of
employment opportunity for construction and
decommissioning work and improvement living condition
by supply of electricity through power plants and related
facilities. However, there is a possibility of misdistribution
of benefit and damage, if the plan is not appropriately
accepted to relevant stakeholders including communities
through proper information disclosure and public
participation.
10) Local conflict of
interests
C C C C C (T) Beneficial impacts such as contribute to creation of
employment opportunity for construction and
decommissioning work and improvement living condition
by supply of electricity through power plants and related
facilities. However, there is a possibility of generation of
local conflict, if the plan is not appropriately accepted to
relevant stakeholders including communities through
proper information disclosure and public participation.
11) Cultural property
and heritage
C D B C C (II, III,) In Jordan sites of cultural properties and heritages
are distributed in the whole country. Thus, adverse impact
on them is expected, if the site of power plants and related
facilities is located within or close to the site.

9-78
Environmental item
*, **
Rating ***, **** Reasons ***
T I II III IV
12) Fishing Rights,
Water Rights and
Rights of Common
C C C C C (T) There is a possibility of disturbing fishing rights, water
rights and rights of common depending on the project plan.
However, extent of impact is unknown at present.
13) Public health and
Sanitation
B/C D B B/C C (II, III, IV) There is a possibility of deterioration respiratory
functions due to inhalation of air pollutants such as NOx
and PM2.5, if control of pollutants emission in construction
and decommissioning work and operation of power plants
and related facilities is not conducted appropriately.
14) Infectious diseases
such as HIV/AIDS
C D B B/C C (II, IV) In many developing countries spreading of
infectious diseases such as HIV/AIDS were often reported
due to contact of workers with affected peoples at their
camp in construction work . Thus, it is expected somewhat
spreading of infectious diseases during construction and
decommissioning stage.
15) Working
condition including
occupational safety
C D C C C (II, III, IV) Adverse impacts on working condition
including occupational safety are expected somewhat due to
insufficient management of workers at construction and
decommissioning work, and at operation of power plants
and related facilities. However, extent of impact is
unknown at present.
16) Hazard/risk
(disaster, security)
C C B B B (T) No additional risk of disaster and public security are
expected due to installation of power plant and related
facilities. However, there is a possibility of increase in
disaster and security risk, if the site is located to close to
neighboring countries in conflict.
17) Accidents A/B D B A/B B (II, III, IV) Occurrence of accidents is expected somewhat,
if inappropriate handling and management of construction
and decommissioning work, and insufficient operation of
installed power plants and related facilities are carried out.
(2) Natural Environment
18) Topography and
Geology
C D C C C (II, IV) There is a possibility of causing adverse impact, if
that a large-scale alteration of topographic and geologic
features are included in construction plan of power plants

9-79
Environmental item
*, **
Rating ***, **** Reasons ***
T I II III IV
and related facilities. However, extent of impact is
unknown at present.
19) Soil erosion/sand
movement
C D C C C (II, IV) There is a possibility of occurrence of soil erosion,
if that a large-scale alteration of topographic and geologic
features as well as cutting and filling of surface soil are
included in construction plan of power plants and related
facilities. However, extent of impact is unknown at present.
20) Movement of
water/Hydrological
situation
C D C C C (II, III, IV) There is a possibility that hydrological
conditions such as water flow and water level are adversely
affected due to landing work of fuels and other materials at
port and/or water storage by pumping up at hydropower
plant. However, extent of impact is unknown at present.
21) Coastal zone B D B B C (II, III, IV) There is a possibility that change in
oceanographic conditions and coastal erosion/sedimentation
due to development of coastal area for landing work of
fuels and other materials at port and/or water storage by
pumping up at hydropower plant. However, extent of
impact is unknown at present.
22) Environmentally
sensitive areas
(Protected Areas,
IBAs etc.)
B D B B C (II, III, IV) In Jordan designated Protected Areas and
Important Bird and Biodiversity Conservation Areas (IBAs)
are distributed in the whole country. Thus, adverse impact
on them is expected, if the site of power plants and related
facilities is located within or close to the area.
23) Flora, Fauna,
Ecosystem and
Biodiversity
B D B B C (II, III, IV) In Jordan there are found many precious plant
and animal species as well as important areas of valuable
ecosystem and biodiversity. Thus, adverse impact on them
is expected, if the site of power plants and related facilities
is located within or close to the area.
24) Landscape and
visual amenity
B D B B C (III) In Jordan cultural and heritage sites are distributed in
the whole country and they consist of attractive landscape.
Thus, there is a possibility of deterioration aesthetic value
of landscape by spatial occupancy of power plants and
related facilities.

9-80
Environmental item
*, **
Rating ***, **** Reasons ***
T I II III IV
25) Micro-climate B D B B B (II, III, IV) Most areas of Jordan are topographically flat
and occupied by desert. Thus even a small change of
topographical features such as appearance of new structures
and facilities may cause influence to microclimate
condition such as wind.
26) Global Warming A/B D B A/B B (II, III, IV) Emission of greenhouse gases (GHG) such as
CO2, CH4, which may affect consequently global warming
and climate change is expected from construction vehicles
and machines during construction and decommissioning
stage, and from power plants and related facilities during
operation stage. However, extent of emission and kind of
greenhouse gases depend on specifications and features of
power plants and related facilities.
(3) Environmental Pollution
27) Air pollution A/B D B A/B C (II, III, IV) Generation of air pollutants such as dust,
PM10, PM2.5, SOx, NOx are expected due to earth moving
and engineering works during construction and
decommissioning stage, and from power plant and related
facilities during operation stage. However, extent of
generation and kind of pollutants depend on specifications
and features of power plants and related facilities.
28) Water pollution A/B D B A/B C (II, III, IV) Generation of water pollutants such as SS,
BOD, COD, oil & grease, and other organic and inorganic
substances as well as thermal effluent, are expected due to
earth moving and engineering works during construction
and decommissioning stage, and from power plant and
related facilities during operation stage. However, extent of
generation and kind of pollutants depend on specifications
and features of power plants and related facilities.
29) Soil
contamination
B D B B C (II, III, IV) There is a possibility of soil contamination due
to leakage of toxic or hazardous materials from construction
and decommissioning work, and from operation of power

9-81
Environmental item
*, **
Rating ***, **** Reasons ***
T I II III IV
plant and related facilities. However, features of the
contamination is unknown at present.
30) Bottom sediment B D B B C (II, III, IV) There is a possibility of bottom sediment
contamination due to leakage of fuels and other materials
during landing work at the port. However, features of the
contamination is unknown at present.
31) Solid waste A/B D B A/B B (II, III, IV) Generation of solid wastes is expected from are
expected due to earth moving and engineering works during
construction and decommissioning stage, and from power
plant and related facilities such as fly ash during operation
stage. However, extent of generation depends on
specifications and features of power plants and related
facilities.
32) Noise and
Vibration
B D B B C (II, III, IV) Generation of noise and vibration are expected
from are expected due to earth moving and engineering
works during construction and decommissioning stage, and
from power plant and related facilities during operation
stage. However, extent of generation depends on
specifications and features of power plants and related
facilities.
33) Ground
Subsidence
C D C C C (II, III) There is a possibility of ground subsidence if
extraction of a large-scale extraction of groundwater is
included in the project plan. However, at present it is
unknown.
34) Offensive odor C D C C C (II, III, IV) There is a possibility of offensive odor due to
mal-functioned vehicles and construction machines during
construction and decommissioning stage, and power plants
and related facilities during operation stage. However, at
present it is unknown.
35) Sunshine
inhibition
C D C C C (III) If the power plants and related facilities are installed in
densely populated area and surrounded by tall buildings,
sunshine inhibition is somewhat expected. However, at
present it is unknown.
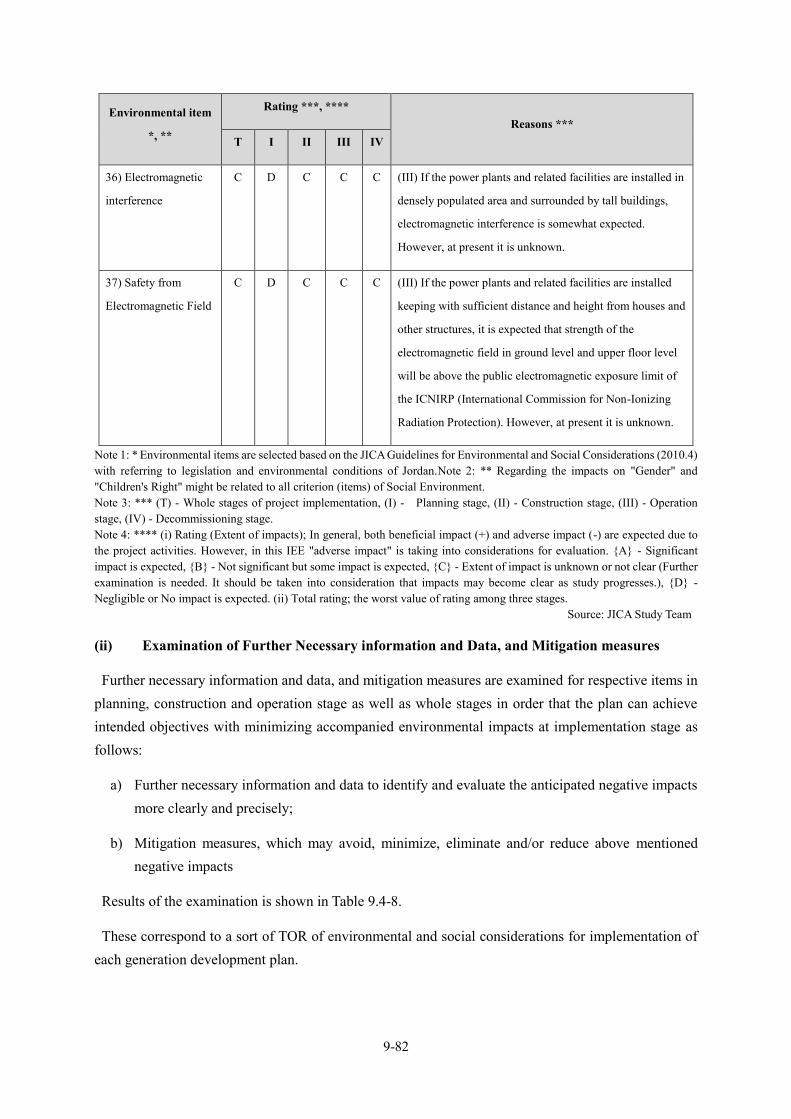
9-82
Environmental item
*, **
Rating ***, **** Reasons ***
T I II III IV
36) Electromagnetic
interference
C D C C C (III) If the power plants and related facilities are installed in
densely populated area and surrounded by tall buildings,
electromagnetic interference is somewhat expected.
However, at present it is unknown.
37) Safety from
Electromagnetic Field
C D C C C (III) If the power plants and related facilities are installed
keeping with sufficient distance and height from houses and
other structures, it is expected that strength of the
electromagnetic field in ground level and upper floor level
will be above the public electromagnetic exposure limit of
the ICNIRP (International Commission for Non-Ionizing
Radiation Protection). However, at present it is unknown.
Note 1: * Environmental items are selected based on the JICA Guidelines for Environmental and Social Considerations (2010.4) with referring to legislation and environmental conditions of Jordan.Note 2: ** Regarding the impacts on "Gender" and "Children's Right" might be related to all criterion (items) of Social Environment. Note 3: *** (T) - Whole stages of project implementation, (I) - Planning stage, (II) - Construction stage, (III) - Operation stage, (IV) - Decommissioning stage. Note 4: **** (i) Rating (Extent of impacts); In general, both beneficial impact (+) and adverse impact (-) are expected due to the project activities. However, in this IEE "adverse impact" is taking into considerations for evaluation. {A} - Significant impact is expected, {B} - Not significant but some impact is expected, {C} - Extent of impact is unknown or not clear (Further examination is needed. It should be taken into consideration that impacts may become clear as study progresses.), {D} - Negligible or No impact is expected. (ii) Total rating; the worst value of rating among three stages.
Source: JICA Study Team
(ii) Examination of Further Necessary information and Data, and Mitigation measures
Further necessary information and data, and mitigation measures are examined for respective items in planning, construction and operation stage as well as whole stages in order that the plan can achieve intended objectives with minimizing accompanied environmental impacts at implementation stage as follows:
a) Further necessary information and data to identify and evaluate the anticipated negative impacts more clearly and precisely;
b) Mitigation measures, which may avoid, minimize, eliminate and/or reduce above mentioned negative impacts
Results of the examination is shown in Table 9.4-8.
These correspond to a sort of TOR of environmental and social considerations for implementation of each generation development plan.

9-83
Table 9.4-8 Preliminary Environmental Scoping -2 Further Necessary Information/Data and Possible Mitigation Measures Preliminary Environmental Scoping (Generation Development Plan as a Whole)
Environmental
item*, **
Rating (T)
***,****
Further Necessary
Information/Data *** Possible Mitigation Measures ***
(1) Social Environment
1) Land acquisition
and resettlement
(Involuntary
resettlement)
A/B (T) 1) Laws and regulations for
involuntary resettlement (land
acquisition and resettlement) and
easement/wayleaves. 2) Land use
regulation and existing land use in
Jordan and planned area. 3) Cases and
causes of involuntary resettlement in
Jordan and planned area. 4)
Anticipated land area and location for
the site to be secured by the plan.
(T) 1) Consider alternative plans to avoid
and/or minimize the occurrence of
involuntary resettlement. 2) Detailed
inventory survey on plots, facilities, structures
and peoples living along the planned railway
routes. 3) Survey on encroachment on ROW
(Right Of Way) of the planned site/alignment.
4) Examine procedure and condition of
involuntary resettlement and compensation to
PAPs taking relevant laws in Jordan and the
JICA Guidelines into considerations. 5) From
early stage of the project, pay attention to
information disclosure and consultation with
stakeholders including PAPs for thorough
understanding of the issues or to make
agreement as much as possible. 6) Elaborate
Resettlement Action Plan (RAP), if
involuntary resettlement is unavoidable.
2) Local economy
such as
employment and
livelihood etc.
C (T) 1) Development PPPs of Jordan
and other sectors (tourism, industry,
mining, regional development etc.) 2)
Labor force and employment and
working needs in planned area.
(T) 1) Promote consistency and synergy with
other development plans (PPPs) by whole
country and other sectors.
3) Energy use A/B (T) Procurement plan of energy
sources (gases, oils, oil shale, coal,
wind etc.) and materials for power
plants and related facilities.
(T) Consider measures for energy use such as
diversification of energy sources, energy
saving, distribution loss etc. in the country
and in electric sector.
4) Water use A/B (T) 1) Laws and regulations for water
use and water extraction form water
resources. 2) Water demand and
supply in Jordan and planned area. 3)
(T) 1) Consider minimize water use in
construction and decommissioning work and
in operation of power plants and related

9-84
Environmental
item*, **
Rating (T)
***,****
Further Necessary
Information/Data *** Possible Mitigation Measures ***
Anticipated water use in construction
and decommissioning work and in
operation of power plants and related
facilities.
facilities in the plan. 2) Monitor water
consumption in the plan.
5) Land use and
utilization of local
resources
A/B (T) 1) Laws and regulation for use of
land and resources. 2) Existing and
future land and resources use in
Jordan and planned area.
(T) Consider appropriate and effective
utilization of land and resources in the plan.
6) Social
institutions such as
social infrastructure
and local decision-
making institutions,
a split of
communities
C (T) Information of administrative and
social structures and decision-making
process and institutions in Jordan and
planned area.
(T) Information disclosure and public
participation should be fully considered for
stakeholders including decision-makers of the
communities from early stage of planning for
obtaining thorough understanding and
consensus of the people and communities by
promoting that the plan may contribute to
improvement of local economy and upgrading
living conditions.
7) Existing social
infrastructures and
services
C (T) 1) Laws and regulations for social
infrastructures and services. 2)
Existing situation of social
infrastructures and services in Jordan
and planned area.
(T) 1) Avoid or minimize disturbance existing
social infrastructures and services in the plan.
2) Promote synergy with plans for other social
infrastructure and services.
8) The poor,
indigenous of
ethnic people
C (T) 1) Data of vulnerable groups such
as the poor, female, children, elders,
disabled, refugees and indigenous
ethnic people in Jordan and planned
area. 2) Supporting activities to living
and livelihood condition by Jordan
Government and donors.
(T) 1) Give higher priority to the vulnerable
groups in the planned area with having a
chance to get jobs and training to get working
skills in the plan. 2) The vulnerable people
should be taken fully considerations to
compensate properly or support to restore the
present living condition in case of involuntary
resettlement, even if they are illegal
occupants.
9) Misdistribution
of benefit and
C (T) Cases and causes of
misdistribution of benefit and damage
(T) Information disclosure and public
participation should be fully considered from

9-85
Environmental
item*, **
Rating (T)
***,****
Further Necessary
Information/Data *** Possible Mitigation Measures ***
damage (Equality
of benefits and
losses and equality
involved in
development
process)
by the development plans of electric
sector and others in Jordan and
planned area.
early stage to obtain thorough understanding
the plan and consensus among the
communities and PAPs in order to share with
benefit and damage equally.
10) Local conflict
of interests
C (T) Cases and causes of local conflict
of interests by the development plans
of electric sector and others in Jordan
and planned area.
(T) Information disclosure and public
participation should be fully considered from
early stage to obtain thorough understanding
the plan and consensus among the
communities and PAPs in order to avoid or
minimize local conflict of interests.
11) Cultural
property and
heritage
C (II, III) 1) Laws and regulations of
cultural property and heritage site. 2)
Distribution of cultural property and
heritage site in Jordan and the planned
area.
(T) 1) Avoid the site and route penetrating
or close to the sites of cultural properties,
heritages and archaeological importance in
the plan. 2) If any buried cultural properties
are found at construction work, report and
consult with concerned organizations such as
Ministry of Tourism and Antiquities without
delay.
12) Fishing Rights,
Water Rights and
Rights of Common
C (T) Situation of Fishing Rights, Water
Rights and Rights of Common in
Jordan and planned area.
(T) Promote participation of those who have
the rights in order to get their opinion and
ensuring understanding and making consent
in the course of the stakeholder meeting from
the planning stage
13) Public health
and Sanitation
B/C (II, III, IV) 1) Laws and regulations of
public health and sanitation. 2)
Public health condition including
respiratory disease and distribution of
medical facilities in Jordan and
planned area.
(T) 1) Preventive measures to control air
pollutants emission in construction and
decommissioning work and in operation of
power plants and related facilities。2) Monitor
public health condition by medical
examination.

9-86
Environmental
item*, **
Rating (T)
***,****
Further Necessary
Information/Data *** Possible Mitigation Measures ***
14) Infectious
diseases such as
HIV/AIDS
C (II、IV) 1) Regulations for infectious
diseases. 2) Cases and causes of
infectious diseases such as HIV/AIDS
in Jordan and planned area.
(II, IV) 1) Enlightenment and education of
infectious diseases to people and workers. 2)
Monitoring prevalence and safety shoes and
hats. (3) Regular check of occupational safety
and health condition.
15) Working
condition including
occupational health
and safety
C (II, III, IV) 1) Regulation for labor
and occupational health and safety. 2)
Cases and causes of working
condition issues including
occupational health and safety in
Jordan and planned area. 3)
Management plan for working
condition in construction and
decommissioning work, and in
operation of power plants and related
facilities.
(II, III, IV) 1) Prepare tangible safety
considerations in place for individuals
involved in the plan, such as the installation
of safety equipment which prevents accidents,
and management of hazardous materials. 2)
Plan and implement intangible measures for
individuals involved in the plan, such as the
establishment of a safety and health program,
and safety training for workers etc. 3)
Monitoring occupational health and safety
condition.
16) Hazard/risk
(disaster, public
security)
C (T) 1) Cases and causes of hazard
risks due to disaster in Jordan and the
planned area. 2) Existing condition of
public security due to uncertain
political situation and conflict of
neighboring countries.
(T) 1) Monitor uncertain condition of
neighboring countries. 2) Prepare emergency
action plan for hazard and public security
risks.
17) Accidents A/B (II, III, IV) 1) Cases and causes of
accidents in Jordan and planned area
in construction and decommissioning
work and in operation of power plants
and related facilities.
(II, III, IV) 1) Preventive measures to
accidents in construction and
decommissioning work and in operation of
power plants and related facilities.2) Prepare
emergency action plan for accidents.
(3) Natural Environment
18) Topography
and Geology
C (II, IV) 1) Topographical and
geological data in Jordan and planned
area. 2) Anticipated amount of
construction materials for
procurement and removal of soil and
(II, IV) 1) To avoid site and route with
unstable and easy to collapsing condition. 2)
To avoid land with topographical or
geological importance.

9-87
Environmental
item*, **
Rating (T)
***,****
Further Necessary
Information/Data *** Possible Mitigation Measures ***
stones for land clearance of power
plants and related facilities.
19) Soil
erosion/sand
movement
C (II, IV) 1) Regulation for soil erosion
and land slide. 2) Cases and causes of
soil erosion and land slide in Jordan
and planned area.
(II, IV) To avoid site and route with unstable
soil condition in the area likely to occurrence
of soil erosion and land slide.
20) Movement of
water/Hydrological
situation
C (II, III, IV) 1) Hydrological condition
data in Jordan and planned area. 2)
Distribution of surface water bodies
(rivers, Wadis, etc.) and groundwater
basin in planned area.
(II, III, IV) Monitoring hydrological condition
of rivers, Wadis and groundwater
21) Coastal zone B (II, III, IV) 1) Regulation of
development and environmental
conservation in coastal area. 2)
Existing environmental condition of
coastal area.
(II, III, IV) 1) Appropriate preventive
measures against coastal erosion, and
sedimentation of sand and soil in the plan. 2)
Monitor oceanographic conditions, and
coastal erosion and sedimentation of sand by
physical observation and utilizing satellite
image map.
22) Protected
Areas, IBAs, parks
etc.)
B (II, III, IV) 1) Distribution of
designated Protected Areas, natural
reserves and IBAs as well as parks in
Jordan and the planned area. 2)
Regulations for conservation of
natural environment.
(II, III, IV) To avoid site location within or
close to the designated Protected Areas and
parks.
23) Flora, Fauna,
Ecosystem and
Biodiversity
B (II, III, IV) 1) Distribution of site with
valuable plant and animal species,
ecosystem and biodiversity in Jordan
and the planned area. 2) Regulations
for conservation of plant, animal
species and biodiversity.
(II, III, IV) To avoid site location within or
close to distribution areas of valuable plant
and animal species, and environmentally
sensitive areas.
24) Landscape B (III) 1) Distribution of site with
valuable landscape in Jordan and the
(III) 1) To avoid site location close to existing
important landscape. 2) Measures to
harmonize power plants and related facilities

9-88
Environmental
item*, **
Rating (T)
***,****
Further Necessary
Information/Data *** Possible Mitigation Measures ***
planned area. 2) Regulation for
preserving valuable landscape.
with surrounding landscape by design and
tree planting in the plan.
25) Micro-Climate B (II, III, IV) Meteorological data in
Jordan and planned area including
cases and causes of change in micro-
climate in Jordan and planned area.
(II, III, IV) Monitor micro-climate by
meteorological data and physical observation.
26) Global
Warming
A/B (II, III, IV) 1) Existing data of
greenhouse gases emission in Jordan
and planned area. 2) Anticipated
greenhouse gases emission from
power plants and related facilities.
(II, III, IV) Preventive measures to reduce
greenhouse gases emission in construction
and decommissioning work and in operation
of power plants and related facilities.
(3) Environmental Pollution
27) Air pollution A/B (II, III, IV) 1) Regulation of air
pollution including air quality and
emission standards. 2) Existing air
quality in Jordan and planned area. 3)
Anticipated emission of air pollutants
from power plants and related
facilities.
(II, III, IV) 1) Preventive measures to control
air pollutants emission in construction and
decommissioning work and in operation of
power plants and related facilities. 2) Monitor
air pollutants emission and ambient air
quality.
28) Water pollution A/B (II, III, IV) 1) Regulation of water
pollution including water quality and
effluent standards. 2) existing water
quality in Jordan and planned area. 3)
Anticipated discharge of water
pollutants from power plants and
related facilities.
(II, III, IV) 1) Preventive measures to control
water pollutants discharge in construction and
decommissioning work and in operation of
power plants and related facilities. 2) Monitor
water pollutants discharge and environmental
water quality.
29) Soil
contamination
B (II, III, IV) 1) Regulation of soil
contamination. 2) Cases and causes of
soil contamination in Jordan and
planned area.
(II, III, IV) 1) Preventive measures to avoid
leakage toxic/hazardous materials in
construction and decommissioning work and
in operation of power plants and related
facilities. 2) Monitor soil contamination.

9-89
Environmental
item*, **
Rating (T)
***,****
Further Necessary
Information/Data *** Possible Mitigation Measures ***
30) Bottom
sediment
B (II, III, IV) 1) Regulation of bottom
sediment contamination. 2) Cases and
causes of bottom sediment
contamination.
(II, III, IV) Monitoring bottom sediment
contamination.
31) Solid waste A/B (II, III, IV) 1) Regulation for solid
waste management. 2) Existing
situation of solid waste management
in Jordan and planned area. 3)
Anticipated generation of solid waste
from construction and
decommissioning work. 4)
Anticipated solid waste generation
including fly ash from power plants
and related facilities.
(II, III, IV) 1) Preventive measures for
reduction, proper treatment and disposal of
solid waste during
construction/decommissioning stage and
operation stage in the plan. 2) Reflect concept
of 3R (Reduce, reuse and recycle) to the plan.
3) Enlighten awareness of waste management
to workers and employees.
32) Noise and
Vibration
B (II, III, IV) 1) Regulation of noise and
vibration. 2) Generation and ambient
level of noise and vibration in Jordan
and planned area. 3) Anticipated
generation of noise and vibration from
power plants and related facilities.
(II, III, IV) Preventive measures against
generation of noise and vibration during
operation of power plants and related
facilities as well as during construction and
decommissioning work.
33) Ground
Subsidence
C (II, III) 1) Regulation of ground
subsidence. 2) Cases and causes
ground subsidence in Jordan and
planned area.
(II, III) Monitor occurrence of ground
subsidence by physical observation.
34) Offensive odor C (II, III, IV) 1) Regulation of
offensive odor. 2) Cases and causes of
offensive odor issues in Jordan and
planned area.
(II, III) Preventive measures for generation of
offensive odor from construction and
decommissioning work and from operation of
power plants and related facilities. .
35) Sunshine
inhibition
C (III) 1) Regulation of sunshine
inhibition. 2) Cases and causes of
sunshine inhibition in Jordan and
planned area.
(III) 1) To avoid site location close to densely
populated area and tall buildings.
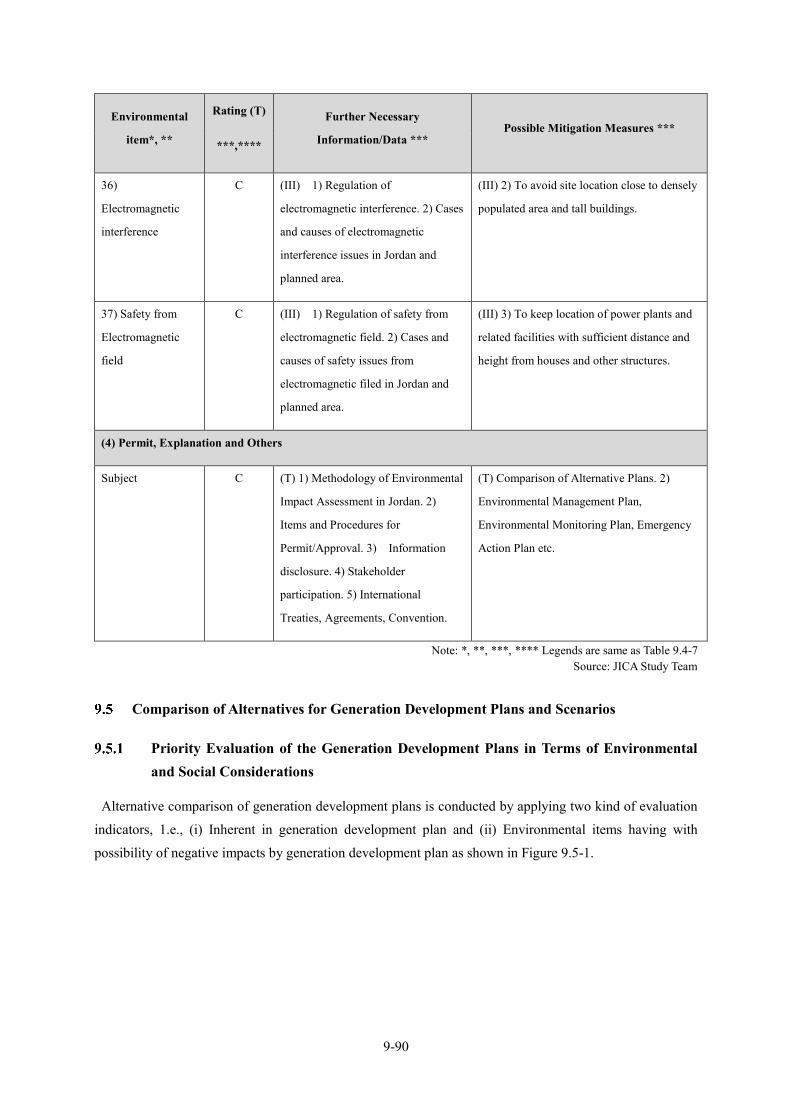
9-90
Environmental
item*, **
Rating (T)
***,****
Further Necessary
Information/Data *** Possible Mitigation Measures ***
36)
Electromagnetic
interference
C (III) 1) Regulation of
electromagnetic interference. 2) Cases
and causes of electromagnetic
interference issues in Jordan and
planned area.
(III) 2) To avoid site location close to densely
populated area and tall buildings.
37) Safety from
Electromagnetic
field
C (III) 1) Regulation of safety from
electromagnetic field. 2) Cases and
causes of safety issues from
electromagnetic filed in Jordan and
planned area.
(III) 3) To keep location of power plants and
related facilities with sufficient distance and
height from houses and other structures.
(4) Permit, Explanation and Others
Subject C (T) 1) Methodology of Environmental
Impact Assessment in Jordan. 2)
Items and Procedures for
Permit/Approval. 3) Information
disclosure. 4) Stakeholder
participation. 5) International
Treaties, Agreements, Convention.
(T) Comparison of Alternative Plans. 2)
Environmental Management Plan,
Environmental Monitoring Plan, Emergency
Action Plan etc.
Note: *, **, ***, **** Legends are same as Table 9.4-7 Source: JICA Study Team
Comparison of Alternatives for Generation Development Plans and Scenarios
Priority Evaluation of the Generation Development Plans in Terms of Environmental and Social Considerations
Alternative comparison of generation development plans is conducted by applying two kind of evaluation
indicators, 1.e., (i) Inherent in generation development plan and (ii) Environmental items having with
possibility of negative impacts by generation development plan as shown in Figure 9.5-1.

9-91
Alternative Comparison of Generation
Plans/Scenarios
(1) Environmental Baseline Data of Jordan, (2)
Legislation of Jordan / JICA GuidelinesGeneration Development Plans
Anticipated Activities
Expected Impacts by Scoping
(1) Selection of Evaluation Factors -1 (Inherent in
Generation Development)
(2) Selection of Evaluation Factors -2
(Environmental Items having a possibility of
adverse impacts by Generation Development)
Source: JICA Study Team
Figure 9.5-1 Flow of Priority Evaluation in view of Environmental and Social Considerations
(1) Selection of Evaluation Indicators
(i) Evaluation Indicator – 1
Items related generation facilities/structures and occurrence of events inherent in power generation as shown in Table 9.5-1.
Table 9.5-1 Evaluation Indicators 1 and the Reasons of Selection Evaluation Indicators Reasons
1a) Air pollution
Generation of air pollutants such as dust, PM10, PM2.5, SOx, NOx are expected
due to earth moving and engineering works during construction and
decommissioning stage, and from power plant and related facilities during
operation stage.
1b) Water pollution
Generation of water pollutants such as SS, BOD, COD, oil & grease, and other
organic and inorganic substances as well as thermal effluent, is expected due to
earth moving and engineering works during construction and decommissioning
stage, and from power plant and related facilities during operation stage
1c) Solid waste Generation of solid wastes is expected from is expected due to earth moving and
engineering works during construction and decommissioning stage, and from
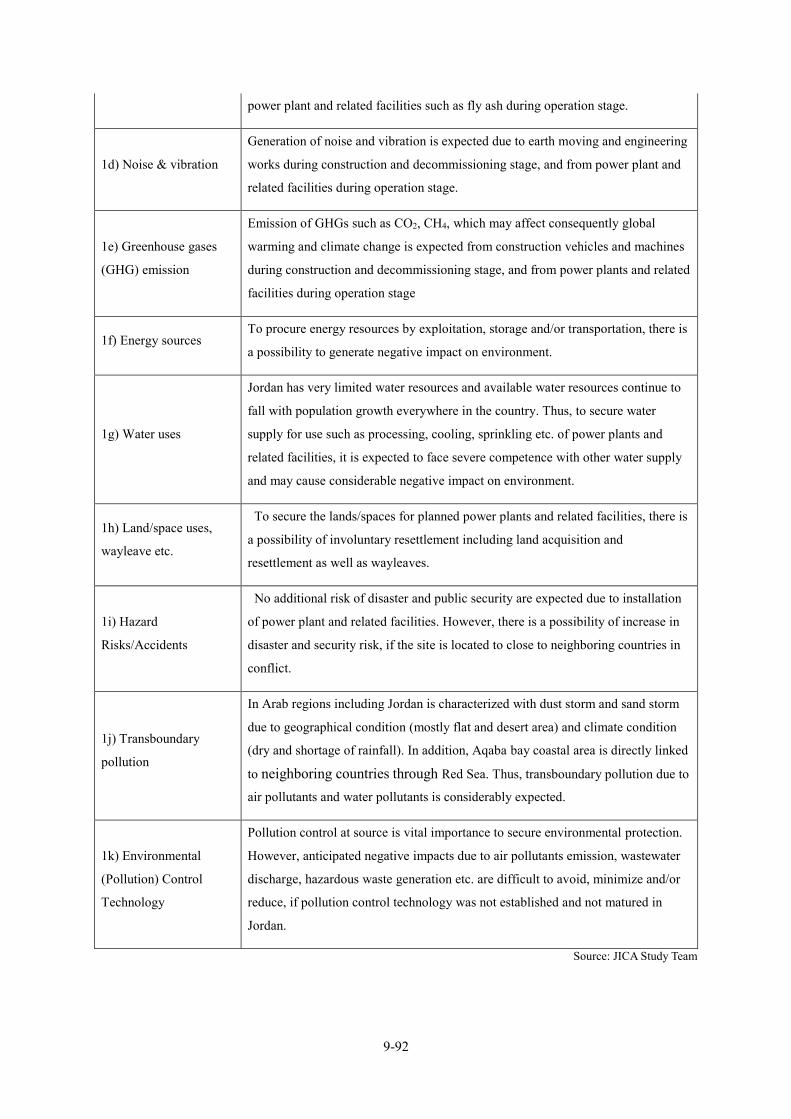
9-92
power plant and related facilities such as fly ash during operation stage.
1d) Noise & vibration
Generation of noise and vibration is expected due to earth moving and engineering
works during construction and decommissioning stage, and from power plant and
related facilities during operation stage.
1e) Greenhouse gases
(GHG) emission
Emission of GHGs such as CO2, CH4, which may affect consequently global
warming and climate change is expected from construction vehicles and machines
during construction and decommissioning stage, and from power plants and related
facilities during operation stage
1f) Energy sources To procure energy resources by exploitation, storage and/or transportation, there is
a possibility to generate negative impact on environment.
1g) Water uses
Jordan has very limited water resources and available water resources continue to
fall with population growth everywhere in the country. Thus, to secure water
supply for use such as processing, cooling, sprinkling etc. of power plants and
related facilities, it is expected to face severe competence with other water supply
and may cause considerable negative impact on environment.
1h) Land/space uses,
wayleave etc.
To secure the lands/spaces for planned power plants and related facilities, there is
a possibility of involuntary resettlement including land acquisition and
resettlement as well as wayleaves.
1i) Hazard
Risks/Accidents
No additional risk of disaster and public security are expected due to installation
of power plant and related facilities. However, there is a possibility of increase in
disaster and security risk, if the site is located to close to neighboring countries in
conflict.
1j) Transboundary
pollution
In Arab regions including Jordan is characterized with dust storm and sand storm
due to geographical condition (mostly flat and desert area) and climate condition
(dry and shortage of rainfall). In addition, Aqaba bay coastal area is directly linked
to neighboring countries through Red Sea. Thus, transboundary pollution due to
air pollutants and water pollutants is considerably expected.
1k) Environmental
(Pollution) Control
Technology
Pollution control at source is vital importance to secure environmental protection.
However, anticipated negative impacts due to air pollutants emission, wastewater
discharge, hazardous waste generation etc. are difficult to avoid, minimize and/or
reduce, if pollution control technology was not established and not matured in
Jordan.
Source: JICA Study Team

9-93
(ii) Evaluation Indicator – 2
Major Environmental items affected by Implementation of Generation Development Plans as shown in Table 9.5-2.
Table 9.5-2 Evaluation Indicator - 2 and the Reasons of Selection Evaluation Indicators Reasons
2a) Valuable ecosystem
and biodiversity
In Jordan there are found many precious plant and animal species as well as
important areas of valuable ecosystem and biodiversity. Thus, adverse impact on
them is expected, if the site of power plants and related facilities is located within
or close to the area.
2b) Protected Areas
In Jordan designated Protected Areas and IBAs are distributed in the whole
country. Thus, adverse impact on them is expected, if the site of power plants and
related facilities is located within or close to the area.
2c) Cultural property
and heritage sites
In Jordan sites of cultural properties and heritages are distributed in the whole
country. Thus, adverse impact on them is expected, if the site of power plants and
related facilities is located within or close to the site.
2d) Public health
There is a possibility of deterioration respiratory functions due to inhalation of air
pollutants such as NOx and PM2.5, if control of pollutants emission in construction
and decommissioning work and operation of power plants and related facilities is
not conducted appropriately.
2e) Landscape
In Jordan cultural and heritage sites are distributed in the whole country and they
consist of attractive landscape. Thus, there is a possibility of deterioration aesthetic
value of landscape by spatial occupancy of power plants and related facilities.
2f) Tourism
In Jordan sites of cultural properties and heritages are distributed in the whole
country. Thus, adverse impact on them is expected, if the site of power plants and
related facilities is located within or close to the site.
2g) Rangeland/Bedouins In Jordan, most of the land is desert area and nomad people such as Bedouins are
living and migrating.
2h) Forest area Forest area is vital importance to Jordan for natural resources and tourism activity
where most of the land is desert area.
2i) Coastal area
In Jordan coastal areas such as in Aqaba Bay and Dead Sea are required to protect
environmental conditions due to that they are blessed with valuable ecosystem and
biodiversity and important tourism spots.
Source: JICA Study Team

9-94
(2) Evaluation of Assumed Negative Impacts and their Reasons
At present, although the baseline data for setting up the rating of evaluation indicators for each generation development plan is limited, ranks of rating was set up as shown in Table 9.5-3.
Table 9.5-3 Rating of Evaluation Indicator Rating Extent of Negative Impact
A Significant impact
B Not so significant as A, but considerable impact
C Medium impact
D Little impact or at present unknown
E No or negligible impact
Source: JICA Study Team
(3) Evaluation of Assumed Negative Impacts and their Reasons
At present although the baseline data for setting up the rating of evaluation indicators for each generation development plan is limited, ranks of rating was set up as follows:
(i) Evaluation indicator -1
a) Air pollution
As for thermal power plants, various kind of emission data were reported. In Table 9.5-4 one of the data by EEA is shown. Among thermal power generations in case of coal and oil shale burning, considerable level of emission of PM in addition to NOx and SOx are expected. Although emission data from oil shale burning plant is little known, emission level is assumed to the same or higher level than those of coal fired plant. Thus, at initial evaluation ratings for those of coal and oils shale burning were set as {A} and those of thermal power plants using gas or oil are as {B}. However, assuming proper pollution control measures such as advanced flue gas desulfurization (SOx), flue gas denitrification (NOx) and dust collection (PM and ash) is applied, anticipated negative impact can be reduced considerably. Thus, the rating of thermal power plants was set as {C}.
As for other generation plan and transmission/distribution plan air pollution is not expected during operation stage but some air pollutants emission due to construction and decommissioning stages. Thus ratings are as {D}.

9-95
Table 9.5-4 Air Pollutants Emission Factors from Thermal Power Plants Pollutant Hard coal Brown coal Fuel oil Other oil Gas
CO2 (g/GJ) 94,600 101,000 77,400 74,100 56,100
SO2 (g/GJ) 765 1,361 1,350 228 0.68
NOx (g/GJ) 292 183 195 129 93.3
CO (g/GJ) 89.1 89.1 15.7 15.7 14.5
Non methane organic compounds (g/GJ) 4.92 7.78 3.7 3.24 1.58
Particulate matter (g/GJ) 1,203 3,254 16 1.91 0.1
Flue gas volume total (m3/GJ) 360 444 279 276 272
Note: According to emission data of advanced coal fired plant in Japan such as Hekinan Power Plant, level of PM, NOx and SOx can be reduced greatly to nearly same level of gas and oil fired plant.
Source: European Environment Agency (EEA) 2008 b) Water pollution
In general, during operation of thermal power plants it is expected to discharge wastewater containing organics, inorganics, oil & grease with a very small amount, thermal effluent as well as domestic water.
Among thermal power plants the rating of those by coal fired and oil shale burning are set as {A} considering that the amount of wastewater discharge from those by coal fired and oil shale burning is expected to be larger than those by gas and oil burning. On the other hand, thermal power generations by gas and oil burning are set as {B}. However, assuming proper pollution control measures such as advanced wastewater treatment and thermal effluent is applied, anticipated negative impact can be reduced considerably. Thus, the rating of thermal power plants was set as {C}.
In case of pumped storage hydropower generation plan intake seawater will be stored in reservoir on inland area and returned to Aqaba Bay. There is a possibility to pollute marine water environment of clean Aqaba Bay, where is regulated to observe strict water quality standard. Thus, the pumped storage hydropower generation plan was set as {B}.
Other generation plan including wind power and solar power generation, and installation of transmission and distribution line were set as {D}. Because, in general no wastewater discharge is expected by their operation. However, there is a possibility of wastewater discharge by construction and decommissioning work.

9-96
c) Noise and Vibration
In general, during operation of thermal power plants it is expected to generate noise and vibration.
Among thermal power plants the rating of those by coal fired and oil shale burning are set as {A} considering that the generation level of noise and vibration from those by coal fired and oil shale burning is expected to be higher than those by gas and oil burning. However, with proper control measures such as sound proof facilities those level can be lowered. Thus, all thermal power generations are set as {C}.
Rating of wind power generation was set as{C}, for there is a possibility of low frequency vibration by operation. Rating of other generation developments were set as {D}, for there is a possibility of wastewater discharge by construction and decommissioning work.
d) Solid waste
In case of operation of thermal power plants by coal fired and oil shale burning a large amount of fly ash is generated. In addition, in the oil shale burning considerable amount of non-flammable residue containing soil and stone will be generated. Thus, the rating of thermal power generation by oil shale burning and by coal fired was set as {A} and {B} respectively. However, assuming proper pollution control technology such as conversion to gypsum and cement is applied, anticipated negative impact due to coal fired plant is reduced considerably. Thus, coal fired plant was set as {C}. On the other hand, fly ash generated by oil shale burning is difficult to utilizing as cement and gypsum because of higher sulfur content. Thus, the rating oil shale burning plant was also set as {B}.
As for thermal power generation by gas and oil generation of fly ash is negligible. Thus, rating was also set as {C}.
For other generation scheme generation of solid waste is not expected, but some generation of construction waste is expected by construction and decommissioning work. Thus, threating was set as {D}.
e) GHG Emissions
CO2 is a major GHG and was reported to account for about 85% of the whole GHG in Jordan in 2006 (Third National Communication to Climate Change in Jordan, 2014). Considering rather higher value of CO2 emission unit data for coal fired and oil fired thermal power plants (0.7 to 0.9 CO2-kg/kWh) as shown in Table 9.5-5, the rating of those was set as {B}.
For that by oil shale burning was also set as {B} referring to the data of Circulated Fluidized Bed (CFB) boiler at Narva Power plant of Estonia (Unit amount of CO2 emission - 1.06 kg/kWh) as shown in Table 9.5-6 and description of 900 – 1,000 g/kWh in “Estonian Long-Term Power Scenario” * as well as considering maturity and experience of oil shale burning in Jordan.
As for gas burning plant, the emission unit is less than 0.5 (CO2-kg/kWh). Thus, the rating was set as {C}.

9-97
For other generation scheme generation of GHG emission is not expected, but some generation of GHG is expected by construction and decommissioning work. Thus, threating was set as {D}.
* Elering Generating Opportunity, Tallinn University of Technology and Ea Energy Analyses (2014) – “Estonian Long-Term Power Scenarios”, Tallinn 2014
Table 9.5-5 Estimation of CO2 Emission Unit Value (kg-CO2/kWh) Type of Power Generation Total Fuel Burning Facility/Equipment
Thermal Power (Coal) 0.943 0.864 0.079
Thermal Power (Oil) 0.738 0.695 0.043
Thermal Power(LNG) 0.599 0.476 0.123
Thermal Power (LNG Combined Cycle) 0.474 0.376 0.089
Solar Power 0.038 0 0.038
Wind Power 0.025 0 0.025
Geothermal Power 0.013 0 0.013
Hydropower 0.011 0 0.011 Note 1: Total amount of CO2 emission is estimated based on whole energy consumption from fuel
burning and those from processes of extraction, transportation, construction, maintenance etc. Source: Agency of Natural Resources and Energy, Japan (2004)
Table 9.5-6 CO2 Emission from Oil Shale Burning Units Item PF boiler unit
(Pulverized firing)
CFB unit (Circulated
Fluidized Boiler)
Electric output of energy unit (mean), MW 147 186.7
Specific fuel rate of conventional fuel (29.308 MJ/kgJ, g/kWh) 400.5 346.0
As kJ/kWh 11,737.9 10,140.6
As kWh/kWh 3.260 2.817
CO2 discharge (calculated per fuel kg), Nm3/kg 0.468 0.4492
Density of CO2, kg/Nm3 1.964 1.964
CO2 discharge kg/kg 0.9192 0.8822
CO2 emission per kWh (kg/kWh) 1.2813 1.0636 Source: H. Arro, A. Prikk, T. Piho, Department of Thermal Engineering, Tallinn University of
Technology (2005) “Combustion of Estonian Oil Shale in Fluidized Bed Boilers, Heating Value of Fuel, Boiler Efficiency and CO2 Emissions” in Oil Shale 2005, Vol.22, No.4 Special -p.404
f) Use of energy source
For thermal power generation fossil fuels, such as gas (natural gas and LNG), oil (Heavy fuel oil and diesel oil), coal and oil shale are applied as energy source. Among them oil shale is the fuel of abundant deposit within country of Jordan. On the other hand, fuels other than oil shale have to be procured from outside the Jordan by purchasing and procurement condition is difficult to control due to unexpected change of fuel price. Thus, rating of thermal power generations was set as {B}.

9-98
Among other generation schemes wind power and solar power generation are based on renewable natural energy resource. However, power output depends on weathering conditions such as wind-force and amount of insolation. Thus, the rating was set as {C}. As for pumped storage hydropower generation. it requires power supply to pump up seawater. Thus, the rating was set as {C}.
Rating of transmission and distribution line was set as {C}, for power supply is required for construction and decommissioning work.
g) Water use
In operation of thermal power plants considerable amount of water is required to use for processing, cooling and wastewater treatment. Thus, rating of thermal power generation by gas and oil was set as {B}. Rating of pumped storage hydropower generation was set as {C} due to use of pumped up seawater.
Rating of other generation schemes such as wind power was set as {D} due to water use for construction and decommissioning work.
h) Land and space use
Rating of all the generation schemes was set as {B} based on following reasons:
-For thermal power generation by coal fired and oil shale burning it is also necessary to secure land/space for storage site and ash pond.
-For pumped storage hydropower generation, it is necessary to secure land for reservoir on inland area.
-For wind power and solar power generation it is necessary to secure rather larger area of land to attain as the same level of generation capacity, because density of generated energy is low.
-For transmission and distribution line it is necessary to secure land/space for transmission and distribution line and installation of tower with a long distance.
i) Hazard/risk
Rating of thermal power generations was set as {B} considering that there is a possibility of accidental fire and leakage of hazardous materials by power plant operation.
Rating of other generation schemes was set as {D}, considering lower risks of accidental fire and leakage of hazardous materials than thermal power generations.
j) Trans-boundary pollution
Transboundary pollution is phenomena of dispersion of air and water pollutants as well as transport of solid wastes resulting in spreading pollution over the border of countries. Jordan has geographical condition that more than 90 % of land is occupied by flat desert area connecting to neighboring countries. In addition, in Aqaba Bay area seawater is directly connected to neighboring countries through Red Sea. Therefore, Jordan is under the condition that transboundary pollution is likely to occur.

9-99
Rating of transboundary pollution can be evaluated by extent of generation of air and water pollutants and solid waste. Thus, rating of each generation schemes are as follows:
-All the thermal power generations were set as {B}-Rating of other generation schemes such as wind power was set as {E}, because pollution is expected to a small scale, localized and temporary.
k) Environmental Control Technology
Among thermal power generations that pollution control technology for oil shale burning to prevent and mitigate air pollutants emission, water pollutants discharge and waste generation such as fly ash at power source is neither matured nor is established at power source in Jordan at present. Thus, rating of the oil shale burning was set as {C}, while other thermal power generation schemes including coal fired were set as {E} considering the technology was established and matured in the world.
Pollution control technology for generation schemes other than thermal power were mostly established and is available in Jordan. Thus, the rating was set as {E}.
Results of rating by evaluation indicators -1 are shown in Table 9.5-7.
Table 9.5-7 Results of Rating by Evaluation Indicators -1
Generation Development
Evaluation Indicators - 1
1a) A
ir p
ollu
tion
1b) W
ater
pol
lutio
n
1c) N
oise
&vi
brat
ion
1d) S
olid
was
te
1e) G
HG
em
issi
on
1f) E
nerg
y so
urce
1g) W
ater
use
s
1h) L
and/
spac
e,
way
leav
e 1i
) Haz
ard/
risk
1j) T
rans
-bou
ndar
y
pollu
tion
1k) P
ollu
tion
Con
trol
Tec
hnol
ogy
1 Thermal power (Natural
gas/LNG) C C C C C B B B B B E
2 Thermal power (Heavy
oil/Diesel oil) C C C C B B B B B B E
3 Thermal power (Coal fired) C C C C B B B B B B E
4 Thermal power (Oil shale) C C C B B B B B B B C
5 Hydropower (Pumping
storage) D B D D D C C B D E E
6 Wind power D D B D D C D B D E E
7 Solar power D D D D D C D B D E E
8 Transmission/Distribution D D D D D D D B D E E Source: JICA Study Team

9-100
(ii) Evaluation Indicator -2
a) Protected Areas
-As for thermal power generation by coal fired and oils shale burning, higher emission of pollutants such as SOx, NOx and PM which is likely to disperse wider area and a large amount of generation of fly ash, which is likely to scatter is expected. In addition, oil shale mines are distributed in all over the country, a higher possibility to overlap or to be close to the Protected Area and other designated environmental sensitive area Thus, rating of that by oil shale burning was set as {A} and that by coal fired was set as {B}.
-Rating of thermal power generation by gas and oil was set as {C} considering wide range dispersion of air pollutants such as NOx.
-Rating of other generation schemes was as {B} because of following reasons:
Pumped storage hydropower generation is based on the intake and discharge of seawater in Aqaba Bay, where in some area is the Protected Area and is required to observe strict regulation for conservation of marine environment.
For wind power and solar power generation it is necessary to secure rather larger area of land to attain as the same level of generation capacity, because density of generated energy is low. For transmission and distribution line it is necessary to secure land/space for transmission and distribution line and installation of tower with a long distance. Thus, there is a higher possibility to overlap or to be close to the Protected Area and other designated environmental sensitive area.
b) Conservation of ecosystem and biodiversity
Rating was set for each generation scheme based on the same reasons as (ii) a).
c) Cultural property and historical and archaeological heritage sites
Rating for each power generation was set up based on the same reasons as (ii) a).
d) Public Health and Sanitation Condition
Rating was decided considering extent of impact on human health due to air pollutants
Among thermal power generations in case of coal and oil shale burning, higher level of emission of NOx and SOx are expected in addition to PM10 and PM2.5. Thus, ratings for those of coal and oils shale burning were set as {A} and those of thermal power plants using gas or oil are as {B}.
For other power generation scheme such as wind power and solar power emission of air pollutants is not expected in operation. However, some amount of dust and NOx emission is expected construction and decommissioning work. Thus, rating was set as {D}.

9-101
e) Tourism Activity
In general tourism activity is linked to location and route related to the Protected Area, having valuable ecosystem and biodiversity and cultural and heritage sites, where are attractive to visit by tourists. Thus, rating of generation schemes was set same as (ii) a)
However, candidate site for thermal power generation by gas and oil and pumped storage hydropower generation is rather limited. Thus, their rating was set as {D}.
f) Landscape
In general, valuable landscape is linked to location and route related to the Protected Area, having valuable ecosystem and biodiversity and cultural and heritage sites, where are attractive to visit by tourists. Thus, rating of generation schemes was set same as (ii) a).
g) Ranged Land/Bedouin
Grazing activities and living area of Bedouins are mostly done in desert area. Thus, there is higher possibility to overlay or close to candidate site for generation development. Basically rating was set due to the same reasons as (ii) a). However, candidate site for thermal power generation by gas and oil and pumped storage hydropower generation is rather limited. Thus, their rating was set as {D}.
h) Forest Area
In Jordan land is mostly occupied with dessert area and land of forest area is less than 1 %. In forest area valuable natural habitat, ecosystem and biodiversity, which should be conserved are distributed. Basically rating was set due to the same reasons as 2) a). However, candidate site for thermal power generation and pumped storage hydropower generation is rather limited. Thus, their rating was set as {D}.
i) Coastal Area
In Jordan, coastal area is only found in Aqaba Bay and Dead Sea area. In coastal area, valuable natural habitat, ecosystem and biodiversity, which should be conserved under strict environmental regulation, are distributed. Basically, rating was set due to the same reasons as (ii) a). However, candidate site for thermal power generation and pumped storage hydropower generation is rather limited. Thus, their rating was set as {D}.
Results of rating by evaluation indicators -2 are shown in Table 9.5-8.

9-102
Table 9.5-8 Results of Rating due to Evaluation Indicator -2
Generation Development
Evaluation Indicator - 2
2a) P
rote
cted
Are
as
2b) E
cosy
stem
/bio
dive
rsity
2c) C
ultu
ral
prop
erty
/her
itage
site
s 2d
) Pub
lic h
ealth
2e) A
esth
etic
val
ue
2f) T
ouri
sm
2f) R
ange
land
/Bed
ouin
2h)
Fore
st a
rea
2i) C
oast
al a
rea
1 Thermal power (Natural gas/LNG) C C C C C C C C C
2 Thermal power (Heavy oil/Diesel oil) C C C C C C C C C
3 Thermal power (Coal fired) C C C B C C C C B
4 Thermal power (Oil shale) C C C B C C C C D
5 Hydropower (Pumping storage) C B C D C D D D B
6 Wind power C C C D C C C C C
7 Solar power C C C D C C C C C
8 Transmission/Distribution B B B D B B B B C Source: JICA Study Team
(4) Estimation of Integrated Possible Negative Impacts
In the alternative comparison, it is necessary to compare ratings of many items at the same time and to make clear the difference of impacts. Therefore, so-called “Multi-Criteria-Analysis” method is often applied by applying “semi-quantitative evaluation” to the rating of each item. This can be done by converting qualitative value of the rating to numerical value and introducing “weighting value” to the indicators. In this study following assumption was applied.
In order to evaluate integrated possible negative impacts semi-quantitatively rather than qualitatively. Estimation of integrated negative impacts was carried out based on ratings of items in environmental indicator -1 (Table 9.5-7) and environmental indicator -2 (Table 9.5-8).
(i) Setting points and weights
Points (Ri) were set up corresponding to 5 class rating for items of evaluation indicator in Table 9.5-8. In the Table 9.5-9 maximum 10 point is provided for rating A (Significant impact) and 0 point is provided for rating E (No or negligible impact).

9-103
Table 9.5-9 Setting Points for corresponding Rating
Rating Extent of Negative Impact Point (Ri)
A Significant impact 10
B Not so significant as A, but considerable impact 7
C Medium impact 4
D Little impact or at present unknown 2
E No or negligible impact 0 Source: JICA Study Team
In addition, two kind of weighting (Wi) were set up to Evaluation Indicators as shown in Table 9.5-10. In the Table 9.5-10 higher weighting of “2” (W1) is provided for items of Evaluation Indicator 1 considering they are inherent in power generation and relating to causing more negative impacts than environmental Indicator 2.
Table 9.5-10 Weighting of environmental Indicators Evaluation Indicator Weighting(Wi)
W1 Evaluation Indicator-1 Air pollution, Greenhouse gases, Land/space,
Energy use, water use etc. 2
W2 Evaluation Indicator-2 All the Evaluation indicator -2 1 Source: JICA Study Team
(ii) Calculation of Integrated Negative Impacts
Extent of negative impacts due to each generation development was estimated by comparing evaluation score, S (see below) of each generation scheme as shown in Table 9.5-11 and Figure 9.5-2.
Integrated Negative Impact Index (S) = Σ {(Ri) x (Wi)}/ (Σ Wi), while S (max.) is 10 score, S (min.) is 0 score.
In the Table ranking among 8 generation development plans and grade of integrated negative impact are also indicated.
Value of negative impact index (S) indicates that there is little difference among the generation development plans, although thermal power generations are higher values and renewable power such as wind and solar are lower values.

9-104
Table 9.5-11 Calculated Results of Possible Negative Impacts
Generation Development Plan
Total Score (Σ (Ri x Wi) Negative
Impact Index
(S) EI-1 EI-2 Total Score
(TS)
1 Thermal power (Natural gas/LNG) 80 36 116 3.7
2 Thermal power (Heavy oil/Diesel oil) 86 36 122 3.9
3 Thermal power (Coal fired) 98 42 140 4.5
4 Thermal power (Oil shale) 106 37 143 4.6
5 Hydropower (Pumping storage) 78 34 112 3.6
6 Wind power 64 34 98 3.2
7 Solar power 58 34 92 3.0
8 Transmission/Distribution 50 55 105 3.4
Source: JICA Study Team
Source: JICA Study Team
Figure 9.5-2 Generation Development and Negative Impact Index
3.73.9
4.5 4.6
3.6
3.23
3.4
0
0.5
1
1.5
2
2.5
3
3.5
4
4.5
5
Negative Impact Index (S)

9-105
Comprehensive Evaluation of Generation Development Scenarios
(1) General procedures for Comprehensive Alternative Comparison
The main objective of the SEA method is to conduct a comprehensive impact assessment of the master plan by using a SEA methodology as mentioned in 9.2 and as shown in Figure 9.5-3.
It does not only deal with the negative impacts of the engineering, economic, financial, environmental and social aspects of the master plan but also the positive ones. The so-called Multi-Criteria Analysis (MCA), which is a useful evaluation method that decides priorities under different development alternatives, is being employed as a key methodology for the comprehensive assessment by SEA.
Consistency of upper level policies, future, demand, technical feasibility, economic and financial data etc. as well as environmental and social considerations.
Selection of Evaluation Indicators/Factors Setting criteria, rating, point etc. Weighting of evaluation indicators Calculation of total score (TS) and evaluation score (S) Prioritization or ranking based on TS and S
Results of comprehensive evaluation of alternative generation development plans were reported for prioritization of candidate site for power plant with site information, which correspondent to SEA-2 in electric sector master plan Study by JICA MCA matrix as shown in Table 9.2-2
Source: JICA Study Team
Figure 9.5-3 Procedures of Comprehensive Evaluation of Alternative PPPs for master plan
Semi-quantitative evaluation by using Rating (R )
and Weighting (W) of the Criteria
MCA (Multi Criteria
Analysis)Q i = Σ (Ri) X (Wi) - Calculation of Sum Total
Total Q - Compare Total Score and Ranking
(1) Environmnetal Baseline Data in Jordan, (2)
Legislation of Jordan/JICA GuidlinesPPPs for Generation Development
Evaluation Factors - A (Environmental and Social
Considerations)
Evaluation Factors - B (Technological, Economic and
Financial items, Demand fetures, Conformity with
upper level PPPs etc.)
Comprehensive Evaluation of Generation Development Plans or
Scenarios

9-106
(2) Comprehensive Evaluation of Generation Development Scenarios in Terms of Environmental and Social Considerations
In Figure 9.5-4 procedures for alternative comparison of generation development scenarios in terms of environmental and social considerations.
Expected Impacts by Scoping
(1) Environmental Baseline Data of Jordan, (2)
Legislation of Jordan / JICA Guidelines
Scenarios for Generation
Development
Anticipated Activities
(1) Evaluation Factors -1 (Inherent in Generation
Development)
(2) Evaluation Factors -2 (Environmental Items having
a possibility of adverse impacts by Generation
Development)
Priority Scenario (Less Negative Impacts)
Source: JICA Study Team
Figure 9.5-4 Procedures for Alternative Comparison of Generation Development Scenarios in terms of Environmental and Social Considerations.
(i) Evaluation by Total Amount of CO2 Emission
As for the value of total amount of CO2 emission from 2015 to 2034 it may change depending on schedule of nuclear power plant operation as shown in Table 9.5-12.
In terms of total amount of CO2 emission, extent of negative impacts is estimated higher values for scenario No. 2 (Use of Domestic Fuel) and No. 4 (Energy Mix 2), and lowest value for scenario No.1 (Maturity of Technology).

9-107
Table 9.5-12 Total amount of CO2 emission between 2015 and 2034
Scenario for
Generation Development
On Schedule Ranking
5 Years behind
Schedule Ranking
10 Years
behind
Schedule Ranking
(CO2 k-Ton) (CO2 k-Ton) (CO2 k-Ton)
1 Maturity of Technology 213,653 5 249,270 5 284,815 5
2 Use of Domestic Fuel 229,387 3 286,248 2 326,660 1
3 Energy Mix 1 221,524 4 272,684 4 307,993 4
4 Energy Mix 2 237,716 1 290,330 1 326,240 2
Note: * Schedule of Nuclear Power Plant Operation
Source: JICA Study Team
(ii)Comprehensive Evaluation by Applying Evaluation Indicator -1 and 2
Similar procedures of comprehensive evaluation in 9.5.1 were applied to comprehensive evaluation of generation development scenarios in terms of environmental and social considerations.
Table 9.5-13 Features of Generation Development Scenarios Scenario Conditions
1. Maturity of Technology Oil Shale; Only one committed project (Attarat)
Renewable Energy; 20% of system’s peak demand
2. Use of Domestic Fuel
Oil Shale; Total 1670(MW) (18% of Total Installed Capacity)
2nd project; after 2024 in order to evaluate the performance of Attarat project.
Renewable Energy; 20% of system’s peak demand
3. Energy Mix 1
Oil Shale; Total 1070(MW) (11% of Total Installed Capacity)
2nd project; after 2024 in order to evaluate the performance of Attarat project.
Renewable Energy; 20% of system’s peak demand
4. Energy Mix 2 (including
Coal Fired Unit)
Oil Shale; Total 1070(MW) (11% of Total Installed Capacity)
2nd project; after 2024 in order to evaluate the performance of Attarat project.
Coal unit; 600(MW)
Renewable Energy; 20% of system’s peak demand
Source: JICA Study Team (Chapter 5)

9-108
Table 9.5-14 Composition of Installed Capacity (On Schedule of Nuclear Plant Operation)
Scenario LNG Oil
Shale Coal Wind Solar
Total-
1* Nuclear
Total-
2**
1 Maturity of
Technology 3,855 470 0 614 1,205 6,144 2,000 8,144
2 Use of Domestic
Fuel 2,505 1,670 0 614 1,205 5,994 2,000 7,994
3 Energy Mix 1 3,405 1,070 0 614 1,205 6,294 2,000 8,294
4 Energy Mix 2 2,505 1,070 600 614 1,205 5,994 2,000 7,994
Note: * Total -1 Installed capacity excluding nuclear power plant, ** Total -2 Whole installed capacity Source: JICA Study Team
Table 9.5-15 Composition of Installed Capacity (5 Years behind Schedule of Nuclear Plant Operation)
Scenario LNG Oil
Shale Coal Wind Solar
Total-
1* Nuclear
Total-
2**
1 Maturity of
Technology 3,855 470 0 614 1,205 6,144 2,000 8,144
2 Use of Domestic
Fuel 2,505 1,670 0 614 1,205 5,994 2,000 7,994
3 Energy Mix 1 3,405 1,070 0 614 1,205 6,294 2,000 8,294
4 Energy Mix 2 2,505 1,070 600 614 1,205 5,994 2,000 7,994
Note: * Total -1 Installed capacity excluding nuclear power plant, ** Total -2 Whole installed capacity Source: JICA Study Team
Table 9.5-16 Composition of Installed Capacity (10 Years behind Schedule of Nuclear Plant Operation)
Scenario LNG Oil
Shale Coal Wind Solar
Total-
1* Nuclear
Total-
2**
1 Maturity of
Technology 4,755 470 0 614 1,205 7,044 1,000 8,044
2 Use of Domestic
Fuel 3,405 1,670 0 614 1,205 6,894 1,000 7,894
3 Energy Mix 1 4,305 1,070 0 614 1,205 7,194 1,000 8,194
4 Energy Mix 2 3,405 1,070 600 614 1,205 6,894 1,000 7,894
Note: * Total -1 Installed capacity excluding nuclear power plant, ** Total -2 Whole installed capacity Source: JICA Study Team
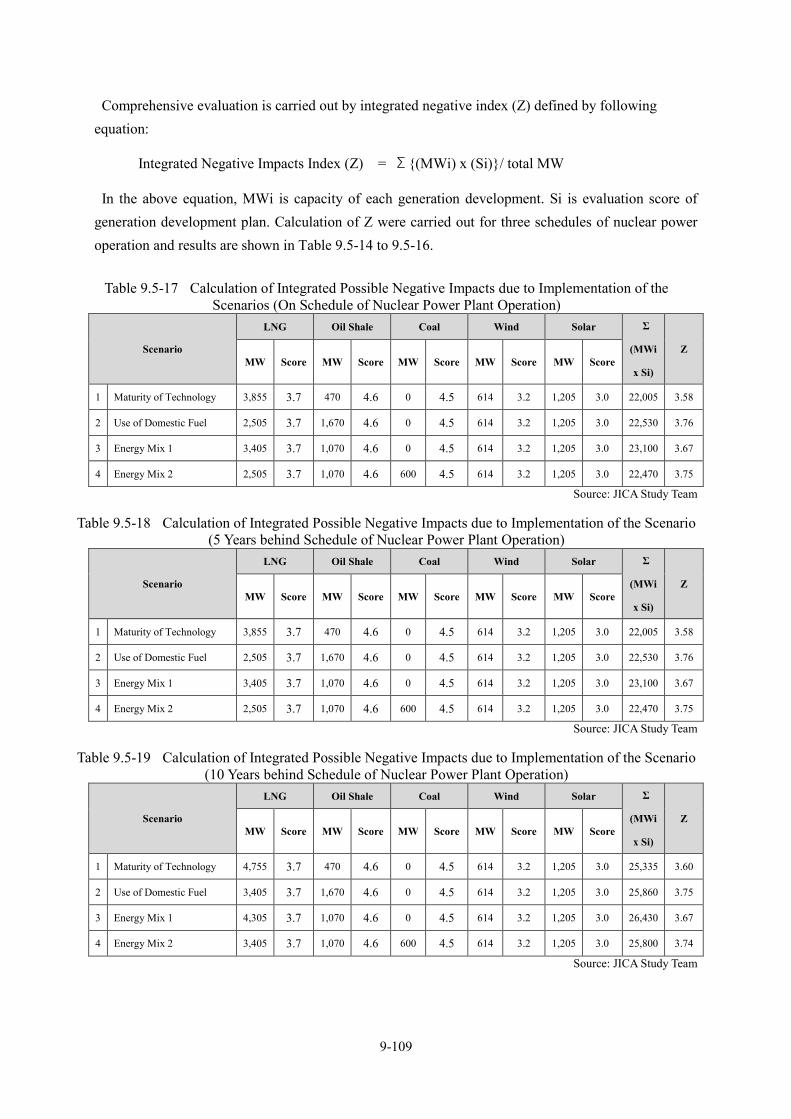
9-109
Comprehensive evaluation is carried out by integrated negative index (Z) defined by following equation:
Integrated Negative Impacts Index (Z) = Σ{(MWi) x (Si)}/ total MW
In the above equation, MWi is capacity of each generation development. Si is evaluation score of generation development plan. Calculation of Z were carried out for three schedules of nuclear power operation and results are shown in Table 9.5-14 to 9.5-16.
Table 9.5-17 Calculation of Integrated Possible Negative Impacts due to Implementation of the Scenarios (On Schedule of Nuclear Power Plant Operation)
Scenario
LNG Oil Shale Coal Wind Solar Σ
(MWi
x Si)
Z MW Score MW Score MW Score MW Score MW Score
1 Maturity of Technology 3,855 3.7 470 4.6 0 4.5 614 3.2 1,205 3.0 22,005 3.58
2 Use of Domestic Fuel 2,505 3.7 1,670 4.6 0 4.5 614 3.2 1,205 3.0 22,530 3.76
3 Energy Mix 1 3,405 3.7 1,070 4.6 0 4.5 614 3.2 1,205 3.0 23,100 3.67
4 Energy Mix 2 2,505 3.7 1,070 4.6 600 4.5 614 3.2 1,205 3.0 22,470 3.75
Source: JICA Study Team
Table 9.5-18 Calculation of Integrated Possible Negative Impacts due to Implementation of the Scenario (5 Years behind Schedule of Nuclear Power Plant Operation)
Scenario
LNG Oil Shale Coal Wind Solar Σ
(MWi
x Si)
Z MW Score MW Score MW Score MW Score MW Score
1 Maturity of Technology 3,855 3.7 470 4.6 0 4.5 614 3.2 1,205 3.0 22,005 3.58
2 Use of Domestic Fuel 2,505 3.7 1,670 4.6 0 4.5 614 3.2 1,205 3.0 22,530 3.76
3 Energy Mix 1 3,405 3.7 1,070 4.6 0 4.5 614 3.2 1,205 3.0 23,100 3.67
4 Energy Mix 2 2,505 3.7 1,070 4.6 600 4.5 614 3.2 1,205 3.0 22,470 3.75
Source: JICA Study Team
Table 9.5-19 Calculation of Integrated Possible Negative Impacts due to Implementation of the Scenario (10 Years behind Schedule of Nuclear Power Plant Operation)
Scenario
LNG Oil Shale Coal Wind Solar Σ
(MWi
x Si)
Z MW Score MW Score MW Score MW Score MW Score
1 Maturity of Technology 4,755 3.7 470 4.6 0 4.5 614 3.2 1,205 3.0 25,335 3.60
2 Use of Domestic Fuel 3,405 3.7 1,670 4.6 0 4.5 614 3.2 1,205 3.0 25,860 3.75
3 Energy Mix 1 4,305 3.7 1,070 4.6 0 4.5 614 3.2 1,205 3.0 26,430 3.67
4 Energy Mix 2 3,405 3.7 1,070 4.6 600 4.5 614 3.2 1,205 3.0 25,800 3.74
Source: JICA Study Team
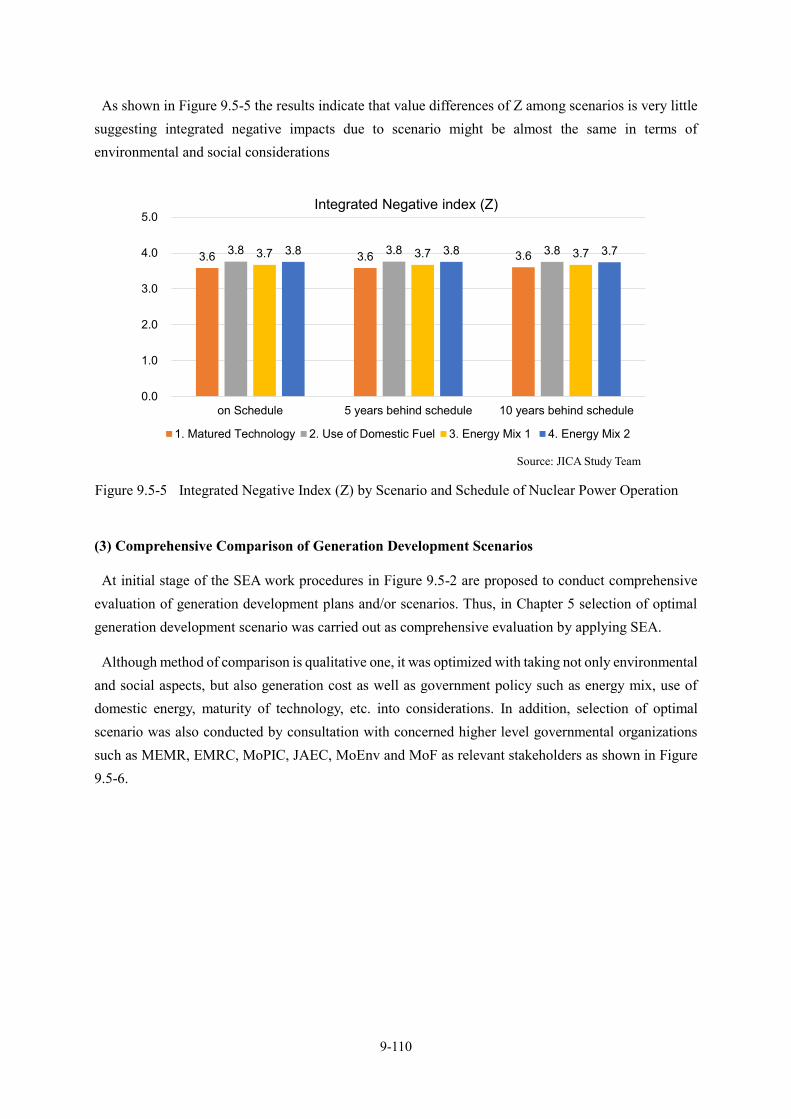
9-110
As shown in Figure 9.5-5 the results indicate that value differences of Z among scenarios is very little suggesting integrated negative impacts due to scenario might be almost the same in terms of environmental and social considerations
Source: JICA Study Team
Figure 9.5-5 Integrated Negative Index (Z) by Scenario and Schedule of Nuclear Power Operation
(3) Comprehensive Comparison of Generation Development Scenarios
At initial stage of the SEA work procedures in Figure 9.5-2 are proposed to conduct comprehensive evaluation of generation development plans and/or scenarios. Thus, in Chapter 5 selection of optimal generation development scenario was carried out as comprehensive evaluation by applying SEA.
Although method of comparison is qualitative one, it was optimized with taking not only environmental and social aspects, but also generation cost as well as government policy such as energy mix, use of domestic energy, maturity of technology, etc. into considerations. In addition, selection of optimal scenario was also conducted by consultation with concerned higher level governmental organizations such as MEMR, EMRC, MoPIC, JAEC, MoEnv and MoF as relevant stakeholders as shown in Figure 9.5-6.
3.6 3.6 3.6 3.8 3.8 3.8 3.7 3.7 3.7 3.8 3.8 3.7
0.0
1.0
2.0
3.0
4.0
5.0
on Schedule 5 years behind schedule 10 years behind schedule
Integrated Negative index (Z)
1. Matured Technology 2. Use of Domestic Fuel 3. Energy Mix 1 4. Energy Mix 2
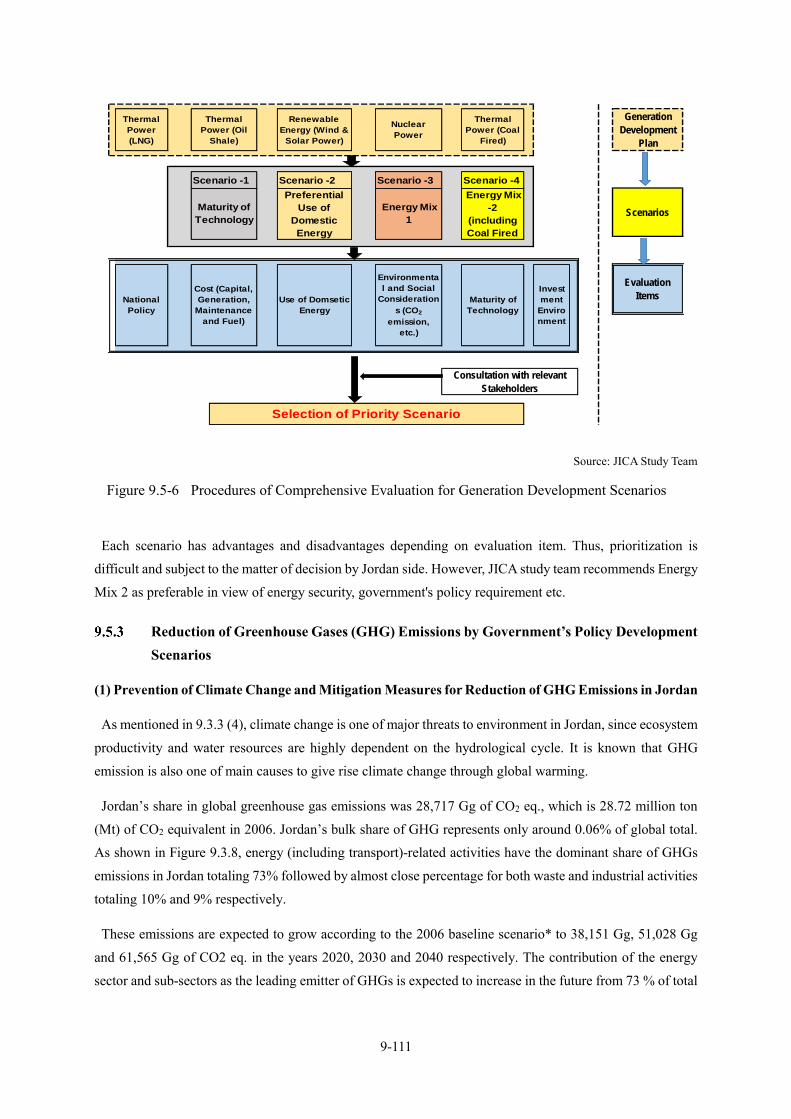
9-111
Scenario -1 Scenario -2 Scenario -3 Scenario -4
Maturity of
Technology
Evaluation
ItemsInvest
ment
Enviro
nment
Generation
Development
Plan
Scenarios
Thermal
Power
(LNG)
Thermal
Power (Oil
Shale)
Renewable
Energy (Wind &
Solar Power)
Nuclear
Power
Thermal
Power (Coal
Fired)
National
Policy
Cost (Capital,
Generation,
Maintenance
and Fuel)
Use of Domsetic
Energy
Environmenta
l and Social
Consideration
s (CO2
emission,
etc.)
Maturity of
Technology
Preferential
Use of
Domestic
Energy
Energy Mix
1
Energy Mix
-2
(including
Coal Fired
Consultation with relevant
Stakeholders
Selection of Priority Scenario
Source: JICA Study Team
Figure 9.5-6 Procedures of Comprehensive Evaluation for Generation Development Scenarios
Each scenario has advantages and disadvantages depending on evaluation item. Thus, prioritization is
difficult and subject to the matter of decision by Jordan side. However, JICA study team recommends Energy
Mix 2 as preferable in view of energy security, government's policy requirement etc.
Reduction of Greenhouse Gases (GHG) Emissions by Government’s Policy Development Scenarios
(1) Prevention of Climate Change and Mitigation Measures for Reduction of GHG Emissions in Jordan
As mentioned in 9.3.3 (4), climate change is one of major threats to environment in Jordan, since ecosystem
productivity and water resources are highly dependent on the hydrological cycle. It is known that GHG
emission is also one of main causes to give rise climate change through global warming.
Jordan’s share in global greenhouse gas emissions was 28,717 Gg of CO2 eq., which is 28.72 million ton
(Mt) of CO2 equivalent in 2006. Jordan’s bulk share of GHG represents only around 0.06% of global total.
As shown in Figure 9.3.8, energy (including transport)-related activities have the dominant share of GHGs
emissions in Jordan totaling 73% followed by almost close percentage for both waste and industrial activities
totaling 10% and 9% respectively.
These emissions are expected to grow according to the 2006 baseline scenario* to 38,151 Gg, 51,028 Gg
and 61,565 Gg of CO2 eq. in the years 2020, 2030 and 2040 respectively. The contribution of the energy
sector and sub-sectors as the leading emitter of GHGs is expected to increase in the future from 73 % of total

9-112
emissions in the year 2006 to 83 % in the year 2040. Thus, energy sector is required to make a strong effort
in order to reduce GHG emissions.
For addressing 2015 United Nations Climate Change Conference (COP 21) held in Paris, Jordan nationally
determined to reduce its GHG emissions by a bulk of 14 % until 2030. In order to achieve the target Jordan
also planned to cope with by implementing mitigation measures through more than 97 projects in whole
sectors including energy sector.
(2) Reduction of CO2 Emission through Government’s Development Policy Scenarios
Among GHG emissions emission of CO2 emission accounts for about 84% in 2006 as shown in Table 9.3-
8. Therefore, reduction of CO2 emission is required to all sectors in Jordan, especially to energy sector, which
contributes mostly CO2 emission.
(i) Total Amount of CO2 Emission in 2030
Total amount of CO2 emission was estimated and compared with five options of generation development
scenarios.
In Jordan operation of two nuclear power plants was determined for 1st unit in 2023 and 2nd unit in 2025 by
the Government policy. However, the schedule of the operation is expected to be some delay. Thus, at present
estimation of total amount of CO2 emission (k-Ton) in 2030 was conducted considering the change of
schedule nuclear power plant operation for three cases, i.e. (a) on schedule, (b) 5 years behind schedule and
(c) 10 years behind schedule. Results are shown in Table 9.5-21.
Total CO2 emission is expected to increase depending on the delay of nuclear power operation and share of renewable energy power operation. This is considered as increase in future demand of energy use due to increase in population and business activities, and operation of oil shale burning power plant and coal fired power plant, which have higher value of CO2 emission intensity.
Table 9.5-20 Total Amount of CO2 Emission (k-Ton)
Scenario On schedule 5 years behind
schedule
10 years behind
schedule
1 Maturity of Technology 10,094 13,615 17,221
2 Use of Domestic Fuel 10,094 16,923 21,608
3 Energy Mix 1 10,094 15,829 19,428
4 Energy Mix 2 11,585 17,321 20,975 Source: JICA Study Team
As for scenario No. 4-2 (Energy mix with coal – 15% share of renewable energy in electricity production),
simple comparison with expected GHG emission (51, 028 k-Ton) of the whole Jordan in 2030, indicates that
estimated total amount of CO2 emission in case of (a) on schedule, (b) 5 years behind schedule and (c) 10
years behind schedule is 11,652k-Ton (22.8 %), 13,882 k-Ton (27.2%), 20,975 k-Ton (41.1%), respectively.
In addition, these values are higher than that of 14% reduction of targeted value (95,700 k-Ton) in 2030,

9-113
which is calculated based on power generation performance of NEPCO (2014).
(ii) CO2 Emission Intensity
As mentioned in Chapter 5 it was concluded that Scenario No.4 – Energy Mix including Coal Fired Unit
and 15% share of renewable energy is more preferable than other three scenarios.
CO2 emission intensity (kg- CO2/kWh) was estimated for Scenario No.4 and in case of 20 % share of renewable energy power plant operation and shown in Table 9.5-21.
CO2 emission intensity is expected to reduce considerably in case of (a) on schedule and (b) 5 years behind due to contribution of nuclear power plant and renewable power plant operation, which have actually no CO2 emission intensity. Accordingly, reduction ratio (%) is 31.8 % to 45.9% in both cases.
Considerable reduction of CO2 emission intensity is expected by the contribution of renewable power plant and nuclear power plant.
The more year nuclear development is behind schedule, the more CO2 emission intensity increases.
Table 9.5-21 Reduction of CO2 Emission Intensity by Scenario
Generation Development
Scenario Particular*
Nuclear Power Plant Operation CO2
emission
intensity
in 2006
No delay 5 year
delay
10 year
delay
1.Matured Technology (kg-CO2/kWh) 0.280 0.377 0.477 0.566
Reduction (%) 50.6 33.4 15.7 0
2.Use of Domestic Fuel (kg-CO2/kWh) 0.280 0.469 0.599 0.566
Reduction (%) 50.6 17.2 -5.8 0
3.Energy Mix 1 (kg-CO2/kWh) 0.280 0.439 0.538 0.566
Reduction (%) 50.6 22.5 4.9 0
4.Energy Mix 2 (kg-CO2/kWh) 0.321 0.480 0.581 0.566
Reduction (%) 43.3 15.2 -2.7 0 Note: * Reduction (%) is reduction of CO2 emission intensity from that in 2006 (0.566 kg-CO2/kWh)
Source: JICA Study Team
CO2 emission intensity in 2030 was calculated and compared it with the base case in 2006 on electric sector.
-Base emission intensity: total CO2 emission in 2006 = [kg-CO2]/electricity production in 2006 [kWh] = 0.566 [kg-CO2/kWh]
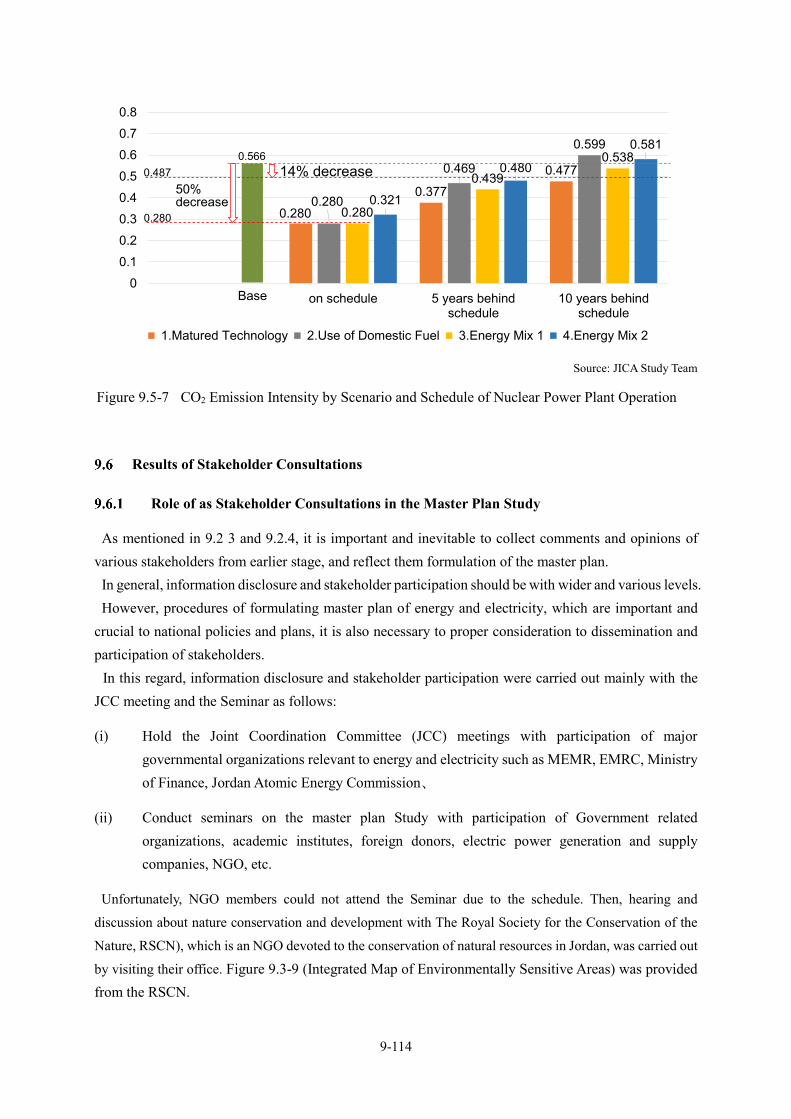
9-114
Source: JICA Study Team
Figure 9.5-7 CO2 Emission Intensity by Scenario and Schedule of Nuclear Power Plant Operation
Results of Stakeholder Consultations
Role of as Stakeholder Consultations in the Master Plan Study
As mentioned in 9.2 3 and 9.2.4, it is important and inevitable to collect comments and opinions of various stakeholders from earlier stage, and reflect them formulation of the master plan. In general, information disclosure and stakeholder participation should be with wider and various levels. However, procedures of formulating master plan of energy and electricity, which are important and
crucial to national policies and plans, it is also necessary to proper consideration to dissemination and participation of stakeholders.
In this regard, information disclosure and stakeholder participation were carried out mainly with the JCC meeting and the Seminar as follows:
(i) Hold the Joint Coordination Committee (JCC) meetings with participation of major governmental organizations relevant to energy and electricity such as MEMR, EMRC, Ministry of Finance, Jordan Atomic Energy Commission、
(ii) Conduct seminars on the master plan Study with participation of Government related organizations, academic institutes, foreign donors, electric power generation and supply companies, NGO, etc.
Unfortunately, NGO members could not attend the Seminar due to the schedule. Then, hearing and
discussion about nature conservation and development with The Royal Society for the Conservation of the
Nature, RSCN), which is an NGO devoted to the conservation of natural resources in Jordan, was carried out
by visiting their office. Figure 9.3-9 (Integrated Map of Environmentally Sensitive Areas) was provided from the RSCN.
0.000
0.280
0.377
0.477
0.000
0.280
0.469
0.599
0.000
0.280
0.439 0.538
0.000
0.321
0.480
0.581
0
0.1
0.2
0.3
0.4
0.5
0.6
0.7
0.8
Base on schedule 5 years behindschedule
10 years behindschedule
1.Matured Technology 2.Use of Domestic Fuel 3.Energy Mix 1 4.Energy Mix 2
0.5660.487 14% decrease
0.280
50% decrease
Base

9-115
Results of Joint Coordination Committee Meetings
(1) Joint Coordination Committee (JCC)
JICA study team supported the establishment of JCC constituted of MEMR, EMRC, Ministry of Finance, Ministry of Environment, Jordan Atomic Energy Commission in addition to NEPCO of the main counterpart, and builds the operation system so that the comprehensive master plan can be formulated regularly after this Study. As for organizational chart and the member list of the JCC are shown in Figure 9.6-1 and Table 9.6-1.
Source: JICA Study Team Figure 9.6-1 Organization Chart of the JCC
Table 9.6-1 Members of JCC Name Organization Position
Eng. Abdelfattah Aldaradkeh NEPCO Managing Director Project Director
Mr. Shokichi Sakata JICA Jordan Office Chief Representative
Eng. Amani Azzam NEPCO Managing Director Assistant for Operation & Planning
Project Manager
Eng. Mohmmad Abu Zarour NEPCO Power System Planning Department Manager Member
Eng. Muwafaq Humaidet NEPCO Operational Studies Department Manager Member
Eng. Feda Jaradat MoPIC Member
Ms. Norma Al- Hersh MoF Member
Eng. Izzat Abu Humra MoE Member
Eng. Fariba Hosseini MEMR Member
Eng. Wijdan AlRabadi EMRC Member
Management Side
(Joint Coordination Committee)
Project Side
Representatives (MoPIC, MEMR,
EMRC, MoF, JAEC, MoEnv and Others)
Working Group NEPCO, MEMR, EMRC,
MoF, MoEnv & Others
JICA Jordan Office (JICA Headquarters) JICA Study Team
Project Director (NEPCO Managing
Director)

9-116
Meqdad A.Qadous, M.A EMRC Member
Dr. Sufian Bataenah MEMR Member
Eng. Bahjat Aulimat JAEC Member
Source: JICA Study Team
JCC meetings were held 5 times according to the progress of the master plan Study as shown in Table 9.6-2.
Table 9.6-2 Outline of the JCC Meetings JCC Meeting Date Major Agenda
1st JCC Meeting March 2nd 2015 Outline of the Study Plan, Setting Members of JCC and
WGs
2nd JCC Meeting November 10th 2015 Work Plan and Progress of each WG
3rd JCC Meeting April 10th 2016 Method of Selection of Optimal Generation Development
Plan and others
4th JCC Meeting May 29th 2016 Optimal Generation Development Scenarios and others
5th JCC Meeting August 30th 2016 Optimal Generation Development Scenarios, Generation
Network System, Economic and Financial Analysis
Source: JICA Study Team
(2) The 1st JCC Meeting (March 2nd 2015)
The 1st JCC meeting was held at the auditorium in NEPCO’s headquarter on March 2nd 2015. Opening remarks were made by Managing Director of NEPCO and Senior Representative of JICA Jordan Office. After that JICA study team explained the outline of the inception report.
Major points discussed were as follows.
Setting Members of JCC and WG
The members of JCC and Working Group (WG) were modified and officially accepted by JCC. There are four WGs, namely i) Power Demand Forecast, ii) Generation Development Planning, iii) Power System Planning and iv) Environmental and Social Considerations. NEPCO was requested to arrange the members of Financial WG.
Revised Inception Report
Although the draft of inception report was submitted to all concerned parties and accepted by the JCC, in principle, the said report will be revised in accordance with any comments and opinions through discussions in the JCC and WGs, and will be submitted to NEPCO in the beginning of April 2015.

9-117
Major items to be modified are to include demand side management in the Power System WG, not in the Power Demand Forecasting WG.
Data and information sharing
JICA study team emphasized the importance of data and information sharing for the master plan, and the representative of the relevant organizations agreed to provide them.
Kick-off meeting on the four WGs
Representative of the relevant organizations agreed to hold kick-off meetings for the WGs.
(3) The 2nd JCC Meeting (November 10th 2015)
The 2nd JCC Meeting was held at the auditorium in the NEPCO headquarters on November 10, 2015. Opening remarks were made by Managing Director of NEPCO, and Chief Representative of JICA Jordan Office. JICA study team explained the progress of the study for each WG.
Major points discussed in the JCC are as follows:
Power Demand Forecast
(i) The team leader of the WG made a presentation of detailed procedures and the results of power demand and peak demand forecasts and the issues arising from those results.
(ii) The team leader of the WG explained that peak demand in 2015 using the LF of 0.69 was estimated at 3,039MW, while the actual peak demand was 3,300MW in August 2015. This difference seems to be caused by unexpected increase in temperature in the summer season. Therefore, Team leader of WG suggested that the elastic coefficient for the load factor of 0.93 which was calculated based on the historical data of demand and temperature in the period of 2011-2015, be taken into account for the peak demand forecast.
(iii) The JCC members requested considering the application of the appropriate LF to calculate the peak demand up to 2040. This is because the said factor is vitally important for the future planning of generation development planning of the country.
Generation Development Planning
(i) The Commissioner of the EMRC made a comment that some requirement from tender process for renewable development should be considered in the examination of capacity of the future renewable development. JICA study team had a same opinion on this matter. It was concluded that such requirement would be considered in the Study.
(ii) The Commissioner of the EMRC member asked the background for the selection of the size of the candidate plant in the Study. JICA study team explained that the size was decided based on the result of the sub-study on unit size.

9-118
(iii) The Operation and Planning Managing Director Assistant of NEPCO commented that the oil shale costs should be updated. It is concluded that such cost should be discussed among the WG members and updated.
(iv) The committee members from the Jordanian side made comments that coal-fired thermal power should be included as an option in the Study. JICA JICA study team explained that coal-fired thermal power development in Jordan might face some obstacles such as land limitation of coastal area, higher cost of development and operation, and difficulty of obtaining consensus from neighboring communities especially in Aqaba. JICA study team also commented that land availability and rough cost estimates should be studied prior to the master plan. JICA study team needs a further study on a coal-fired power plant option before including it in the master plan study. The master plan study will include a coal-fired thermal power plant in the coming phase. It was concluded that the WG would continue to discuss how the coal-fired thermal power should be included in the Study.
Power System Planning
(i) The team leader of the WG explained the BSP planning methodology for the efficient utilization of transformers in BSP.
(ii) The commissioner of the EMRC asked the premise of supply reliability in the methodology used in the study. The team leader of the WG explained that the supply reliability is maintained in the same level as the NEPCO practice.
(iii) The Team leader asked the commissioner of the EMRC to obtain the remaining CESI reports of the loss reduction study. The commissioner promised to send the reports to JICA study team soon after receiving the reports from the distribution companies.
Economic and Financial Analysis
(i) As shown in the result of the analysis, investment in distribution-loss reduction is a very cost effective measure to alleviate the sector’s financial burden arising from the future power development and also will result in cutting power supply cost.
(ii) Power-supply cost reduction is expected to be ¢0.183/kWh (real 2015 price) by 2034.
Environmental and Social Considerations
(i) The team leader of the WG explained that the SEA was to be applied to the electricity master plan study.
(ii) It is necessarily important to disclose the SEA information and involve stakeholders from the early stage of the study. Therefore, the seminar of the master plan study will be held with participation of various stakeholders such as relevant governmental organization, research institutes, and academic institutions, NGOs, foreign donors etc., and also function as a stakeholder meeting.
(iii) The team leader of the WG also explained the progress of the work of the ESC and SEA.

9-119
1) Participating JCC Members -1
2) Participating JCC Members -2
3) Presentation by JICA study team
Figure 9.6-2 The 2nd JCC Meeting
(4) The 3rd JCC Meeting (April 10th 2016)
The 3rd JCC Meeting was held at the Jordan Hall in NEPCO’s headquarters on April 10, 2016.
Opening remarks were made by Managing Director of NEPCO, and Chief Representative, JICA Jordan Office. JICA study team explained the recent progress of the Study.
Major points discussed in the Meeting are as follows.
Generation Development Planning
i) JICA study team explained four scenarios of “Least Cost”, “Maturity of Technology”, “Use of Domestic Fuel” and “Energy Mix”.
ii) The JCC members asked JICA study team to consider the followings:
・ Set up an additional condition that 15% of generated energy comes from renewable energy
・ Estimate the acceptable capacity of renewable energy, and ratio of installed capacity of wind and solar power
・ Evaluate the necessary amount of reserve margin and battery storage to compensate the fluctuation of renewable energy
Power System Planning
i) JICA study team explained the draft Bulk Supply Point (hereinafter referred to as “BSP”) plans for JEPCO, EDCO and IDECO and the progress of the transmission planning with showing measures for the reliability improvement.
ii) NEPCO asked that the BSP group 5 of EDCO cannot become a BSP group due to the long distance among BSPs. JICA study team explained that this group was decided based on the load transfer level between BSPs from EDCO. This matter will be discussed in the WG.
iii) NEPCO asked JICA study team about the short-circuit level and measures when connecting with

9-120
the nuclear power plant. JICA study team explained that the analysis and discussions are ongoing in the WG.
iv) NEPCO asked that nuclear delay scenario will be analyzed in the WG. JICA study team explained that it will be analyzed in the WG.
(5) The 4th JCC Meeting (May 29th 2016)
The 4th JCC Meeting was held at the Meeting Room at NEPCO’s headquarters. Opening remarks were made by Manager of power system planning department in NEPCO and Senior Representative, JICA Jordan Office. JICA study team explained the recent progress of the Study. Major points discussed in the JCC are as follows.
Generation Development Planning
i) JICA study team explained the optimal generation development plan by taking account government policy such as energy mix, use of domestic energy, environmental aspect, etc. in addition to the least cost. NEPCO and JICA study team confirmed that optimal generation development plan in Jordan is “Energy mix including coal fired power plant” scenario.
ii) JICA study team explained the study results for the development of new coal fired power plant and the generation development plan in case that renewable energy is assumed to be developed as much as 15% of electricity production, which were requested from NEPCO in the 3rd JCC meeting.
iii) The JCC member asked JICA study team to propose the acceptable capacity of renewable energy in Jordan in technical point of view.
iv) The JCC member asked JICA study team to describe in the final report that the JICA master plan study does not optimize nuclear and Jordan Atomic Energy Commission bear responsibility the input data for nuclear.
Power System Planning
i) JICA study team explained the methodology of Bulk Supply Point (hereinafter referred to as “BSP”) Grouping and draft BSP plans for JEPCO, EDCO and IDECO up to 2034.
ii) JICA study team explained the draft transmission plans and capital investment cost up to 2034 including connection plans for nuclear power generation in combination with Attrat oil-shale power generation and main measures for 400kV and 132kV power system in the case of nuclear on schedule or nuclear behind schedule.
iii) NEPCO asked JICA study team to estimate the additional cost for the power system in which more renewable energy introduced. JICA study team explained that it will be discussed in the WG.

9-121
(6) The 5th JCC Meeting (August 30th 2016)
The 5th JCC Meeting was held at the Jordan Hall at NEPCO’s headquarters on August 30, 2016. Opening remarks were made by Managing Director of NEPCO and Chief Representative, JICA Jordan Office. JICA study team explained the results of the study.
Major points discussed in the JCC are as follows:
Generation Development Planning
i) JICA study team explained the optimal generation development plan by taking into account the government policy such as energy mix, use of domestic energy, environmental aspect, etc. in addition to the least cost. NEPCO and JICA study team confirmed that an optimal generation development plan in Jordan is “Energy mix 2” scenario.
ii) JICA study team explained the study results for the generation development plan of “Energy Mix 2” scenario, in which, renewable energy is assumed to be developed as much as 20% of peak demand and as much as 15% of electricity production. NEPCO and JICA study team confirmed that it was preferable to develop renewable energy as much as “20% of the peak demand” at the moment, and study the scenario “15% of electricity production” after evaluating actual performance of renewable energy, which will be introduced from 2016 to 2018.
iii) The JCC member asked JICA study team to change the development year of a coal-fired unit in generation development plan of “Energy Mix 2” scenario, in which nuclear units are developed on schedule because it is difficult to bring 2,600MW in three consecutive years. The development year of the coal-fired unit will be informed from NEPCO to JICA study team.
Power System Planning
i) JICA study team explained the methodology of Bulk Supply Point (hereinafter referred to as “BSP”) Grouping and cost comparison among New BSPs installation, Expansion of the existing BSPs and Reinforcement of distribution lines in addition to the BSP plans for JEPCO, EDCO and IDECO up to 2034.
ii) JICA study team explained the draft transmission plans and capital investment cost up to 2034 based on the case studies, such as connection plans for nuclear power generation in combination with the Attarat oil-shale power plant by considering the nuclear installation schedule (on/behind schedule)
iii) JICA study team explained the influence for the installing large amount of renewable energy as of 2034.
iv) NEPCO asked JICA study team to evaluate BSP grouping effect in terms of the cost of BSP and transmission system. JICA study team will estimate the cost roughly and describe it in the final report.
v) NEPCO asked JICA study team to study another connection case that the Attrat Oil Shale project and the nuclear power plants will be connected to the New QAIA substation. JICA study team will conduct

9-122
it and describe the result in the final report.
Economical and Financial Analysis
i) JICA study team presented estimates of the bulk-supply cost from new power sources based on the result of the WASP simulation.
ii) There is no great difference among scenarios in respect of the trend of changes in bulk-supply costs. The cost differences are around plus or minus ¢0.5/kWh.
iii) However, it must be understood that the cost estimates conducted here are results based on certain premises.
1) JCC members participating -1
2) JCC members participating - 2
3) Presentation by JICA study team
Figure 9.6-3 The 5th JCC Meeting
Holding Seminars on the Master Plan Study
(1) Seminar
As mentioned in 9.6.1 in order to disseminate the master plan study and participate concerned stakeholders more widely, seminars on the Study were held three times as shown in Table 9.6-3. Participants were government related organizations, academic institutes, foreign donors, electric power generation and supply companies, NGOs, etc.

9-123
Table 9.6-3 Outline of the Seminars Seminar Date Main Agenda Attendants
1st Seminar April 22nd 2015 Contents of the Study Plan (Study Outline, Power Demand Forecast, Generation Development Planning, Power Network System, Human Development, Economic and Financial Analysis and Environmental and Social Considerations)
52 attendants
2nd Seminar November 10th 2015 Progress of the Study Work for each WG
27 attendants
3rd Seminar August 31st 2016 Results of the Study for each WG 34 attendants
Source: JICA Study Team
(2) The 1st Seminar (April 22nd 2015)
The 1st Seminar was held at the auditorium in NEPCO’s headquarters on April 22nd 2015. Opening remarks were made by Managing Director of NEPCO and Chief Representative of JICA Jordan Office. After that JICA study team explained the outline of the inception report including the work progress and future schedule.
Major points of comments and discussion are as follows:
Impact of new technology for energy saving to power demand forecast
-The participant from USAID asked the presenter the methodology of how to forecast power demand and also requested him to take into account several factors affecting demand forecast such as the proliferation of electric appliances using new technology. The presenter explained that the demand forecast curried out by the three distribution companies included impacts of those factors, and the data provided by the distribution companies would be reflected in the forecast of the Study.
Energy saving program of the Water Authority of Jordan (WAJ)
-The participant from ECO Consult recommended that the Study take into account the results of the energy saving program of the WAJ. Leader of JICA study team suggested that he have a discussion with the member of JICA study team in charge of power demand forecast.
Future plan for replacement of the power plant in Aqaba
-The CEO of CEGCO informed JICA study team that CEGCO planned to replace the existing plant in Aqaba with a combined-cycle power plant.

9-124
Study on pumped-storage hydropower
-One of the participants asked how deeply the Study would discuss pumped-storage technology. The presenter explained that the impact of introduction of pumped-storage hydropower would be examined in the WASP-IV simulation. If the use of the pumped-storage technology is viable, there is a possibility to conduct a detailed study such as feasibility study.
Improvement of the efficiency of power generation
-The participant from AES through a question of how to give incentive to the generation subsector. Leader of JICA study team explained that, from the viewpoint of the importance of end-user’s benefit, the Study planned to examine measures to improve efficiency of power plant as much as possible.
Renewable energy connected to the power system
-The participant from ECO Consult asked how much amount of renewable energy could be connected to the system in the future. Leader of JICA study team answered that the Study would examine the limit of grid connection and the result would be described in the later stage.
Fuel supply plan for development scenario
-One of the participants from Deloitte Consulting LLP (consultant of USAID) asked the procedure of how to integrate the fuel supply plan in development scenarios. The team member explained that the fuel supply plan was not a basis for the discussion of development scenario but formulated based on optimization of the generation development plan using WASP-IV.
Crude oil price forecast
-One of the participants from Deloitte Consulting LLP asked the method of how to forecast future oil price in the Study. The presenter explained that forecast itself was not the objective of the Study and the crude oil prices forecasted by the IMF and the IEA was quoted in the preliminary discussion. He also replied that, in the discussion of oil price forecast, the sensitivity analysis could be carried out, if necessary.
Reduction of energy loss in the distribution subsector
-The participant from USAID commented that the results of the roadmap study for reduction of energy loss of distribution companies should be considered in the Study.
USAID programs
-The USAID participant informed JICA study team that USAID carried out several programs for the power sector (e.g., renewable energy, energy saving, and finance projects) and proposed that JICA study team have a face-to-face discussion for further cooperation and information sharing. Leader of JICA study team appreciated her comments.

9-125
1) Presentation by JICA study team 2) Attendants
Figure 9.6-4 The 1st Seminar
Table 9.6-4 shows the attendance list of the 1st Seminar.
Table 9.6-4 Attendance list of the 1st Seminar

9-126

9-127
(3) 2nd Seminar (November 10th 2015)
The 2nd Seminar was held at the auditorium in NEPCO’s headquarter on November 10th 2015. Opening remarks were made by Managing Director of NEPCO and Chief Representative of JICA Jordan Office. After that JICA study team explained the work progress of the Study for each work item, i.e. Power Demand Forecast, Generation Development Planning, Power Network System, Human Development, Economic and Financial Analysis and Environmental and Social Considerations.
Major points discussed were as follows.
Syrian Refugees
i) The participants from the USAID and the others asked whether the power demand forecast in this M/P took account of the future increase in Syrian refugees and other factors caused by any crises in the neighboring countries of Jordan.
ii) The team leader of the WG of power demand forecast explained that the above-mentioned factors were not took into account in his calculation because JICA study team judged it from the historical data in which there was no remarkable impact on increase in energy consumption of the domestic sector by the influx of huge number of Syrian refugees after the year 2011. He also explained that prediction of the future growth of the number of Syrian refugees is virtually impossible.
Capping of renewable development
i) The participant from the USAID asked whether future renewable development in terms of generation capacity was capped in the Study or not.
ii) JICA study team explained that the future development was capped to keep the ratio of the capacity of renewable generators to the total installed capacity in the system the same as that of 2018.
Reserve margin after 2015
The participant from the USAID commented that the reserve margin after 2025 seemed high. JICA study team explained that the detailed reserved margin would be checked.
Background of the size of the candidate gas turbine (GT) unit
The participant from CEGCO asked the background to select the capacity of 150MW for the candidate GT unit. JICA study team explained that the size is selected from the results of the sub-study on unit sizes of generators and the consistency with that of other candidate units (e.g. Combined Cycle Unit) was also took into account.

9-128
Geological condition of the candidate location for a seawater pumped-storage hydropower plant in Aqaba
i) The participant from CEGCO commented that the ground in the candidate site was much fractured.
ii) JICA study team commented that JICA study team also had same opinion in light of the result of site survey, although the geological information around the candidate site has not yet been received.
Evaluation of nuclear development
i) The participant from CEGCO asked whether the nuclear development in 2023 would be evaluated based on the experience in Japan or not.
ii) JICA study team member answered that JICA study team did not evaluate it, because the nuclear development was a given condition in the Study.
Uncertainty of nuclear development
The participant from the AFD asked whether the nuclear development in 2023 was achievable or not. JICA study team answered that JICA study team was not in the passion to answer his question, because the nuclear development was a given condition.
Reduction of energy loss in the distribution subsector
i) The Jordanian distribution subsector is facing critical situation of non-technical losses (hereinafter NTL). USAID asked JICA study team how to reduce the NTL.
ii) JICA study team explained that the installation of covered cables and smart meter will be effective to reduce the NTL.
Time horizon of the results of the IEE and SEA
i) The participant from Eco Consultant asked when the work of the IEE and SEA would be finalized and the result would be disclosed.
ii) The leader of the ESC WG answered that the draft report would be available by the end of this year. However, it would be possibly delayed if the scenario writing of generation-development is delayed.
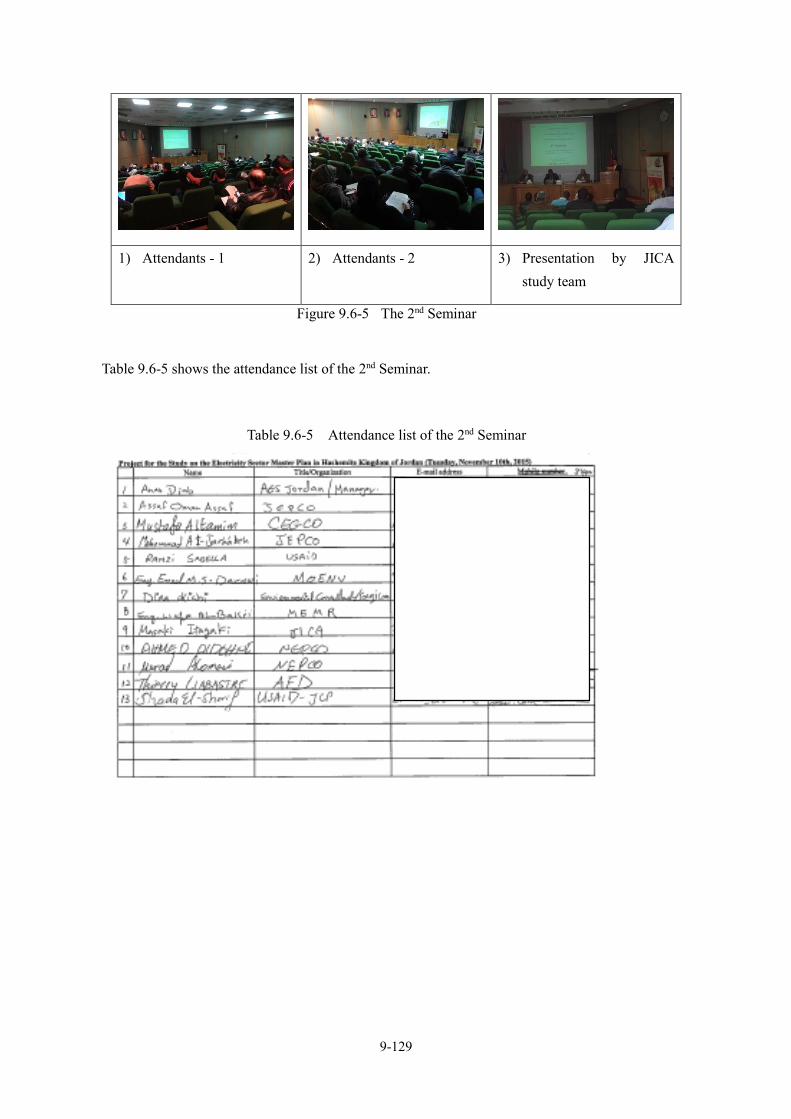
9-129
1) Attendants - 1 2) Attendants - 2 3) Presentation by JICA study team
Figure 9.6-5 The 2nd Seminar
Table 9.6-5 shows the attendance list of the 2nd Seminar.
Table 9.6-5 Attendance list of the 2nd Seminar
9-130
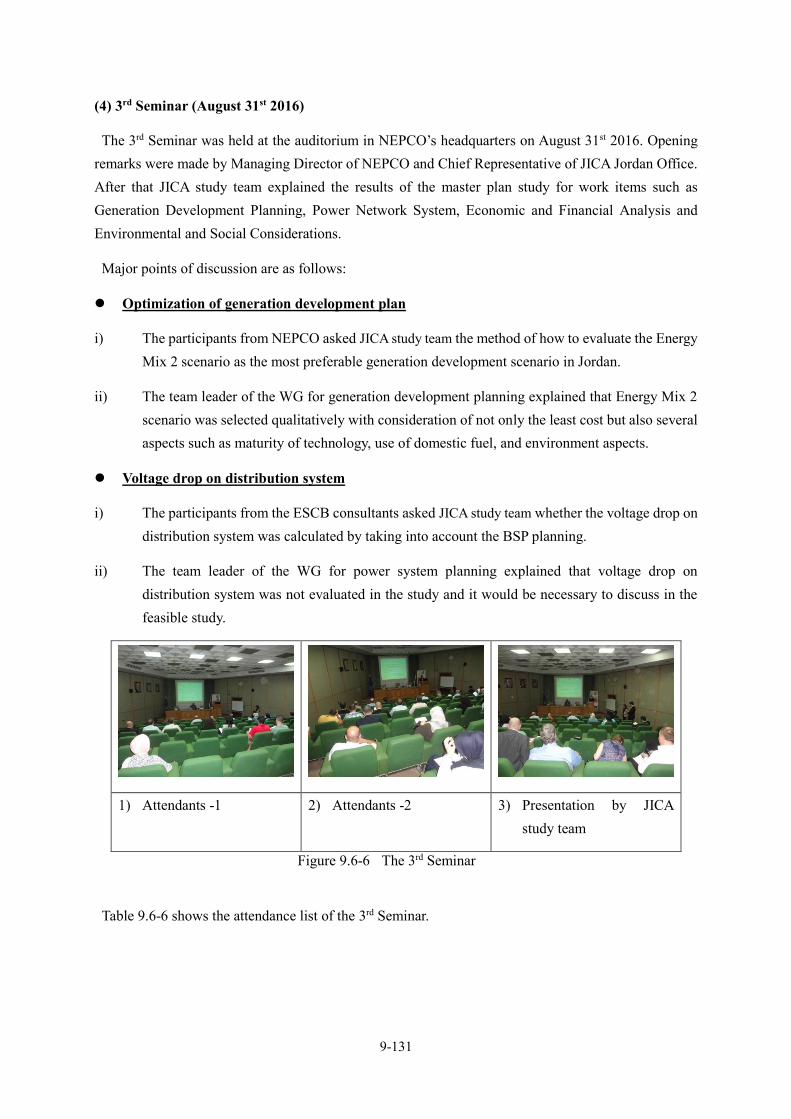
9-131
(4) 3rd Seminar (August 31st 2016)
The 3rd Seminar was held at the auditorium in NEPCO’s headquarters on August 31st 2016. Opening remarks were made by Managing Director of NEPCO and Chief Representative of JICA Jordan Office. After that JICA study team explained the results of the master plan study for work items such as Generation Development Planning, Power Network System, Economic and Financial Analysis and Environmental and Social Considerations.
Major points of discussion are as follows:
Optimization of generation development plan
i) The participants from NEPCO asked JICA study team the method of how to evaluate the Energy Mix 2 scenario as the most preferable generation development scenario in Jordan.
ii) The team leader of the WG for generation development planning explained that Energy Mix 2 scenario was selected qualitatively with consideration of not only the least cost but also several aspects such as maturity of technology, use of domestic fuel, and environment aspects.
Voltage drop on distribution system
i) The participants from the ESCB consultants asked JICA study team whether the voltage drop on distribution system was calculated by taking into account the BSP planning.
ii) The team leader of the WG for power system planning explained that voltage drop on distribution system was not evaluated in the study and it would be necessary to discuss in the feasible study.
1) Attendants -1 2) Attendants -2 3) Presentation by JICA study team
Figure 9.6-6 The 3rd Seminar
Table 9.6-6 shows the attendance list of the 3rd Seminar.

9-132
Table 9.6-6 Attendance list of the 3rd Seminar

9-133

9-134
Suggestions and Recommendations to the Implementation of the Master Plan in terms of Environmental and Social Aspects
General Considerations
Following considerations are necessary in general:
-Consistency with Upper Policy and development plan such as tourism development plan
-Establish nationwide environmental baseline data with GIS data base for the whole country. Although data bases are already established separately by relevant Ministry or organization, it is desirable to centralize information to responsible ministry or organization such as MoEnv to arrange integration of the data.
-Institutional arrangement of preparation and implementation of environmental management plan and monitoring plan in national, regional and sectoral as well as individual organization

9-135
-At the renewal and the implementation of the master plan it is recommendable that organizations similar to JCC and SEACC should be prepared to support stakeholder participation and information disclosure properly.
Implementation of the Scenarios “No.4 Energy mix including coal fired unit”
In implementation of generation development plan proposal of projects selected in the master plan study should be prepared by the proponents and site clearance approval and environmental approval should be obtained from relevant organizations such as MoEnv.
As mentioned in Chapter 5 and 9.5.3, scenario 4 (Energy Mix 2), which composed of six generation
development plans, i.e. Thermal powers including LNG (CCGT), Oil Shale burning, Coal-fired, Renewable
energy including Wind and Solar power as well as Nuclear power.
Among generation development plans, construction and operation of coal fired plant and oil shale burning
plant should be required considerable consideration from environmental and social aspects.
(i) Coal fired power plant
Prior to introduction of coal fired power plant, a feasibility study should be conducted. Referring to the
EIA Regulation No.37 of 2005, an EIA level study might be required.
However, the proposed site is in ASEZ (Aqaba Special Economic Zone) and under the control of
ASEZA. Thus, ASEZA will make decision. In addition, establishment of emission and environmental
standards for coal fired plant is required.
As for coal fired power plant pollution prevention technology including air and water pollution and coal
ash waste treatment is mostly established and matured in the world. However, appropriate technology
transfer for construction and operation is required considering that Jordan has no experience with coal
fired power plant.
(ii) Oils shale burning power plant
As for the proposed Attarat plant, the EIA approval was already given by MoEnv and Environmental
Management and Monitoring Plan (EMMP) was proposed. Regarding EMMP, although, pollution
control technology has been established in Estonia, it is the first experience to Jordan and technology is
not matured compared with other thermal power generation. Thus, it is highly recommended to inspect
implementation of EMMP by the proponent and MoEnv.


10-1
Economic and Financial Analysis
NEPCO Finances
Analysis of the current status
NEPCO purchases electricity from all generation companies and resells it to distribution companies and large users in the form of bulk-power supply.
Under the electricity tariff system and price structure in Jordan, generation companies are allowed to reflect all their costs in their selling prices. Distribution companies are also allowed to purchase electricity from NEPCO at prices which enable them to make profit on the basis of regulated retail tariffs. In other word, both cost recovery and profit-making are guaranteed for generation and distribution companies.
However, this is not the case for NEPCO.
After 2010, the supply of natural gas from Egypt was occasionally interrupted, and it was replaced as fuel for power generation by petroleum products (i.e., diesel fuel and heavy fuel oil). Due to this fuel switch, the power generation cost has rapidly increased. However, the cost increase could not be transferred to final consumers. Instead, NEPCO, as a buffer, absorbed the back spread between generation cost and retail tariffs. As a result, NEPCO finances have greatly deteriorated since 2010.
(i) Back spread of power purchase and selling costs
As mentioned above, deteriorating NEPCO finances stem from the back spread between the cost of power purchasing from generation companies and sales prices to distribution companies. NEPCO sold electricity at half of the purchasing price in 2011 and 2012, and a little less than 60% in 2013 and 2014. (see Figure 10.1-1)
Figure 10.1-1 NEPCO power purchasing prices and supply costs, 2008 - 2014

10-2
Table 10.1-1 NEPCO power purchasing prices and supply costs, 2008 - 2014
(ii) Revenue and profit
Although NEPCO did not make large profits up to 2010, it managed to balance revenue and expenses, albeit barely. However, it recorded huge losses on its operating revenue beginning in 2010.
In 2008, NEPCO recorded a net loss of JD40.52m (net profit ratio, -6.7%) on revenue of JD609.15m, and this figure is not so seriously bad. In 2009, it recorded net profit of JD32.69m (net profit ratio, 6.1%) on revenue of JD636.49m and went into the black.
After that, however, operating loss expanded because power-purchasing costs rapidly increased due to the increase in fuel cost, but this cost increase could not be transferred to bulk-supply tariffs.
NEPCO recorded a net loss of JD160.12m (net profit ratio, -23.9%) on revenue of JD671.24m in 2010. This situation worsened further; NEPCO continued to record a net loss of more than JD1,000m, which is equal to its revenue, after 2010. The net loss reached a record-high JD1,179,26m (net profit ratio, -84.7%) on revenue of JD1,391.54m in 2014. (see Figure 10.1-2)
However, since the size of loss flattened while revenue continued to increase, a tendency of improvement in net profit ratio (loss) is observed. (see Figure 10.1-3)
Thanks to the oil price collapse beginning in the autumn of 2014, loss rapidly decreased in 2015. Cumulative loss from January to April 2015 remained as low as JD124m, which is a large reduction as compared to the same period of the previous year.

10-3
Figure 10.1-2 NEPCO revenue and profits, 2008 - 2014
Figure 10.1-3 NEPCO profits (loss) ratio, 2008 – 2014
(iii) Cash flow
Loss continued as mentioned above, and cash flows from operating activities continued to deeply sink in the red after 2010. Naturally, free cash flow was minus, and NEPCO continued to lose money. Meanwhile, cash flows from operating activities went into the black, and free cash flow became slightly plus in 2013 and 2014. This is because there were accounts payable in the form of cash amounting to JD1,206.25m at the end of 2013 and JD1,423.51m at the end of 2014. If NEPCO processes the accounts payable, its cash position sinks deeply into the red. (see Figure 10.1-4)
With its finances now in the status described above, NEPCO continues its operation with cash raised by borrowing money. As a result, cash flows used in investing activities are limited and reduced. (see Figure 10.1-5)

10-4
Figure 10.1-4 NEPCO cash flows, 2008 - 2014
Figure 10.1-5 NEPCO cash flows used in investing activities, 2008 - 2014
(i) Excess debt
Because of increasing accumulated loss, NEPCO now holds excessive debt.
Accumulated loss was JD43.59m as compared to shareholder’s equity of JD230m in 2008. This accumulated loss increased to JD207.74m in 2010 and almost erased the equity.
After that, NEPCO’s debt continued to increase, and as a result, its total liability swelled to JD5,289.28m as compared to total assets of JD919.68m in 2014. In other words, NEPCO currently holds excessive debt 5.8 times as large as its total assets. (see Figure 10.1-6)

10-5
Figure 10.1-6 NEPCO’s excessive debt, 2008 - 2014 Table 10.1-2 NEPCO balance sheet, 2008 - 2014
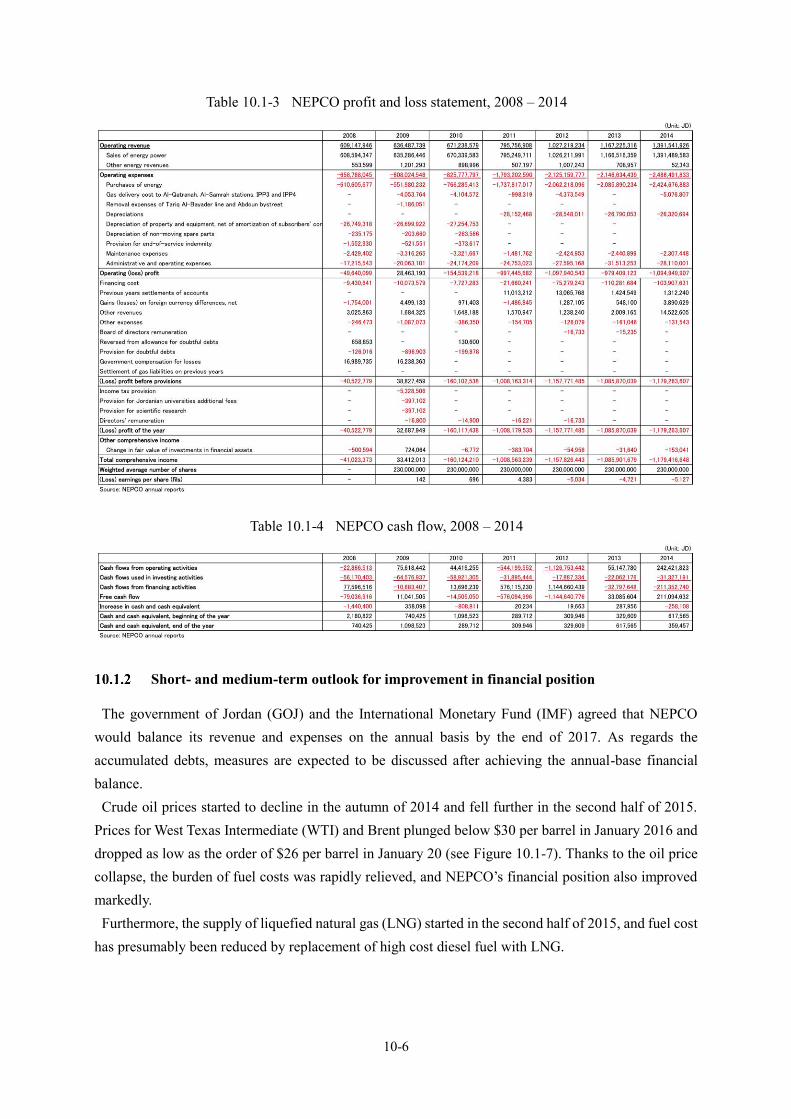
10-6
Table 10.1-3 NEPCO profit and loss statement, 2008 – 2014
Table 10.1-4 NEPCO cash flow, 2008 – 2014
Short- and medium-term outlook for improvement in financial position
The government of Jordan (GOJ) and the International Monetary Fund (IMF) agreed that NEPCO would balance its revenue and expenses on the annual basis by the end of 2017. As regards the accumulated debts, measures are expected to be discussed after achieving the annual-base financial balance.
Crude oil prices started to decline in the autumn of 2014 and fell further in the second half of 2015. Prices for West Texas Intermediate (WTI) and Brent plunged below $30 per barrel in January 2016 and dropped as low as the order of $26 per barrel in January 20 (see Figure 10.1-7). Thanks to the oil price collapse, the burden of fuel costs was rapidly relieved, and NEPCO’s financial position also improved markedly. Furthermore, the supply of liquefied natural gas (LNG) started in the second half of 2015, and fuel cost
has presumably been reduced by replacement of high cost diesel fuel with LNG.

10-7
In addition, bulk-supply tariffs were hiked in line with hikes for electricity retail tariffs17, and the environment of NEPCO finances also improved from the viewpoint of tariff revenue.
In light of this environmental change, the master plan study forecasted NEPCO finances up to 2020 based on the crude-oil price outlook in the short- and medium-term future, hikes of electricity bulk-supply tariffs in 2015, and the plan for power procurement from generation companies.
Figure 10.1-7 Collapse of oil prices, 2014 - 2016
(1) Premises of the forecast
The premises of the forecast are as follows:
① NEPCO financial loss will be reduced by the following two factors:
Fuel cost reduction by the introduction of LNG
Increase in revenue by the hike of the bulk-supply tariff in January 2015
Oil price collapse from the autumn of 2014
② Bulk-supply tariffs will not be hiked between 2016 and 2020 because the oil price substantially collapsed in 2015.
③ Power generation fuel cost will depend on crude-oil prices.
④ Outlook for crude oil prices in the short- and medium-term future:
The IMF Commodity Price Outlook (January 2016) is used for the crude-oil price scenario.
The scenario consists of three cases: base case, 10% high (price) case, and 10% low (price) case
17 The retail tariff schedule up to 2017 was decided in 2004, but the bulk-supply tariff schedule is decided every year. The retail tariff hike in 2015 was originally 15% but was curbed to 7.5% due to the oil price collapse.
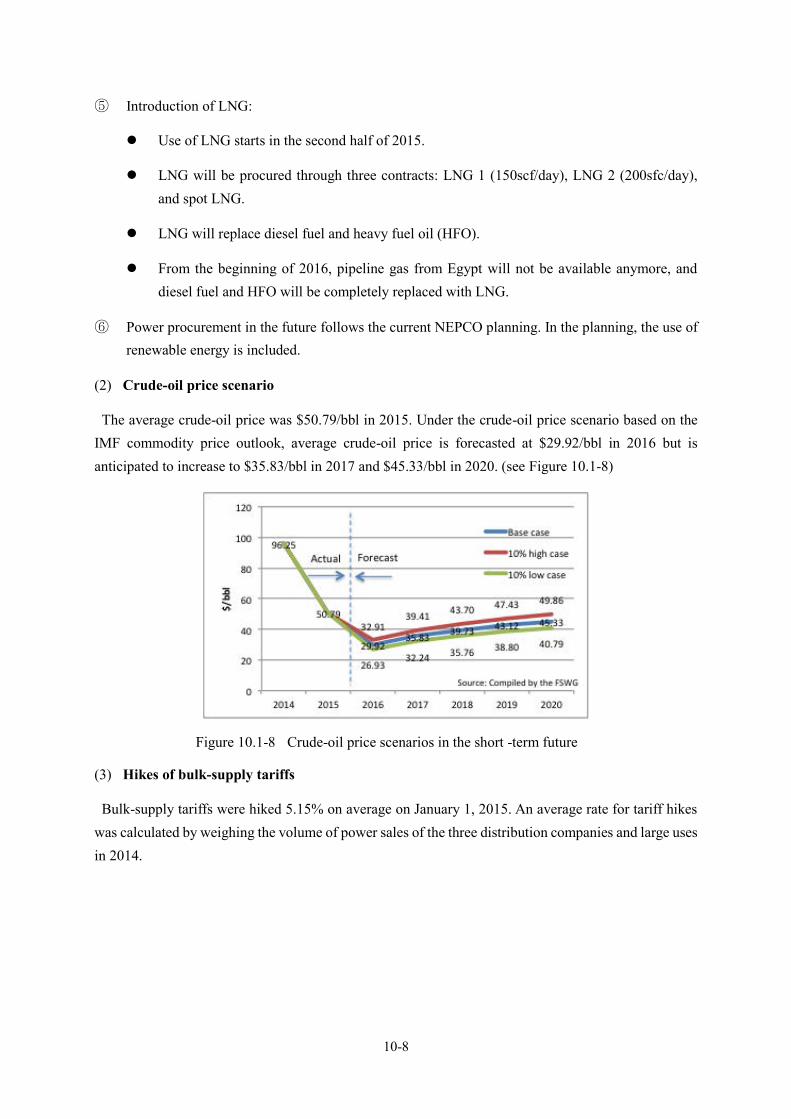
10-8
⑤ Introduction of LNG:
Use of LNG starts in the second half of 2015.
LNG will be procured through three contracts: LNG 1 (150scf/day), LNG 2 (200sfc/day), and spot LNG.
LNG will replace diesel fuel and heavy fuel oil (HFO).
From the beginning of 2016, pipeline gas from Egypt will not be available anymore, and diesel fuel and HFO will be completely replaced with LNG.
⑥ Power procurement in the future follows the current NEPCO planning. In the planning, the use of renewable energy is included.
(2) Crude-oil price scenario
The average crude-oil price was $50.79/bbl in 2015. Under the crude-oil price scenario based on the IMF commodity price outlook, average crude-oil price is forecasted at $29.92/bbl in 2016 but is anticipated to increase to $35.83/bbl in 2017 and $45.33/bbl in 2020. (see Figure 10.1-8)
Figure 10.1-8 Crude-oil price scenarios in the short -term future
(3) Hikes of bulk-supply tariffs
Bulk-supply tariffs were hiked 5.15% on average on January 1, 2015. An average rate for tariff hikes was calculated by weighing the volume of power sales of the three distribution companies and large uses in 2014.
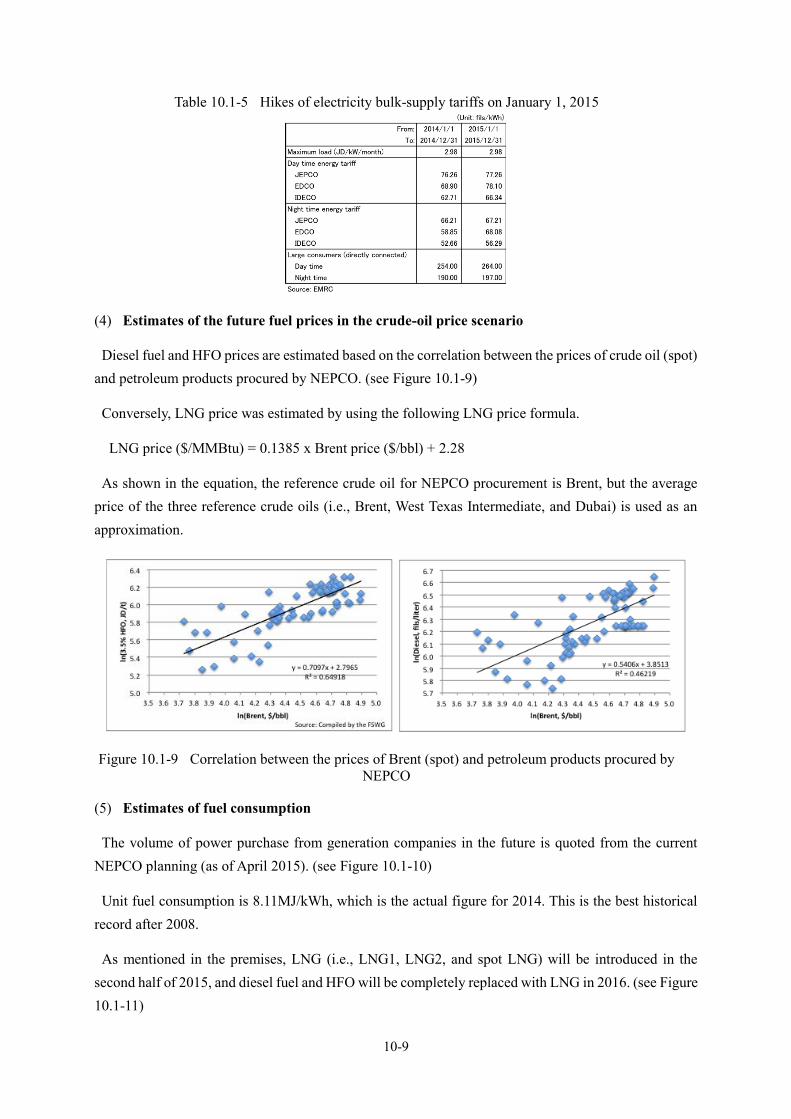
10-9
Table 10.1-5 Hikes of electricity bulk-supply tariffs on January 1, 2015
(4) Estimates of the future fuel prices in the crude-oil price scenario
Diesel fuel and HFO prices are estimated based on the correlation between the prices of crude oil (spot) and petroleum products procured by NEPCO. (see Figure 10.1-9)
Conversely, LNG price was estimated by using the following LNG price formula.
LNG price ($/MMBtu) = 0.1385 x Brent price ($/bbl) + 2.28
As shown in the equation, the reference crude oil for NEPCO procurement is Brent, but the average price of the three reference crude oils (i.e., Brent, West Texas Intermediate, and Dubai) is used as an approximation.
Figure 10.1-9 Correlation between the prices of Brent (spot) and petroleum products procured by NEPCO
(5) Estimates of fuel consumption
The volume of power purchase from generation companies in the future is quoted from the current NEPCO planning (as of April 2015). (see Figure 10.1-10)
Unit fuel consumption is 8.11MJ/kWh, which is the actual figure for 2014. This is the best historical record after 2008.
As mentioned in the premises, LNG (i.e., LNG1, LNG2, and spot LNG) will be introduced in the second half of 2015, and diesel fuel and HFO will be completely replaced with LNG in 2016. (see Figure 10.1-11)

10-10
Figure 10.1-10 Plan for power purchase from generation companies including IPPs
Figure 10.1-11 Fuel consumption by type
(6) Prospect of reduction of NEPCO financial loss
Revenue is estimated based on two assumptions: power sales will increase in line with the increase in power purchasing from generation companies (the average rate of increase is 5.8% p.a. between 2014 and 2020), and bulk-supply tariffs, which were hiked by 5.1% on average in 2015, will not be hiked during the 2016 – 2020 period.
Meanwhile, unit supply cost is estimated on the following assumption: fuel cost will trend in accordance with the crude-oil scenario, but other costs will level off.
Based on these premises, a calculation was made of power sales revenue and power supply cost (see Figure 10.1-12). Thanks to the oil price collapse, NEPCO finances will markedly improve in 2015. Although the bottom line will be still in the red in the amount of JD175m under the financial model calculation, the balance of NEPCO sales revenue and expenditure on the annual base is expected to almost reach the break-even point. Thanks to the low oil prices, NEPCO finances will in the black of JD100m - JD200m in 2016 and 2017. However, NEPCO finances will probably sink in the red in 2020 because the oil prices tend to increase
Figure 10.1-13 shows the prospective gaps between revenue and supply cost in the 10% high (oil price)

10-11
and 10% low cases. Even in the 10% high case, it is expected that PEPCO finances will be in the black until 2018.
However, there is a concern that the government will necessarily reduce the tariff levels because of the steep plunge of oil prices.
Figure 10.1-12 Power purchasing price, supply cost and the gap between sales revenue and expenditure (base case)
Table 10.1-6 Power purchasing price, supply cost and the gap between revenue and expenditure (base case)
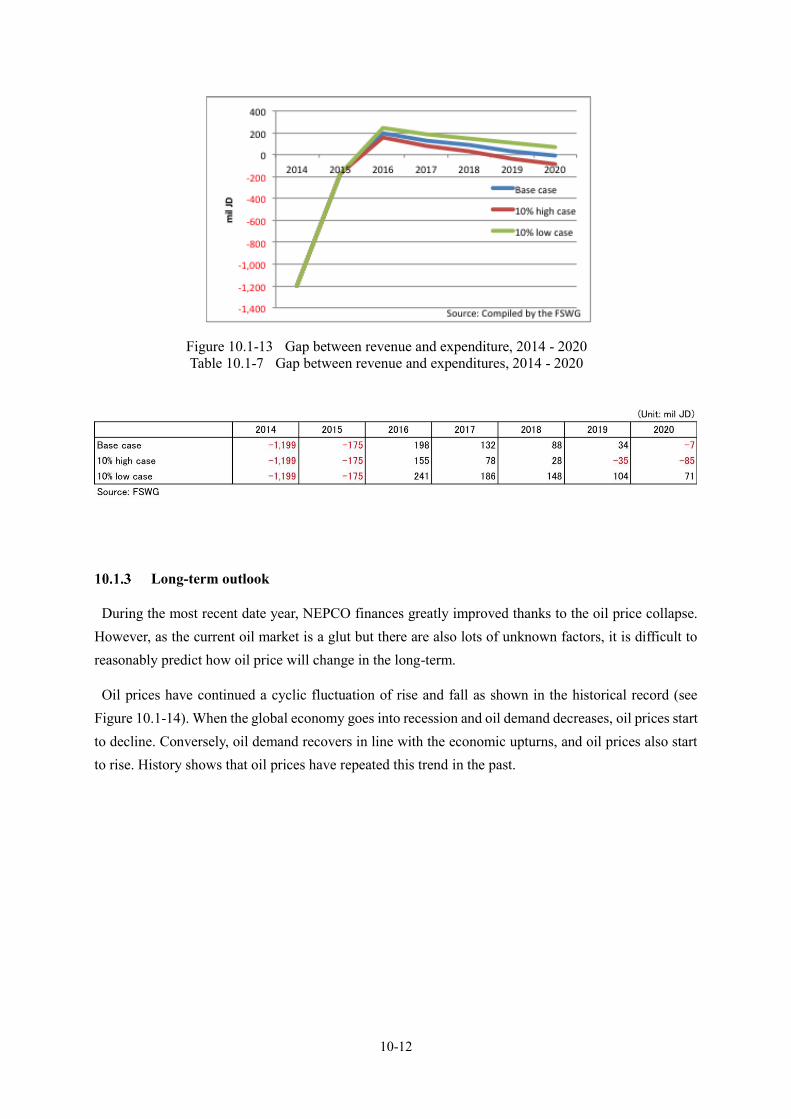
10-12
Figure 10.1-13 Gap between revenue and expenditure, 2014 - 2020 Table 10.1-7 Gap between revenue and expenditures, 2014 - 2020
Long-term outlook
During the most recent date year, NEPCO finances greatly improved thanks to the oil price collapse. However, as the current oil market is a glut but there are also lots of unknown factors, it is difficult to reasonably predict how oil price will change in the long-term.
Oil prices have continued a cyclic fluctuation of rise and fall as shown in the historical record (see Figure 10.1-14). When the global economy goes into recession and oil demand decreases, oil prices start to decline. Conversely, oil demand recovers in line with the economic upturns, and oil prices also start to rise. History shows that oil prices have repeated this trend in the past.

10-13
Figure 10.1-14 Trends of oil prices, January 2000 – January 2016 Although oil prices may remain on a low level in the short run, they will undoubtedly rise again
sometime in future.
In contrast, the problem with NEPCO finances is structural. On the one hand, the prices at which NEPCO purchases power from generation companies reflect economic (market) prices. On the other hand, the retail tariffs at which distribution companies sell power to consumers are regulated by the government, and bulk-supply tariffs are set at levels that assure the profits of the distribution companies. Under this structure, NEPCO finances absorb all of the discrepancies stemming from the differences between market prices and politically regulated tariffs.
Unless this structural problem is resolved, NEPCO will experience repeated financial loss, as it did in the first half of the 2010s, once oil prices surge in the future.
Instead of attempting to view the prospects for NEPCO finances in the long-term future, it is necessary to discuss how to solve the structural problem. For this reason, NEPCO should envisage ways to stabilize annual revenue, avoid volatile expenditures, and redeem the huge amount of accumulated debt.
(4) Stabilization of revenue and expenditures on the annual basis
As mentioned above, the most critical problem stems from the structure, which depend solely on NEPCO finances to absorb any steep rise in oil prices.
In principle, changes in fuel cost must be reflected in the tariffs. It is hoped that Jordan will promptly install a tariff formula reflecting the fluctuation of fuel cost, as many countries have already done.
For example, a fuel cost adjustment system is applied to regulated tariffs in Japan. Under this system, a calculation is made of an average fuel cost based on the trade statistical data for the past three months, and the cost fluctuation is automatically reflected in power tariffs every month. Therefore, when the fuel cost rises, tariffs are automatically hiked. Conversely, when the fuel cost declines, tariffs are automatically reduced.
10-14
(5) Redemption of the accumulated debts
As of the end of 2014, NEPCO had a total debt of JD5.289b, which is five times as high as its total assets of JD920m. This surplus of debt is excessive, and it is impossible for NEPCO to redeem it by itself.
In 2014, NEPCO’s total revenue was only JD1.392b. Among power companies in countries around the world, the best ones have net profit ratios of about 6%. Even if NEPCO were to attain a 6% profit ratio, its profit would still be only JD83.8m (not to mention that NEPCO has never attained this profit level since the second half of 2000s), and to redeem the excess debt of JD4.37b excluding interest payment would take 52 years. In practice, the current holding of excess debt by NEPCO is nothing less than a disruption of its business as regards a sustainable operation.
To solve the accumulated debt issue and place NEPCO’s business on sound footing, it is advisable to split the debt from NEPCO’s balance sheet. Seeing that it would not be realistic to attempt to redeem the debt by depending on NEPCO profit as the source of funding, there must be discussion of imposition of a special-purpose levy or use of funds from the government’s general account.
There are several precedents for schemes for transfer of excessive debt hold by a state enterprise to a separately established public institution, which then manages and redeems the debt.
When the Japanese National Railways (JNR) was privatized in 1987, the JNR Settlement Corporation was also established, and the JNR’s accumulated debt was transferred to it. The settlement scheme was based on use of the money generated by disposal of JNR assets and by payments from the new railway companies resulting from the privatization to redeem the debt. Although the accumulated debt could not be completely redeemed by 1998, when the JNR Settlement Corporation was abolished, the remaining debt was finally transferred to the government general account, and this secured the sound business operation of the privatized railway companies.
Another example is the scheme which was applied for the dissolution of the bankrupted Philippine National Power Corporation (NPC) and disposal of its assets. NPC assets and debts were transferred to the newly established Power Sector Asset and Liability Management Corporation (PSALM). In the scheme, it has planned to redeem the transferred debts within 25 years using the money from NPC asset disposal and the newly introduced universal charge imposed on power tariffs.
Finances of distribution companies
Jordan’s distribution companies consist of three utilities: the Jordanian Electric Power Company Limited (JEPCO) serving Amman and other central regions, the Electricity Distribution Company (EDCO) serving the eastern and southern regions and Jordan Valley, and the Irbid District Electricity Company (IDECO) serving the northern region.
Among the three, JEPCO is the largest and accounts for about two-thirds of the power sales (kWh). Although EDCO’s power sales are about 10% larger than IDECO’s, there is no substantial difference of

10-15
size between the two companies.
While NEPCO is a government-owned company, the distribution companies are privatized (in the strict sense of the word, EDCO is not deemed to be privatized because a government-owned holding company still holds all of the EDCO stock.)
JEPCO, which was established in 1947, is listed on the stock market, but the GOJ still holds 23% of its stock.
EDCO was established in 1997, along with the dissolution of the Jordan Energy Authority. While initially the GOJ held 100% of its shares, the Kingdom Electricity Company18 (KEC) acquired all of the shares owned by the government through an auction in 2007, and EDCO was finally privatized.
IDECO was established in 1961, and the GOJ held 55.4% of its shares. In 2008, KEC bought the whole of the government-owned shares, and IDECO was privatized. In 2009, KEC sold its own shares to EDCO.
Figure 10.2-1 Power sales of the three distribution comapanies, 2010 - 2014
Retail tariffs
Retail tariffs are set on levels allowing the distribution companies to make a reasonable profit. However, the regulated tariffs are not calculated by adding up all costs from the generation to the distribution subsectors; instead, they are set by adjusting bulk-supply tariffs, which are the prices applied in NEPCO power sales to the distribution companies.
In other words, although the distribution companies are guaranteed to make a profit by the tariff adjustment, NEPCO absorbs the back spread between selling price and supply cost.
18 The major shareholders are the Kingdom Electricity Company Social Security Corporation and Kuwait’s Privatization Holding Company.

10-16
Figure 10.2-2 Average retail tariffs of the three distribution companies Table 10.2-1 Average retail tariffs of the three distribution companies
Revenue and profits
As noted above, retail and bulk-supply tariffs are adjusted to guarantee that the distribution companies make profit. After the rapid increase in fuel cost caused by the interruption of natural gas supply from Egypt, the distribution companies continued to make profit.
However, their profit levels are not high. JEPCO’s profit ratio is especially low.
Figure 10.2-3 shows a comparison of net profit ratios at utilities in developing countries. The net profit ratios of EDCO and IDECO were not so bad in 2010 – 2012, but that of JEPCO was clearly lower. The profit ratios of EDCO and IDECO declined substantially in 2013. As such, the profitability of JEPCO, EDCO and IDECO is not deemed to be high in light of the international comparison of distribution companies.
In contrast, Meralco in the Philippines, which supplies power to the Manila metropolitan area, is well known as a topnotch utility. The Metropolitan Electricity Authority (MEA) supplying power to the Bangkok metropolitan area is also known as a financially healthy company. The Dhaka Electric Supply Company Limited (DESCO) was established as part of the power sector reform, and is the first privatized utility in Bangladesh as a model case.
In 2014, Jordan’s per capita GDP was estimated at $5,358 as compared to $2,865 in the Philippines, $5,445 in Thailand, and $1,172 in Bangladesh. Taking account of economic level, the MEA of Thailand may be a good reference. Although the GDP per capita in the Philippines is half as high as Jordan’s, the blue chip company Meralco is also a good reference. Bangladesh is still a poor country, but DESCO has

10-17
been making a profit in the difficult business environment of the sectoral reform.
Figure 10.2-3 Net profit ratios of the three distribution companies and international comparison, 2010 - 2014
Table 10.2-2 Net profit ratios of the three distribution companies and international comparison, 2010 - 2014
As shown in the comparison of profitability, JEPCO is three times as large as EDCO and IDECO in terms of power sales but more or less the same in terms of profit making. For this reason, JEPCO’s profit ratio is low.

10-18
Figure 10.2-4 Operating revenue and profits of the three distribution companies, 2010 - 2014 Table 10.2-3 Operating revenue and profits of the three distribution companies, 2010 - 2014
Cash flows
All three companies have only limited cash in hand for their business size, and their fund management seems to be struggling. Furthermore, their cash positions at the end of the year are currently in the red.
JEPCO cannot generate enough cash from operating activates. As a result, its free cash flow is in the red, and cash in hand has continued to decrease.
Although EDCO generates cash flows necessary for investment from operating activities, its repayment of debt and interest payment exceeded its free cash flow in 2011 and 2012, and cash in hand decreased. Its cash position substantially deteriorated in 2012 in particular.
IDECO’s free cash flow was in the red in 2011 and 2012, and it lost cash in hand. The free cash flow went into the black in 2013, but its cash position is still not good.

10-19
Figure 10.2-5 Cash flows of the three distribution companies Table 10.2-4 Cash flows of the three distribution companies
Benefit to the power sector from implementation of the master plan
The master plan study aims to assure electricity supply stability and energy security for Jordan by the implementation of investment in the generation, transmission, and distribution subsectors in the future. To this end, the benefit introduced by the investment must be enjoyed not by NEPCO alone but by the

10-20
whole power sector.
For this reason, the investment in the distribution subsector was evaluated from the perspective of the level of investment and its economic benefit.
Investment in the distribution network and reduction of power loss
Over the period ending in 2034, the final target year, the distribution network must be developed further in step with the demand increase. The main problem currently faced by the distribution subsector is huge power loss. An average loss of 13% is quite common (e.g., that in Japan is only 2.7%). This large loss wastes not only energy but also investment commensurate with the power generation capacity supplying the lost energy. Needless to say, it worsens the power sector’s economy.
(1) Procedure for cost-benefit evaluation
During the time horizon between 2016 and 2034, investment in the distribution network is necessary to cope with increasing power demand. This study considered two cases: investment following the same planning approach as applied up to now (business-as-usual case) and investment plans taking into account distribution loss reduction (loss-reduction case).
While distribution loss will remain as high as 13% until 2034 in the former case, the premise in the latter case is reduction of the loss rate from 13% in 2015 to 9.5% by 2034 (i.e., a loss rate decrease of 3.5 percentage points between 2015 and 2034).
(2) Requisite investment cost and the schedule for investment
The total investment cost up to 2034 is as follows:
Business-as-usual case: $774m (real 2015 price)
Loss reduction case: $981m
It was assumed that investment would be carried out on an annual basis, and that the total investment cost would be distributed to each year in accordance with the increase in power demand. Annual investment will be made in the preceding year to meet the demand increase in the year in question. Figure 10.3-2 shows the amount of annual investment, in other words, the investment schedule.
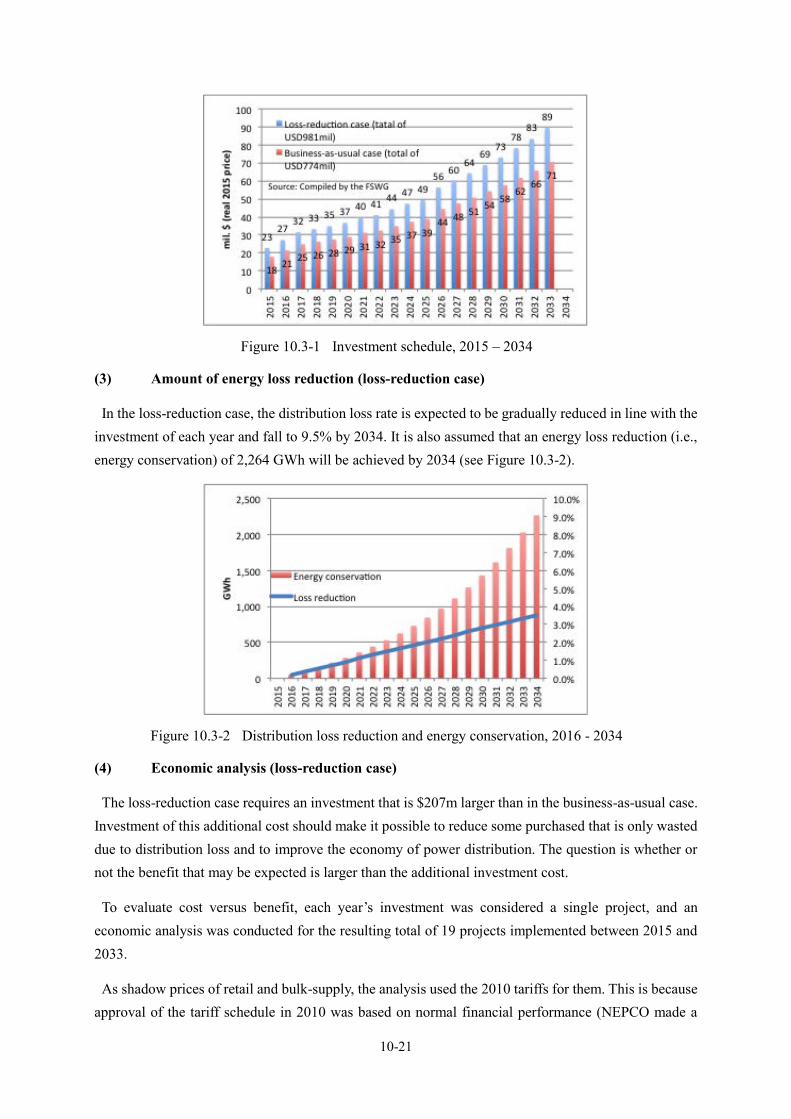
10-21
Figure 10.3-1 Investment schedule, 2015 – 2034
(3) Amount of energy loss reduction (loss-reduction case)
In the loss-reduction case, the distribution loss rate is expected to be gradually reduced in line with the investment of each year and fall to 9.5% by 2034. It is also assumed that an energy loss reduction (i.e., energy conservation) of 2,264 GWh will be achieved by 2034 (see Figure 10.3-2).
Figure 10.3-2 Distribution loss reduction and energy conservation, 2016 - 2034
(4) Economic analysis (loss-reduction case)
The loss-reduction case requires an investment that is $207m larger than in the business-as-usual case. Investment of this additional cost should make it possible to reduce some purchased that is only wasted due to distribution loss and to improve the economy of power distribution. The question is whether or not the benefit that may be expected is larger than the additional investment cost.
To evaluate cost versus benefit, each year’s investment was considered a single project, and an economic analysis was conducted for the resulting total of 19 projects implemented between 2015 and 2033.
As shadow prices of retail and bulk-supply, the analysis used the 2010 tariffs for them. This is because approval of the tariff schedule in 2010 was based on normal financial performance (NEPCO made a

10-22
profit in 2009), before interruption of the pipeline gas supply from Egypt.
The tariff levels in 2010 were converted in terms of real 2015 prices, and the analysis was conducted. The calculation result is shown in Figure 10.3-3 (the project resource statements are shown in the appendices).
All projects had internal rates of return (IRRs) higher than the hurdle rate of 12% and therefore were justified in terms of production of economic benefit.
Figure 10.3-3 IRR of each project
(5) Reduction of unnecessary investment and supply cost across the power sector
The economic analysis considered only the cost invested in the distribution subsector and benefit directly induced there.
However, the benefit to the power sector as a whole is much larger than that. Reduction of the amount of wasted electricity can also reduce unnecessary investment in power generation and cut fuel consumption. These investment and fuel consumption savings yield an additional benefit.
Accumulating year after year, the loss reduction will reach 2,264GWh per year by 2034 (i.e., the final target year of the master plan). At a load factor of 60%, a generator with a capacity of 439MW is needed to supply the corresponding amount of wasted electricity. If it costs $800 per kW of capacity to construct power plants, a total investment of $351m in power generation would be saved during the 2015 – 2033 period. This investment saving is larger than the additional cost of $207m for the investment in the distribution network (investment cost and benefit produced are shown in Figure 10.3-4).

10-23
Figure 10.3-4 Additional investment in the disribution network, reduction of investment in power generation, and benefit across the power sector, 2015 - 2034
In addition to the reduction of investment in power generation, the additional investment would save $635m in fuel cost between 2015 and 2034 (assuming an energy efficiency of 1,900kcal/kWh, and a unit fuel cost of $4.9/MMBtu).
In other words, by additionally investing $207m in the distribution network between 2015 and 2033 and reducing distribution loss by 3.5 percentage points, the power sector will be able to receive a $986m benefit.
In the year 2034, the power sector will achieve a cost saving of $92.6m a year as follows:
Additional capital cost in distribution: +$10.3m (real 2015 price)
Capital cost saving in generation*: -$17.5m (*/ depreciation period = 20 years)
Fuel cost saving: -$85.4m
Total -92.6m
This figure also translates an electricity cost reduction of ¢0.183/kWh (real 2015 prices) in 2034.
Estimates of generation costs of new power sources and transmission costs
This study estimated both generation costs of new power sources and transmission costs during the 2015 - 2034 period.
(1) Procedure for estimates of investment costs
Using the same premises and cost data, the study calculated generation costs of new power sources and transmission costs. In the cost estimates, all costs were calculated in real 2015 terms so that costs of individual years could be directly compared.
The premises of the cost estimates (regarding factors such as construction costs and depreciation periods) are shown in Table 10.3-1. These premises are the same as the conditions used for the WASP calculation. The scenarios for power development also followed the conditions used in the WASP calculation.
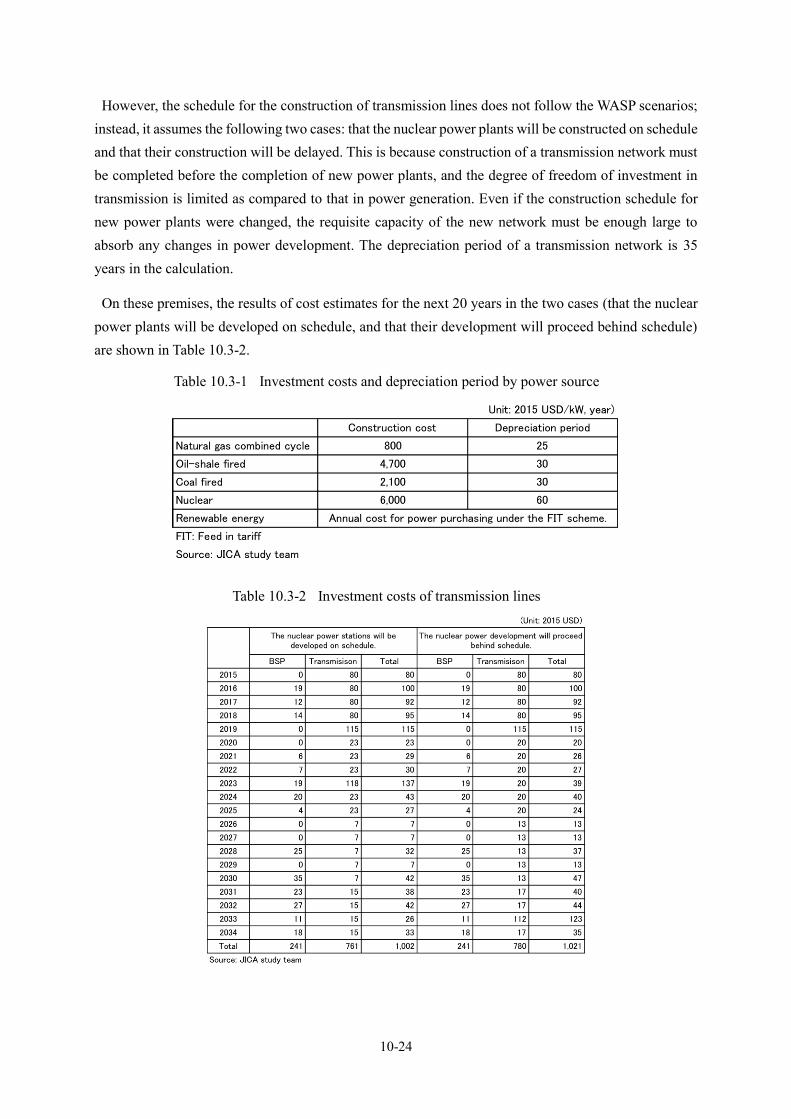
10-24
However, the schedule for the construction of transmission lines does not follow the WASP scenarios; instead, it assumes the following two cases: that the nuclear power plants will be constructed on schedule and that their construction will be delayed. This is because construction of a transmission network must be completed before the completion of new power plants, and the degree of freedom of investment in transmission is limited as compared to that in power generation. Even if the construction schedule for new power plants were changed, the requisite capacity of the new network must be enough large to absorb any changes in power development. The depreciation period of a transmission network is 35 years in the calculation.
On these premises, the results of cost estimates for the next 20 years in the two cases (that the nuclear power plants will be developed on schedule, and that their development will proceed behind schedule) are shown in Table 10.3-2.
Table 10.3-1 Investment costs and depreciation period by power source
Table 10.3-2 Investment costs of transmission lines

10-25
(2) Estimates of annual costs
Of the annual costs, the capital cost (or the so-called CAPEX) in each year is calculated by dividing the initial investment cost by the depreciation period.
The operating cost (or the so-called OPEX19) in each year is calculated by converting the annual costs of fuel and O&M in actual (nominal) terms to those in real terms. While, investment in transmission lines is not included in the WASP calculation, 2% of the investment cost for transmission is additionally appropriated here.
(3) Outlook for oil prices
The fuel cost component in the OPEX is affected by the fluctuation of oil prices. Future oil prices as an important premise followed the oil price outlook used for the WASP calculation. Specifically, the study used the IMF commodity price outlook (January 2016) for the short-term future, and the long-term future prices were forecasted by extrapolating the short-term future prices using the growth rates available in the EIA annual energy outlook 2015 (see Figure 10.3-5).
Figure 10.3-5 Outlook for crude oil prices
(4) Power development scenarios
Power development scenarios consist of the 18 cases comprising the matrix of six base scenarios and three sub-scenarios used for the WASP calculation.
Base scenarios:
Matured technology scenario
Use-of-domestic-fuel scenario
Energy mix scenario (coal-fired power is excluded.)
19 Operating Expense

10-26
Energy mix scenario (coal-fired power is included.)
Sub-scenarios:
Nuclear power plants will be developed on schedule.
Nuclear power development will proceed five years behind schedule.
Nuclear power development will proceed 10 years behind schedule.
(5) Return on investment
Estimates of new power-source and transmission costs include the return on investment (ROI). The ROI means the financial cost for capital expense. Eight percent of total assets (in other words, the return on asset (ROA) of 8%) in each year are appropriated as the financial cost.
(6) Estimates of the bulk supply cost from new power sources
Base on the above premises, Figure 10.3-6, Figure 10.3-7 and Figure 10.3-8 show estimates of bulk supply costs.
In each scenario, the bulk supply costs from new resources are high for the period of four or five years beginning in 2015 (i.e., the first year), because purchase of renewable energy is always prioritized. After this period, the bulk supply costs gradually decline, thanks to introduction of large power sources meeting increasing power demand. While there is a price difference of plus or minus ¢0.5/kWh (2015 real prices), all prices converge to around ¢8/kWh (2015 real prices).
It seems somewhat odd that the bulk supply cost in the least-cost scenario is higher than that in other scenarios. However, this is because there is a logical difference in the concepts of the two calculation models: the cost estimates in real terms and the WASP cost calculation in actual terms.
In the WASP model, all calculation is conducted in actual terms, and costs in individual years are discounted by a certain rate (i.e., the discount rate) and converted to present values. For this reason, in the least-cost scenario, the power source whose total sum of the costs at the present value is the lowest is chosen first. In other words, the power source whose investment including OPEX is smaller (in other words, risk of investment in monetary terms) is preferentially chosen. Conversely, the power source with larger investment is put off in the power development schedule, and the total cost is discounted and evaluated at the present value of the year 2015 (the first year).
Meanwhile, the calculated bulk supply costs here are all in real terms, and there is no logic that investment costs in individual years are to be discounted.
As a result, if figures are directly compared, it seems that there is a difference between the WASP calculation and the cost estimates here. Due to the aforesaid reason, however, the results of the two model calculations are not contradicting each other. The difference is attributed to the difference of calculation concept.

10-27
There is no great difference among scenarios in respect of the trends of changes in bulk supply costs. Furthermore, close attention must be paid to the premise for future oil prices, which is based on the IMF and IEA outlooks. During the first half of the 2010s, oil prices increased far more than expected, and this was not rare in the energy market. Because of this, natural-gas combined-cycle power will be a cheap power source in the least-cost scenario only if oil prices do not rise suddenly and steeply in the future. But this will not be the case if the premise for the future oil prices is wrong, in other words, if oil prices jump unexpectedly.
It must be understood that the cost estimates conducted here are results based on certain premises. With the premises this study rests on, there are cost differences of around plus or minus ¢0.5/kWh (2015 real prices) among scenarios. However, needless to say, it is desirable to make a decision on whether or not these cost differences are acceptable to hedge the uncertainty surrounding the future oil prices by diversifying power sources.
Figure 10.3-6 Bulk supply costs (nuclear power will be developed on schedule.)
Figure 10.3-7 Bulk supply costs (nuclear power development will proceed five years behind schedule.)
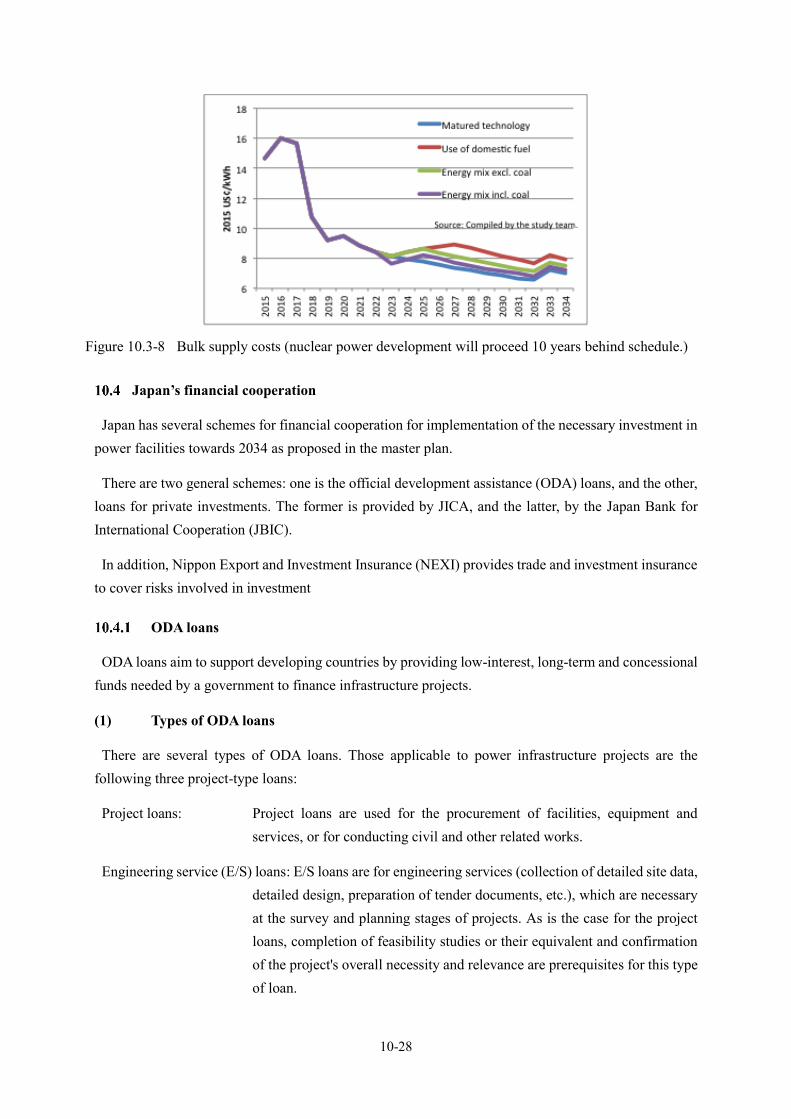
10-28
Figure 10.3-8 Bulk supply costs (nuclear power development will proceed 10 years behind schedule.)
Japan’s financial cooperation
Japan has several schemes for financial cooperation for implementation of the necessary investment in power facilities towards 2034 as proposed in the master plan.
There are two general schemes: one is the official development assistance (ODA) loans, and the other, loans for private investments. The former is provided by JICA, and the latter, by the Japan Bank for International Cooperation (JBIC).
In addition, Nippon Export and Investment Insurance (NEXI) provides trade and investment insurance to cover risks involved in investment
ODA loans
ODA loans aim to support developing countries by providing low-interest, long-term and concessional funds needed by a government to finance infrastructure projects.
(1) Types of ODA loans
There are several types of ODA loans. Those applicable to power infrastructure projects are the following three project-type loans:
Project loans: Project loans are used for the procurement of facilities, equipment and services, or for conducting civil and other related works.
Engineering service (E/S) loans: E/S loans are for engineering services (collection of detailed site data, detailed design, preparation of tender documents, etc.), which are necessary at the survey and planning stages of projects. As is the case for the project loans, completion of feasibility studies or their equivalent and confirmation of the project's overall necessity and relevance are prerequisites for this type of loan.

10-29
Sector loans: Sector loans are for materials and equipment, and for consulting services required for the implementation of development plans in a specific sector consisting of multiple sub-projects.
(2) Terms of conditions
Applied interest rates vary from country to country depending on its level of economic development. Jordan is classified as a middle-income country in terms of gross national income (GNI) per capita. While there are several conditions for lending, general terms are applied for power infrastructure. In the case of a fixed interest rate, the standard condition is that the interest rate is 1.7% p.a., and the repayment period is 25 years, of which the grace period is seven years. Other options with different interest rates, repayment periods and grace periods are also available.
Financial assistance from JBIC
Export loans and overseas investment loans are applicable to power infrastructure projects.
(1) Export loans
Export loans are provided to overseas importers and financial institutions to support the financing of exports of Japanese machinery, equipment and technology mainly to developing countries.
There are two types of loans: one is a direct loan to a foreign buyer or financial institution (buyer's credit (B/C) or bank-to-bank loan (B/L)) to finance the import of Japanese machinery and equipment or the use of Japanese technical services (see Figure 10.4-1), and the other is co-financing with other financial institutions to meet the client's financial needs.
Source: JBIC
Figure 10.4-1 Schemes for B/L and B/C
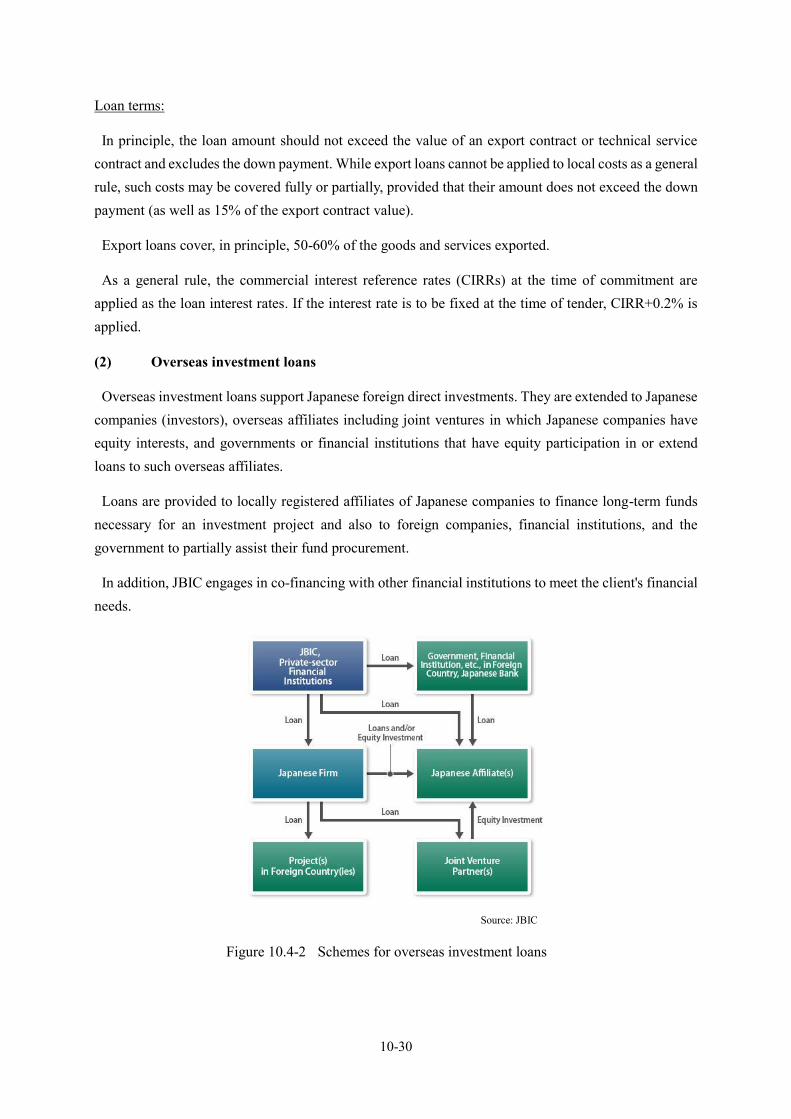
10-30
Loan terms:
In principle, the loan amount should not exceed the value of an export contract or technical service contract and excludes the down payment. While export loans cannot be applied to local costs as a general rule, such costs may be covered fully or partially, provided that their amount does not exceed the down payment (as well as 15% of the export contract value).
Export loans cover, in principle, 50-60% of the goods and services exported.
As a general rule, the commercial interest reference rates (CIRRs) at the time of commitment are applied as the loan interest rates. If the interest rate is to be fixed at the time of tender, CIRR+0.2% is applied.
(2) Overseas investment loans
Overseas investment loans support Japanese foreign direct investments. They are extended to Japanese companies (investors), overseas affiliates including joint ventures in which Japanese companies have equity interests, and governments or financial institutions that have equity participation in or extend loans to such overseas affiliates.
Loans are provided to locally registered affiliates of Japanese companies to finance long-term funds necessary for an investment project and also to foreign companies, financial institutions, and the government to partially assist their fund procurement.
In addition, JBIC engages in co-financing with other financial institutions to meet the client's financial needs.
Source: JBIC
Figure 10.4-2 Schemes for overseas investment loans

10-31
Loan terms:
Loan terms and conditions such as loan amount, denomination, interest rate, loan period, payment method, and security and guarantee are determined following the loan appraisal with respect to individual projects.
Examples in Jordan:
There are two power project cases for which JBIC provided overseas investment loans.
One is the 370MW natural-gas combined-cycle power project (the so-called IPP1) developed by AES Jordan PSC20, and the other, the solar power project developed by Shams Ma'an Power Generation PSC21.
Overseas investment insurance from NEXI
The oversea investment insurance covers losses suffered by a Japanese company with a subsidiary or a joint venture in a foreign country. The losses are incurred when the related subsidiary or joint venture is forced to discontinue business due to war, terrorism, or force majeure, such as a natural disaster.
This insurance was applied to the loan provided by the financial institution in the aforementioned Shams Ma'an project.
20 A subsidiary of AES Corporation and Mitsui & Co.
21 A subsidiary of Mitsubishi Corporation, Quarter’s Nebras Power Q.S.C., and Jordan’s Kawar Investment Company LLC


11-1
Planning of Human Resource Development
Present status of Human Resource Development
Organization of NEPCO personnel affairs
Figure 11.1-1 shows the organization chart of NEPCO. NEPCO consists of 5 division and the departments that in charge of human resource development are Electric Training Center Department and Human Resource Department which belong to Administrative Support Service Division (See the red frame in the figure).
Figure 11.1-1 Organaization chart of NEPCO (as of 2015)
NEPCO has 1410 employees and the constitution of employee is shown in Table 11.1-1. According to hearing investigation, the number of annual new employees is 5 – 70 people and NEPCO doesn’t adopt regular recruitment such as most of Japanese companies do, so that NEPCO recruits all year around whenever they want. The adoption carries out by Recruitment Section for leadership.
Source: JICA study team based NEPCO Human Resources Department
Table 11.1-1 Number of NEPCO Employee
Source: NEPCO Annual Report 2014

11-2
At NEPCO, the retirement age for man is 60, and for female is 55 by law. The extension employment after retirement is permitted only for 1 year. Most employees continue to work until their retirement, but most people who change their job go abroad to change the job.
Planning of Training Program
At NEPCO, training programs suitable for object of NEPCO’s human resource development are annually submitted to Management Development & training Section by Departments and Sections. The section chooses the training courses in consideration with the budget which are decided by Board of Directors and Parliament. Figure 11.1-2 shows an example of training programs held in 2014. Because the budget was limited, only 8 training programs were held within 22 proposed programs in 2014.
NEPCO Electric Training Center
NEPCO Electric Training Center (hereinafter as “NEPCO ETC”) was established in 1987, in corporation with JICA and Jordan Electric Authority, and it’s located at Zarqa (See Figure 11.1-3). Various types of technical training are held in NEPCO ETC. There are 27 training programs for Network field and 37 training programs for Substation field. The example of training programs are shown in Figure 11.1-4. NEPCO ETC holds training programs for not only NEPCO’s employees but private companies and universities in Jordan. The training courses for engineers and technicians coming from neighboring countries are also held in cooperation with JICA of other international institutions such as the United Nations Development Prgurammed. Table 11.1-2 shows the number of trainees benefited from the activities of NEPCO ETC in 2014.
Source: JICA study team based NEPCO Human Resources Department
Figure 11.1-2 An example of training program
Figure 11.1-3 NEPCO ETC
Figure 11.1-4 The example of trainig program held in NEPCO ETC Source: JICA study team based NEPCO ETC

11-3
The trainees can got an international license after taking the training program of “Tungsten Inert Gas and Arc Welding” which held at NEPCO ETC and qualification test authorized by Royal Jordan Society. Some of engineers and technicians from neighboring countries which do not have the international authority of the license come to NEPCO ETC to get this license and use it in their own countries. The trainees from universities, private companies in Jordan and neighboring countries pay training fee to NEPCO ETC. The training fee for a trainee from universities or private companies is around 300 JD per week and for a trainee from other countries is around 500-700 JD per week excluding accommodation fee. NEPCO ETC itself makes a profit by the training fee.
The number of NEPCO employees including administration staff is 48, and all the staffs are exclusive duty for NEPCO ETC. The outline of human resource development system for technical field is shown in Figure 11.1-5. Through the trainers from NEPCO ETC check the trainee’s achievement at the site several times after taking group trainings at NEPCO ETC, technical human resource development system linked with OJT and group training is worked well. NEPCO ETC has training programs for new employees and refreshment training programs. In Jordan, there are no training centers except NEPCO ETC, so not only NEPCO but also IDECO, EDCO
and JEPCO take training programs for new employees at NEPCO ETC.
Table 11.1-2 The number of trainees benefited from the activities of NEPCO ETC in 2014.
Source: NEPCO Annual Report 2014
Source: JICA study team based NEPCO ETC
Figure 11.1-5 The outline of human resource development system for technical field

11-4
Suggestion for Human Resource Development system
Considering the present status of human resource development system, the following system and programs are suggested for Jordan through the knowledge and know-how about human resource development framework in Japan.
Suggestion of Position-based Training
Although the technical training is substantial in NEPCO’s human resource development, gradual and effective implementation of the non-technical training is required. CEPCO offers the non-technical training regarding specialized knowledge and skills to training by position level such as new employees, and managers. Figure 11.2-1 shows overview of the position-based training programs of CEPCO.
The followings are the effects of Position-based training;
(1) The training course can be conducted so efficiently that employees who reach to specific position can learn necessary knowledge at the same time (Example: Even though new employees belong to different department, they all must know the philosophy, history, organization of the company).
(2) Gathering the employee who are same position but from different departments enables them to exchange various information and experience. It can develop a multidirectional view.
(3) Through the discussion beyond a section and type, it contributes to mutual understanding and enlightenment.
(4) Encourage participant’s self-awareness of the responsibilities associated with a given job position based on their career.
CEPCO lays emphasis on the new employee training in the position-based training in particular. New employee trainings are held 3 times at the timing of soon after entering for 10 days, after 2 month for 4 days, and after 1 year for 2 days respectively. The followings are the aims of new employee trainings;
(1) Change the their mind from students to the employees
(2) Understanding the company rules and work regulation
(3) Hearing a lecture by the tops about business condition of the company and future prospects and problems to recognize about one’s duty
(4) Communicate between employees
Source: CEPCO Annual Report
Figure 11.2-1 Overview of Position-based training programs
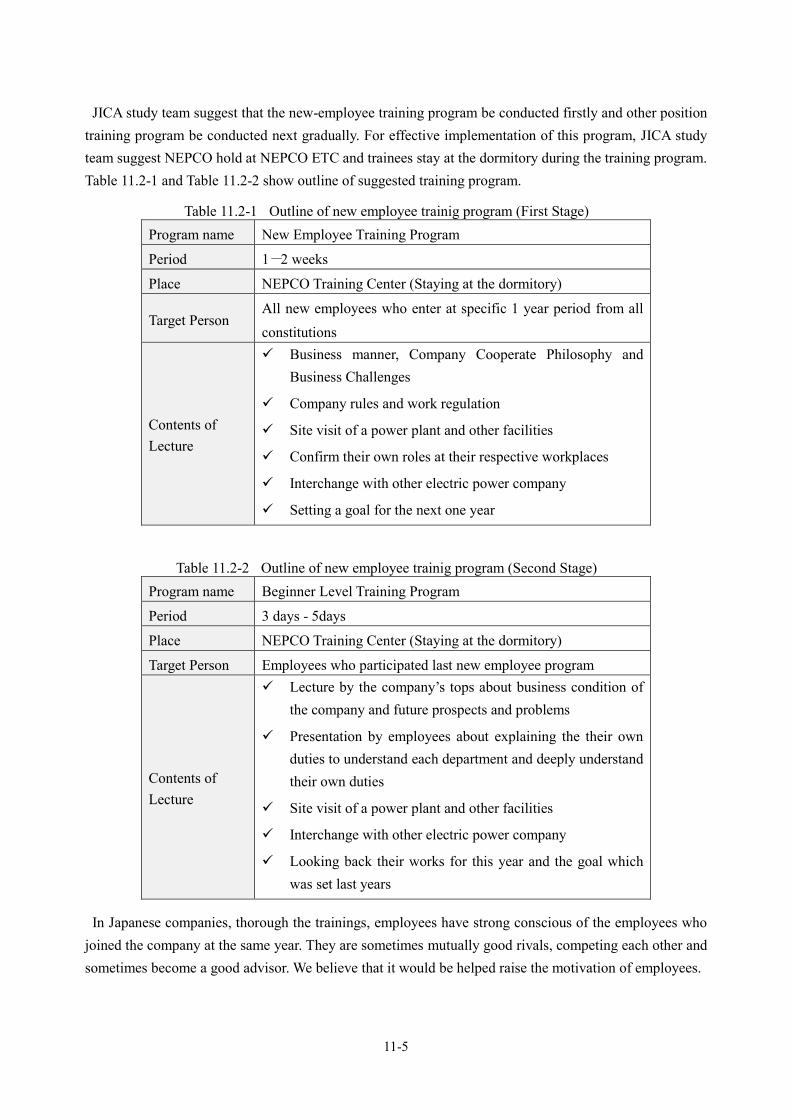
11-5
JICA study team suggest that the new-employee training program be conducted firstly and other position training program be conducted next gradually. For effective implementation of this program, JICA study team suggest NEPCO hold at NEPCO ETC and trainees stay at the dormitory during the training program. Table 11.2-1 and Table 11.2-2 show outline of suggested training program.
Table 11.2-1 Outline of new employee trainig program (First Stage) Program name New Employee Training Program
Period 1-2 weeks
Place NEPCO Training Center (Staying at the dormitory)
Target Person All new employees who enter at specific 1 year period from all constitutions
Contents of Lecture
Business manner, Company Cooperate Philosophy and Business Challenges
Company rules and work regulation
Site visit of a power plant and other facilities
Confirm their own roles at their respective workplaces
Interchange with other electric power company
Setting a goal for the next one year
Table 11.2-2 Outline of new employee trainig program (Second Stage) Program name Beginner Level Training Program
Period 3 days - 5days
Place NEPCO Training Center (Staying at the dormitory)
Target Person Employees who participated last new employee program
Contents of Lecture
Lecture by the company’s tops about business condition of the company and future prospects and problems
Presentation by employees about explaining the their own duties to understand each department and deeply understand their own duties
Site visit of a power plant and other facilities
Interchange with other electric power company
Looking back their works for this year and the goal which was set last years
In Japanese companies, thorough the trainings, employees have strong conscious of the employees who joined the company at the same year. They are sometimes mutually good rivals, competing each other and sometimes become a good advisor. We believe that it would be helped raise the motivation of employees.

11-6
Suggestion of training program for Renewable Energy
For environmental aspect renewable energy is being rapidly installed around the world. Technical training for construction, operation and maintenance for renewable energy would be required a lot by engineers including neighboring countries.
(1) Training system for construction of solar power system
There are no legal restrictions for construction of power system in Japan, but construction abilities of engineers are managed by private qualifications which are mainly expressed by two types.
i) Construction ID
Construction ID is the private qualification that each Solar Power System manufacturer such as SHARP, Kyocera, Panasonic, SUNTECH, Canadian solar issues originally. If the constructor undertake without this qualification, these manufacturers do not guarantee the constructed a solar power system.
ii) Certification system for construction of solar power system by a private sector.
This system is managed by general incorporated association Japan Photovoltaic Energy Association (JPEA). This system was founded with cooperation Ministry of Economy Trade and Industry to secure and improve of the construction abilities. This system composes 2 stage “Training system” and “certificate system”, and the whole aspect of certificate system is shown in Figure 11.2-2.
Source: Jcot’s website “http://www.jcot.jp/system/”
Figure 11.2-2 The whole aspect of certificate system for construction technology

11-7
This aspect is similar to “Tungsten Inert Gas and Arc Welding” training which is held at NEPCO ETC however it’s not an international license. Adopting this kind of system and the neighboring countries admit it, the needs of training program would be increase. The parts which should be carry at NEPCO ETC are shown in a red frame in Figure 11.2-2. The contents of this training program are shown in Table 11.2-3.
Table 11.2-3 Outline of qualification program for the license of construction of solar system Program name Qualification program for the license of construction of solar system Period 3 days (Generally) Tuition fee About USD 600 – 800 (exclude accommodation and meal)
Contents of Lecture
Lecture 10 hours or more Basic knowledge of solar power system and solar cell Basic knowledge of installation on a roof top Procedure of installation of solar power system, site investigation,
and check before installation Design of solar power system and frame of solar array Safety work and precautious for work Contract procedures of system interconnection and related law etc. Practical Skills 7.5 hours and more Constriction of solar allay Setting of electric apparatus etc.
(2) Training program for maintenance of solar power system
The national license related to the maintenance of solar power system in Japan is required for the facilities with the capacity of 50kW or more, but it not peculiar for solar power system but for whole electric power field. However the license for the facilities with the capacity of below 50kW is not required in Japan, a private-sector, Japan Photovoltaic Maintenance Association (JPMA) holds training programs and issues certifications in order to educate the engineers who can maintain and inspect solar power generation. The contents of this training program are shown in Table 11.2-4
Table 11.2-4 Outline of Training program for maintenance of solar power system Program name Training program for maintenance of solar power system Period 1 days Tuition fee Around USD 500 (exclude accommodation and meal)
Contents of Lecture
Lecture 3.5 hours or more Basic knowledge of solar power system Constitution apparatus of solar power system Basic knowledge of maintenance of solar power system and
Procedure of maintenance of solar power system Maintenance equipment Practical Skills 2 hours and more Measurement of I-V characteristic Cleaning methods of solar array etc.

11-8
(3) Training program for Renewable Energy on CEPCO
In accordance with customer’s request to high electric power quality, CEPCO investigates the system and analyses the causes. The more increasing the installation of solar power system, the more customer’s requests to the investigation are increased. CEPCO holds training programs to investigation and analysis of power quality, divided into 3 levels by each engineer abilities. Table 11.2-5 shows one of examples of training programs in CEPCO.
Table 11.2-5 Training programs of mesurement of power quolity in CEPCO (example) Program name Training programs of measurement of power quality Period 2 days
Contents of Lecture
Lecture Voltage Management
(Lows and Regulations, Administrative tasks, and basic method of calculation )
Characteristics of Load and voltage drops in low voltage line Characteristics of Power factor and voltage drops in High
voltage line Characteristics of solar power system etc. Practical Skills Usage of Measurement equipment Characteristics of Electric quality
(Using a simulator of generating several situation of Electricity quality)
Target Voltage Setting etc.
Suggestion of training program for Energy Saving
As mentioned in “Chapter 8 Promotion of Energy Saving”, training programs to develop human resources engaging in energy efficiency or energy saving are suggested.
In case of Japan, a general incorporated foundation “Energy Conservation Center, Japan” (hereinafter referred to as “ECCJ”) provides various kinds of training courses related to energy saving. On the other hand, EDAMA implements the CEM training program under the management of JEDCO. Therefore, training programs other than one related to energy managers are suggested as follows.
(1) Training program for energy saving in buildings
In Japan, ECCJ founded “Experts in energy-saving in buildings” system in fiscal year 2015, based on the necessity that as many persons involved as possible should understand key points of energy management in buildings, even though they are not “Type1 energy manager” or “Type 2 energy manager” stipulated in “Act on the Rational Use of Energy”. This system aims at obtaining fundamental knowledge and practical skills for energy saving in buildings so that each person can promote energy saving or electricity saving on his or her task in charge.

11-9
Under this system, an examination for “Expert in energy-saving in buildings” is implemented for the purpose of developing human resources promoting energy-saving in the area of business sector such as office buildings.
Since Jordan has the same needs as Japan, training program for energy-saving in buildings is suggested as a syllabus shown in Table 11.2-6 in reference to the content of “examination for expert in energy-saving in buildings”.
(2) Training program for energy saving in households
After power supply-demand situation became very tight due to the Great East Japan Earthquake on 2011, it has become an important challenge that each and every individual in the country seriously considers how one can change one’s life-style toward energy-saving and electricity-saving, and takes an action.
Therefore, ECCJ has implemented “Examination for expert in energy-saving in households” for the purpose of discovering and developing human resources who can promote “energy-saving in households” in daily life or in business activities since fiscal year 2011.
As in the case of Japan, It is significantly important to develop human resources who can promote “energy-saving in households” in daily life or in business activities in Jordan, as in Japan. Therefore, training program for energy-saving in households is suggested as a syllabus shown in Table 11.2-7 in reference to the content of “examination for expert in energy-saving in holds”.

11-10
Table 11.2-6 Draft Syllabus of Training program for energy saving in buildings Chapter 1 Management of buildings and energy
1-1 Function of buildings / Viewpoints of energy management
1-2 Transition of energy consumption in business sector
1-3 Characteristic of energy consumption in a building for business use
1-4 Energy management in a building and energy efficiency / energy-saving methods
Chapter 2 Standpoints for energy management in buildings
2-1 Procedure for energy management in buildings 2-2 Energy management based on the laws and
regulations 2-3 Energy management structure 2-4 Grasping status of energy use 2-5 Formulation of energy management policy 2-6 Setting management standard on each facility 2-7 Preparation of middle and long term plan for
energy management 2-8 Evaluation and improvement of the situation of
energy management 2-9 Energy management rule 2-10 Energy efficiency / energy-saving standards for
buildings Chapter 3 Basic knowledge about energy
3-1 Concept of “energy” 3-2 Basic knowledge of “heat” 3-3 Basic knowledge of “electricity”
Chapter 4 Basic theory of main equipment using energy
4-1 Motor 4-2 Inverter 4-3 Pump 4-4 Air blower (Fan) 4-5 Operating characteristics for a pump or an air
blower 4-6 Heat pump equipment 4-7 Absorption refrigeration cycle
Chapter 5 Air conditioning and its function 5-1 Air conditioning and indoor environmental
standards 5-2 Thermal environment and comfort 5-3 Air conditioning load (mainly, room-air
conditioner) 5-4 Structure and type of air conditioner for
households 5-5 Structure and type of air conditioner for buildings 5-6 Individual distributed type cooling (Air
conditioners for business use) 5-7Outline of central air conditioning method
(centrally controlled air conditioning system)
Chapter 6 Energy efficiency and energy-saving measures for air conditioning equipment
6-1 Reduction of air conditioning load 6-2 Efficient operation of whole air conditioning
system 6-3 Efficient operation of facilities with a heat source 6-4 Saving heat-transferring power sources
Chapter 7 Function of lighting equipment and energy-saving measures
7-1 Function of lighting 7-2 Lighting equipment 7-3 Energy-saving measures
Chapter 8 Function of boiler, hot-water supply, feed-water and drainage equipment, and energy-saving measures
8-1 Function of boiler, and energy-saving measures 8-2 Function of hot-water supply equipment, and
energy-saving measures 8-3 Energy-saving measures for feed-water and
drainage equipment Chapter 9 Power receiving and distributing
equipment / Function of co-generation system and energy-saving measures
9-1 Function of power receiving and distributing equipment
9-2 Overall of energy management for power receiving and distributing equipment
9-3 Energy saving measures for transformers 9-4 Improvement of power factor 9-5 Suppressing peak power demand / electric load
leveling 9-6 Function of co-generation system and energy-
saving measures Chapter 10 Energy saving measures for an elevator
/ office automation equipment / business office appliances
10-1 Energy saving measures for an elevator 10-2 Energy saving measures for office automation
equipment 10-3 Energy saving measures for business office
appliances Chapter 11 BEMS / Energy efficiency measures by
other high-efficiency technologies 11-1 Energy management on the basis of BEMS
(Building Energy Management System) 11-2 Solar power generation 11-3 Fuel cell 11-4 Power storage technology 11-5 Smart meters 11-6 Air conditioning system and other high-
efficiency technologies 11-7ZEB (Net Zero Energy Building)
Source: JICA Study Team based on the content of “examination for expert in energy-saving in buildings” (Energy Conservation Center Japan)
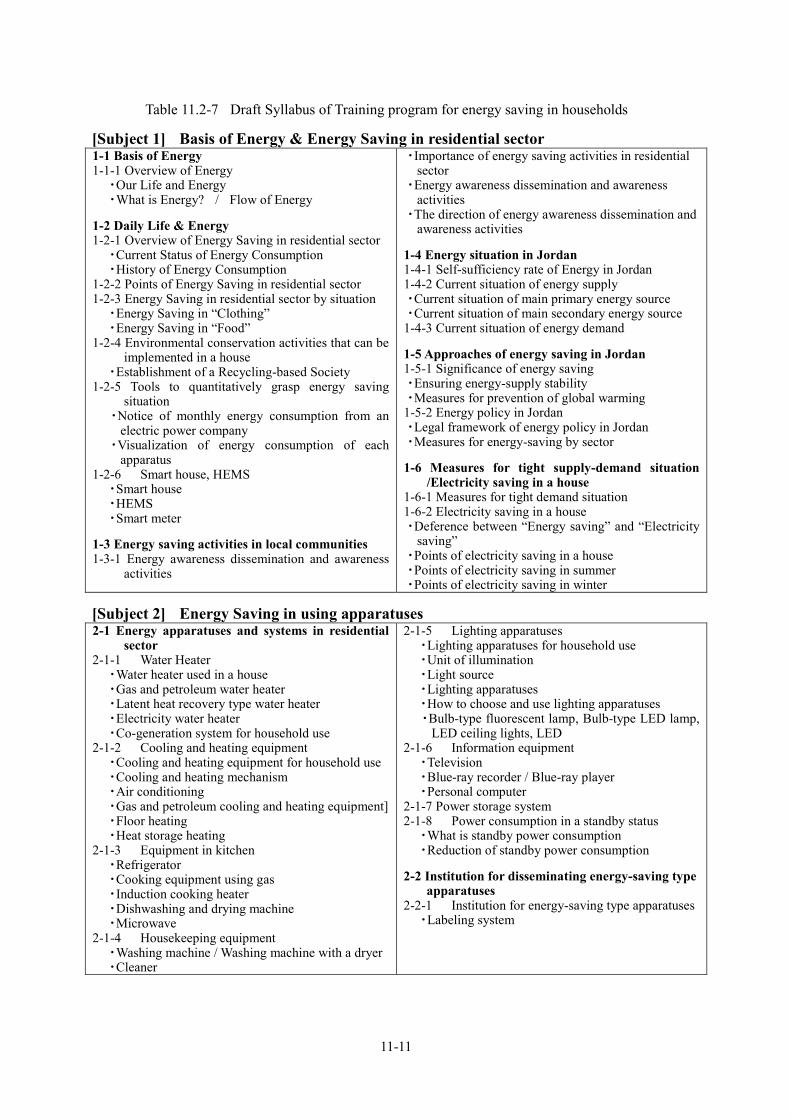
11-11
Table 11.2-7 Draft Syllabus of Training program for energy saving in households
[Subject 1] Basis of Energy & Energy Saving in residential sector 1-1 Basis of Energy 1-1-1 Overview of Energy ・Our Life and Energy ・What is Energy? / Flow of Energy
1-2 Daily Life & Energy 1-2-1 Overview of Energy Saving in residential sector ・Current Status of Energy Consumption ・History of Energy Consumption
1-2-2 Points of Energy Saving in residential sector 1-2-3 Energy Saving in residential sector by situation ・Energy Saving in “Clothing” ・Energy Saving in “Food”
1-2-4 Environmental conservation activities that can be implemented in a house
・Establishment of a Recycling-based Society 1-2-5 Tools to quantitatively grasp energy saving
situation ・Notice of monthly energy consumption from an
electric power company ・Visualization of energy consumption of each
apparatus 1-2-6 Smart house, HEMS ・Smart house ・HEMS ・Smart meter
1-3 Energy saving activities in local communities 1-3-1 Energy awareness dissemination and awareness
activities
・Importance of energy saving activities in residential sector
・Energy awareness dissemination and awareness activities
・The direction of energy awareness dissemination and awareness activities
1-4 Energy situation in Jordan 1-4-1 Self-sufficiency rate of Energy in Jordan 1-4-2 Current situation of energy supply ・Current situation of main primary energy source ・Current situation of main secondary energy source 1-4-3 Current situation of energy demand
1-5 Approaches of energy saving in Jordan 1-5-1 Significance of energy saving ・Ensuring energy-supply stability ・Measures for prevention of global warming 1-5-2 Energy policy in Jordan ・Legal framework of energy policy in Jordan ・Measures for energy-saving by sector
1-6 Measures for tight supply-demand situation /Electricity saving in a house
1-6-1 Measures for tight demand situation 1-6-2 Electricity saving in a house ・Deference between “Energy saving” and “Electricity
saving” ・Points of electricity saving in a house ・Points of electricity saving in summer ・Points of electricity saving in winter
[Subject 2] Energy Saving in using apparatuses 2-1 Energy apparatuses and systems in residential
sector 2-1-1 Water Heater ・Water heater used in a house ・Gas and petroleum water heater ・Latent heat recovery type water heater ・Electricity water heater ・Co-generation system for household use
2-1-2 Cooling and heating equipment ・Cooling and heating equipment for household use ・Cooling and heating mechanism ・Air conditioning ・Gas and petroleum cooling and heating equipment] ・Floor heating ・Heat storage heating
2-1-3 Equipment in kitchen ・Refrigerator ・Cooking equipment using gas ・Induction cooking heater ・Dishwashing and drying machine ・Microwave
2-1-4 Housekeeping equipment ・Washing machine / Washing machine with a dryer ・Cleaner
2-1-5 Lighting apparatuses ・Lighting apparatuses for household use ・Unit of illumination ・Light source ・Lighting apparatuses ・How to choose and use lighting apparatuses ・Bulb-type fluorescent lamp, Bulb-type LED lamp,
LED ceiling lights, LED 2-1-6 Information equipment ・Television ・Blue-ray recorder / Blue-ray player ・Personal computer
2-1-7 Power storage system 2-1-8 Power consumption in a standby status ・What is standby power consumption ・Reduction of standby power consumption
2-2 Institution for disseminating energy-saving type apparatuses
2-2-1 Institution for energy-saving type apparatuses ・Labeling system

11-12
[Subject 3] Energy Efficiency in houses 3-1 Outline of Energy-saving oriented house 3-1-1 Condition of houses and direction of energy
saving ・ Characteristic of houses in Jordan and energy consumption ・ Energy saving for building skeleton and an open part of a house ・ Points to make dwelling performance more comfortable
3-1-2 Significance of thermal insulation performance of a house
・ Indoor environment and thermal insulation performance ・ The difference in temperature between on indoor and on outdoor, and thermal insulation performance ・ The difference in temperature between rooms, and thermal insulation performance ・ Prevention of condensation occurrence
3-1-3 Energy-saving performance of a house ・ Outline of energy-saving criteria of a house ・ Determination criteria for house suppliers ・ Certification criteria of low-carbon buildings
3-2 Constructing and living on an energy- efficiency house
3-2-1 Fundamental points for designing energy- efficiency house
・ Energy-efficiency measures for detached houses ・ Energy-efficiency measures for apartment houses
3-2-2 Fundamental points for constructing energy-efficiency house
・ Thermal insulation for houses constructed with reinforced concrete ・ Thermal insulation for opening part
3-2-3 Fundamental points for renovating energy-efficient houses
・ Energy-efficiency reforming for detached houses ・ Energy-efficiency reforming for apartment houses
3-2-4 How to choose energy-efficiency houses 3-2-5 Institution for disseminating energy-efficiency
houses 3-2-6 How to live in energy-efficiency houses
3-3 Utilization of natural energy sources 3-3-1 Photovoltaic generation 3-3-2 Solar heating water system 3-3-3 heat pump using underground heat
Source: JICA Study Team based on the content of “examination for expert in energy-saving in buildings” (Energy Conservation Center Japan)
(3) Training program for electric machines
ECCJ especially focuses on “Practical training courses” with a high regard for “Practical training” among the training courses related to energy saving. ECCJ periodically provides “Electricity course” training program in which practical training facilities are made use of for training curriculum so that trainees can obtain practical energy saving skills for electric machines such as pumps, fans and compressors.
The contents of the CEM training course provided by EDAMA in Jordan includes curricula related to pumps and compressors, but practical and detailed training menus using training facilities are not implemented. Pumps, fans and compressors are electric machines that are generally and widely used in factories or business buildings, and especially a large number of fans are used in water pumping sector of Jordan. Therefore it is very important to disseminate technologies for energy-efficient use of these 3 types of machines through providing training courses in order to achieve energy saving effect in Jordan. And effective efforts to training can be expected because NEPCO training center gives importance to practical training using training facilities.
For the reasons mentioned above, practical training programs using training facilities for pumps, fans and compressors in Jordan are suggested in Figure 11.2-3, Figure 11.2-4 and Figure 11.2-5 respectively.
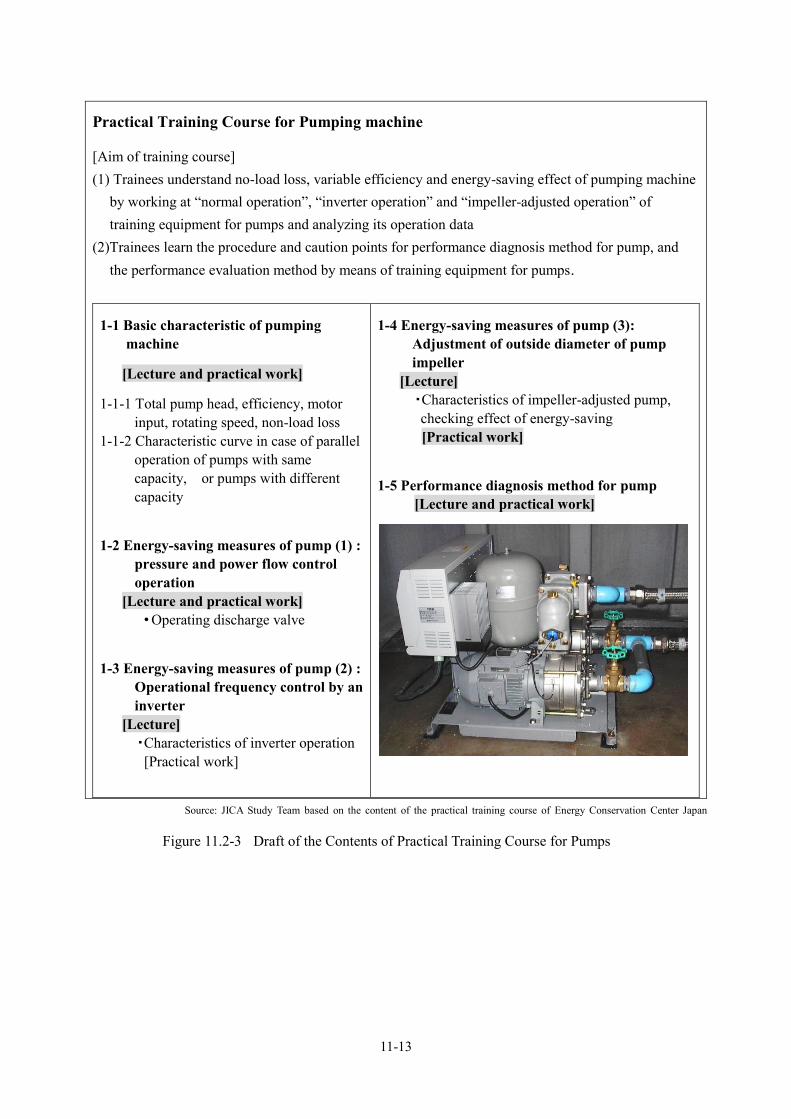
11-13
Practical Training Course for Pumping machine
[Aim of training course] (1) Trainees understand no-load loss, variable efficiency and energy-saving effect of pumping machine
by working at “normal operation”, “inverter operation” and “impeller-adjusted operation” of training equipment for pumps and analyzing its operation data
(2)Trainees learn the procedure and caution points for performance diagnosis method for pump, and the performance evaluation method by means of training equipment for pumps.
1-1 Basic characteristic of pumping machine
[Lecture and practical work]
1-1-1 Total pump head, efficiency, motor input, rotating speed, non-load loss
1-1-2 Characteristic curve in case of parallel operation of pumps with same capacity, or pumps with different capacity
1-2 Energy-saving measures of pump (1) : pressure and power flow control operation
[Lecture and practical work] • Operating discharge valve
1-3 Energy-saving measures of pump (2) : Operational frequency control by an inverter
[Lecture] ・Characteristics of inverter operation [Practical work]
1-4 Energy-saving measures of pump (3): Adjustment of outside diameter of pump impeller
[Lecture] ・Characteristics of impeller-adjusted pump,
checking effect of energy-saving [Practical work]
1-5 Performance diagnosis method for pump [Lecture and practical work]
Source: JICA Study Team based on the content of the practical training course of Energy Conservation Center Japan
Figure 11.2-3 Draft of the Contents of Practical Training Course for Pumps

11-14
Practical Training Course for Fan
[Aim of training course] (1) Trainees understand no-load loss, variable efficiency and energy-saving effect of fan machine by
working at “normal operation”, “inverter operation” and “valve-control operation” of training equipment for fans and analyzing its visual operation data
(2) Trainees understand the points to be considered in the selection of valve type and the size of pipe, through the practical training about pressure loss for pipes with various sizes or for various types of valves.
(3) Trainees learn the procedure and caution points for performance diagnosis method for fan, and the performance evaluation method by means of training equipment for fans.
2-1 Basic characteristic of fan [Lecture and practical work]
2-1-1 Pressure, efficiency, motor input, rotating speed, non-load loss etc.
2-1-2 Performance curve
2-2 Energy-saving measures of fan(1) : Output control operation by a discharge valve or a suction valve
[Lecture and practical work]
2-3 Energy-saving measures of fan(2) :
Operational frequency control by an inverter
[Lecture] ・Characteristics of inverter operation
[Practical work]
2-4 Pressure loss of piping [Lecture] ・Comparing pressure loss of piping for
pipes with various sizes
[Practical work]
2-5 Pressure loss of valves [Lecture]
・Comparing pressure losses of various types of valves
[Practical work]
2-6 Performance diagnosis method for fan
[Lecture and practical work]
Source: JICA Study Team based on the content of the practical training course of Energy Conservation Center Japan
Figure 11.2-4 Draft of the Contents of Practical Training Course for Fans

11-15
Practical Training Course for Air Compressor
[Aim of training course] (1) Trainees understand change of energy consumption and energy-saving effect of an air compressor
by working at “on-load operation”, “unload operation” and “inverter operation” of training equipment for air compressors and analyzing its visual operation data
(2) Trainees understand change of energy consumption through the practical training about discharge pressure changing and air flow changing.
(3) Trainees understand that leakage flow of compressed air and noise level have a strong correlation through the practical training about leakage flow of compressed air and noise level.
(4) Trainees understand the points to be considered in the selection of the size of inner diameter of pipes through the practical training about pressure loss of piping for hoses with various size of inner diameter.
3-1 Basic characteristic of air compressor, on-load operation and unload operation
[Lecture and practical work]
3-2 Energy-saving measures of air compressor : Pressure constant control by an inverter operation
[Lecture] ・Characteristics of inverter operation [Practical work]
3-3 Leakage of compressed air [Lecture] ・Leakage flow of compressed air and
noise levels [Practical work]
3-4 Pressure loss of piping [Lecture] ・Comparing pressure loss of piping for
hoses with various size of inner diameter
[Practical work]
3-5 Energy-saving measures for compressed air system
[Lecture]
Source: JICA Study Team based on the content of the practical training course of Energy Conservation Center Japan
Figure 11.2-5 Draft of the Contents of Practical Training Course for Air Compressor

11-16
Suggestion of training program for Power Quality
“The situation of power sector in Jordan” (August 2012, JICA) says that the problem of a harmonic waves becomes obvious and some measures against a harmonic waves are necessary in the supply areas of JEPCO and EDCO.
As an approach for energy saving, the replacement of a lighting apparatus or an air conditioning apparatus with higher-efficient one is an effective approach. But most of high efficient apparatus have built-in inverter circuits, and an inverter circuit generates a harmonic wave when turning direct current (DC) into alternative current (AC). Therefore, there is quite high necessity of a training program for harmonic waves for the purpose of obtaining knowledge about outline, generation sources and effects of harmonic waves and skills for measures against harmonic waves so that measures against harmonic waves will be steadily taken in Jordan, because there is a fear that harmful effects on power quality due to harmonic waves may be expanded as energy-saving approaches progressed in future in Jordan.
For the reasons mentioned above, training program for power quality is suggested as a syllabus shown in Table 11.2-8 together with “instantaneous voltage fluctuations” that occurs commonly as a power quality problem and requires professional knowledge to solve. Some training courses using electric experimental instruments are implemented in NEPCO training center, and higher effects on the acquisition of knowledge and skills can be expected if trainees learn power quality phenomena through an electric experiment or a simulation.
Suggestion of training program for Smart Meters
In the power sector of Jordan, there are movements to positively introduce smart meters for the purpose of the prevention of non-technical losses due to power theft, and smart meters have been already introduced in some areas on a trial basis. A smart meter is also indispensable for the introduction of a “Home Energy Management System” (hereinafter referred to as “HEMS”), the introduction of smart meters are also expected to promote energy saving in households.
Therefore, training program for smart meters is suggested as a syllabus shown in Table 11.2-9 in consideration of the expectation of dissemination and expansion of smart meters.
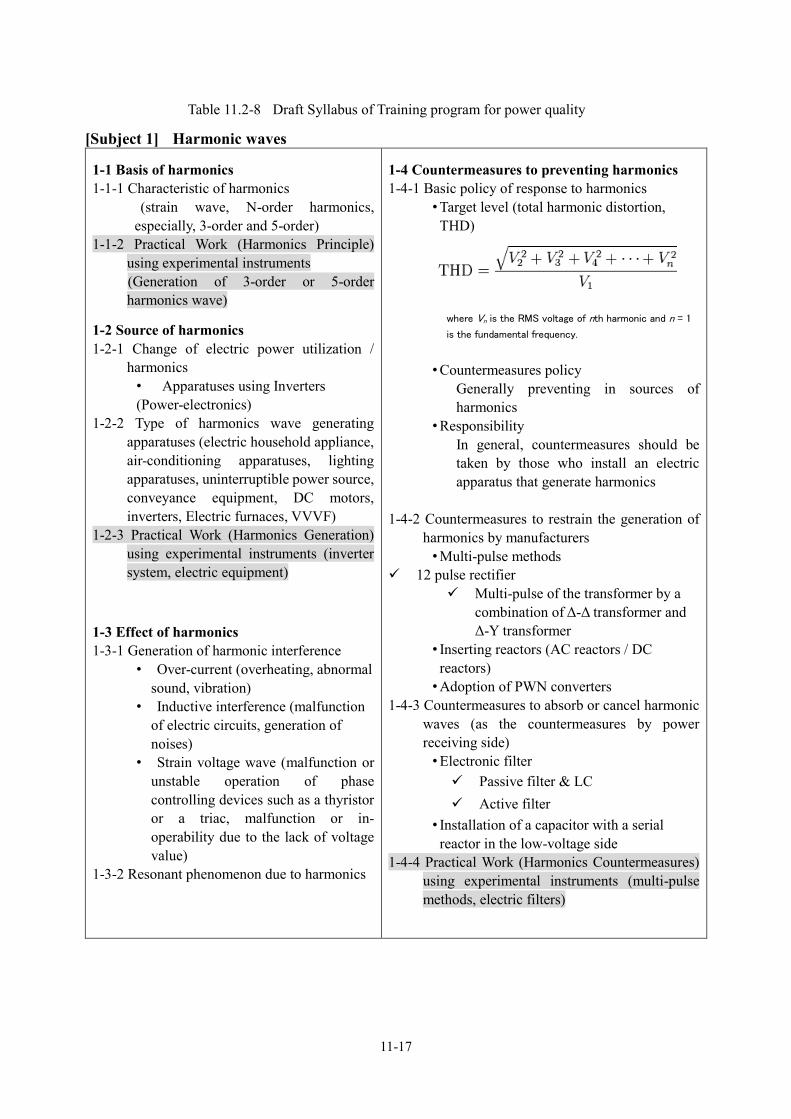
11-17
Table 11.2-8 Draft Syllabus of Training program for power quality
[Subject 1] Harmonic waves
1-1 Basis of harmonics 1-1-1 Characteristic of harmonics
(strain wave, N-order harmonics, especially, 3-order and 5-order)
1-1-2 Practical Work (Harmonics Principle) using experimental instruments
(Generation of 3-order or 5-order harmonics wave)
1-2 Source of harmonics 1-2-1 Change of electric power utilization /
harmonics • Apparatuses using Inverters (Power-electronics)
1-2-2 Type of harmonics wave generating apparatuses (electric household appliance, air-conditioning apparatuses, lighting apparatuses, uninterruptible power source, conveyance equipment, DC motors, inverters, Electric furnaces, VVVF)
1-2-3 Practical Work (Harmonics Generation) using experimental instruments (inverter system, electric equipment)
1-3 Effect of harmonics 1-3-1 Generation of harmonic interference
• Over-current (overheating, abnormal sound, vibration)
• Inductive interference (malfunction of electric circuits, generation of noises)
• Strain voltage wave (malfunction or unstable operation of phase controlling devices such as a thyristor or a triac, malfunction or in-operability due to the lack of voltage value)
1-3-2 Resonant phenomenon due to harmonics
1-4 Countermeasures to preventing harmonics 1-4-1 Basic policy of response to harmonics
• Target level (total harmonic distortion, THD)
where Vn is the RMS voltage of nth harmonic and n = 1
is the fundamental frequency.
• Countermeasures policy Generally preventing in sources of harmonics
• Responsibility In general, countermeasures should be taken by those who install an electric apparatus that generate harmonics
1-4-2 Countermeasures to restrain the generation of harmonics by manufacturers
• Multi-pulse methods 12 pulse rectifier
Multi-pulse of the transformer by a combination of Δ-Δ transformer and Δ-Y transformer
• Inserting reactors (AC reactors / DC reactors)
• Adoption of PWN converters 1-4-3 Countermeasures to absorb or cancel harmonic
waves (as the countermeasures by power receiving side)
• Electronic filter Passive filter & LC Active filter
• Installation of a capacitor with a serial reactor in the low-voltage side
1-4-4 Practical Work (Harmonics Countermeasures) using experimental instruments (multi-pulse methods, electric filters)

11-18
[Subject 2] Instantaneous voltage fluctuations 2-1 Instantaneous voltage fluctuations 2-1-1 Outline of instantaneous voltage fluctuations
• Definition • Duration of instantaneous voltage drop
2-1-2 Occurrence factor of instantaneous voltage fluctuations
• Power supplier side factors Grounding failure, short-circuit failure, lighting, momentary power failure, system switching etc.
• Power users side factors Inserting a power capacitor or a transformer etc.
2-1-3 Effects on electric equipment due to instantaneous voltage fluctuations
• DC stabilized power source • Magnetic switch • Variable-speed driving device (Motor) • High pressure discharge lamp device • Under voltage relays
2-1-4 Electric equipment which generates instantaneous voltage fluctuations
• Crane • Pump / Compressor • Elevator
2-1-5 Allowable value range for instantaneous voltage fluctuations
2-1-6 Examination method for instantaneous voltage fluctuations
2-1-7 Countermeasures against voltage fluctuations
2-2 Flicker 2-2-1 Definition of flicker 2-2-2 Electric equipment which causes flicker
• Electric furnace • Resistance welding machine • Motor-applied equipment
2-2-3 Current situation and characteristic of voltage flicker
2-2-4 Equipment and its capacity for which flicker should be examined
<Medium voltage equipment> • Electric furnace • Arc welding machine • Resistance welding machine (spot welding, seam welding, butt welding and flush welding)
• Motor-applied equipment (pressing machine, Water-lifting pump)
<Low voltage equipment> • Compressor • Cooling machine in a room • Electric drilling machine
2-2-5 Estimation calculation of flickers 2-2-6 Flicker examination steps
• Analysis of flicker sources • Grasping impedance of power lines • Estimation calculation of flickers
(⊿V, ⊿V10) • Evaluating whether a flicker level is
allowable or not • Measures for reducing flicker level (Static Var Compensator(SVC), buffering reactors, power supply by a dedicated distribution line or a dedicated transformer, replacement to larger-size conductors)
2-3 Excitation inrush current in a transformer 2-3-1 Mechanism of a transformer
• Leakage reactance • Excitation current and • Magnetic flux
2-3-2 Mechanism of excitation inrush current 2-3-3 Characteristic of excitation inrush current
and the contents to be considered 2-3-4 Grasping characteristics of a transformer
• Winding method • Capacity • Crest value magnification of excitation inrush current
• Characteristic curve of excitation inrush current
2-3-5 Method for calculation of excitation inrush current
2-3-6 Measures for reducing voltage fluctuation • Measures by a customer
Operational measures Facility measures Transformer specification change
• Measures by a power distribution company Power supply by a dedicated
distribution line Replacement to larger-size
conductors 2-3-7 Examples of interference due to excitation
inrush current 2-3-8 Measurement of excitation inrush current
Source: JICA Study Team based on the content of an in-house training course of CEPCO

11-19
Table 11.2-9 Draft Syllabus of Training program for smart meters [Subject 1] Outline of Smart Meters
1-1 Background & Purpose of introducing smart meters
1-1-1 Orientation of smart meters 1-1-2 Situation revolving around smart meters 1-1-3 Works or services by means of smart meters
1-2 Smart meter introduction planning
1-3 Overall image for introducing smart meters 1-3-1 Overall image 1-3-2 Procurement
1-4 Specification and function of a smart meter 1-4-1 Function and structure of a smart meter 1-4-2 Nameplate and liquid crystal display of a
smart meter
1-4-3 Power consumption calculation method in case of a multi time zone contract
1-4-4 Current limiting function and automatic closing function of a switch of a smart meter
1-5 Constitution for telecommunication lines for smart meters
1-5-1 Telecommunication lines between smart meters and smart meter control / management system
1-5-2 Telecommunication line between a smart meters and a customer’s HEMS
1-6 Outline of smart meter control / management system
[Subject 2] Installation method of a smart meter and other devices
2-1 Smart meter installation work 2-1-1 Fundamental rule
• Wearing suitable clothes and protective equipment and checking them
• Using tools for safety work • Connection of terminals for a meter
2-1-2 Procedure and method for a smart meter installation work
• Checking a meter before installation • Installing a smart meter • Connecting electric lines to its terminals
• Connecting a telecommunication line to its terminal
• Wiring check after installation work
2-2 Telecommunication line installation work 2-2-1 Telecommunication lines between smart
meters and smart meter control / management system
2-2-2 Telecommunication line between a smart meters and a customer’s HEMS
2-3 Installation work for other devices (such as telecommunication repeating equipment)
[Subject 3] Operation and Maintenance of smart meter control / management system
The contents of syllabus consist of operation and maintenance as for “smart meter data management”, “smart meter facility supervision, control / management”, “network supervision and control” and so on. The detail contents depend on the specification and the function of real “smart meter control / management system.”
[Subject 4] Inspection and calibration of smart meters
2-1 Smart meter inspection 2-1-1 Smart meter inspection ・Metering part ・Telecommunication part 2-1-2 Countermeasure method when control
system alarms and remotely detects abnormality of a smart meter
2-2 Life time control of smart meter 2-3 Smart meter calibration 2-3-1 Replacement of metering part 2-3-2 Calibration of metering part 2-3-3 Testing measuring instrument for metering par
Source: JICA Study Team


12-1
Considerations for enhancing capacity development for master plan formulation and feasibility of master plan
Background
In order to enhance feasibility of master plan by periodical revision of the electricity master plan formulated in this project, to establish technologies in new areas such as renewable energy and energy saving in Jordan becomes an important issue. To solve this issue, it is essential to enhance human resource development framework in addition to renewal of the facilities of NEPCO training center.
In this chapter, two schemes “Enhancement of human resource development in new fields related to electric energy” and “Investigation of the amount of renewable energy introduced and technical measures” are picked up and the contents of these schemes considered by JICA study team are suggested in 12.2.
Suggestion of new schemes
Enhancement of human resource development in new fields related to electric energy
New training courses that suit the actual situations such as the increase of renewable energy are needed in Jordan. Not only individual technical training courses but also the fulfillment of position-based training courses that aim the promotion of the career of human resources is necessary. Furthermore, activities that cover technical transfer related to skills and knowhow such as managing method of the training center and preparation of training programs and syllabi are also needed. The contents of new technical training courses to enhance human resource development for new field related to electric energy are shown in Table 12.2-1.
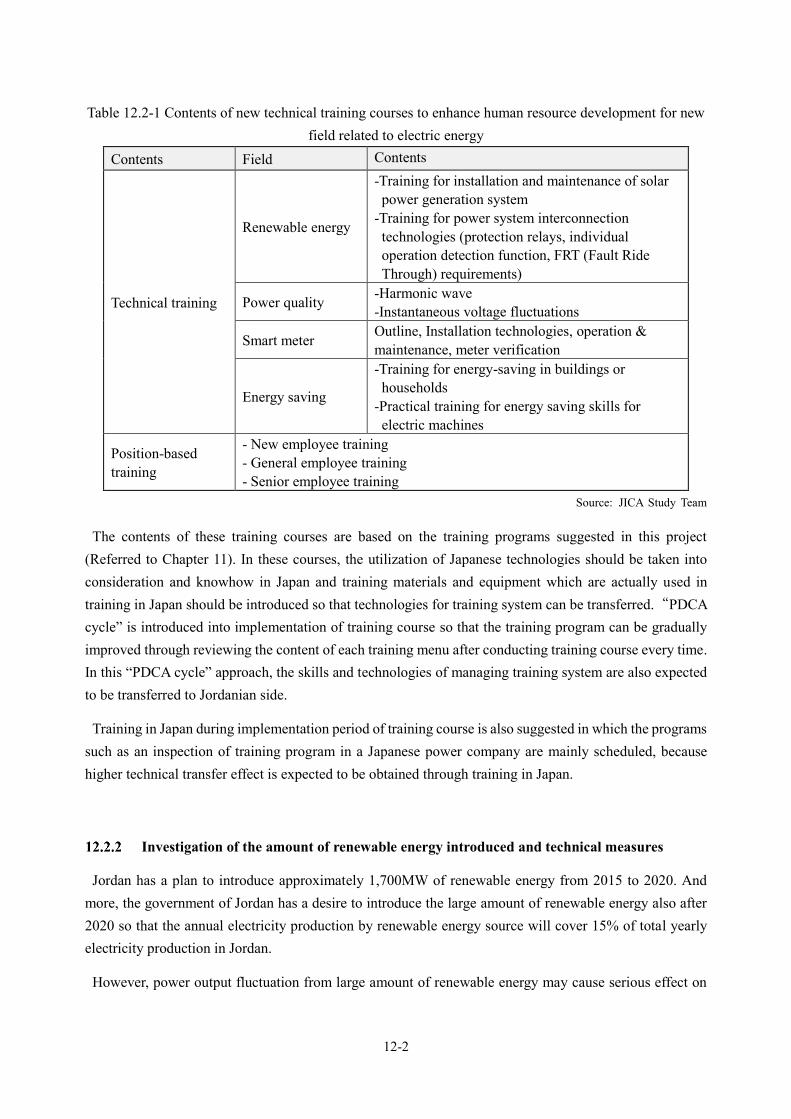
12-2
Table 12.2-1 Contents of new technical training courses to enhance human resource development for new field related to electric energy
Contents Field Contents
Technical training
Renewable energy
-Training for installation and maintenance of solar power generation system
-Training for power system interconnection technologies (protection relays, individual operation detection function, FRT (Fault Ride Through) requirements)
Power quality -Harmonic wave -Instantaneous voltage fluctuations
Smart meter Outline, Installation technologies, operation & maintenance, meter verification
Energy saving
-Training for energy-saving in buildings or households
-Practical training for energy saving skills for electric machines
Position-based training
- New employee training - General employee training - Senior employee training
Source: JICA Study Team
The contents of these training courses are based on the training programs suggested in this project (Referred to Chapter 11). In these courses, the utilization of Japanese technologies should be taken into consideration and knowhow in Japan and training materials and equipment which are actually used in training in Japan should be introduced so that technologies for training system can be transferred.“PDCA cycle” is introduced into implementation of training course so that the training program can be gradually improved through reviewing the content of each training menu after conducting training course every time. In this “PDCA cycle” approach, the skills and technologies of managing training system are also expected to be transferred to Jordanian side.
Training in Japan during implementation period of training course is also suggested in which the programs such as an inspection of training program in a Japanese power company are mainly scheduled, because higher technical transfer effect is expected to be obtained through training in Japan.
Investigation of the amount of renewable energy introduced and technical measures
Jordan has a plan to introduce approximately 1,700MW of renewable energy from 2015 to 2020. And more, the government of Jordan has a desire to introduce the large amount of renewable energy also after 2020 so that the annual electricity production by renewable energy source will cover 15% of total yearly electricity production in Jordan.
However, power output fluctuation from large amount of renewable energy may cause serious effect on

12-3
power system. In this reason, more detailed introduction examination for renewable energy will be required in future than the master plan formulation in which the analysis based on the actual operation records of renewable energy power sources introduced in recent years will be conducted.
The analysis technology transfer is also needed so that NEPCO engineers can conduct examine the introduction of renewable energy by themselves.
The suggested contents of this scheme are as follows:
(1) Evaluation of renewable energy’s output fluctuation on power system based on actual operation records of solar power and wind power
(2) Investigation of the total introduction amount of battery systems (3) Investigation of access points of battery in the system (4) Cost-benefit analysis on introduction of battery systems (5) Technical transfers related to above (1) to (4), and investigation of renewable energy introduction
by NEPCO itself (6) Suggestion on ownership of battery system in electric sector
Furthermore, training in Japan will be conducted during the project of this scheme whose main program is the inspection to approaches to renewable energy in Japan. The training in Japan will help the trainers obtain knowledge about the measures for introduction of renewable energy and renewable energy operation methods.


![A Reference-Pulse Generator for Motion Control Systemble hard-wired feature, parallel processing architecture, short design cycle, low power consumption and high density [5]. Therefore](https://img.pdfslide.net/doc/110x75/5ed921b46714ca7f476934c1/a-reference-pulse-generator-for-motion-control-system-ble-hard-wired-feature-parallel.jpg)