Embed Size (px)
Citation preview

Legislative Economic BriefingJanuary 19, 2012
Mississippi University Research CenterMississippi Institutions of Higher Learning
Darrin Webb, State [email protected]
(601)432-6556
January 19, 2012 MS University Research Center, IHL 1
Highlights• Ended 2011 on a strong note
• Economy will likely slow in the coming months
• Slow growth is the new norm– MS will be particularly challenged
• On track to make 2012 General Fund Estimate
January 19, 2012 MS University Research Center, IHL 2
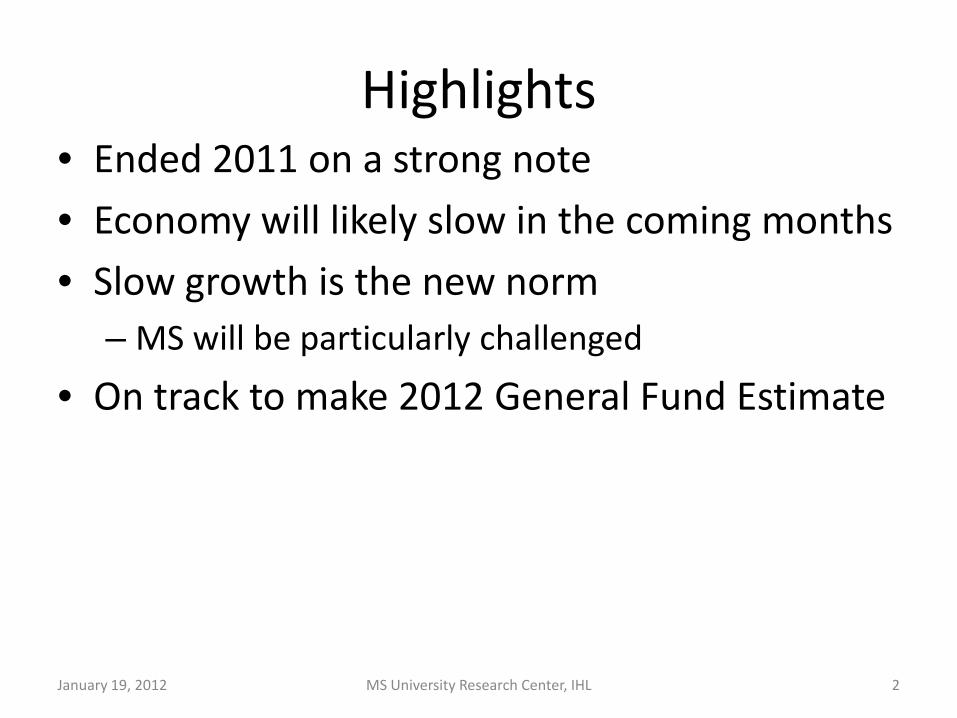
Annualized Quarterly Growth in Real GDP
1.7%
3.7%
3.9%
3.7%
2.5%
2.3%
0.4% 1.
3% 1.8%
3.4%
-12.0%
-10.0%
-8.0%
-6.0%
-4.0%
-2.0%
0.0%
2.0%
4.0%
6.0%
8.0%
10.0%
2000q1 2001q1 2002q1 2003q1 2004q1 2005q1 2006q1 2007q1 2008q1 2009q1 2010q1 2011q1
Darker Bars Represent National Recessions, The 2011q4 figure is an estimate by IHS Global Insight.
MS University Research Center, IHL 3January 19, 2012
The 4th quarter was the strongest of 2011.

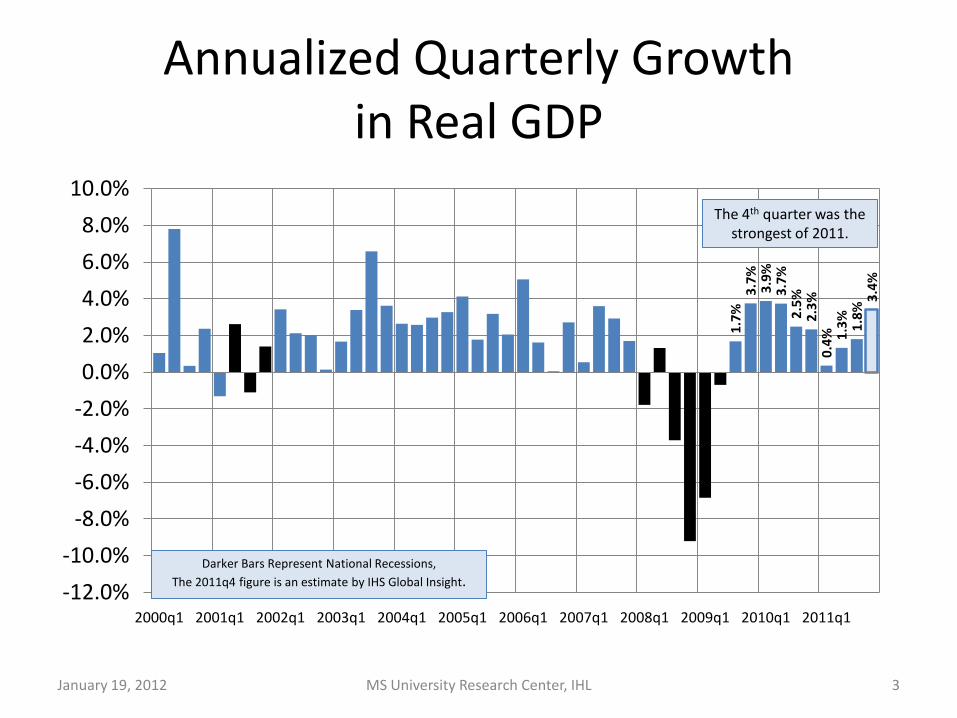
US Nonfarm EmploymentJobs added(subtracted) by Month
MS University Research Center, IHL 4
-1,000,000
-800,000
-600,000
-400,000
-200,000
0
200,000
400,000
600,000
Th
ou
san
ds
December 2011
Job growth during the
summer months was particularly
anemic.
US Nonfarm Employment
MS University Research Center, IHL 5
124,000
126,000
128,000
130,000
132,000
134,000
136,000
138,000
140,000
Th
ou
san
ds
Peak-to-trough loss 8.8 million Jobs or 6.3%
Gains since trough 2.7 million jobs. We
remain 4.4% below peak
January 19, 2012
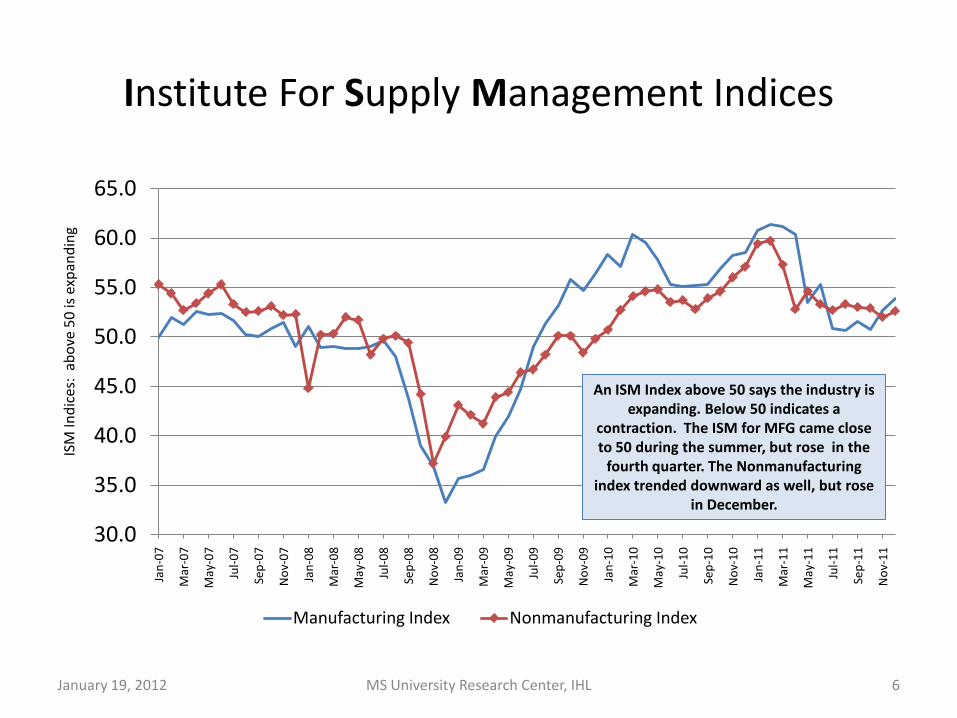
Institute For Supply Management Indices
30.0
35.0
40.0
45.0
50.0
55.0
60.0
65.0Ja
n-07
Mar
-07
May
-07
Jul-0
7
Sep-
07
Nov
-07
Jan-
08
Mar
-08
May
-08
Jul-0
8
Sep-
08
Nov
-08
Jan-
09
Mar
-09
May
-09
Jul-0
9
Sep-
09
Nov
-09
Jan-
10
Mar
-10
May
-10
Jul-1
0
Sep-
10
Nov
-10
Jan-
11
Mar
-11
May
-11
Jul-1
1
Sep-
11
Nov
-11
ISM
Indi
ces:
abo
ve 5
0 is
exp
andi
ng
Manufacturing Index Nonmanufacturing Index
MS University Research Center, IHL 6January 19, 2012
An ISM Index above 50 says the industry is expanding. Below 50 indicates a
contraction. The ISM for MFG came close to 50 during the summer, but rose in the
fourth quarter. The Nonmanufacturing index trended downward as well, but rose
in December.
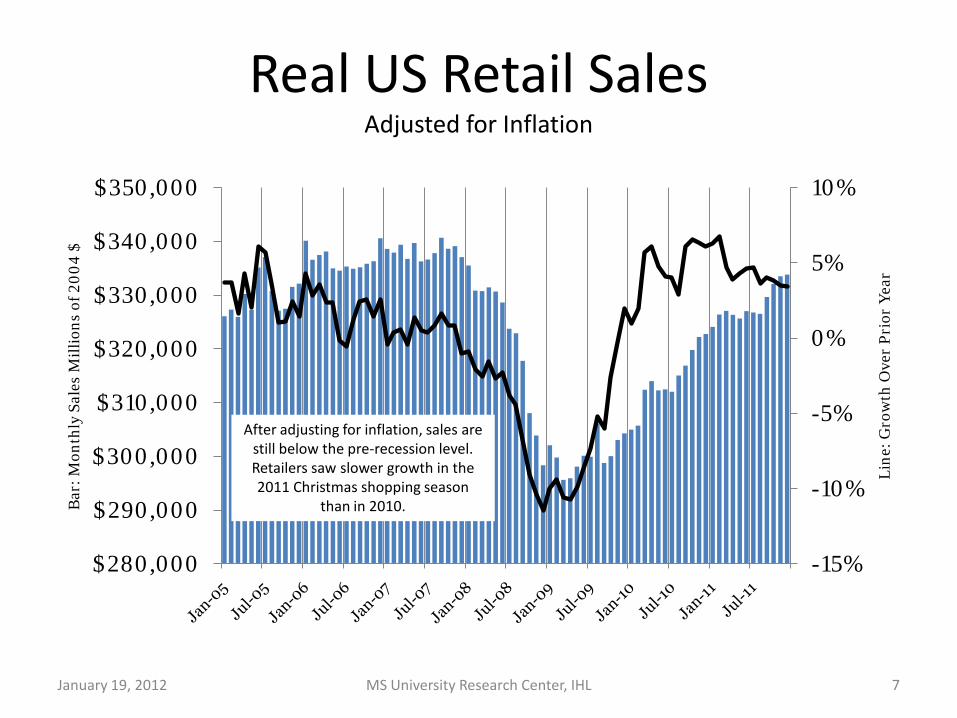
Real US Retail SalesAdjusted for Inflation
-15%
-10%
-5%
0%
5%
10%
$280,000
$290,000
$300,000
$310,000
$320,000
$330,000
$340,000
$350,000
Lin
e: G
row
th O
ver
Pri
or Y
ear
Bar
: Mon
thly
Sal
es M
illi
ons
of 2
00
4 $
MS University Research Center, IHL 7January 19, 2012
After adjusting for inflation, sales are still below the pre-recession level. Retailers saw slower growth in the 2011 Christmas shopping season
than in 2010.

U.S. Light Vehicle SalesOver 13 million units sold (annualized rate) for the past 4 months
9.0
11.0
13.0
15.0
17.0
19.0
21.0
23.0
Mill
ions
of U
nits
, SA
AR
MS University Research Center, IHL 8January 19, 2012
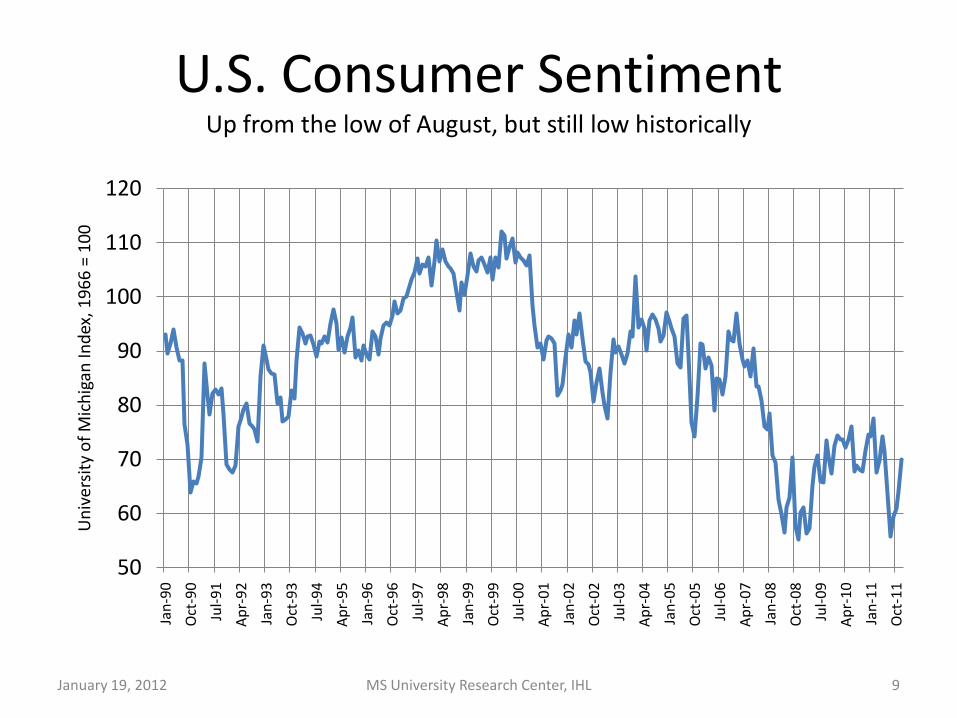
U.S. Consumer Sentiment Up from the low of August, but still low historically
50
60
70
80
90
100
110
120Ja
n-90
Oct
-90
Jul-9
1
Apr
-92
Jan-
93
Oct
-93
Jul-9
4
Apr
-95
Jan-
96
Oct
-96
Jul-9
7
Apr
-98
Jan-
99
Oct
-99
Jul-0
0
Apr
-01
Jan-
02
Oct
-02
Jul-0
3
Apr
-04
Jan-
05
Oct
-05
Jul-0
6
Apr
-07
Jan-
08
Oct
-08
Jul-0
9
Apr
-10
Jan-
11
Oct
-11
Uni
vers
ity o
f Mic
higa
n In
dex,
196
6 =
100
MS University Research Center, IHL 9January 19, 2012
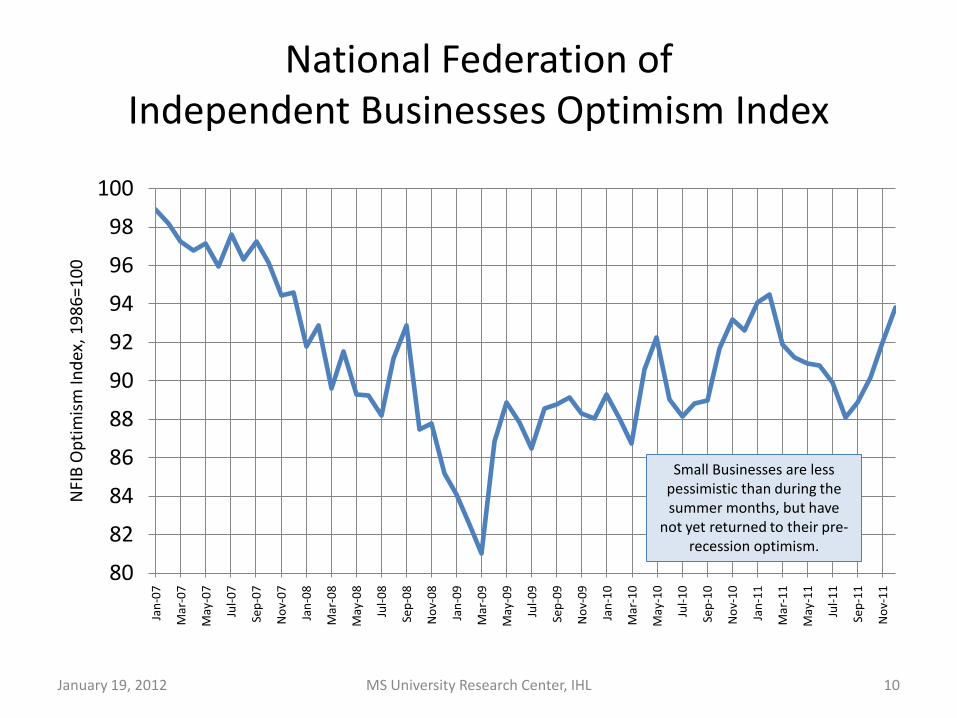
National Federation of Independent Businesses Optimism Index
Jan-
07
Mar
-07
May
-07
Jul-0
7
Sep-
07
Nov
-07
Jan-
08
Mar
-08
May
-08
Jul-0
8
Sep-
08
Nov
-08
Jan-
09
Mar
-09
May
-09
Jul-0
9
Sep-
09
Nov
-09
Jan-
10
Mar
-10
May
-10
Jul-1
0
Sep-
10
Nov
-10
Jan-
11
Mar
-11
May
-11
Jul-1
1
Sep-
11
Nov
-11
80
82
84
86
88
90
92
94
96
98
100
NFI
B O
ptim
ism
Inde
x, 1
986=
100
MS University Research Center, IHL 10January 19, 2012
Small Businesses are less pessimistic than during the summer months, but have
not yet returned to their pre-recession optimism.
-6.0%
-5.0%
-4.0%
-3.0%
-2.0%
-1.0%
0.0%
1.0%
2.0%
3.0%
4.0%
96.0
98.0
100.0
102.0
104.0
106.0
108.0
110.0Ja
n-07
Apr
-07
Jul-0
7
Oct
-07
Jan-
08
Apr
-08
Jul-0
8
Oct
-08
Jan-
09
Apr
-09
Jul-0
9
Oct
-09
Jan-
10
Apr
-10
Jul-1
0
Oct
-10
Jan-
11
Apr
-11
Jul-1
1
Oct
-11
Line
Gra
ph: G
row
th O
ver
Year
Ago
Bar G
raph
: Ind
ex 2
004=
100
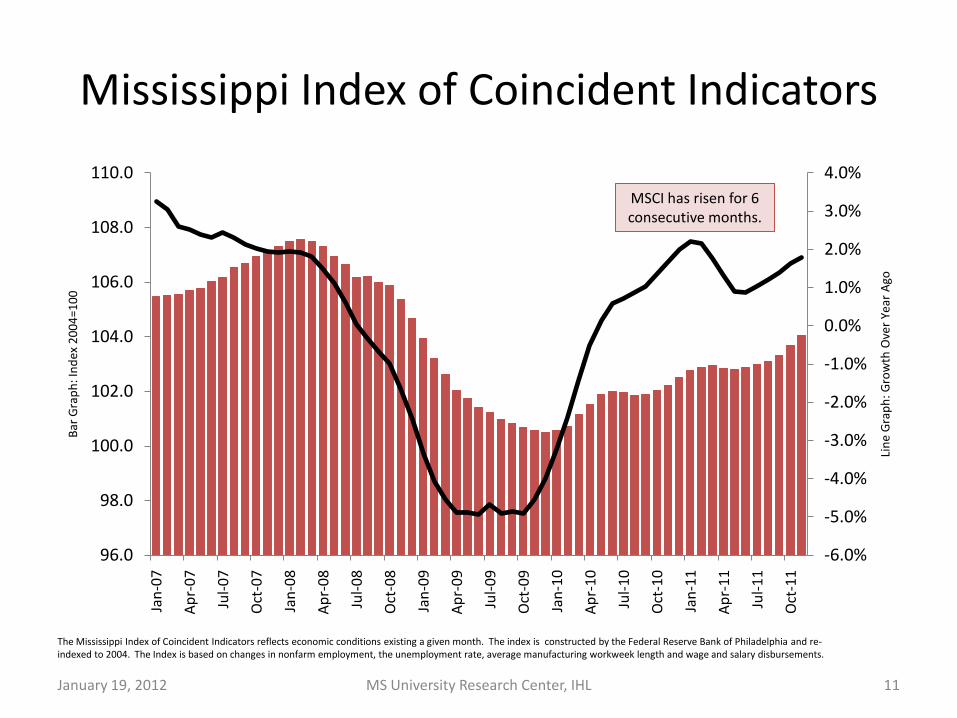
Mississippi Index of Coincident Indicators
11MS University Research Center, IHLJanuary 19, 2012
MSCI has risen for 6 consecutive months.
The Mississippi Index of Coincident Indicators reflects economic conditions existing a given month. The index is constructed by the Federal Reserve Bank of Philadelphia and re-indexed to 2004. The Index is based on changes in nonfarm employment, the unemployment rate, average manufacturing workweek length and wage and salary disbursements.
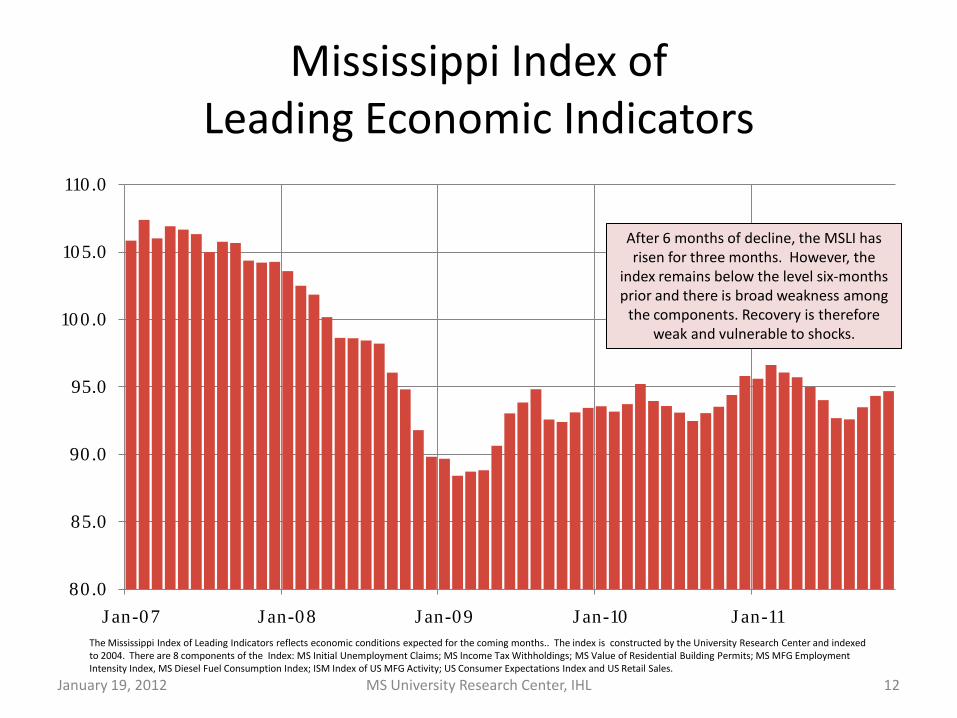
Mississippi Index of Leading Economic Indicators
80.0
85.0
90.0
95.0
100.0
105.0
110.0
Jan-07 Jan-08 Jan-09 Jan-10 Jan-11
12MS University Research Center, IHL
After 6 months of decline, the MSLI has risen for three months. However, the
index remains below the level six-months prior and there is broad weakness among
the components. Recovery is therefore weak and vulnerable to shocks.
January 19, 2012
The Mississippi Index of Leading Indicators reflects economic conditions expected for the coming months.. The index is constructed by the University Research Center and indexed to 2004. There are 8 components of the Index: MS Initial Unemployment Claims; MS Income Tax Withholdings; MS Value of Residential Building Permits; MS MFG Employment Intensity Index, MS Diesel Fuel Consumption Index; ISM Index of US MFG Activity; US Consumer Expectations Index and US Retail Sales.

MS Nonfarm Employment
MS University Research Center, IHL 13
800
850
900
950
1,000
1,050
1,100
1,150
1,200
Th
ou
san
ds
Employment has risen for three consecutive months. Employment remains well below the peak of February
1,160.4 May 00
1,109.3 Jun 03
1,104.8 Nov 11
1,160.2 Feb 08
January 19, 2012
1,083.4 Feb 10

January 19, 2012 MS University Research Center, IHL 14
(1,576)Jones
(1,358)Warren
(1,025)Jackson
(1,022)De Soto
(940)Lauderdale
(906)Neshoba
(842)Lee
(781)Lowndes
(755)Union(742)
Lafayette
(733)Washington
(655)Adams
(633)Tunica
(625)Oktibbeha
(586)Alcorn
(568)Grenada
(563)Leflore
(529)Lincoln
(466)Claiborne
(461)Marshall
(445)Winston
(389)Wayne
(352)Marion
(335)Pearl River
(312)Clay
(235)Walthall
(234)Tippah
(214)Pike
(212)Covington
(193)Amite
(192)Sunflower
(188)Attala
(169)Bolivar
(153)Monroe
(152)Tishomingo
(120)Newton
(95)Itawamba
(85)Leake
(74)Jasper
(65)Lawrence
(61)Tate
(50)Yazoo
(42)Scott
(41)Kemper
(15)Perry
(5)Issaquena
5 George
6 Franklin
11 Quitman
15 Stone
16 Carroll
34 Holmes
37 Copiah
53 Simpson
59 Humphreys
64 Calhoun
70 Jefferson
80 Greene
81 Webster
84 Prentiss
86 Clarke
91 Coahoma
92 Montgomery 93
Choctaw
102 Benton
110 Pontotoc
114 Wilkinson
115 Noxubee
123 Chickasaw
123 Madison
128 Hancock
166 Tallahatchie
175 Forrest
176 Sharkey
185 Lamar
205 Smith
207 Jefferson Davis
395 Yalobusha
619 Rankin
693 Panola
758 Hinds
1,120 Harrison
DeclineLess than 100 Jobs GainedGreater than 100 Jobs Gained
Employment Gained (Lost) By County
2010-2011*
* The average employment for the January to November period is compared for both years.
46 Counties Lost Employment

MS Residential Building PermitsThree Month Moving Average Number of Units
20
220
420
620
820
1,020
1,220
1,420
1,620
1,820
Jan
-00
Jul-
00
Jan
-01
Jul-
01
Jan
-02
Jul-
02
Jan
-03
Jul-
03
Jan
-04
Jul-
04
Jan
-05
Jul-
05
Jan
-06
Jul-
06
Jan
-07
Jul-
07
Jan
-08
Jul-
08
Jan
-09
Jul-
09
Jan
-10
Jul-
10
Jan
-11
Jul-
11
7,615 Permits were issued in the 1st seven months of 2005.
During the same period of 2011, only 2,580 were issued. This is a 66% decrease.
15MS University Research Center, IHLJanuary 19, 2012
Permits trended upward in the second half of
2011
Other Mississippi Trends
• Real Withholdings have trended up in 2011, but are below pre-recession levels
• Initial and continued unemployment claims trended down in second half of 2011, after rising in the first half; Remain high by historical standards
• Diesel fuel consumption declined toward the end of 2011
January 19, 2012 MS University Research Center, IHL 16

The U.S. Economy Will Slow In first Half of 2012
• Inventory Boost will Fade
• Fundamental Weakness in the Economy – Weak housing sector
– High debt levels for consumer and government
– Consumers and businesses remain cautious
– Eurozone financial troubles may lead to some credit tightening in the U.S.
• Slower Global Economy
January 19, 2012 MS University Research Center, IHL 17

Growth In Real U.S. GDPHistorical and IHS Global Insight Baseline Projections
3.0%
1.8% 2.
0% 2.4%
3.4%
-4.0%
-3.0%
-2.0%
-1.0%
0.0%
1.0%
2.0%
3.0%
4.0%
5.0%
6.0%
MS University Research Center, IHL 18January 19, 2012
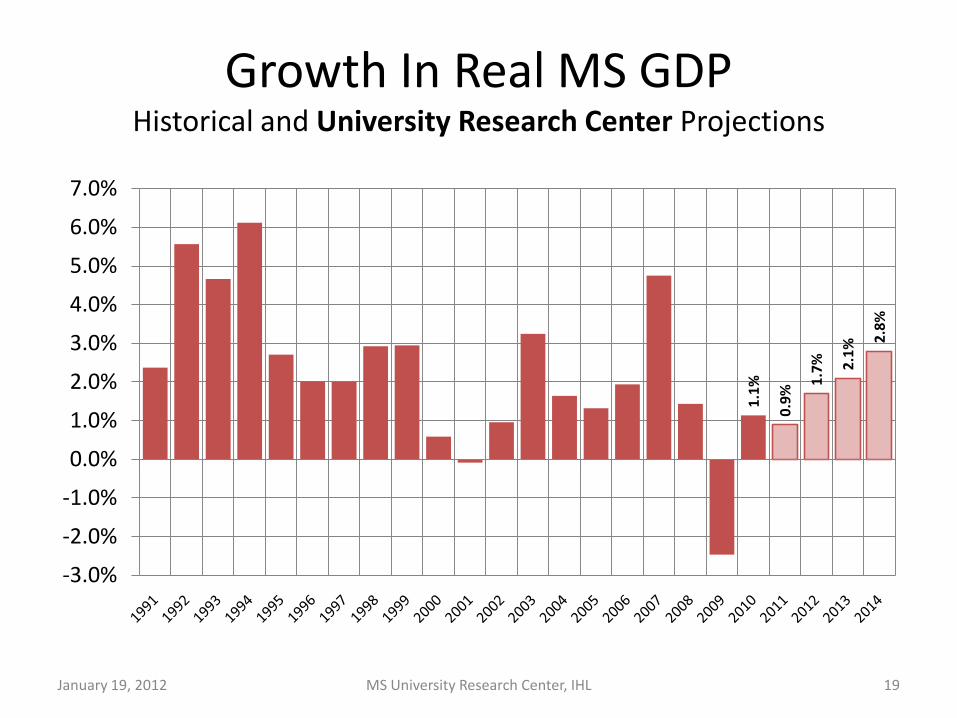
Growth In Real MS GDPHistorical and University Research Center Projections
1.1%
0.9%
1.7% 2.
1%
2.8%
-3.0%
-2.0%
-1.0%
0.0%
1.0%
2.0%
3.0%
4.0%
5.0%
6.0%
7.0%
MS University Research Center, IHL 19January 19, 2012
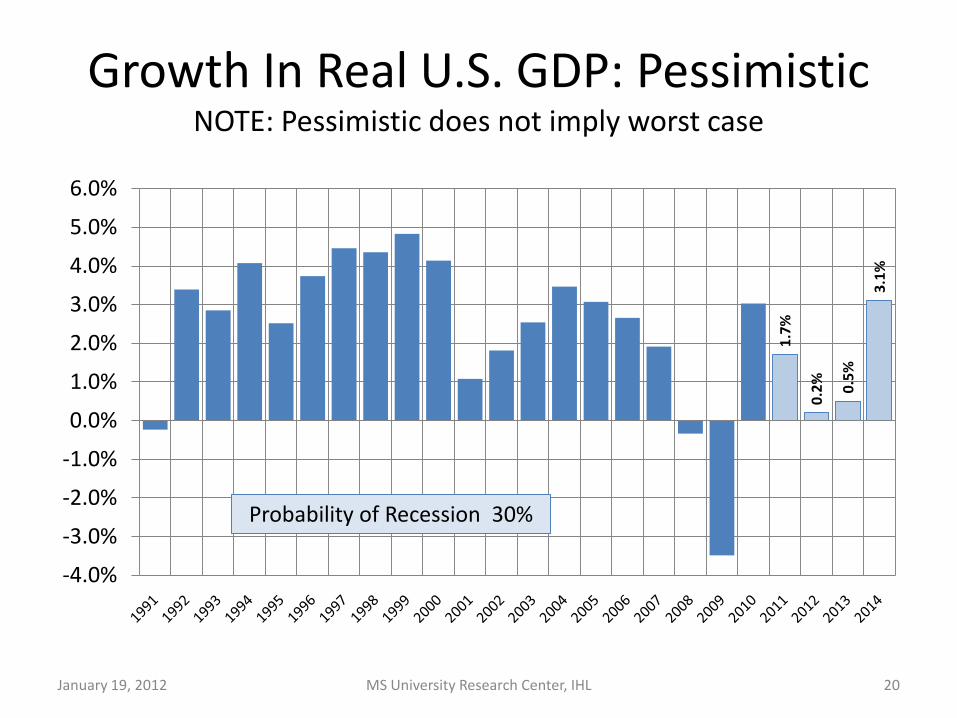
Growth In Real U.S. GDP: PessimisticNOTE: Pessimistic does not imply worst case
1.7%
0.2% 0.
5%
3.1%
-4.0%
-3.0%
-2.0%
-1.0%
0.0%
1.0%
2.0%
3.0%
4.0%
5.0%
6.0%
MS University Research Center, IHL 20January 19, 2012
Probability of Recession 30%
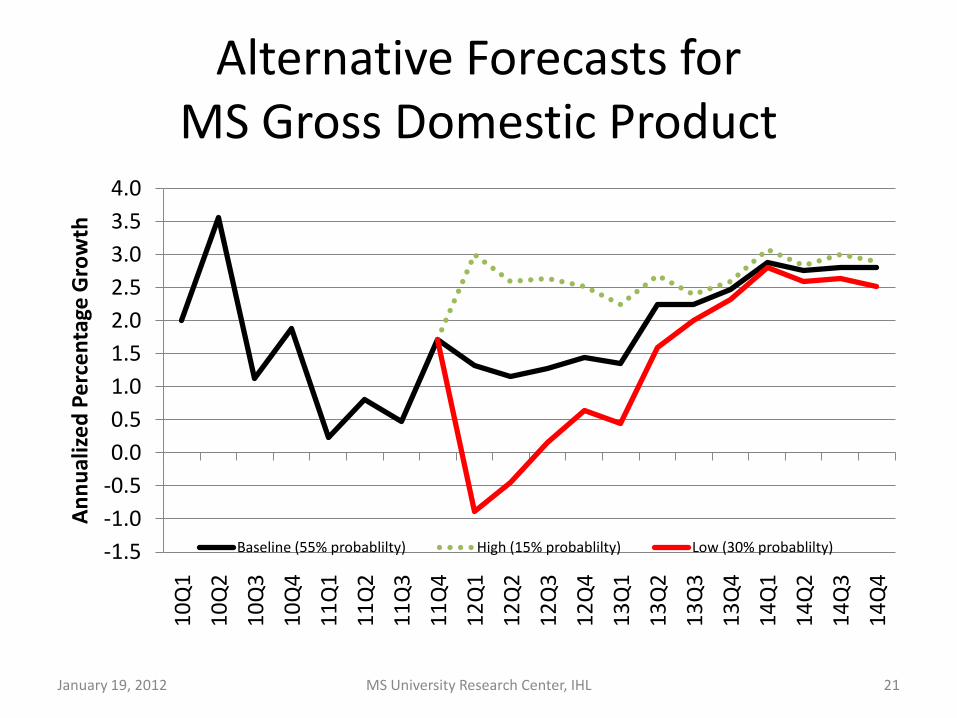
Alternative Forecasts for MS Gross Domestic Product
-1.5-1.0-0.50.00.51.01.52.02.53.03.54.0
10Q
1
10Q
2
10Q
3
10Q
4
11Q
1
11Q
2
11Q
3
11Q
4
12Q
1
12Q
2
12Q
3
12Q
4
13Q
1
13Q
2
13Q
3
13Q
4
14Q
1
14Q
2
14Q
3
14Q
4
Ann
ualiz
ed P
erce
ntag
e G
row
th
Baseline (55% probablilty) High (15% probablilty) Low (30% probablilty)
January 19, 2012 MS University Research Center, IHL 21
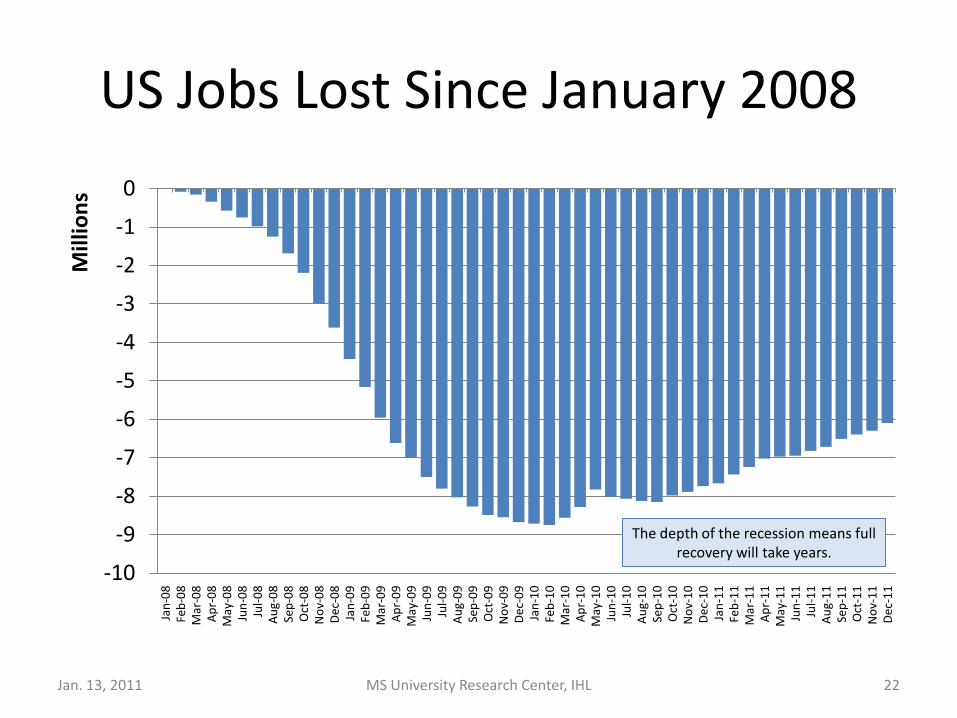
US Jobs Lost Since January 2008
-10
-9
-8
-7
-6
-5
-4
-3
-2
-1
0Ja
n-08
Feb-
08M
ar-0
8A
pr-0
8M
ay-0
8Ju
n-08
Jul-0
8A
ug-0
8Se
p-08
Oct
-08
Nov
-08
Dec
-08
Jan-
09Fe
b-09
Mar
-09
Apr
-09
May
-09
Jun-
09Ju
l-09
Aug
-09
Sep-
09O
ct-0
9N
ov-0
9D
ec-0
9Ja
n-10
Feb-
10M
ar-1
0A
pr-1
0M
ay-1
0Ju
n-10
Jul-1
0A
ug-1
0Se
p-10
Oct
-10
Nov
-10
Dec
-10
Jan-
11Fe
b-11
Mar
-11
Apr
-11
May
-11
Jun-
11Ju
l-11
Aug
-11
Sep-
11O
ct-1
1N
ov-1
1D
ec-1
1
Mill
ions
Jan. 13, 2011 MS University Research Center, IHL 22
The depth of the recession means full recovery will take years.
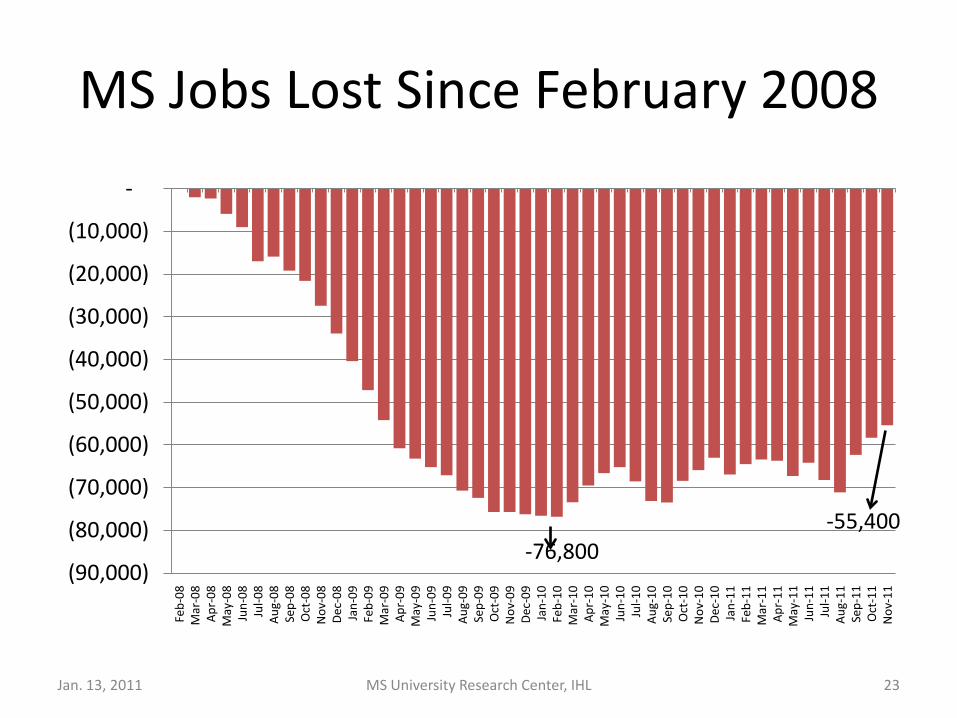
MS Jobs Lost Since February 2008
-76,800-55,400
(90,000)
(80,000)
(70,000)
(60,000)
(50,000)
(40,000)
(30,000)
(20,000)
(10,000)
-Fe
b-08
Mar
-08
Apr
-08
May
-08
Jun-
08Ju
l-08
Aug
-08
Sep-
08O
ct-0
8N
ov-0
8D
ec-0
8Ja
n-09
Feb-
09M
ar-0
9A
pr-0
9M
ay-0
9Ju
n-09
Jul-0
9A
ug-0
9Se
p-09
Oct
-09
Nov
-09
Dec
-09
Jan-
10Fe
b-10
Mar
-10
Apr
-10
May
-10
Jun-
10Ju
l-10
Aug
-10
Sep-
10O
ct-1
0N
ov-1
0D
ec-1
0Ja
n-11
Feb-
11M
ar-1
1A
pr-1
1M
ay-1
1Ju
n-11
Jul-1
1A
ug-1
1Se
p-11
Oct
-11
Nov
-11
Jan. 13, 2011 MS University Research Center, IHL 23

Annual Growth in Real GDP
-3.0%
-2.0%
-1.0%
0.0%
1.0%
2.0%
3.0%
4.0%
5.0%
6.0%
1998 1999 2000 2001 2002 2003 2004 2005 2006 2007 2008 2009 2010
MS SE US
MS University Research Center, IHL 24January 19, 2012
Mississippi’s growth was below that of the Nation and Region in 9 out of
the past 13 years
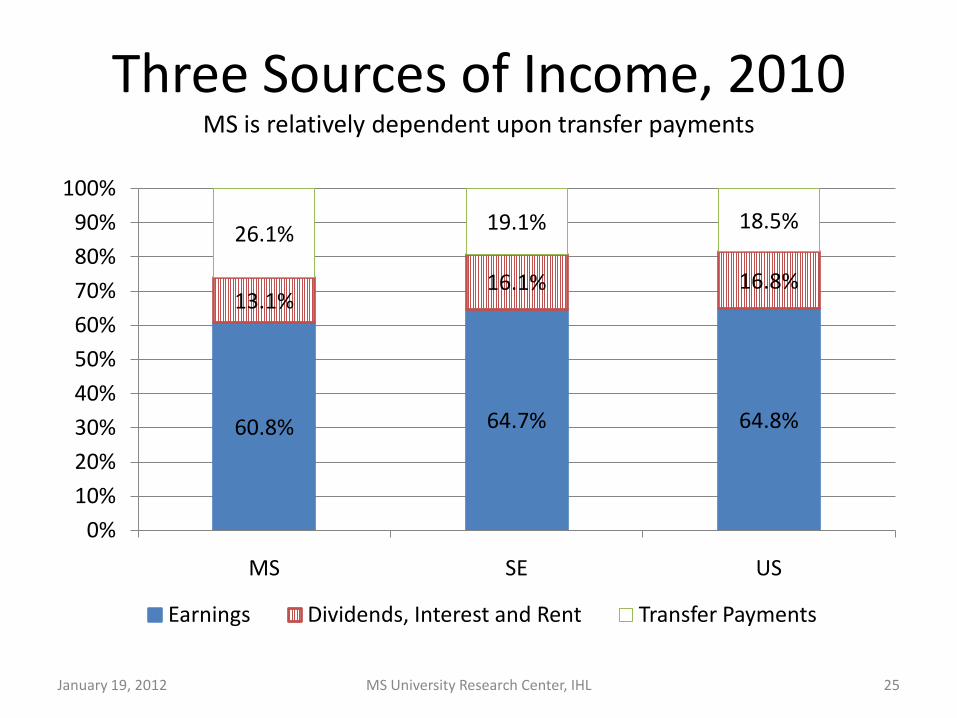
Three Sources of Income, 2010MS is relatively dependent upon transfer payments
60.8% 64.7% 64.8%
13.1%16.1% 16.8%
26.1% 19.1% 18.5%
0%10%20%30%40%50%60%70%80%90%
100%
MS SE US
Earnings Dividends, Interest and Rent Transfer Payments
MS University Research Center, IHL 25January 19, 2012
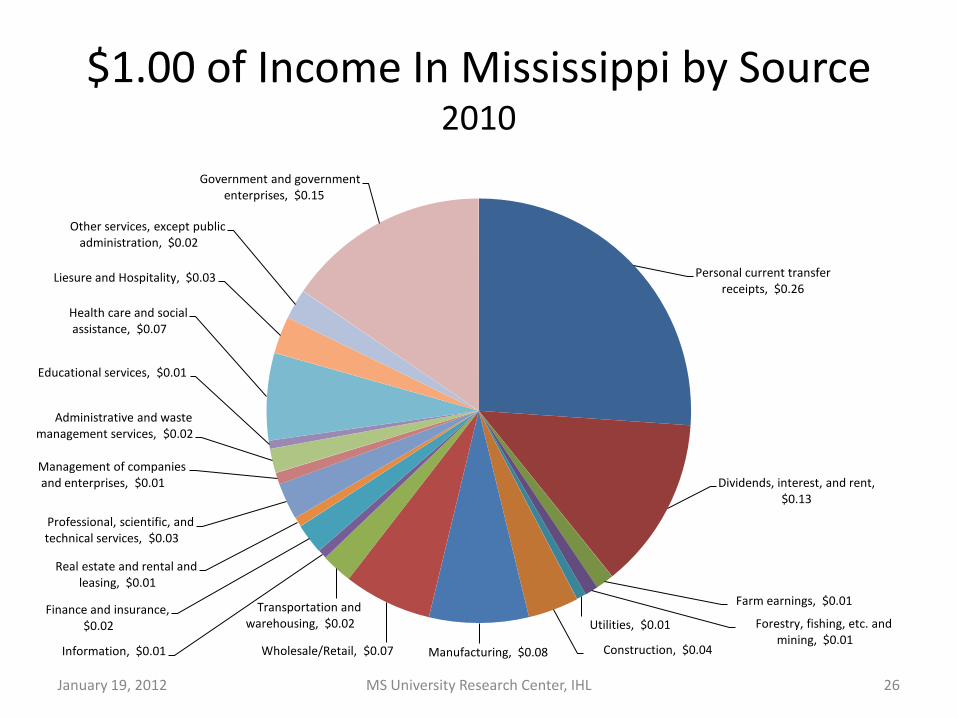
$1.00 of Income In Mississippi by Source2010
Personal current transfer receipts, $0.26
Dividends, interest, and rent, $0.13
Farm earnings, $0.01
Forestry, fishing, etc. and mining, $0.01
Utilities, $0.01
Construction, $0.04 Manufacturing, $0.08 Wholesale/Retail, $0.07
Transportation and warehousing, $0.02
Information, $0.01
Finance and insurance, $0.02
Real estate and rental and leasing, $0.01
Professional, scientific, and technical services, $0.03
Management of companies and enterprises, $0.01
Administrative and waste management services, $0.02
Educational services, $0.01
Health care and social assistance, $0.07
Liesure and Hospitality, $0.03
Other services, except public administration, $0.02
Government and government enterprises, $0.15
MS University Research Center, IHL 26January 19, 2012

Federal Expenditures as a share of Gross Domestic Product, By State, 2010
13.0
%
15.7
%
16.1
%
16.4
%
16.6
%
16.9
%
17.4
%
17.6
%
18.4
%
18.7
%
18.8
%
19.3
%
19.5
%
19.9
%
20.6
%
20.7
%
21.3
%
21.4
%
21.8
%
22.1
%
22.3
%
22.8
%
22.9
%
23.6
%
23.7
%
23.8
%
23.9
%
24.3
%
25.0
%
25.1
%
25.4
%
25.6
%
25.7
%
25.7
%
26.1
%
27.0
%
28.2
%
28.3
%
28.4
%
28.8
%
28.9
%
29.8
% 31.2
%
32.1
%
32.2
%
32.6
%
32.7
%
33.3
% 35.1
%
35.1
%
0.0%
5.0%
10.0%
15.0%
20.0%
25.0%
30.0%
35.0%
40.0%
DE
NV
WY
MN NJ IL NY
CA NE TX NH CO OR IA UT
WA IN NC
MA WI
OH KS GA CT MI
SD RI LA FL ND AZ
PA AK ID OK
TN AR SC ME
MO VT MT HI
VA MS
MD AL
WV KY N
M
January 19, 2012 MS University Research Center, IHL 27
Federal expenditures represent almost a third of Mississippi’s GDP
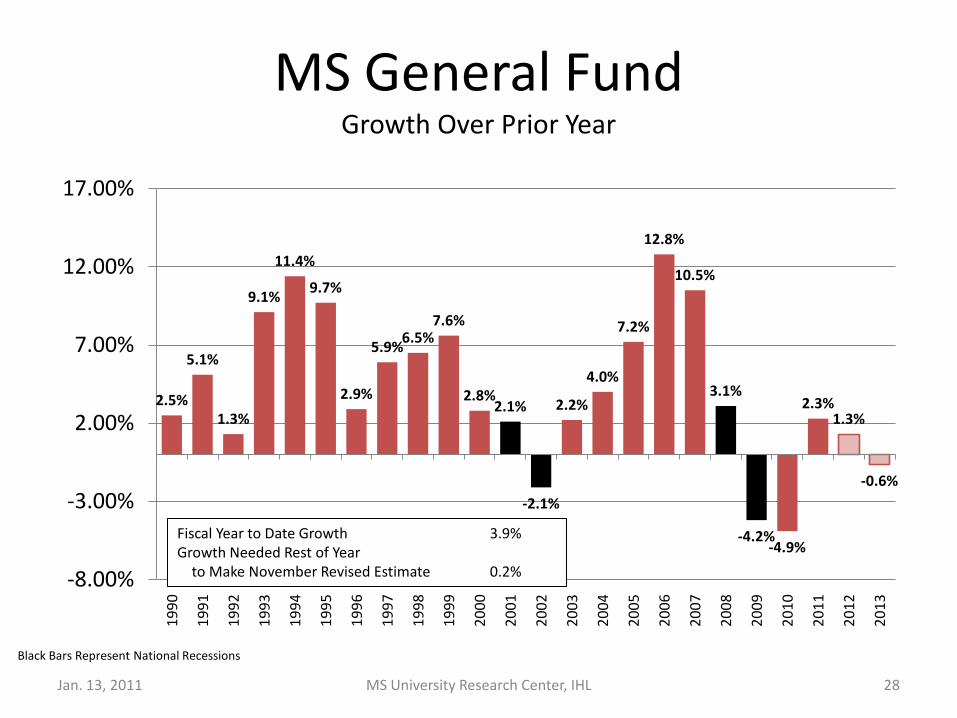
MS General FundGrowth Over Prior Year
2.5%
5.1%
1.3%
9.1%
11.4%
9.7%
2.9%
5.9%6.5%
7.6%
2.8%2.1%
-2.1%
2.2%
4.0%
7.2%
12.8%
10.5%
3.1%
-4.2%-4.9%
2.3%1.3%
-0.6%
-8.00%
-3.00%
2.00%
7.00%
12.00%
17.00%19
90
1991
1992
1993
1994
1995
1996
1997
1998
1999
2000
2001
2002
2003
2004
2005
2006
2007
2008
2009
2010
2011
2012
2013
Jan. 13, 2011 MS University Research Center, IHL 28
Black Bars Represent National Recessions
Fiscal Year to Date Growth 3.9%Growth Needed Rest of Year
to Make November Revised Estimate 0.2%
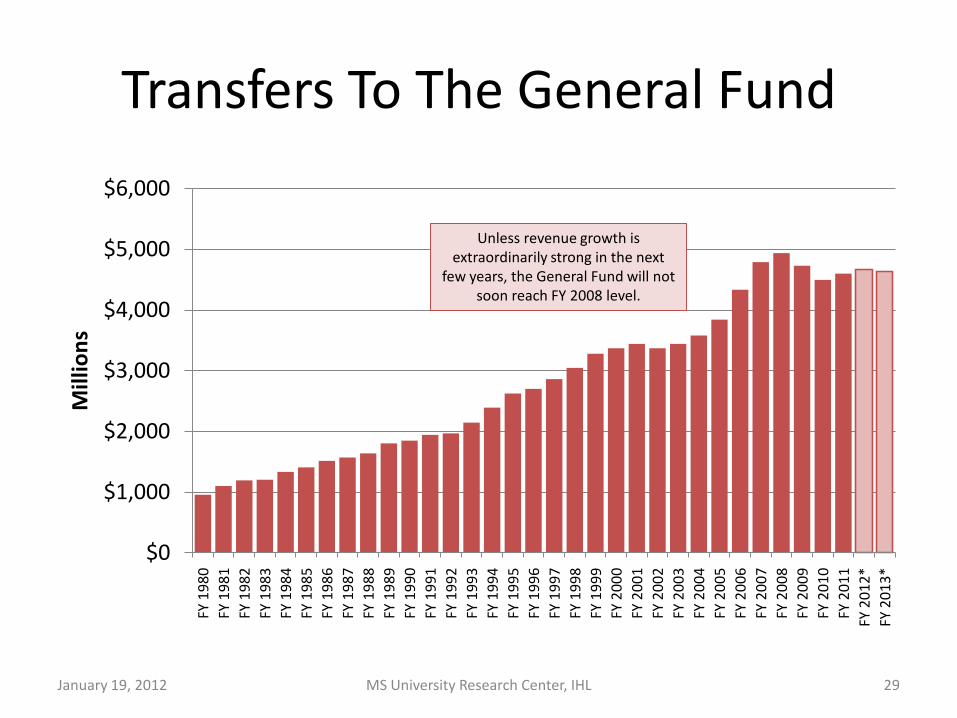
Transfers To The General Fund
$0
$1,000
$2,000
$3,000
$4,000
$5,000
$6,000FY
198
0FY
198
1FY
198
2FY
198
3FY
198
4FY
198
5FY
198
6FY
198
7FY
198
8FY
198
9FY
199
0FY
199
1FY
199
2FY
199
3FY
199
4FY
199
5FY
199
6FY
199
7FY
199
8FY
199
9FY
200
0FY
200
1FY
200
2FY
200
3FY
200
4FY
200
5FY
200
6FY
200
7FY
200
8FY
200
9FY
201
0FY
201
1FY
201
2*FY
201
3*
Mill
ions
MS University Research Center, IHL 29January 19, 2012
Unless revenue growth is extraordinarily strong in the next
few years, the General Fund will not soon reach FY 2008 level.
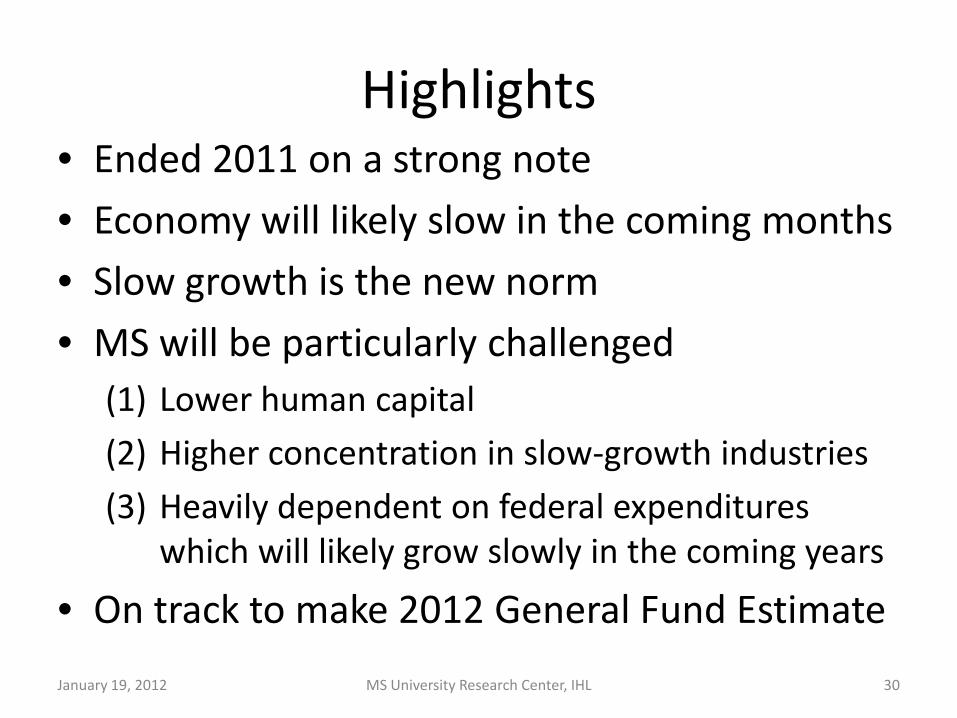
Highlights• Ended 2011 on a strong note
• Economy will likely slow in the coming months
• Slow growth is the new norm
• MS will be particularly challenged(1) Lower human capital
(2) Higher concentration in slow-growth industries
(3) Heavily dependent on federal expenditures which will likely grow slowly in the coming years
• On track to make 2012 General Fund Estimate
January 19, 2012 MS University Research Center, IHL 30