Embed Size (px)
Citation preview
1 | P a g e
LegisSTAT Priority: Public Education October 28, 2021
Best Practices for Results Focused Government
Results-Focused Leadership • Articulating a results-focused
strategy • Asking for evidence • Acting on evidence Evidence Related Strategies • Developing learning
agendas • Creating an evaluation policy • Using rapid experimentation • Making contracts and grants
results focused Performance Management • Using performance
information • Implementing strategic
planning • Weaving a performance
focus into budgeting • Collaborating within
government Using Data • Data sharing
Background The purpose of the Accountability in Government Act (AGA) is to provide for more cost-effective and responsive government services by using the state budget process and defined outputs, outcomes and performance measures to annually evaluate the performance of state government programs. The AGA traded budget flexibility for information about how state agencies economically, efficiently, and effectively carry out their responsibilities and provide services. Prior to the AGA, agency appropriations were tightly controlled by the Legislature with attention paid to individual budget line items and incremental spending of salaries, office supplies, travel, etc. After the AGA, the focus switched to results as measured by performance (inputs, outputs, outcomes, etc.). To facilitate reviews of agency performance, the Legislative Finance Committee (LFC) staff developed a dashboard report, a report card, to add emphasis and clarity to the reporting process and focus budget discussions on evidence-based initiatives and programming. Report cards and associated analysis of performance has continued to serve policymakers and the public well on how New Mexico state government delivers services. Performance reports serve as a key linchpin in the Legislative Finance Committee’s overall “Legislating for Results” policy and budgeting framework. However, agencies have not widely adopted practices for “Managing for Results” and thus sometimes struggle to effectively implement evidence-based programs funded by the Legislature or operate services effectively and efficiently.
The LFC has long held hearings on performance reports, inviting agencies to present on their performance results and action plans for improvement, or staff led presentations on the state’s performance overall. While informative, the meetings are often driven by an agency narrative that may not effectively answer legislative priorities. A meeting on state performance overall provides a significant amount of information that helps inform future decision making but the hearing is not set up to directly influence agency management practices.
LegisSTAT LFC staff are proposing to build on the existing Legislating for Results framework through a first of its kind legislatively driven performance improvement hearing process called LegisSTAT. PerformanceSTAT meetings are a longstanding tool used by leadership to drive performance improvements at the federal, state, and local levels. Often, the STAT meetings are held by executive leadership and focus on high priority performance challenges. The meetings take a subset of specific performance metrics and focus on specific actions managers can, and do, take to make improvement until performance improves to a satisfactory level.
A couple of key differences exist between LFC’s performance hearings and STAT meetings – a STAT meeting is more collaborative and less “agency-driven”, there is a greater emphasis on action plans and reporting actions taken from the last meeting, and there is a regular schedule of meetings. Typically, in an executive setting, STAT meetings occur frequently, either weekly or monthly, neither of which is realistic, nor desirable, for a legislative hearing schedule. The legislature cannot, nor should it, attempt to manage agency day to day operations. But, the legislature and its committees can and should exercise its oversight responsibilities in a manner that produces better results.

2 | P a g e
LegisSTAT Priority: Public Education October 28, 2021
The “Five Whys”
The “five whys” is an investigatory method used to determine the root cause of an issue. Rather than the traditional five “W” questions to simply gather information (who, what, when, where, and why), the five whys allow a questioning legislator to uncover core causes of performance problems and illuminate potential solutions. Elements of a Good Action Plan
A key element of the LegisSTAT process is asking an agency to articulate its plan to address key performance trends. An agency can do this by building a quality action plan for its quarterly AGA data reporting. A quality action plan includes: • Measurable goals and
timelines • Specific language and
detailed actions for improvement
• A responsible party named for each goal
• Actionable goals logically connected to larger agency mission
The proposed LegisSTAT process seeks to have regularly scheduled time to focus on a key set of LFC priority performance issues, starting with economic recovery coming out of the COVID-19 public health emergency, and collaborate with agencies in a way to drive performance improvements for New Mexicans. The LegisSTAT process would focus on a core set of performance metrics, hold regular time slots for performance discussion with agency leadership (at least quarterly), follow up on action items from the last meeting, and review results for improvement. The discussions could lead to policy or budget recommendations to aid in improvement.
Key hearing questions for each LegisSTAT meeting could include:
• What do we know about the trends? • What is the agency doing to proactively tackle this issue or challenge? • What could we expect by the next meeting? • The “five whys” (see sidebar)
Other examples of the STAT process The PerformanceSTAT process originates from New York City Police Department’s CompSTAT, Baltimore’s CitiSTAT, and Maryland’s StateSTAT, but PerformanceSTAT has since spread into all types of federal, state, and local governments.
• Colorado's Department of Human Services uses a PerformanceStat approach, called C-Stat, to examine data on a monthly basis in C-Stat meetings. Together, departmental executive leadership and staff identify positive trends and opportunities for improvement. Divisions determine strategies for improvement and implement these strategies, while executive leadership helps reduce barriers to the divisions' success.
• Wisconsin’s Department of Children and Families run KidSTAT as the department’s performance management approach. Data-driven reports and information are shared at KidSTAT meetings where department leadership and program staff hold each other accountable for program outcomes.
• The federal Department of Housing and Urban Development runs HUDSTAT performance management process, which is comprised of a series of executive-level meetings at which granular data from across the department are examined and progress towards the achievement of a particular performance goal is analyzed.

1 | P a g e
LegisSTAT Priority: Public Education October 28, 2021
Public Education
Background Information
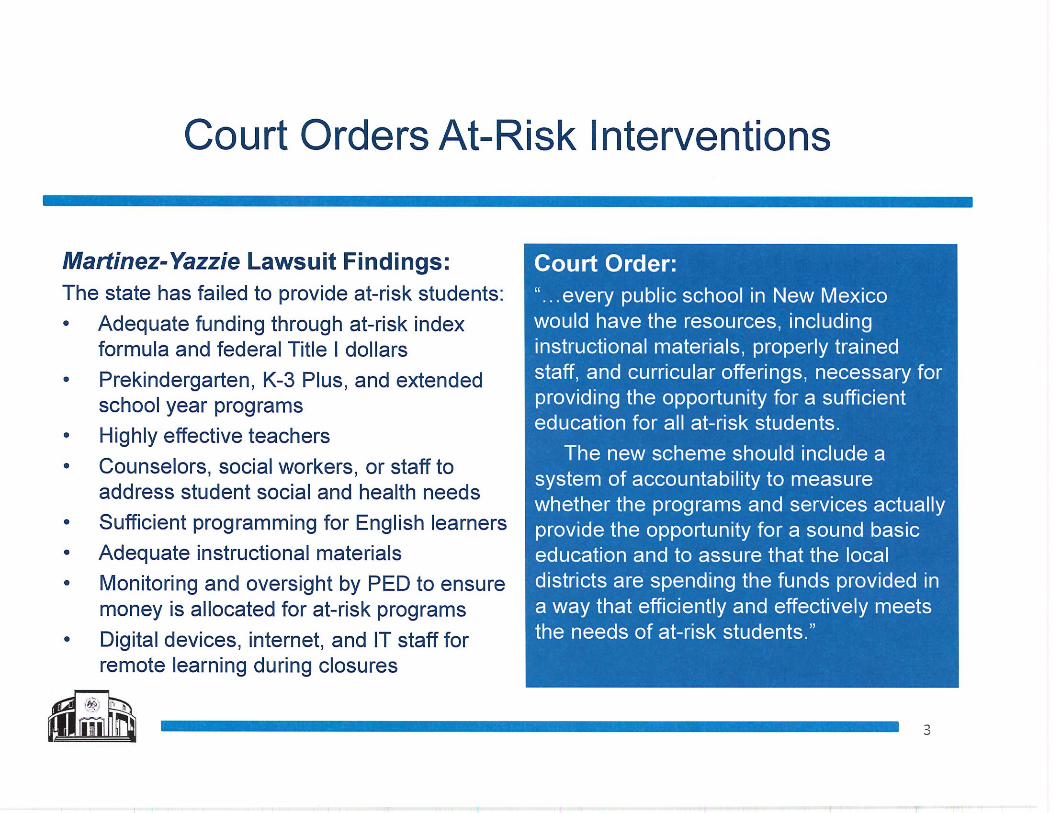
Math and reading proficiency rates have long been key measures of student academic success. In the Martinez-Yazzie education lawsuit, the court used these two measures as primary indicators for educational sufficiency. Prior to FY20, the Public Education Department’s (PED) use of PARCC reading and math tests for school and teacher accountability faced opposition due to the lack of timely and meaningful feedback on results and use of test scores for personnel decisions. Although the court used PARCC scores as a key measure of sufficiency, PED switched to a new test called MSSA in FY20—interrupting the continuity of performance measurement. School closures and federal waivers in FY20 and FY21 delayed implementation of the MSSA test, resulting in two years of no standardized academic data during a period of significant investment in public schools and lost instructional time.
Problem Statement
Student Performance Data. Despite significant expansion in education technology for testing during the pandemic and new capabilities with MSSA to deliver quick results and interim testing, PED has not required assessments as schools return to in-person instruction. Preliminary data from other states and some New Mexico data suggests overall student academic achievement has worsened over the pandemic, increasing the urgency to help students recover lost instructional time.
The Legislature, PED, and public lack regular information throughout the school year on student academic performance. Even more now, PED needs to ensure schools are serving at-risk students with appropriate interventions, such as extended instructional time, and measuring academic progress regularly to make informed decisions on how to improve student outcomes.
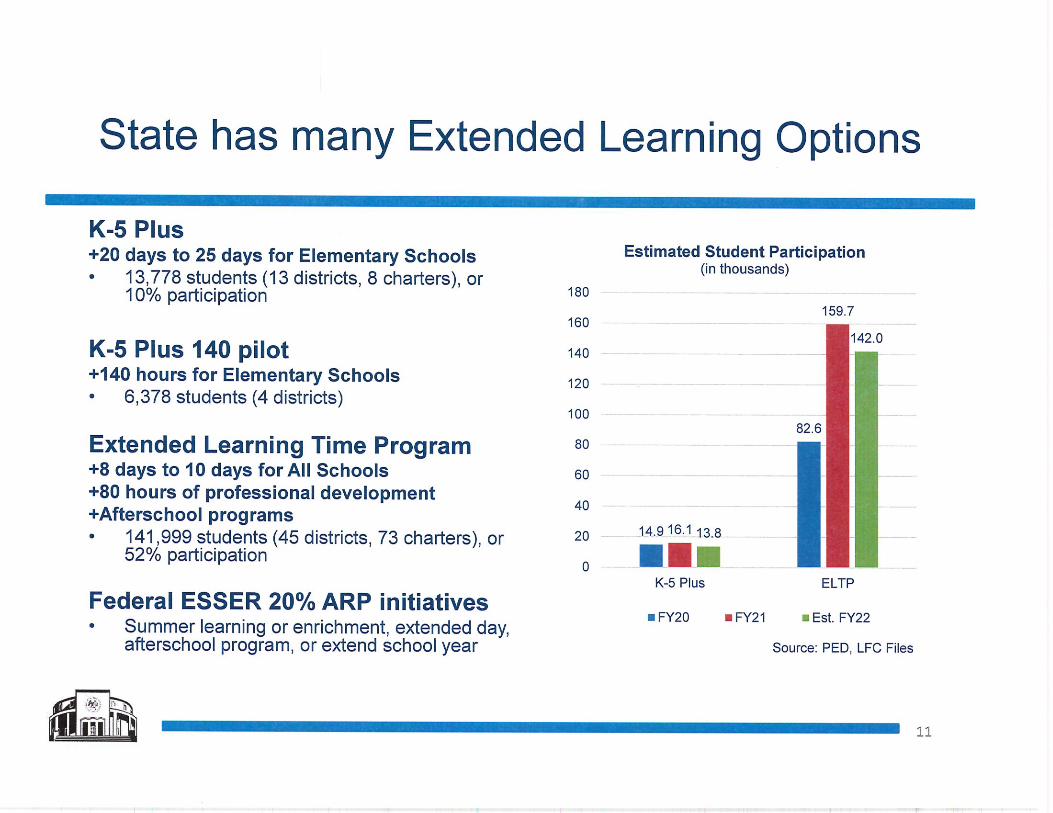
Extended Learning. New Mexico’s key legislative interventions to make up lost instructional time, K-5 Plus and Extended Learning Time Programs (ELTP), remain underutilized. Court findings in the Martinez-Yazzie lawsuit highlighted the lack of funding for these programs to close the achievement gap. After making enough funding for all at-risk students to participate, however, schools chose not to enroll in the programs, citing teacher and community pushback on a longer year.
37%40%
34%
20%22% 21%
41%43%
40%
0%
10%
20%
30%
40%
50%
FY17 FY18 FY19 FY20 FY21
Student Proficiency Rates
Reading Math Science

2 | P a g e
LegisSTAT Priority: Public Education October 28, 2021
27%
52%46%
0
50,000
100,000
150,000
200,000
250,000
300,000
350,000
FY20 FY21 FY22
Extended Learning Time Program Participation
(all students)
ELTP Students Non ELTP Students
27%
34%
29%
32%
24%
15%
21%
17%
26%
9%
Caucasian
African American
Hispanic
Native American
Asian
Chronic Absenteeism Rates
(Students missing 10% days)
US FY16 NM FY21
10% 12% 10%
0
20,000
40,000
60,000
80,000
100,000
120,000
140,000
160,000
FY20 FY21 FY22
K-5 Plus Participation(K-5 students only)
K-5 Plus Students Non K-5 Students
Near-Term Leading Indicators
Performance Trends: • Student Performance Data. Nearly all education performance metrics
are reported annually (often lagged one year), leaving no time for meaningful or proactive corrective action.
• Economically-disadvantaged students are more likely to be absent from school and historically perform worse on all academic metrics.
• Extended Learning. Participation in K-5 Plus continues to fall, with only 10 percent of elementary school students projected to be enrolled for FY22.
• At-risk students in evidence-based programs like prekindergarten and K-5 Plus show better academic gains than nonparticipating peers, with stronger improvements for those participating in both programs.
Suggested Questions: • Student Performance Data. When will the department start requiring
interim assessment using the MSSA test? • What metrics of student success can the department use other than math and
reading scores and how frequently can these metrics be reported? • Extended Learning. What is the department doing to increase the number
of schools participating in K-5 Plus or Extended Learning Time Programs? • How is the department supporting schools in their use of federal American
Rescue Plan funding to address learning loss? • How is the department addressing student chronic absenteeism, particularly
for at-risk students?
26%
12%
0%
5%
10%
15%
20%
25%
30%
Students in HighFidelity K-5 Plus and
PreK
Students Not in K-5Plus and PreK
Economically Disadvantaged Student
Reading Proficiency Rates

3 | P a g e
LegisSTAT Priority: Public Education October 28, 2021
Long-Term Outcomes
10.0 10.512.1 10.8
17.5
7.8 7.6 8.7 7.710.5
0
5
10
15
20
FY17 FY18 FY19 FY20 FY21
Average Number of Days Students are Absent Each Year
Economically Disadvantaged Non-Economically Disadvantaged
0%
10%
20%
30%
40%
FY17 FY18 FY19 FY20 FY21
Reading Proficiency Rates for At-Risk Students
Native American Economically-Disadvantaged
English Learners Special Education
0%
10%
20%
30%
40%
FY17 FY18 FY19 FY20 FY21
Math Proficiency Rates for At-Risk Students
Native American Economically-Disadvantaged
English Learners Special Education
71.1%73.9% 75.0%
76.9%
66.4%69.0% 70.0%
71.8%
60%
65%
70%
75%
80%
FY17 FY18 FY19 FY20 FY21
4-Year High School Graduation Rates
State Average Economically-Disadvantaged
Best Practices for Results Focused Government:
Results-Focused Leadership:
• Articulating a results-focused strategy
• Asking for evidence • Acting on evidence Evidence Related Strategies • Developing learning
agendas • Creating an evaluation policy • Using rapid experimentation • Making contracts and grants
results focused Performance Management • Using performance
information • Implementing strategic
planning • Weaving a performance
focus into budgeting • Collaborating within
government Using Data • Data sharing