Embed Size (px)
Citation preview

Lehigh University P~oject 3~5
Li\TERAL IJISTRIBU]lION OF LOADIN PRESTRESSED CONCRETE BOX·... BEAf\1 BRIDGES
Reports Completed to Date
LATERAL DISTRIBUTION OF STATIC LOADS IN A PRESTI~ESSED CONCRETE BOX·~BEAf.\1 BRIDGE .- DREJ-IE1<.SVILLEBl\IDGE Q DOLlglas, ~"! ~ J Q arld \lanHoT'n, D" A!I'F~ L~ Report 31501, August 1966
l~TERAL DIsrfRIBUTIO~l ()F DYNM'lIC LOADS IN A PRE--S 'flzESSED CONCREI1E BO)(--BEAM BRIDGE - DREJ-IERSVI LLEBRIDGEo Guilford, A.. A9 and VanHorn, Do A.,~Fo L,) Re:po'rt 315,,2, Febr1 ua.ry 1967
STlllJCTlJRP.\L RESPOlJSE OF A qSQ SI<EVJ F'RESTRESSEDCOtTCl1.ETE BOX~GIRDER }Il Gl-{vvAY I3RID(~E SUBJECTED TO\lEl{I ClJLl\P, LOADI1~G ,"" IlROOI(VI l~LE BRIDGE ~
Sctlaffel'9 Tholna.s a'nd Va11}-{oI1n 9 D., AQ' F" I,,)Report 31SG5, October 1967
U1TET(AL DISTRIBUTION OF VEJ-IICUL1\R LOADS IN A PRE.,..STRESSED CONCRETE BOX-BEAM BRIDGE - BERWICK BRIDGE.Guilf'ord, A" A. arId Vanrlorn, D~ A .. , F .. L" Re)?ort31504, October 1967
T}fE EfFECT OF ~'IIDSP111\1 DIAPlfHllGt1S ON TJOAD DIS'rRIBlJTION IN A PRESTRESSED CONCRETE BOX-BEAM BRIDGE Pj-llLADELPHI.A BRIDGE., Lin, Chertg-shung a11dVanHor11) D~ A", F" IJ4 Report 315,,6, \Jutle 1968
I1ArrEILl\I~ DISTRIB1JTION OF VEJ-IICULi"\R LOADS IN A PRE~
STRESSED CONCRETE BOX~BEAM BRIDGE ~ WHITE HAVENBRIDGE. Guilford, A~ A" and VanHorn, D# A", F. LoReport 315.7, August 1968
srrRUCTlJRL~rJ BE1-{AVIOR CI-iARACTERISTICS OF PRESTI.zESSEDC01\JCRE11E BOX~BEAM DRIDGF~S~ VaXlJ-I0 T1n, D l' A .. ~ F .. L.'Report 31568, December 1969
THEORETICAL Al'lALYSIS OF LOAD DIS'IRIBlJTION IN PRE~-.
STRJ::SSED CfJNCR.ETE BOX-·Bf=I\~j BRIDGES <t Motarjf:~ITli, D <)
and VanHorn, D~ A~, F~ L~ Report 315~9, October 1969
COMMONWEALTH OF PENNSYLVANIA
Department of Highways
Bureau of Materials, Testing a~d Research
Leo D. Sandvig - Director~ivade L. Gramling - Research Engineer
Foster C. Sankey:- Research Coordinator
I"
rr
,,~
il'
~,
h,t;:::
r·
Project No. 64-6: Lateral Distribution of Loadfor Br'idges Constructed withPrestressed Concrete Box Beams
STRUCTURAL BEHAVIOR CHARACTERISTICS'
of
PRESTRESSEp CONCRETE BOX-BEAM BRIDGES
by
. David A. VanHorn
This work was sponsored by the Pennsylvania Department ofHighways;U.S.Department of Transportation, Federal HighwayAdministration, Bureau of Public Roads; and the ReinforcedConcrete Research Council. The opinions, findings, and conclusions expressed in this publication are those of theauthor, and not necessarily those of the. sp,onso!s.
LEHIGH UNIVERSITY
Office of Research
Bethlehem, Pennsylvania
December, 1969 .
Fritz Engineering Laboratory Report' No. 315.8

j
j
~ABLE OF CONTENTS
j
c,~
,ii
I "A..'.',.'."'.'"I'
--1,i
;.ABSTRACT
1. INTRODUCTION
2. TEST STRUCTURES
2.1 General Description of Superstructure
2.2 Design for Vehicular Loads
3 • EXPERIMENTAL PROCEDURE
3.1 Conduct' of Te$ts
3.2 ,Instrumentation
3.3 Data Reduction
4. RESULTS
4.1 Load Distribution
4.2 Beam Deflections
4.3 Other Results
4.3.1 Effect of Midspan Diaphragms
4.3.2 Effect of Skew
4.3.3 Modulus of Elasticity
4.3.4 Effective Slab Widths
4.3.5' Behavior of Midspan Diaphragms
4.3.6 Effect of Deflection Joints
1
5
5
7
8
s·
8
g.;
11
11
13.~: ... ,~... :s.~
13'-
13
~1.L~
15
15
15
16 " .
].,0e"l·
i;.~; ,
~1
">~
.'·.·~......'.·'.,.l'.·..;,...'4
-'.'-.'.;.. '.~,..
,~
1< l~f::~~I
' ..',·.·...1.:.:.•·
;:~~
1'.'0-..1, ...
J:1,\i4,;;
·····"··..·:···'·:·"'·1.. -·······';·.:····..····j
"~~-.
:C~ll·~·;:.--<~~~"..~~e~
'"J'''''"1"<:::-
.,~l.,
;-1.~
'~:"..';$t'
"'-'-jl¥.
~'t~
'·",,~·n-I·,<~
.. t,'c'f
':·'."<1'Lc~;~~
'~~'~'Ii'".·,~,~~:,t
iO.\..f'
. J± .. 3. 7 Use of Super-Position inDeveloping Test Results
5. DISCUSSION OF RESULTS
5.1 Load Distribution Factors
5.2 Beam Deflections
5.3 Other Results
5.3.1 Effect of Midspan Diaphragms
5 .3. 2 Modulus. of Elasticity
6. RECOMMENDATIO~S
6:1 Load Distribution
6.2 Deflections
6.3 Ef.fe,ctive Slab Width
7 • ACKNq,WLEDGMENTS
8. TABLES
9. FIGURES
10 • REFERENCES
16
18
18
20
21·
21
22
23
23
·26
27
28
3.0
34
91.
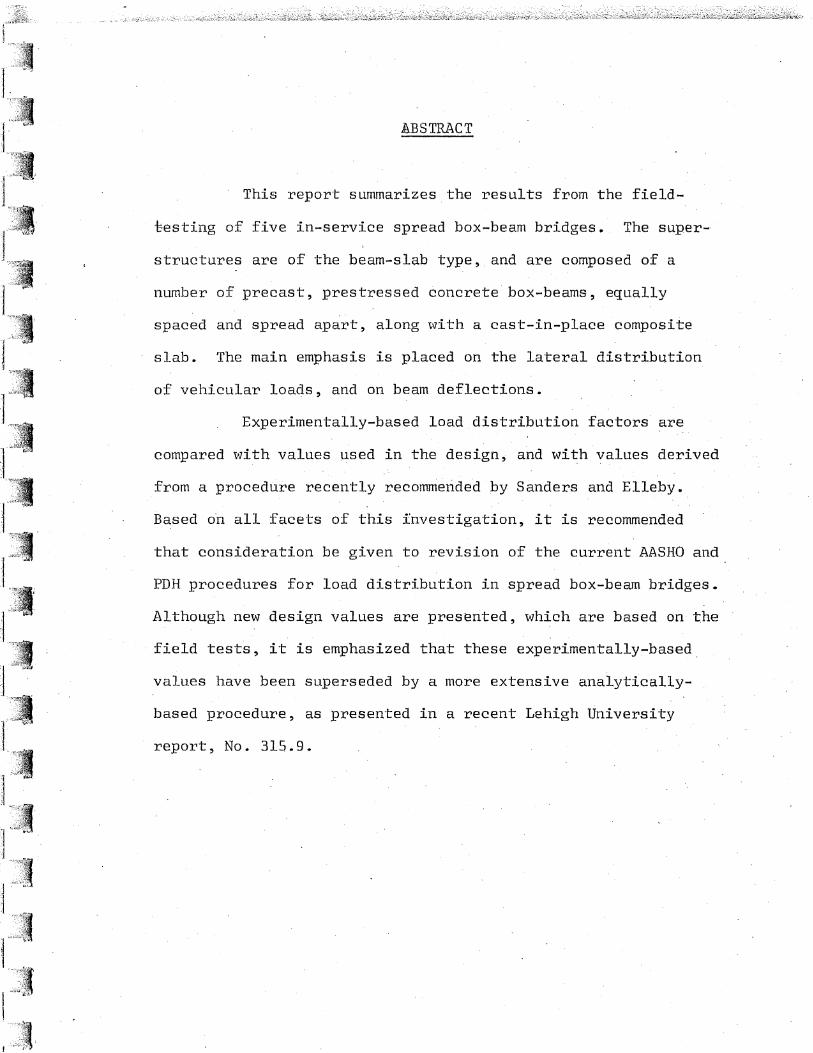
ABSTRACT
. This report summarizes the results from the field-
testing o-f five in-service spread box-beam bridges.. The sup.er--
structures are of the beam-slab type, and are composed of a
number of precast, prestressed concrete' box-beams, equally
spaced and spread apart, along with a cast-in-place composite
slab. The main emphasis is placed on the lateral distribution
of vehicular loa4s, and on beam deflections.
Experimentally-based load distribution factors are
compared with values used in the design, and with values derived
from a procedure recently recommended by Sanders and Elleby.
Based tin all facets of this investigation, it is recommended
that consideration be given to revision of the current AASHO and
PDH procedures for load distribution in spread box-beam bridges.
Although new design values are presented, which are based on the
field tests, it is emphasized that these experimentally-based.
values have been superseded by a more extensive analytically-
based procedure, as presented in a recent Lehigh University
report, No. 315 .. 9.

1.; INTRODUCTION
Since the early development of construction techniques
for fabrica-tion of prestressed concrete beams in the United States,
there have been a number of cross-sec"tional shapes which have been
utilized. One of -the shapes which has be~n used extens:Lvely, par-
(
ticularly in the Commonwealth of Pennsylvania, is the box shape.
In highway bridge construction, these box-shaped beams were first
. used in a superstructure design which consisted basically of beams
placed adjacent to one another, with longitudinal shear-keys to
assure lateral .interaction. The beams were then covered with ·an
asphalt roadway surface. Later, the adjacent configuration was
modified, by replacing the flexible sur"face material with a
cast-in-place reinforced concrete slab, constructed to act com
positely·with the beams. More recently, the box beams we~e in
corporated into a b~am-slab type superstructure design, with t~e
beams spread apart, as· in typical I-beam bridges.
To date, the spread box-beam bridges have been designed
for vehicular loads, in' accordance with standards which closely
parallel the procedure outlined in Section -1.3.1 of the AASHO
Specifications for-"Highway Bridges.1 However, in 1964,·a research
program was initiated at.Lehigh University (1) to develop experi-
"mental data which would yield the information on structural be
havior needed to evaluate the design.procedure, and (2) to develop
a mathematical analysis which would.accurately represent the
structural response to vehicular loads.

rn the period 1964-8, five in-service bridges in Penn-
gylvania were field tested in the investigation. The first bridger
at Drehersville, served as a pilot structure-. In addition to the
development of basic information on structural behavior, several
experimental techniques were evaluated. The second, third, and
fourth structures, located at Brookville, Berwick, and White Haven,
had nearly identical span lengths, beam spacings, and' general. cross
sectional dimensions. A comparison of the Brookville (450 skew)
and Berwic'k (900 skew) Bridges revealed the effects of skew, and a
comparison of the Berwick (beam size - 48u x 39 TT ) and the \qhite
Haven (beam.size - 36 Tf x 42 Tt) Bridges enable determination of the
effects of beam width on behavior characteristics. The fifth
bridge, near Philadelphia, ·was used to determine the effects of
midspan diaphragms. This bridge was constructed with diaphragms
in placeo After one series of tests had been completed, the
diaphragms were removed, and a second series was conducted. Six
2 a 6 6 7 11reports' , , " have been-developed to. describe the struc-
turaL behavior of the individual structures.
A theoretical analysis12
of the structural response
has been,co~pleted. The analysis, which is highly complex and
therefore not appropriate for direct use in design, has been
developed to utilize computer solu·tion techniques 0 The major
factors which influence the lateral distribution of loads have
been systematically varied in the program in developing usable
~2-
~expressions for distribution factors. These expressions represen~
a range of cross-sectional dimensions and beam sizes which are
typical of current design standards.
A separate investigation, devoted to a structural model ]
study of "the spread box-beam superst'ructures, was conduc·ted in the
period 1965-8. Model beam, slab, curb, and parapet sections were
prefabricated in Plexiglas units for the experimental investigation
of the effects of several parameters on the lateral distribution of
vehicular loads in the sp~ead box-beam bridges. Two repo'rt~,4 ~8
have been developed on this investigation.
; ,~
r-
This report has been developed (1) .to summarize the sig-
nificant findings which resulted from the field test phase of the
investigation, and (2) to recommend the consideration of revisions
in the currently used design procedures. A table of suggested
distribution factors is·preiented. To supplement" the'material and
recommendat,ions presented, a comparison of the experimentally-
based, proposed distribution factors is made with values developed
from expressions presented in the recently completed"~CHRP project10
report by Sanders and Elleby. At this point it·should be
I-I
emphasized that the suggested experimentally-based distribution
factors have now been superseded by the more extensive recommenda
tions included in Report No. 315.9.12
The material in this report is arranged in the following
order. The first two sections are devoted to general descriptions
:(1) of the cros~-section, individual structural elements, alld
'-3-
IIIII
I'W'
.~,c"""",:.:~,.",:"""~,;,."""",."",,,,'-;~~~' ,
~onstruction of the spread box-beam type superstructure, and
(2) of the experimental procedures used in the field tests. The
next section is devoted to a presentation of the major results
derived from the five field tests, followed by a section centered
on discussion of the results. F,inally, recommendations for design
are presented, based on the results from the field tests.
-4-

2. TEST STRUCTURES
2.1 General Description of Superstructure
The test structures were of general beam-slab, simple
span construction, utili~ing prestressed concrete box-beams as
the main longitudinal beams .. The general cross-section, along
with the main dimensions of the five test structures, is shown
in Fig. 1. In this type of con$tructi6n~ after piers and abut~ents
have been completed, the beams are set in place as the first major
step in tIle construction of the superstructure. Forms are then
erected for the slab, and for the end and midspan diaphragms be
tween the beams. The slab' and diaphragm concrete is then placed,
with a finished surface over the roadway portion of the bridge,
and a raked finish along the edge portion to provide a construction
joint between the slab and the curb sections. In addition to the
raked surface, the joint is strengthened by three No. 5 reinforcing
bars which extend vertically from the slab up into the curb section,
at a spacing not exceeding 15 inches. Two of these bars extend on
into the parapet section. The next step involves forming. and cast
ing the curb and parapet sections. The curb section is cdhstructed
continuously over the length of the slab, while·l/2-inch, open, de
flection joints are placed in the parapet section at intervals of
approximately.15 feet.
The box beams are pre-cast, prestressed concrete members~
A view of the cross-section is shown in Fig. 2. In Penn~ylvania,
two standard widths (wb), 36 and 48 ,inches, are used. The beams
-5-

are manufactured in a number of depths (hb
) , ranging from
~l inches to 48 inches, in 3-inch increments. For all members,
the wall thicknesses are 5 inches, the bottom flange thickness
I~ ,
is 5 inches, and' the top flange thic'kness is 3 inches. End
blocks are utilized in the anchorage zone regions as shown in
Fig. 2. In addition, an interior diaphragm, 10 inches in thick-
ness, is located at mid-length of the member.
There are three sets of reinforced Cbncrete diaphragms
cast-in-place between the beams in this type of superstructure.
All of the diaphragms are cast integrally with the slab.' The
first set is located at one end of the span, and consists of
is-inch thic'k sections which extend from the bo~ttom of' the sl'ab
to the; bottom surface of the beams. The second set is located a~t
the other end of the span, and consists of 12-inch thick sections
which extend downward 21 inches from the top of the slab. The
third set is located at midspan, and consists of lO-inch thick
sections which extend from the bottom of the slab to within
9 inches of the bottom surface of the beams.
The reinforced concrete slab is designed essentially as
a one-way slab, with main reinforcement in the· transverse di-
reci:ion. The transverse reinforcement consists .of upper and
lower layers of straight bars, with size and spacing bf bars
identical in both layers. In the longitudinal djrection, nomi-
nal reinforcement is placed in an, upper .layer which extends' a-
cross the entire width 'of the slab, and a lower layer which
-6-

extends across the clear .spans of the slab between beams.
The general design and construction details for bridges
of this type are given in Standards for Prestressed Concrete
Bridges .9
2.2 Design for Vehicular Loads
All of the test structures were designed essentially in
accordance with t~e AASHO ~tandard Specifications for Highway
Bridges, with some modifications a? set forth in the Standards for
Prestressed Concrete Bridgeso9 The design highway live loading
was HS20-44 in all cases, and the AAS~O impact formula was used.
The procedures for .distributing vehicular loads were generally in.
line with the provisions of Section 1.3.1 of the AASHO specifi
cations. See Fig. 3. All interior beams were designed utilizing
a distribution factor of S/5.5. All fascia beams were designed
by assuming simple support action between the exterior and first
interior beam, ~s shown in Fig. 3, with the center of the exterior
wheel load lo'cated 2 feet from the face of the curb.
-7-
3. EXPERIMENTAL PROCEDURE
3.1 CGnd~ct of Tests
The prime, overall obje6tive of the investigation was
to evaluate the lateral distribution of vehicular loads to the
longitudinal beams. In line with that objective, the general test
procedure consisted of driving a test vehicle ,over the te~t
structure in a set of prescribed lanes, measuring the response of
the bridge through use of SR-4 electrical strain gages, and record~
.ing the various responses through continuously recording equip~
ment. The main test vehicle used throughout the, investigation was
a three-axle vehicle, closely simulating the HS20-44 design vehicle.
See Fig. 4. With the, continuously recording equipment, the basic
static effect was evaluated by moving the test vehicle across the
structure at crawl speed (approxima·tely 2 mph). In addition, on
all structures, passes of the test vehicle were conducted at higher
speeds. Although one report~ was devoted to a description of the
effects of vehicular speed on the respons~ of the Drehersville
Bridge, the effects of moving l'oads are not included in this summa-
ry report. Reports on.structural respon~e as related to the speeds
of moving test vehicles on the Philadelphia, Berwick, and. White
Haven Bridges are being developed by the U. S. ,Bureau of Public
Roads.
3.2 Instrumentation
On all structures, the primary instrumentation consisted
-8-
I
-I

J
of strain gages mounted around the periphery of the longitudinal
beams at various cross~sections. In.additi~n, gages wer~ mounted
on the curb and parapet sections. Deflection gages were mounted
at a section near midspan. ,The remaining gages were used to measur~
slab strains ano diaphragm strains, and the pattern, for these latter
gages was varied from structure to structure. The longitudinal 10-
cations of the sections at which the primary beam, slab, curb~ and
parapet gages were located "are-shown in Fig. 5. For more detailed
information qil the particular gaging pattern for-each individual
structure, the reader is r"eferred to the individual reports. 2 ,5 ,6'-;7
3.3 Data Reduction
Detailed" information on data reduction is presented in
.
.'·.·..·'.·.·.1..·'~
'"'1
each of the individual reports. However~ it would be appropriate
to describe the general philosophy in the derivation of information
used to develop distribution factors. The gages were located on
the main beams in such a way that the longitudinal strain distri-
bution on each vertical face of the beam CQuld' be determined. ·With
these distributions, the internal bending. moment in the composite
section was determined, based on the assumption that axial force in
the memb~ers reslllting from the vehicular loads "t'Jas negligible.
Since the "moduli of elastici-ty for the beam, slab, curb, and para-
pet concretes were not known, only moment' coefficients were direct-
ly developed from the datao Then, the distribution of load to the
individual beams was determined by .dividing the moment coefficien~
for each beam by the sum of the moment coefficients for all"beams
-9-

at that cross-section~ These distribution coefficients formed the
basis for the influence lines presented in Figs. 6-29.
An average value for the modulus of elasticity of the
beam concrete in each bridge was derived by ,equating the total
vehicle moment produced across the gaged cross-section in the super-
structure, to the sum of the moment coefficients for the· individual
beams, multiplied by the modulus of elasticity of the beam concrete..
This computation was made for each crawl run of the test vehicle.
The average values for each bridge'",. developed from a number of· crawl
runs, are shown in the table· in Fig. S4 .....
The results from data obtained from other str~in and de-
flection gages were reported· individually in the separate reports.
-10-
]
·_"·%·:·'····1'·'.:·'··'·
',~)
I ::"~:.~.
·"'-'··'~I··:1,:.··.':':,?~,
,~-~~
4. RESULTS
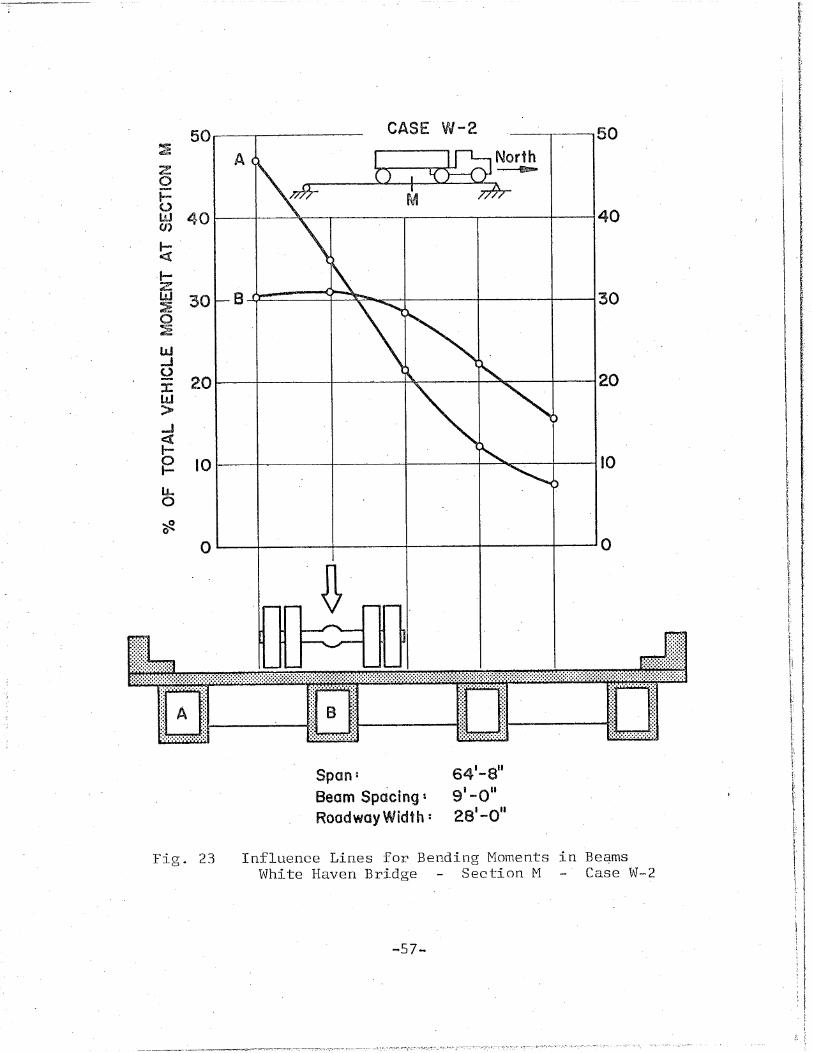
4.1 Load Distribution
Since the main objective of the investigation was to
evaluate the' distribution factors to the individual beams, and
to compare, the factors developed for the different test structures,
sets of influence lines were developed for the individual beams in '
each of the bridges. See Figs. 6-2g~ These influence lines reflect
the percentage of the total bending moment in each beam' at the gaged
cross-section, produced by the load vehicle at some specific lateral
and Longitudinal position on the test structure. The base line of
the diagram represents the lateral location of the center of" the
test vehicle on the bridge roadway, pictured below in each case."
The longitudinal location of the test vehicle is shown at the top
of the diagram .for each case.
To utilize these influence lines to develop experimental
distribution factors, two vehicles (for the Drehersville , Berwic'k,
and White Haven Bridges) and" three vehicles (for the Philadelphia
Brid&e) were placed on the roadway in accordance with the lane
provisions outlined in Section 1.2.6 of the AASHO specifications.
In this regard, the trucks were positioned in the defined lanes so
as to produce the maximum moment in the particular beam under con-
sideratioh.
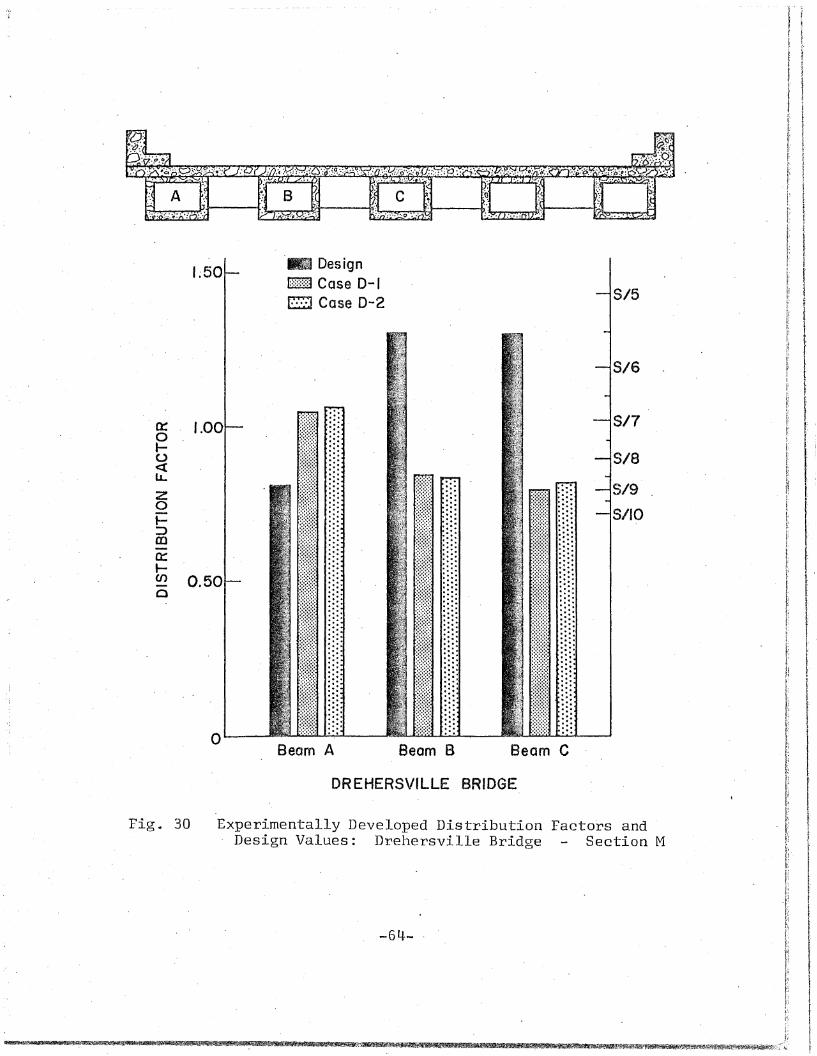
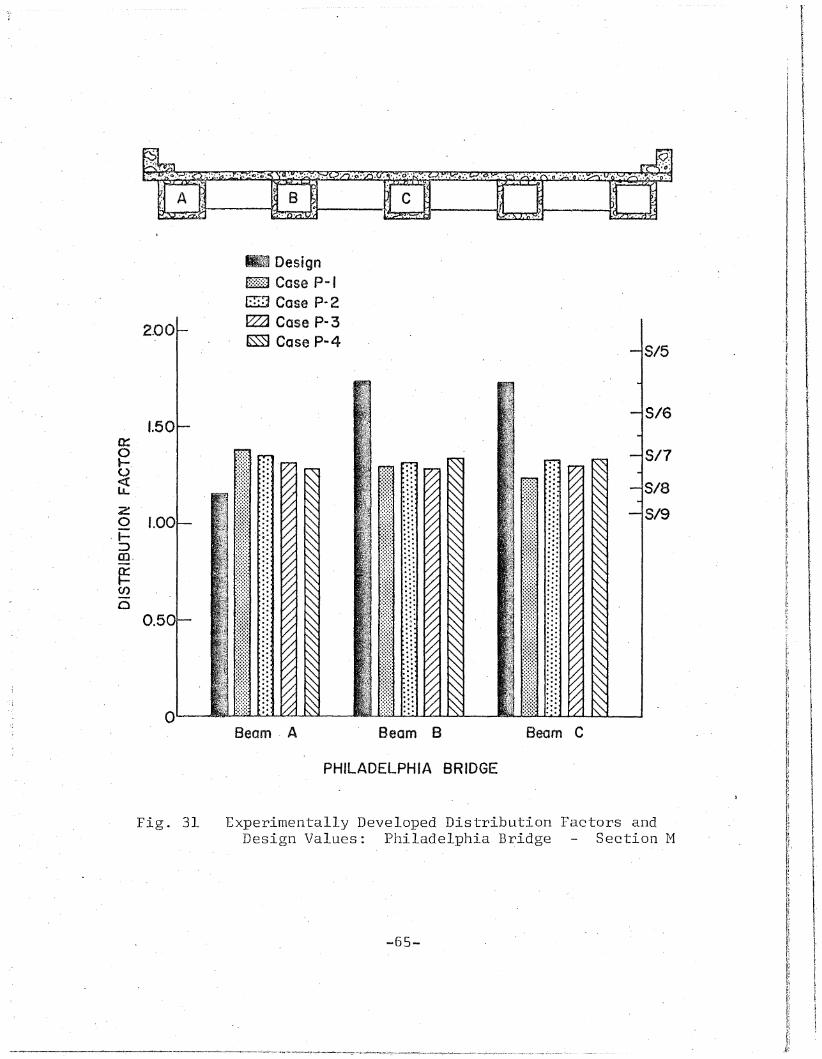
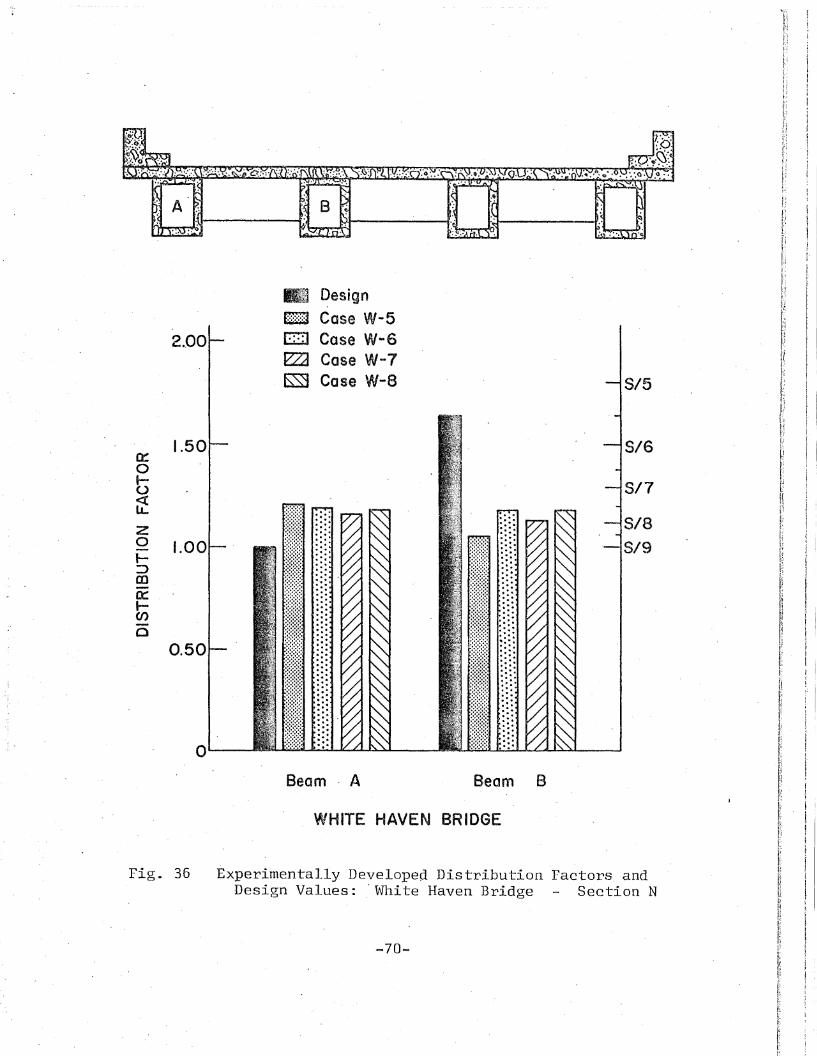
In Figs. 30-36, a comparison is made between the distri-
bution factors used, .in the design of the diffe,rent beams in the
four bridges, and, the experimentally developed distribution factors
-·11-
'-.·.·.·.'1····'··,··'.···
:. ~~
·.rt
';"'.·":."·I·,'.'·',K... '.,g..-.:...'.. ~~':""" ,
derived from th~ in~luence lines presented i~ Figs~ 6-29. 'For
instance, in Fig .. 30, the. experimentally developed distribution
factors from two di~ferent longitudinal locations of the test
vehicle are compared with the design values for each of the three
beams in the bridge. The experimental factors were developed from
the influence lines given in Figs. 6 and 7. Likew~se~ Fig .. 31
represents' a comparison of expe~imental and design. values of distri-
bution factors as derived from ·the influence lines given in Figs. 8
through 11. Similarly; the comparisons in figs. 32 through 34 are
based on influenoe lines presented in, Figs. 12 through 21, and the
. com~arisons giv~n in Figs. 35 and 36, a~e deri~~d from influence
lines p~~sented' in Fi~s. 22 through·29.: The development·.ofthe
experimental distribution factors given' in Figs. 30~36 is given in
Table 1.
To facilitate discussion later in. this report, a series
of figures. was prepared to illustrate the effects of slab thickness
(t) and the modular ratio between beam concre·te ma·terial and
cast-in-:-place concrete material (k), on. the moment of inertia (Ina)
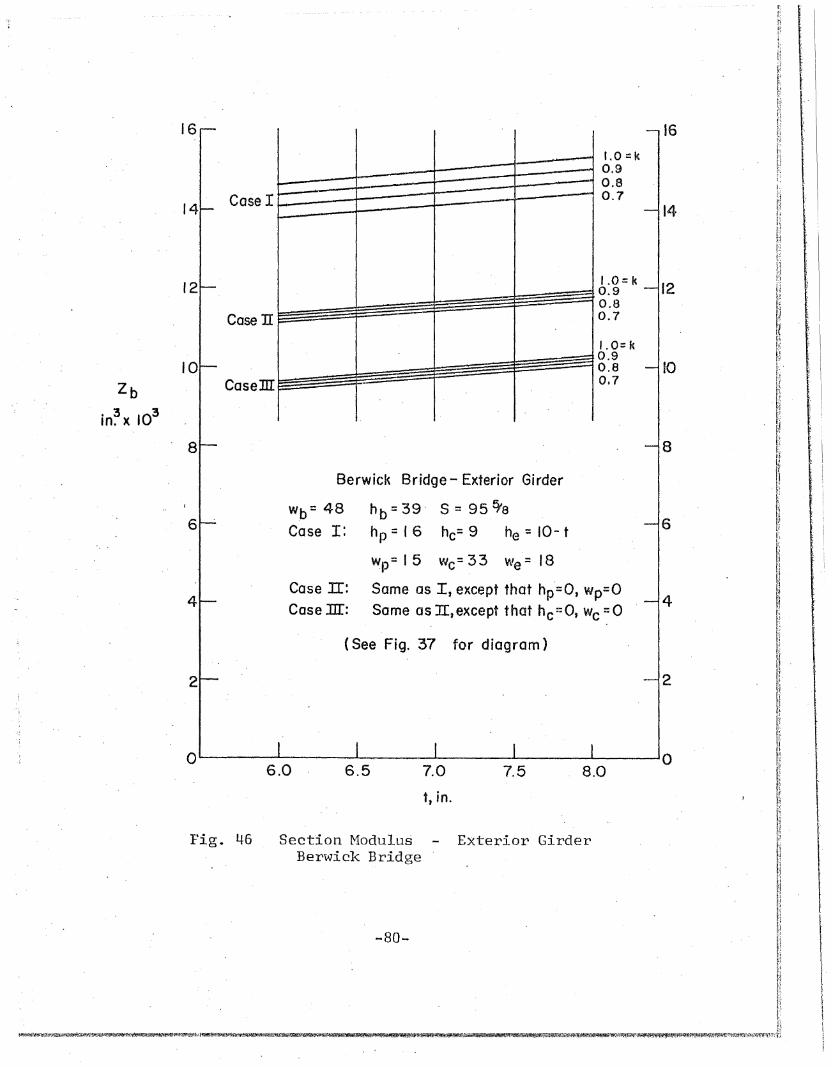
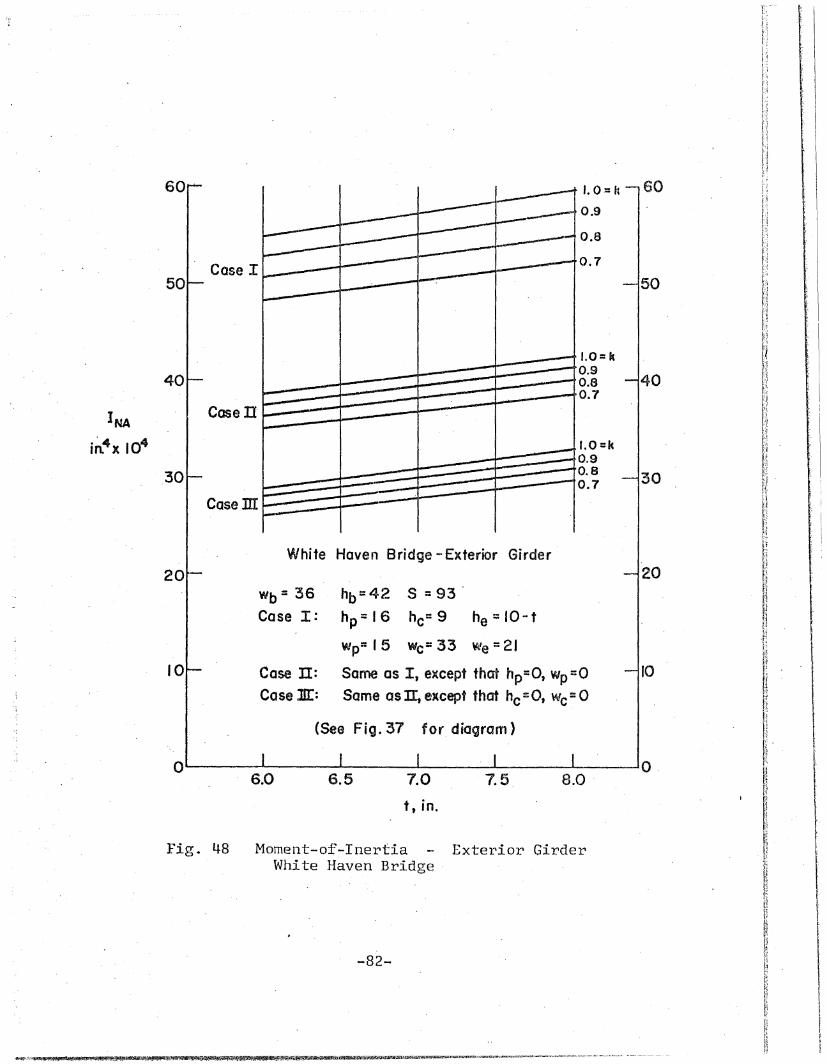
and the section modulus (Zb) of the exterior and interior beams.
The idealized composite cross-sections are shown in Fig. 37. In
Fig. 38, the variations in I and Zb are shown for an interiorna
girder in the Drehersville Bridge. Figs. 39 and ~O represent the
I and Zb' , respectively, for the exterior girder of the Drehersna
ville Bridge. Figs. 41-49 represent similar quantities in the
Philadelphia, Berwick, and White Haven Bridges~
--12-

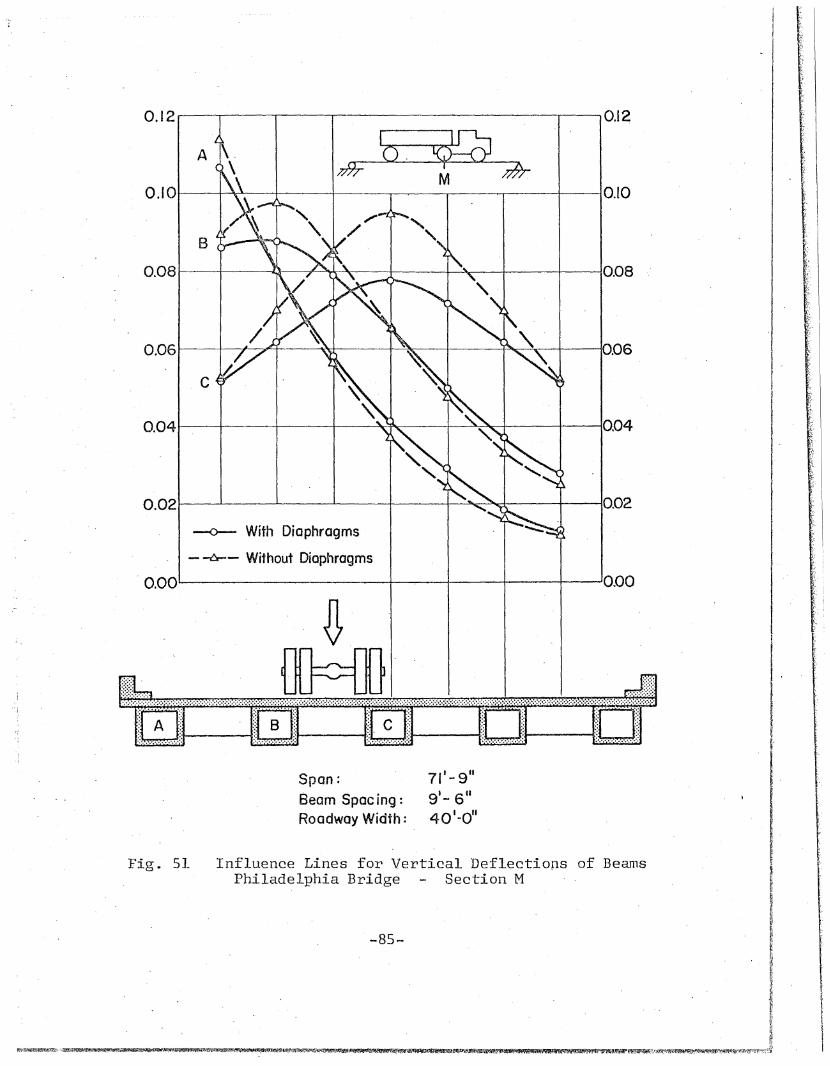
4.2 Beam Deflections
To enable an evaluation of the vertical deflection
characteristics of the individual beams for the four bridges, four
series of influence lines are developed in Figs. 50-53~ In these
figures, the ordina.te repre~ents' the vertical deflection of a par-
ticular beam, while t~e base, line represents the lateral location
of the test vehicle on the ~oadway. The longitudina~ location of
the test vehicle is shown in a diagram at the' top of each figure.
In each of the' four cases, the'influence lines' represent the effect
of the load vehicle positioned longitudirtally to produce maximum
moment in the test structure. The idealized'deflection of ~n en
tire bridge -cross-section' is 'shown in rig,.' 54"., In the ",table i"n.'
this figure, factors are listed which we~e used to compute an
idealized uniform deflection of all.beams "under the center axle
of the v~hicle, indicated"as 6 in this figure. A"comparison of
-these computed uniform v~lueswith actual beam d"eflectiollrS can be
m~de in Figs. 55-and 56. In these figures, beam deflectian profiles
are shown, as d~veloped from the influence lines for vertical de- .
flection presented in Figs,; 50-53. The idealized values presented
in Fig. 54 are found to be closely related to the aver~ge de-
flection of the beams as shown in Figs. 55-and 56.
4.3 Other Results
4.3.1" Effect of Midspan Diaphragms
Although a complete report' is devoted to the effect of
-13-
midspan rliaphragms on lateral load distribution in one of the test
bridges, it would be appropriate to mention the significant find
ings. First of all, it can be seen from Fig. 31 that there was
very little variation in ~aximGm moment produced in the individual
beams at the maximum moment section. The results shown were de
veloped both with midspan diaphragms in place, and with midspan
diaphragms removed. Therefore, since load distribution factors
usea in design represent the combined effects of'~everal vehicles,
the midspan diaphragms have very little effect on the design
factors. However, it should be emphasiz€9 that even though there
was very little difference in the combined effects, there was a
definite difference in the response of the bridge to a single load
vehicle. For instance, for a test vehicle located directly over
th~ center beam, the center beam developed 32.5 percent of the
total moment,~ith diaphragms removed. On the other hand, under
the- same load condition, the center beam carried 27.5 percent of
the total momen4 with diaphragms in place. Another comparison of,
the effects of the midspan diaphragm can be made in Fig. 55 1 ' which
il1ust~ates the deflection profile at the maximum moment section
under a particular loading condition, both with diaphragms in place
and with diaphragms removed. For a more complete comparison, the
reader is referred to .the individual -report. 7
4.3.2 Effect,of:8kew
The fifth bridge 'tested in this investigation was a 45°
skew bridge having cross-sectional characteristics nearly identical
-14-
to those of the Berwick Bridge. A separate report11 was devoted
to describing the behavior of this particular bridge. Although
no further information on the results from the ,test of the skew
. bridge is presented in this report, it would be appropriate to .
mention the significant conclusions. It was found that beam moments
measured in the center region of the skew bridge were consistently
less than those measured at the maximum moment ,section in the
".::",.:.-.,•
Berwick Bridge. ~,Likewise, beam deflections m~asured along the
skew at midspan were "similarly less t~a~ values measured in the
Berwick Bridge. Further comparisons and additional information
are given in the individual report.
4.3.3 Modulus of Elasticity
As mentioned in Section 343, the effective modulus of
elasticity of the peam concrete was computed based on data col-
lect~d from ea6h crawl run of·the test'vehicle on each.of the test
bridges 4 These individually c~mputed values are reported in the
separate reports .. Average values are,given in Fig4 54.
4.3".4 Effective Slab Widths
In t~e procedure for computing internal beam moments,
determinations were made of effective 'slab widths. Each of the
indiviual reports contains information on transformed effective
slab widths at the gaged cro~s-sections.
4.3.5 Behavior of Midspan Diaphragms
"
Although no detailed analy~is was made of midspan diaphragm
--15-
Jl
behavior~ several strain gages were used to measure concrete
surface strains on the diaphragms in both the Berwick and White
Haven Bridges.
4.3.6 Effect of Deflection Joints
To evaluate the effect of the parapet deflection joints
on the load distribution at a particular cross-section, both the
Berwick and White Haven Bridges' were gaged at a cross-seqtion
which,p~ssed through one of the joints. Moment and distribution
coefficients were developed for these sections~ and compared with
,similar values obtained at the section of the maximum moment in
each case.' The comparisons can b,e, made in the influence lines
presented in Figs'., 12-17 and Figs.' 22-29, and 'in the experimentally
develop~d distribution factors presented in Figs. 32, 33, 35 and 36.
Ip'the latter comparison, it is apparent that'the parapet deflection
joints have little effect on the distribution factors.
4.3.7 Use of Super-Position in Developing Test Results
In the te~t-of the D~~hersville Bridge, two concepts were
used to check the accuracy of using the principle of super-position
in combining the results obtained from single vehicle runs to re
flect the effects of more- than one vehicle on the structure. First
of all, al~ fivebeam$ were gaged at one cross-sectio~ of the super~
,_structure. A-single truck' was then'driven across the structure in
each of seven prescribed lanes. Computations of moment and distri
,bution coefficients w~re made directly, baied on data from all gages.
-16-
Comparisons were then made utilizing data from only three of the
five beams, and using the principle of super~position~
In a second check, two load vehicles were used. Each
was driven across the test structure separately, and the computed
combined effects were compared with those developed in running the
two trucks across the span simultaneously. In general, the re
sults from both methods indicated a very favorable comparison.
For· more detailed information, the reader i 9 referred to the indi
vidual report. 2
!
-17-
5. DISCUSSION OF RESULTS
·5.1 Load Distribution Factors
Based on the compar'isons of experimentally developed
distribution factors with the calculated design values, as illus-
trated in Figs. 3~-36, a general behavior characteri~tic is very
apparent. Specifically, in all of the test structures, the ex-
. perimental value$ for all interior girders are significantly
less than design values. Corr~spondingly,. the experimental values
for all exterior 'girders are somewhat larger than design values.
This ~ehavior clearly ~mphasizes the fact that the curb and para
,.pet sections definitely and significantly ~ontribute to the longi-
tudinal flexural stiffness of the bridge superstructure.
The strain measurements on the curb and parapet sections,
when aligned with those on the slab and extebl0r beam, consistently
indicate a full composite behavior between the exterior beam, slab,
and curb sections. In addition; the full composite. behavior ex-
tended to the top of the parapet section in three of the bridges.
In the fo~rth bridge,- although the straight line behavior did not
extend through the parapet, there was partial participation.' The
full participation of' the curb section was not unexpected, prima-
rily because the curb is continuous over the entire length of the
st~ucture, and because the construction joint was sufficient to
provide complete composite action at the curb-slab interface.
However, .the participation of the parapet sections was not as con-
sistent, mainly due to the incidence of the discontinuities provided
-18-

by the deflection joints.
With the additional stiffness resulting from th~ inter
action of the curb and parapet sections wi th the' slab, the exterior
girder consistently carries more load than-is computed in the de
sign method. With the increase in load carried by the exterior
girders, the interior girders then carry less of the total load,
and· the maximum magnitudes are considerably'less than the design
lo~d values. This curb-parapet effect was particularly sign~fi
cant in the three 2~lane bridges (Drehersville, Berwic'k 1 and White
Haven). In the 3-1ane bridge (Philadelphia) the effect was ~light
ly r.educed, which· is not' surprising ~ since the· sizes of the curb
and parapet -sections were ,the same in' all test structures.· There'
fore, with ,the greater width of the Philadelphia Bridge, the
. contribution of- curb and parapet sections to -total superstructure
-stiffness was less than the contributions in the thr~e narrower
2-1ane bridges. It is obvious that the contribution would continue
to diminish with increasing roadway width.
At this point, it is appropriate to point out that al
though the experimental resul'ts indicated maximum loads greater
than.design values for exte~ior beams, the exterior beams were
definitely not overstressed. Th~ participation of the ·curb and
parapet sections se~ved to increase the flexural stiffness to the
extent that the maximum flexural stresses produced in the exterior
girders were proportionately reduced, generally to a level approxi
mately·equal to, or below, the-maximum values produced in the in
teri6~ girders.
-19-

5,.-2 Beam Deflections
In comparing measured deflections with the computed
values, which were based.on the idealized assumption that the
deflection.is the same for all beams, se~eral point? should be
no·ted. First of all, the computed values given in Fig. 54 are(
based on values of E measured ~n the load distribution phase of
the study, and on a moment of inertia for the entire cross-section
of the supers~ructure. For thes~ computations, (1) the moment of
inertia was taken as the sum of the individual values for each of
the interior and exterior beams, (2) a modular ratio of 0.7 was
used for all bridges, and (3) the curb arid parapet sections were
asswned to be fully effective. For -the Drehersville and Whi'te
Haven Bridges, the computed values closely approximate the aver-
age deflection of the beams, as indicated in Figs. 55 and,56.,
For the Berwic'k Bridge, the computed value is slightly less than
the average deflection measured ,experimentally while in the Phila-
delphia Bridge, ,the computed value is slightly greater than the
measured average. It is certain that th~ parapet was not fully
effective QV e.r--. the.. entir~e."le.llg-th .of.-the s.tructures ... If thi,s
factor could be taken into acc.ount, al,l computed values would be
slightLy ~,g.reate.rthan the· values. indicated, in. Eig. 54. '. However, .
.if the compu,ted _values had been based on (1) values of E computed
as a funct~on of £1 in currently used expressions, and (2) valuesc
of' I based on the assumption that, the c.urb and .parapet sec-tions
,contribute .no~thing to the stiffness, the computed values would have
-20-

i···~·.·····'~
~
II
been significantly greater than the measured values. These com-
parisons further sub~tantiat~ the participation of the curb and
parapet in increasing the longitudinal stiffn~ss of the super-
structure, and in addition, confirm that the modulus of elasticity
of the beam concrete is definitely greater than values of E based
on the 28-day fT assumed in design.c
5.3· Other Results
5.3.1 Effect of Midspan Diaphragms
The intended function of the midspan diaphragms is to
distribute the vehicular loads more uniformly than 'if the dia-. .
phragms were not ~sed·. In the Philadelphia Bridge, this effect
was quantitatively evaluated. For a single vehicle on the
structure, there was a distinct difference in distribution of the
load to the individual beams. However, the maximum load conditions
for each of the girders ~lways i~olved the consideration of vehi-
cles in all load lanes. There~ore, the combined effects used to
develop the distribution factors resulted in nearly identical
values, either with.diaphragms in place or removed. This behavior
is n~t 'surprising, since the superst~ucture tends to exhibit· prima-
rily ·simple beam behavior with all lanes loaded. Therefore, it is
felt that th'e diaphragms really serve no purpose when the super-
structure is supjected to. design load conditions. On the other
hand, since· the midspan diaphragms do serve to more evenly ·distri-
bute the effects of a single vehicle, the effect of these diaphragms
-21-
~~d"~1itL~j~~~!'M~-:':'~{,·>s:...; ::G"""TI2~~:!~:~ji:..;.::i::5"~~~7£':'"..:.-::·~~~~~:~~V:1:;:;<".....:;:..·.:.::.':~:-~~~.:.t~- .....:.:.£;:.~/..-...:.:.... ......,~y.~.~~~.:.o.p;;...:_...,o:or.::r:::--=-:_. -: .. -:r......... . .....:.-=:•..,~..L.<.......- •..:...~ •• ..........~~~ _.~- _ •• - - _. _ ... - ....
;
would be far more significant in considering the effects produced
when a heavier-than-design vehicle is moved across the structure.
5.3.2 Modulus of Elasticity
It is felt that the E values, calculated as described
"earlier in Section 3.3, are definitely realistic, even though they
are greater than those normal~y used in design. This is not meant
to imply that empirical expressions for E, expressed as a function
of fT, do not yield reasonable values. Instead, it is felt thatc
the primary difference lies in the value of f~ uped in the calcu-
lation of E. That" is, the value" of- f"T after the superstructure isc
" in use is usually "significantly greater than the 28-day value used
in design. In fact, it is 'very common for beam concrete to reach
the specified 28-day value at, or "shortly after, release o~ the
pre-tensioning elements.
-22-

6. RECOMMENDATIONS, .
6.1 'Load Distribution
In initiating a discussion of recommendations relative
to vel1icular load distribution, it would be appropriate to note
that during the process of sponsors' review of this report, an
analytical 'procedure was completed and published as Report
1.2No. 315 .. 9 ,. I'n the development of the analysis, emphasis was
placed on correlation of results with the actual ,behavior of
field test structures. Based on all facets of the overall'
investigation, it is recommended that consideration' be given
to revision of the procedure for load distribution. Specific
recommendations are given in Report No. 315.9. Therefore, it
should be not~d that these recommendations s~persede the
recommended distribution factors listed in Table 2 on page 33
of this report, set forth for preliminary consideration prior
to the completion of Report N"o.· 315. g.
At this point it would be appro~riate to briefly
describe a recently distributed report by w. W.'S~ders, Jr. and
10H. A. Elleby. This is a final report entitled Distribution.of
Wheel Loads on Highway Bridges, resulting from a study ~ponsored
as a.part of the National Cooperative Highway Research,Program~
In this report, significant changes are suggested for determining
vehicular load "distribution factors to be utilized in design, to
-23-

First of all, it is suggested that for all beams, both interior
repla,ce the current Section 1.3.1 in the AASHO Specifica,tions.
and exteribr, the same distribution factor would be used for a
(3)
(2)
(1)s
== :B
L 2N C 2D ::: 5 + 10 + (3 7L) (1 3) £or C<3
D'= 5NL for C>3+ 10
Distribution Factor
specific bridge, namely:
where·D is expressed as:
In the above expressions,
S = average beam spacing, ft.
NL ·= total number of design traffic lanes
C = a.stiffness parameter which depends uponthe type of bridge, bridge and beam geometry,and material properties
For prelimina~y designs, C may be approximated as:
c K ':!- L (4)
. where
K = 1.8 for spread box-beams
W = overall ~.width D.f .br.idge' superstructure, ft.
,L ,=~span length, ft ..
-24-

Sanders and Elleby were developed from an analysis which does not
veloped from the proposed method, Table 3 has been prepared to
indicate the values for D as calculated from the proposed ~heory.
It ahould be noted (~ that the expressions' prop~~ed by
(5)
t b = thickness of bottom flange, in.
LAs an indication of the D factors which would be de-
L WC = 1 .. 2 L
where L
.Ib moment of inertia of the beam, .. 4= l.n.
b = external width of beam, in.
h =: external height of beam, in.
t = vertical wall thickness, in.w
- 1t = 2 (tt + t
b) , in ..
tt = thic'kness of top flange, in.
there ,is little variation in the values of D computed for the
include. the effects of curb and parapet sections, and (2) that
~ more exact expression for C is· given as
different bridges. It can also be seen that the D values are
slightly less than the values listed in Table 2. This would be
expected since the factors listed in Table 2 reflect behavior
resulting from complete interaction of the curb and partial
interaction of the parapet with the beam-slab system.~
.:;25-
,~--_.--... -.-.--..~----_:_---

Based on the consistently observed behavior of the field(
test structures, it is recommended that the construction joint
between the curb and the slab be revised to further insrire com-
posite interaction between the slab and exterior beam. Under the
present constructibn procedure, this interaction consistently
occurs. Even though it is also apparent that the parapet section
is at least partially effective, it 'is felt that it would be con-
servative and appropriate to ignore this participation in' design
calculations.
6.2 - Deflections
In the computation of deflections for design,purposes,
it .,is recommended tl1at consideration be given to the inclusion. of
the curb ,and parapet. sections as included in the computation of
idealized bridge deflections presented ~n Fig. 54. It is felt·
that the principle included in these computations will result in
a·more accur~te prediction of the deflection of the bridge in
service. If there is a possibility that curb and par~pet sections
would be removed at a later time to provide for the widening of
the structure or £or some other purpose, the d~flection of the
TTstripped downu superstructure can easily be calculated by
revising the I values computed for the exterior girders.. , na
In addition, it is also recommended that typical cylin-
der strength data be used to develop information on beam concrete
strengths to evaluate typicaL strengths during the usable life of
~26-

:hhe structure •. Use of the higher strengtns to. predict the
effective E values will also result in a·more accurate com-
putation of deflection.
6.3 -Effective Slab Width
Based on tIle mult,itude of computations of effective
slab widtl1 in ,the many ·determinations used to det.ermine distri-
bution factors, it is felt that the effective 'slab width may be
accurately assumed equal .to the center-to~center spacing of the
beams. For the typic~l dimensions found in the beam slab
structures of the spread box beam type, the effective slab·width,..' . . , 1
,c~ite~ia set forth in Section 1~7.99of the AASHO Spebifications
indicate that the center-to-center spacing would typically be
the governing factor in assuming an effective flange width for
design purposes.
,~27-

7. ACKNOWLEDGMENTS
This study was conducted in the Department of Civil
Engineering at Fritz, Engineeririg Laboratory, under the auspices
of the Lehigh University Institute of Research, as part of a re
search investigation sponsored by the Pennsylvania Department of
Highways; the U. S. Department of Transpol'ltation, Federal IIighway
Administration, Bureau of Public Roads; and the Reinforced Concrete
Research Council.
The field test equipment was made available through
Mr. C. F. Scheffey, Chief, Structures and Applied Mechanics Di
vision,. 9ffice 'of. Research and Development, Bureau of Public, Roads.
The instrumentation and operati"on, ,of the test equipment was managed
primarily by Mr. 'Robert F. Varney, assisted by Mr. Harry Laatz, both
from the BUI'eau of Public Roads.
The basic research planning and administrative coordi
nation 'in this investigation were in cooperation with the following
individuals' representing the Pennsylvania Department of Highways:
Mr. 'K. H. Jensen, formerly Bridge Engineer, Mr. B. F. Kotali'k,
Bridge Engineer, and Mr. H. P. Koretzky, Engineer in Charge of Pre
stressed Concrete Structures, all from the Bridge Engineering Di
vision; and Mr. Leo D. Sandvig~ Director, Mr. Wade L. Gramling, Re
search Engineer, and Mr. 'Foster C. San'key, Research Coordinator,
all, from the Bureau of Materials, Testing, and Research.
The following Lehigh Universi ty graduate stude.nts made
major contributions in the conduct of the field tests, reduction
-28--

and processing of data, and development of the individual" reports:
Albert A. Guilford, Walter J. Douglas~ Thomas Sbhaffer, and
Cheng-shung Lin.
-29-
I

· '8. TABLES
-30-

Table 1 Development of Experimental Distribution Factors
Values from Influence Lines Distribution
Load Lane Factors
Total Experi-Bridge l Beam Case Left Center Right ~L+C+R mental Design
Drehersville A D-l " 40.0 ...... ~...., ....... 12.4 52.4 1.05 0.81D-2 40.8 ... --- -- ... 11.4 52.2 1.04
B D-l 28.5 ............. ......., 14.0 '42.5 0.85 1.30D-2 28.6 .................. iIIIIIIII 13.7 42.3 0.85
C D-l 20.0 ................ -- 20.0 40.0 0.80 1.30D-2 20.5 ................... 20.5 41.0 0.82
PhiladelpI:-ia A P-l 46.0 17.1 6 ...2 69 0 3 1.39 1.16P-2 47.6 14.6 5.8 68.0 1.36P-3 43.0 16.4 6.4- 65.8 1.32
~ I ·P-4 44.6 14.2 5.7 64.5 1.29c,/'- , ,..,
I':f~ j~~ B P-l- 31.5' 23.4- 10.0 64. 9 1.30 1.73
P-2 34.1 24.0 7.9 66.0 1.32P-3 32.1 22.7 9.8 64.6 1.29p-y. 35.0 24.1 8.0 67.1 1.34
C P-l 17a2 27.5 17.2 61.9 1.24 1.73P-2 16.9 32.6 16.9 66 .. 4 1.33P-3 17.8 29.4- 17.8 65.0 1.30P-4 17.5 32~1 17.5 67.1 1.34
Berwic'k A B-1 43.8 ...... .",....".IIIIIIII! 1.4.3 58.1 1.16 1.05B-2 41.8 .15.8 57.6 1.15B-3 42.6 ~~~ ... 13.1 55.7 1.11B-4 43.9 - ...... ~ ... 11.6 55.5 1.11B-S 41.8 .................. 14.4 ·56.2 la12B-,6" 46.7 .................... ,... 14.0 60.7 1.21B-7 38.5 ................. ~ 15.1 53.6 1.07B-3 41.8 ....... ~.-: 13.1 54.9 1.10B-9 . 45.1 ...................... lO~4 55 0 5 1.11B-IO 4-0 .. 9 ....................... 13.0 53.9 1.08
B B-1 31.5 ...... ~1IIIIr,,;a ..... 20.1 51.6 1.03 1.60B-2 33.3 ............. --.~ 18.7 52.0 1.04B-3 35.2 --- ..... 20.5 55.7 1.11B-4 40.3 ...... ~.-.. ....... 19.6 59.9 1.20B-S 31.1 ~-- ......... 22.1 53.2 1.06B-6 32.7 ........................ 18.2 50.9 1.02B-7 3-1.7 ..... --... ......... 21.5 53.2 1.06B-8· 34.6 ........... ~ .... 21.0 55.6 1.11B-9 40.9 ~"""lIIIIIIIIJiIIooIiIIIII 19.8 60.7 1.21B-IO 33.6 ...-. ................ 21.4 55.0 1.10
-31-

Table 1 (continued)
Values from Influence Lines~ Distribution
Load Lane Factors
Total Experi-Bridge Beam Case Left Center Right EL+C+R mental Design
White Haven A W-l 48 .. 3 .............. iIIIIIIIIIIt 10.3 58.6 1.17 1.00W-2 46.8 ~ .................... 11.4 58.2 1.16W-3 48.0 .... __ 11III-. ...... 12.1 60.1 1.20W-4 4-5.3 ................ iIIIIIIIIIII 14.1 59.4 1.19w-s 49.3 ............. ...".,.. ....... 11.5 60.8 1.22W~6 49.8 .................. ~ 9.5 59.3 1.19W-7 47.6 ..... ~ ........ IIIIIIIIIII 10.2 57.8 1.16W-8 49.4- ...................... 9.5 58.9 1.18
B W-l 35.4 ... --~ ........... 20.0 55.4- 1.11 1.64W-2 31.0 .-._IIiIIIIIII- ..... 21.3 52.3 1.05W-3 36.8 .... ~ ........ 20.4 57.2 1.14-W-4 30.3 ...................... 22.0 52.3 1.05W-5 33.5 ...... :llMBiIIfIIIoIIlIIIIIIII 19.0 52 .. 5 1.05W-6 41.8 .............. .-.. 17.2 59.0 1.18W-7 36.3 ,.................... 20.1 56.4- 1.13W-8 40.4- ............... ..". 18.8 59.2 1.18
-;32-

'fable 2 Recommended Distributiol1. Factors
- .
Distribution Factor
4-beam 5 beam
Exterior Interior Exterior Il1.terior
2-1ane 8/6.5 8/6.5 8/6.0 8/7.5
3-1ane ............................ ..... ........................... 8/6.0 8/6.5
Table 3 Values of D (Sanders-Elleby)
BridgeN. W L D D
L ft'. f~t • (Eqs. 2,4) (Eqs. 2 ~S)
Drehersville 2 35.5 61.5 6.35 6.65
Philadelphia' 3 45.5 71.8 6.29 6.40
Berwicl< 2 33.5 65.2 6 .. 49 6.66
White Haven .2 33.5 64.7 6 .. 49 ' 6.50
-33-

'. g. "FIGURES
--34-

...:::::::::::Jii
······..····r:·········· s ········=r=··· s ~=........ s . . =1"":... s.·· ~ .
IUJLnI
Roadway Beam Beam No. of BeamBridge Skew Width Size
SpacingBeams Span(W) (S)
Drehersville 90° 30 1-0" 41 x 3311 7 1 -211 5 61 1 -6 11
(S-425IA)
Berwick 90° 281 -0" 41 x39" 8'-93/s11 4 651-311
S-5357A)
White Haven 82° 28'-0:1 31x42u gl_O" 4 641
_ 8 11
(S-5767A)
Brookville 45° 28'-0" 41.x 36
11 S'-IO" 4 641-IO~n(S-4737A)
Philadelphia 87° 401-0" 4' x 4211 9'_6115 71'_911
(S-6624A)
Fig. 1 Cross-sectional Dimensions of Test Structures
~,,",,-~."- ......~.. ---_....., _._...,..--......,...,,-~-_.--.:-"'--j<O~~~'~~'~--r<.~J;~.y~.4~~~~~~~~~~~~~~~~~~"";~~':~~fftl*~1.~t~n}'ll!>~~l1~':J:"~~'~,~~If't~r.~!~~~:it:AA~»i"t~<';~';'·~!~!('i.:,,0't~~,',!i~yl:~I<~i..,..~"_f!fi

End Block21-0" Minimum
'-3" Chamfer
TYPICAL CROSS -SECTION
---j riO" Diaphragm
r-------.r-------.,I I I ' IL ~-__..J L ~__ -_-.J
LJ"'_IIi-' B_as_ic_c_r_o_ss_-_s_e_c_t_io_n ---.,__WEnd Block
21-0" Minimum
TYPICAL PLAN
Fig. 2 General Description of Prest.ressed Concrete Be~ms
-36-

~ s· ~._ S _1..5 _~ S _I.. Distribution Factor = ~
For Spread Box Beam Design, K Taken as 5.5
tNT.ERIOR BEAM
Assumed Hinge
R:: Load Transmitted to Exterior Beam
R
"EXTERIOR BEAM
Fig. 3 Distribution of Vehicular Loads Assumed "in Designof Spread Box-Beam Superstructures
-37-

t .8k
--~-
t32k
t32kAxle Loads:
r---------Il_...... - - - '-'-----..---w--.l~----.I/..-... 0'-)I... 30' (max.) 1__ 14' (min.>
~
H'g 20- 44 Design Load Vehicle
20.4- --1- 13.0· -I~
~i5.0[:7.5.1 j6:6'~
.~
t t32k 10k
o.~~-~........---~
---~
7.21 4.9[:-------~
tAxle Loads: 32 k
TEST VEHICLE
Fig. 4 Characteristics ot Design and Test Vehicles
-38-

SectionM
~II Deflection Joints (to top of curb)
3.55'
I
I<t.. Section
M
3.55'
Se,etlanL M
3.55' 3.00'
ft.'Section
M
3.55'
L/2 = 30.75'
DREHERSVI LLE
L/2 =35.88'
PHILADELPHIA
SectionN
9.76'L/2 = 32.62'
BERWICK
SectionN
L/2:: 32..381
WHITE HAVEN
-1
- Fig. 5 Locations of Instrumented Cross-sections.
-39-
A
c
'II!iI
'. B
CASE 0-150 r----1r----..,.---~- ---,.---.. 50
,.,..-·1--""""0_·_~~+ h ~
3 0 r----r-----------t~--+---_t__-__+----....__+__--_4___1 30
-:Ezole.>w 40 t--~r----t---+----,-----r-----.-----+----140en
ti......ZIJJ:Eo:aElJJ-I()
:I:IJJ>..J<tbl-
LLo
O---t-----+-----+-------I-----+------+---~---'O
:::0..· ···· .. ··::: ::0···············::
,..----II!L ..;II..----+II:.. J-.......-..............................
Span: 61 1- 6 11
Beam Spacing: . 7 1- 2!'
Roadway Width s 30'-0"
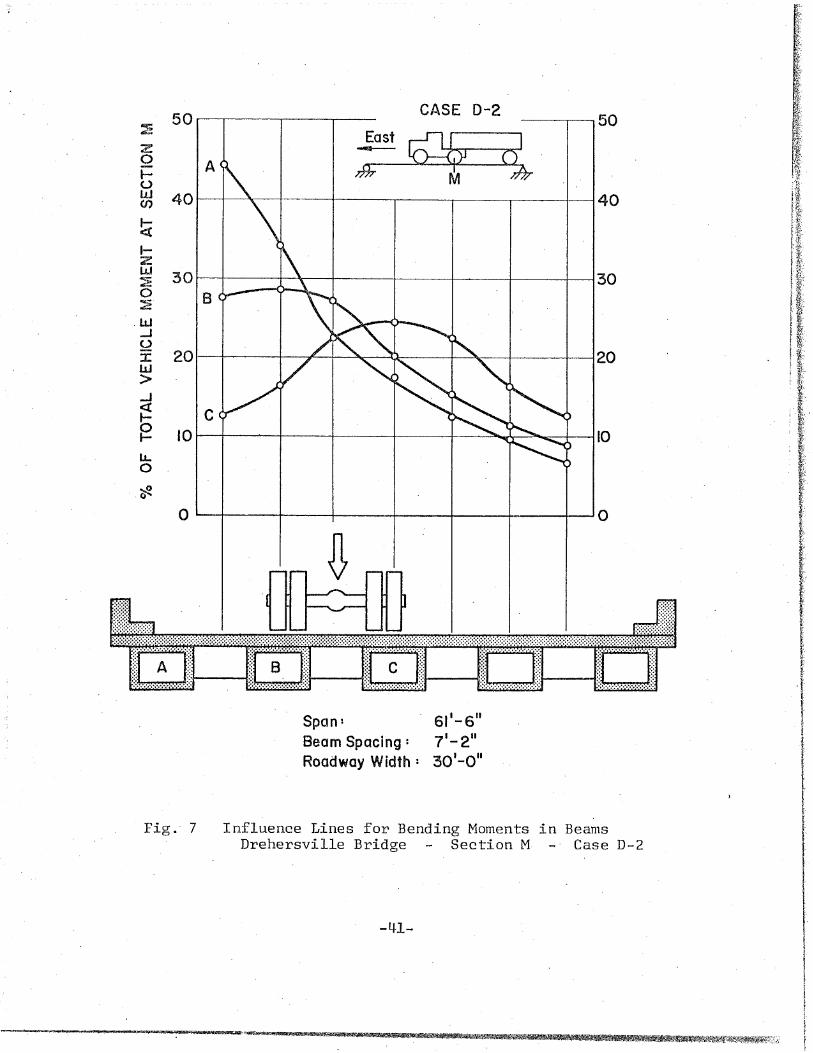
Fig. 6 Influence Lines for Bending Moments ~n BeamsDrehersville Bridge - Section M - Case D-l
-40-
50 CASE p-t 50~
S ~Ez A0
7PT~ M +uw 40 4·0(J)
~-I-Zw 30 30:E B0:Ew..J(,)
J: 20 20LtJ>..J C<Cf0-g 10 10IJ..0
~0
o ~--*+---","+-...--t---+-------t-----+----+--- 0
fA'! fli!!! if71i; !D!'~~~ft-----I:J~~~B----4:~:"'----'i!: , ;J---~:~~~:j
Span:Beam"Spacing:Roadway Width:
71 '-9"9'-611
40'-0"
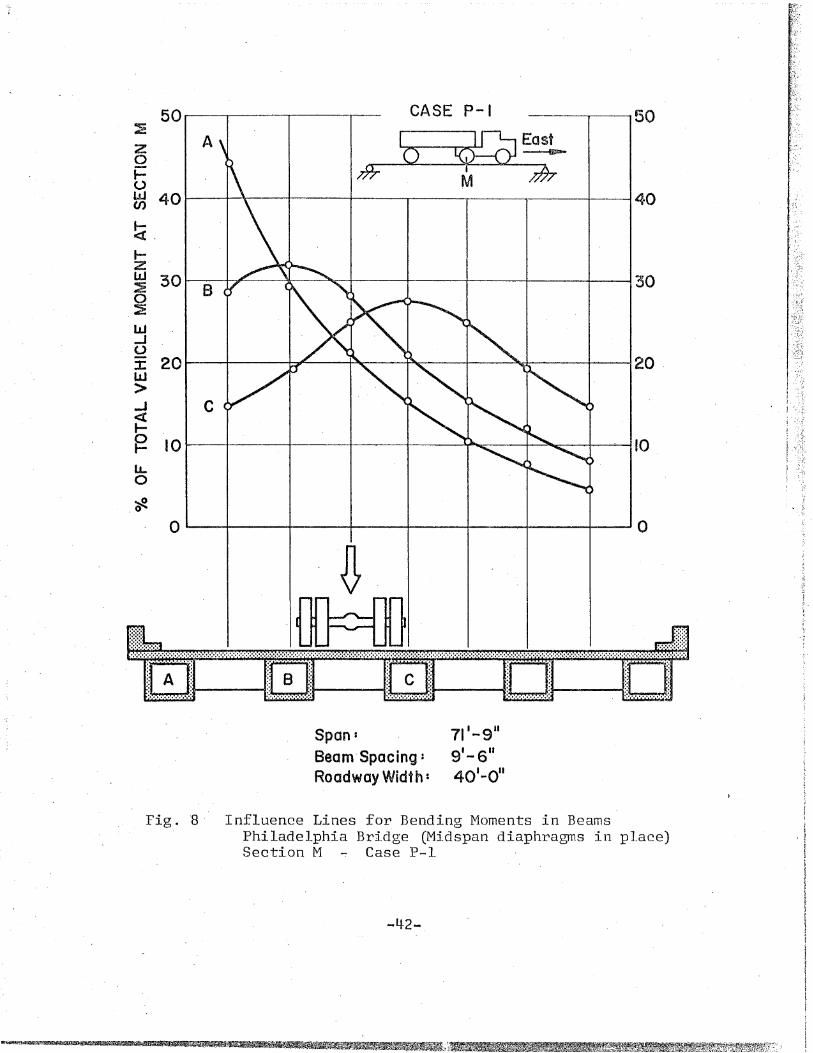
Fig. 8 Influence Lines for Bending Moments in BeamsPhiladelphia Bridge (Midspan diaphragms 'in place)Section M ~ Case P-l
-42-

.111 ... l1li
.........IJII
:::;::..............::-:...:000.; ::
: ::, '.
::, .00' ••••• ;~;
--~--50CASE P-2
:00 :o~ C ~• 0· .· .. , ..
'0"".~ B Io ,. .. '4:. 111 ...
A
I0 I----+---+------~---+--~--+------~--_t__--t 10
50----y-----y--------,r----
-~
LLo
zoI-trl 40 I--------If---lr---+----f------r----r-----r-------t-----f40(f)
....«tz~ 30 t------~-~r-----""'--------fl:-__zF_-__+_____.JiIl~_+_--_i_----t--__'_i30o:Ew...J~~IJJ>..J
~oI-
Span:Beam Spacing:Roadway Width;
71 1- 9"
9' - 6"40'-0"
Fig. 9 Influence Lines for Bending Moments in BeamsPhiladelphia Bridge (Midspan diaphragms removed)Section M Case P-2
-43-

---..------ 50CASE P-3West....-
c
50 r-----r-'---,...-.-----..---
~
zQI- Afd 40 t------f--r----+----...4--- - __----..----a.----"40CI)
~'
«l-t] 30:¥Eo~
W..J~ 20t-----+--~-~~-~..____-..J__-~--__.:.___---J20:t:W>-I
~o .1 0 t----t----t----+----+---~--.-{-~---+---.--.+ 10J-IJ.o
........Jt
Span: 71'- g"Beam Spacing: 91-6t~
. Roadway Width: . 40'-0"
Fig. 10 Influence Lines for B~nding Moments in BeamsPhiladelphia Bridge (Midspan diaphragms in place)Section M Case 'P-3
-44-

'0'"f . Ii .: ~i
------+---_---::fI ~-__+_--__l20
CASE P-4' 50West
rcQ:S ~;;;M
40
c
A
B
o-...----r-----f----+---+----+----~-----J----.J 0
:Ezoi=
.()w(I)
~IZw:io:Ew-JUJ:
·IJJ>.J
~o...l.L..o
Span:Beam Spacing.:Roadway Width:
711-9'19 1
- 6 11
40'-0"
Fig. 11 Influence Lines for Bending Moments in BeamsPhiladelphia Bridge (Midspan diaphragms removed)Section M Case P-4
-45-

...J,ZoIulJJC/)
,~
}zw~o~
W....JU::cw>...J
~ol-
LLo
CASE 8'-150 50
A P9TS ~NOr~
L ~40 40
:30 ~B=---+-_~---+-~----=---=:-+__-+__----+_--t 30
20 I-----J----------+-----+-~-~Itilt;:__--__t_-__I 20
101-------J-----------4-----r------i-----y.---t 10
0------+-------+-----+-----+-----1---0
t-
t
I
I
S '65'-3"pan:S · 8'- 9 3.r.a"Beam pacing: Il
Roadway Width: 28'-0"
Fig. 12 Influence Lines for Bending Moments in BeamsBerwick Bridge Section L - Case B-1
-46-
tII'
I

1
1"
.
•.=.".•.••...
t
r:
~.'.~.'.. '~_.
651-3"8 1-9 3/8
11
2-8 1-0"
Span:Beam Spacing:Roadway Width:
o ----+-------+-----+-----+-----1-- 0
Fig. 13 Influence Lines for Bending Moments in BeamsBerwick Bridge Section L Case B-2
50-'z0.- A(..)w 40enI-<J:
I-Zw 30~0 B:Ew..JU- -20J:
.W>-I
f!0 10I-
L!-a~0
-47-
It
~~~~~- ~~w .~u~._, b ~m~1__~~_ t

CASE B-350 50
~ '0 -~Nz0 779T M J77TJ-- Auw 40 p·40(J)
~
I....z BlJJ 30 30~0:Ew-JU
20 20:cw
I>.-Ig
10 10
Il-
LL0
I~ L0
0 0
.~.
t~ )~
Span:. Beam Spacing.:
Roadway Width :
65'-3"a'-9 3/s 11
281-0"
Fig. 14 Influence Lines for Bending Moments in BeamsBerwick ~ridge - Sectiori M - Case B-3
-48-
-------50
65'-3 11
8'-9~a"'
28'-0"
Span:Beam Spacing:Roadway Width:
I0 J--------f----+------+-----+----~~ 10
30
50----...-------
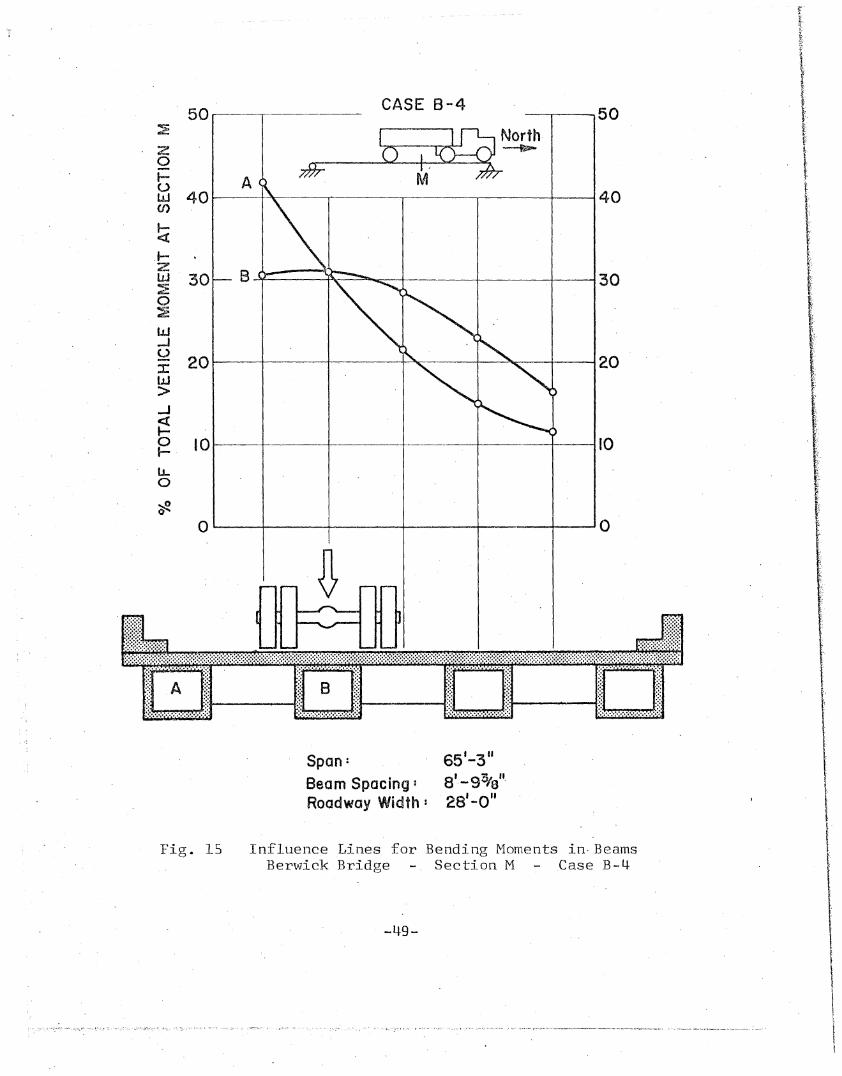
Fig. 15 Influence Lines for Bending Moments in· BeamsBerwick Bridge - Section M - Case B-4
-4-9-
CASE 8-4
::E i ~North'6 a _-fl-
l- A ft ~'~ 40 ....--~-~........---~----r----+-------&40en
~.1-zW:Eo~
W-I~J:W>-.oJ
~oI-IJ..o
;:;:;:;:::;:;;:::;:;:;:;:::;::::::::::::::::::;:;::::::::;:::;:;:;::::::;:::;:;:::;:;::::;:;:::::;:;::::::;:::;:;:;:::;::::;:::;:;:::;::::::::::::::::::;::::::::::::;:::::;::;:::::::;::::::::::::;:;:::;:::;:::;::::::;:;:;:;:::;::::::;:::;:;:::;:;::::::::::::::::;:;::::::;:::;:;:;:;::::::;:;:::;:;:;::::,

-50-
!f!
I!.iIf
!lt
II
65.'-3al -93/s
11
28 1-0"
Span:Beam Spacing:Roadway Width I
Influence Lines for Bendirig Mo~ents in BeamsBerwick Bridge - Section M - Case B-5
'Fig. 16
____..__-- --,-- ----:---.....--.....--~.<OC~

65'-3"'8'-93/s"28'-0"
-51-
Span:Beam Spacing:Roadway Width:
Influence_Lines for Bending Moments in BeamsBerwick Bridge Section M Case B-6
Fig. 17
50 Case 8-6 50.:! South Q& 0
1z ~
0 rJJT I 7b-I*- M0 40 40w(f) A
~t-Z
30 B 30w~0:Ew-I~ 20 20:cw>...J«t-
100 10t-1J...0
~0
0 0
~
j. i
1
ItIi1
ilIt{
\i
I1,t
tt\t
1
65'-3"a'-93/s"28'-0 11
CASE B-7---"--"---r-_ 50
Span:Beam Spacing: ,Roadway. Width:
A
B
10t--------t-------.----+--~-+----4----+----IIO
50-------
20 t------+-----+---~--l---~~__-__I_-----__J 20
30t------t---+-+-----+-~-___+_--__I_~___J30
zzo-"t-uW(J)
!:i.t-ZW::a:o:Ew..JU:I:W:..>..J«5l-
LL..o
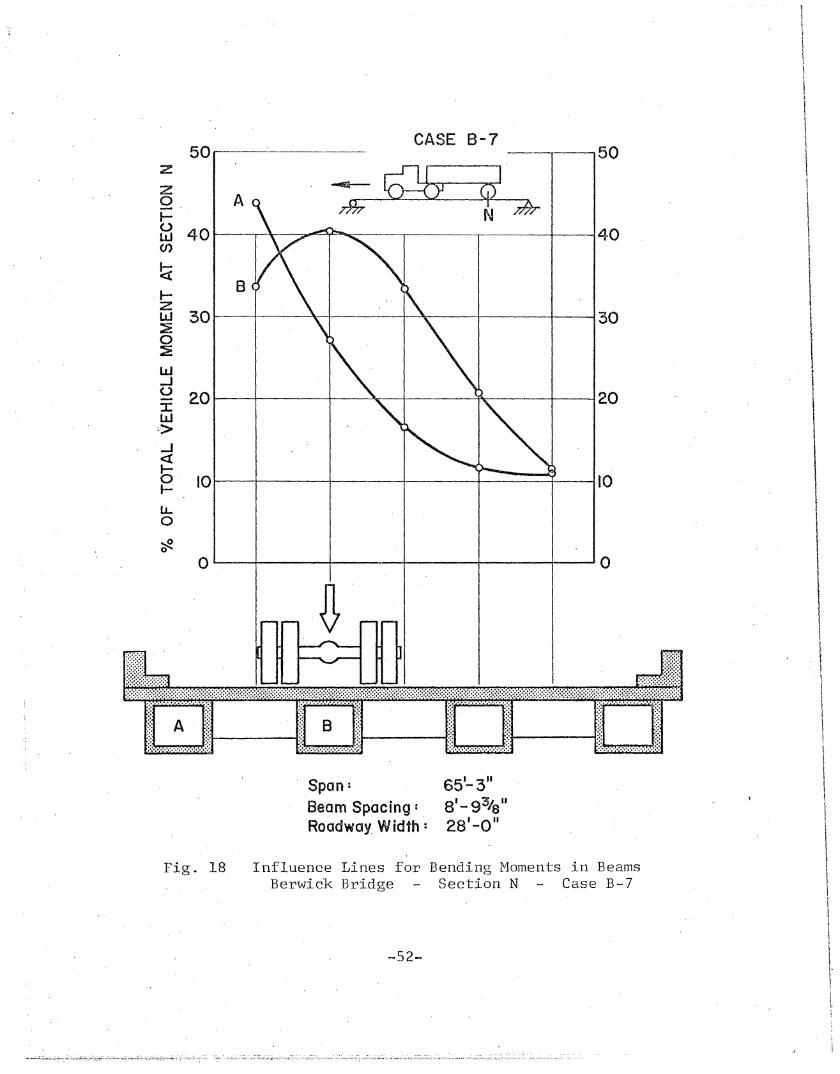
Fig. 18 Influence Lines for Bending Moments in BeamsBerwick Br~dge - Section N - Case B-7
-52-

50CASE 8-8
50z10 ~NOr~z
07fjT..... . N 7hu Awen 40 40
~t-Z Bw:E 30 300-:I:w--JU:t: 20 20IJJ>...J<tI-0t- 10 10LL0
tfl
0 0
18.:.:.:.~.:.:.:.:.:.:I·;~---to .....----t'ID...---.-.-..ID.:.....·.·...:.:...:.:.:::.:!~~~~ 41~ • :t I111 • • .. ·."'.. 41 .
rt
I[I,I
-53-
Influence Lines for Bending.Moments in Beams. Berwick Bridge - Section N - Case B-8
Fig .. 19
Span: .. Beam Spac ing :
Roadway Width:
65'-3"S'-93/s"28'-0" I
It!!f
t
It
fl\
\l(

CASE 8-95050
z '0 ~O~z A ;JJT0l- N'U
40 40w(J)
~, BI-Z
30lJJ 30~0:t:w..JU 20 20'J:W>..J«b 10 .101-"LL0
~0
0 0
~.
I
Span:Beam Spacing s
Roadway Width:
651-3"a' -93/s"28'-0"
Fig. ·20 Influence Lines for Bending Moments in BeamsBerwi~k Bridge Section N -. Case B-9
-54- ,

-55-
Influence Lines for Bending Moments in BeamsBerwick Bridge - Section N - Case B-10
f l~i?it!I11tttl~
tri.~
\1
i\i
iIf
t
Iit\~
t-
t~
It:t1:
I
It~
tI
tr
~
Ill\
i!~
1
\I
t
IfI
I\f
\f
1
II1
651-3"8'- 9~'a"28'-0"
Span:Beam Spacing:Roadway Width:
Fig. ·21 .

CASE VI-I50 50
:2: A
IJ & Northz
?1fTL( ~
0 M :&I-<..) 4-0 40w(J)
~I-- Bzw 30 30:!:0:iEw-J
i(.) 20 20:r: .Iw>-I
f«g 10 10I
LL0
* 0 0
. ft
Span:Beam Spacing I
Roadway Width
64'-8"g'-O"2S'-Ou
Fig~ 22 Influence Lines for Bending Moments in BeamsWhite Haven Bridge - Section M - Case W-l
-56-

-------.----50
B1--~t----~---+-----+------I30
50----------.-A
IJ..o
lJJ....JU 201----+---~----::~------+-.:IlIir----~---I20:cw>..J
~
O'"----+----f------+----~--..-~--10 !t
Span'Beam Spacing:Roadway Width I
641-8"9 1
- 0"28'-0"
Fig. 24 Influence Lines for Bending Moments in BeamsWhite Haven Bridge Section M - Case W-3
-58-
i ,

50 CASE W-4 50
A ~uth~ d&- ~1 /J9;
40 40
:EzotULlJ(f)
~1ZJJJ 30 8 n--_..---."..r-~----{~---4------..--4------I30
~o~
W-J
. ~ 2OI-----+----l----~--"\:I:---------+---:"""---4-------.l20W>-J«b I Or-----+----f--------+---------+----~--+------f~ 10
IJ..o
o o
Span I 64' -allBeam Spacing: 9' - a"Roadway Width t 28'-0"
Fig. 25 Influence Lines for Bending Moments in BeamsWhite Haven Bridge - Section M - Case W-4
-59-

50
64'-8"9'-.0"28&-0"-
CASE W-5
I~ ~North_J ~--.-
Nh
-60-
Span:Beam Spacing:Roadway Width:
Influence Lines for Bending Moments in BeamsWhite Haven Bridge Section N Case W-S
A-r--------
O""----t-----+-----+-----+------+-----J;Q
, Or--~----t-----+-·-----l-~-----I-------I t0
3 0 r---=B~---+-~-~-f----...,...--------..:....-----+------I-----I30
50
Fig. 26
.:i.l.::r:l..·.·.·.·.·.~.·.·..·..·.·...J·l..~~I~r;1~·~I. ID·····..····lll~.L:J J~.. :;: ;~~~~
zoi=uwen
~JZw:Eo:E
z
W..Jo-J:LaJ>..J
~'0l-lL.o

B
A-"'"--------- CAS E V~ - 6--.- , -----,.--......-----..,50
~~N~
10 t-------4-------f----+-------i'1-----..+--------I 10
50
201-----+----+---~--~--.....-...:...---+----I20
30 t----+---------(J-------f-....Jt----f-------4----I30
zz0t-&3(J)
j~
~::....4.~
t-ZuJ .~0~
W-IUJ:W>-I
~gLI-0
<f!.
I··. F.:._.-."
.,".~!.. ...~
O'--+-------t------t----4------t-------'Q
Span:Beam SpacingRoadway Width:
641-8"gl_O"
28'-0"
Fig. 27 "Influence Lines for Bending Moments in BeamsWhite Haven Bridge - SectionN. - Case W-6"
-61-

~
f~(Ii!!
~f~It
fI~I
IIIt
IIII'
itI
!II\
I'It
ljI!
I I64'-8"9'- au28' -0"
Span:Beam Spacing:Roadway Width:
'CASE W-750
S~uth~ oj 50::?: A
I 7fnz rJ};0 Nt-u 40 40w(J)
1-,« B1-'Z
30 30w,::E0:!:w-I(J 20 20J:IJJ>..J
~10 100
l-LL0
~0
0 0
.~
i~r:1ii !!:O·············!!
ii~i!,~, ~l J::r--.-t111:.. 411 "'".........0lil:.:11 ..: ........11: ...:. ..............~...,.,. ......~~
. Fig. 28 Influence Lines for Bending Moments in BeamsWhite Haven Bridge - Section N - Case W-7
-62-

t1-
IIt!ri
S/5
S/6
S/8
8/9
SIlO
...:.=:::.....................................................................::::*.- ....................................m~...........:::...:::...-..-..-.0·.:::
Beam C0"----
Beam A Beam B
Design1::::::;:;::4 Case 0-1
~ Case D-2
.~ 1.00I-o~lL.
Zot-::>CD
a::I-(f) 0.50o
DREHERSVILLE BRIDGE
Fig. 30 Experimentally Developed Distribution Factors andDesign Values: Drehersville Bridge Section M
-64- .
It,
II
S/5
Beam CBeam B
DesignI::::::::;:) Case pwl~ Case P-2~ Case P"3~ Case P-4
-65-
PHILADELPHIA BRIDGE
Beam· A
Experimentally Developed Distribution Factors andDesign Values: Philadelphia B~idge - Section M
Fig. 31

2,00
1.500::0.-0
li:z0 1.00t-::>co0::I-(f)
·00.50
Design~ C B I~ ase -1.·:::1 Case B-2
Beam A Beam B
S/5
S/6
5/7
SIB
S/9SIlO
BERWICK BRIDGE
Fig. 32 Experimentally Developed Distribution Factors andDesign Values: Berwick Bridge Section L
-66-

" .
2.00
0"----
Design(:;:::;:;:::! Case B-3
~ CaseB-4. [Z2J Case 8-5~ Case 8-6
Beam A Beam B
S/5
5/6
5/7
S/8
S/9S/IO
BERWICf< BRIDGE
Fig. 33 Experimentally Developed Distribution Factors andDesign Values: Berwick Bridge Section M

2.00
Designffi] Case B-7o Case 8-8f?ZJ Case B- 9~ Case 8-10 5/5
-68-
Experimentally Developed Distribution Factors and.Design Values: Berwick Bridge Section.N
5/6
S/8
S/9S/IO
5/7
BBeamA
BERWICK BRIDGE
Beam
Fig. 34
1.50
·0.50
0::oI(.)
~zo 1.00t-::>co0::t-(f)
Q

-69-
Fig .. 35 Experimentally Developed Distribution Factors andDesign Values: White H~ven Bridge - Section M
5/5
S/6
5/7
S/8
S/9
Beam B
WHITE HAVEN BRIDGE
't Designf:::::::::~~ Case W-Io Case VtJ-2~ Case \//-3~ Case W-4
Beam A0------
1.00
1.50-
0.50
2.00
WHITE HAVEN BRIDGE
2.,00
o~-
Design
I~~:;:;:~ Case W-5o Case W-6I2ZJ Case W-7&S1 Case W-8
Beam· A Beam B
S/5
Fig. 36 Experimentally Developed Distribution Factors andDesign Values: White Haven Bridge Section N
-70-
.EXTERIOR GIRDER
ks
k~c
r ks --IJtNA NA
hb Yb
35~~~~~~,...,....,....~
tNA ---4-----J---+~-__+__-~"d_-_t__r--___.__- NA
INTERIOR GIRDER
Fig. 37 Idealized Composite Cross-sections

30 30
12 12
1.0~k
0.9
10 . 20 0.8 20 fO .0.7
INAI.O=1t
8 0.9 80.8Zb INA Zb 0.7
in3 x "103 in~x 104
6 6
10 Drehersvil fe Bridge - Interior Girder 10wb=48 hb=33 5=86
4 4
(See Fig. 3-' for diagram)
2 2
-72- .
!I
I.
6060
50 50
1.0= k
0.9
40 0.840
Case I 0.7
INA
in~ x 104.
30 I.O=k 300.90.80.7Casell
I.O=k20 0.9
200.80.7Casem
Drehersville Bridge- Exterior Girder
wb= 48 hb= 33 S =8410 Case I: hp=r6 hc=9 he = IO-t 10
I'wp= 15 we= 33 we= 17Case E: Same as I, except that hp=O, wp'= 0 ICase m: Same as JI, except that hc=Ot we =0
t(See Fig. 37 for diagram).t0
6.0 0I
6.5 7:0 7.5 8.0
t. in.
Fig. 39 Moment-of-Inertia Exterior GirderDrehersville Bridge
-73-
16 16
14 14- 1.0=((--- - 0.9
~ - 0.8Case I - 0.7
12 r-- 12
10 1.0=k 10- 0.9Z-b - 0.8-
Cesen 0.7
in~x 103'~
b·O=k8 - .9 80.8
Casem - 0.1
6 Drehersville Bridge - Exterior Gir-der 6
wb= 48 hb= 33 S =84Case I: hp = 16 he=9 he=IO-t
4 4wp= 15 we= 33 we= 17
Case ]I: Same as I, except that hp=O, wp= 0Case ]]I: Same as TI, except that he =0, we =0
2 2(See Fig.37 for diagram)
oa..-_~-,,"------""''''---'-_--.&_-_-.-L_-_-...L._-----'O
6.0 6.5 7.0 7.5 8.0
t J in.
Fig. 40 Section Modulus - Exterior GirderDrehersville Bridge
-74-
~
!
II!
IIi
·1

401.0=k 400.90.8
0.714 14
INA
12 30 1.0:: k 30 120.90.8
,Zb 0.7
10 10Zb INA
1n~ x 103 in~ X 104
8 20 20 8
6 Philadelphia' Bridge - Interior Girder 6
wb=48 hb=42 5=114
4 10 (See Fig. 37 for diagram) 10 4
2
I[,
I6.56.0Ol.-..--------L-----......I..----L-.---_---L --'---~·---'0 0
7.0 7.5 8.0
2
o
Fig. 41 Cross-sectional PropertiesPhiladelphia Bridge
Interior Girder
-75-

10
60
Case I
50
Casel[40
'INA
in.4 x10 4
Casem30
1.-0:= it
0.9
0.8
0.7
1.0= k0.90.80.7
1.0= k0.90.80.7
Philadelphia Bridge - Exterior Girder
20
10
Wb= 48Case I:
-Case JI:Case m:
hb=425=102hp =., 6 he=9 he =10 - t
Yip= 15 wc=33 we:: 21
Same as I, except that hp=O, wp=OSame as 1(, except that he=0, we =0
(See Fig. 37 for diagram)
O~---",-----_.a--_-_.L---_--"'------"'-----'
Fig. 42 Moment-of-Inertia - Exterior Girder·Philadelphia Bridge
-76-
6.0 6.5 7.0
t, in.
1.5 8.0
II
Ii
Ii

18 18
- 1.0 =It
I16 -----.- 0.9 16------- ----- 0.8,-~1""'"
Case I - 0.7I-
i-
14 14
1.0= k- 0.9~ 0.8
Case II:- ~ 0.712
1-
121.0:: k
---",0.9==--+ 0.8
Cas.em -- .0.1=--10 10
Zb
in~x 103
8 Philadelphia Bridge - Exterior Girder 8
wb= 48 hb=42 S =102Case I: h - 16 hc= 9 he = 10- t
6 p- 6 i
wp=15 wc=33 we= 21fi
Case Jr: Same as It except that hp=O, wp=O- f-I
4Case :m:: Same aslI,excepf that hc=O, wc=O 4 I
!(See Fig. 37 for diagram)f
I2 2
r!
O"-------------~------"""'-----~O6.0 6.5 7.0 7.5 8.0
t I in.
Fig. 43 Section Modulus Exterior GirderPhiladelphia Bridge
-77-
Interior Gird'er
t. in.
oL.-__---'- ....I....-__---I --L- ..L..-_--.J0 06.0 6.5 7.0 7.5 8.0
Cross-sectional PropertiesBerwick Bridge
o
Fig. 44
35 35
LO=k
0.9
0.8
30 0.7 30
INA
25 2512 12
I.O=k0.9
to 20 Zb0.8 20 100.7
Zb INA
in.S'x 103 in~)( 104
8 815
Berwick Bridge - Interior Girder
wb=48 hb=39 5=1053/8 6
10 (See Fig. 37 for diagram) 10
4 4
5 ~
2 2

20
10
I.O=k0.9 400.80.7
I.O=k0.9 30o.s" ,0.7
hb =39 S = 95 5tahp= 16 he:: 9 he = IO-t
wp= 15 wc=33 we= 18
Same as I. except that hp=0, wp=OSame asIT,except that hc=O, we=0
Berwick Bridge - Exterior Girder
Case II:Case ill:10
20
60 601.0= k
0.9
0.8
0.750' Case I 50
40
I t4A Casellin~x 104
30
Casem
(See Fig. 37 for diagram)
O~----'"'----------~----'----------06.0 6.5 7.0 7.5 8.0
t 1 in.
Fig. 45 Moment-of-InertiaBerwiok Bridge"
Exterior' 'Gird,er
-79-
16
14
_..__.l----~---I I. 0 =k_____.J.-----------~-1 0.9
-'--'---~. -:=.J----....----t--_=_ ~__....L__---------. 0.8
=~l__----t---. - 0.1Case I =---~.l--------r""'----------
16
14
12 1.0:: k12- 0.9- 0.8
Case J1 0.7~
1.0= k-- 0.910 -~ 0.8 10
Zb Casem ....-- 0,'"~
.:3 103In. x
8 8
Berwick Bridge - Exterior Girder
w,b:: 48 hb=39-- S = 95 0/86 Case I: hp =16 he= 9 he =10- t
6
~p= 15 we=33 we= 18
Case ]I: Same as I, except that hp·=O, 'wp=O44 Case .TIr: Same asJI,excepf that hc==Ot wc=O
(See Fig. 37 for diagram)
2 2
o'---__--L--.__--..L- L--.-__~__..___ 06.0 6.5 7.0 7.5 8.0
t, in.
Fig. 46 Section Modulus - Exterior GirderBerwick Bridge
-80-

1225
35LO=k
0.9
0.8
0.7
30
25
30
35
12
10 20 I.O=k 20 100.90.8
Zb 1NA Zb 0.7
in.3 X 103 in.4 x104
8 815 15
6 White -Haven Bridge - Interior Girder 6
wb=:36 hb=42 S=I08i10 10
4(See Fig. 37 for diagram) 4
5 52 2
o O~-------------"--_-.l--_--""'--_--.JO 06.0 6.5 7.0 7.5'
t J in.
Fig-. 47 Cross-sectional Properties ~ Interior GirderWhite -Haven Bridge
-81-
LO=k0.9
400.80.7
1.0 =k0.90.8 300.7
60 . J.O=ft 600.9
0.8
Case I 0.7
50 50
40
INA CaseD·
i~4x 10⁴
30
Casem
White Haven Bridge -Exterior Girder20-
10
Wb= 36Case I:
Case II:Case lJl::
hb=42 S =93
hp =J 6 he= 9 he =10 - t
wp= 15 we= 33 we =21
Same as I. except that hp=O, wp=OSame as II', except that he:: 0, we =0
20
10
(See Fig.37 for. diagrorrl)
O------"'------'--------lI.---~----4-----JO.6.0 6.5 7.0 1.5 8.0 -
t tin.
Fig. 48 Moment-of-Inertia Exterior GirderWhite Haven Bridge .
-82-

1.6 16
[f
It1
I
14
Case I
I -----+---------:=t:===-=t f. 0:: k
=::::::::t====::::j===:::t:====-=j 0.9
E====-:t~=====F===::t====-~ 0.8E....---====:t===i---r----l 0.7
14
12 121.0=«
- 0.9:::..-...-
- 0.8
n: ~ 0.7~
~
10 I.O=k .10:=: 0.9
Zb - 0.8
in~x 103 m ......---- ~~ 0.7.~
8 8
White Haven Bridge - Exterior Girder
6 6wb= 36 hb= 42 S =93
Case I: hp = 16 he=9 he. =10-t
4wp=.15 . we: 33 Ytle =21 4
Case II: Some as I, except that hp=0, wp=0Case m: Same as II, except that he =0, we =0
2 (See Fig. 37 . for diagram) 2
8.07.57.06.5. 0 '--- --" -'- ---&. ---1--_---' 0 .
6.0
t, in.
Fig _. 49 Section Modulus - Exterior GirderWhite Haven Bridge
-83-

:-:,
:,~
0.10 0.10en~ ~w
:r:pP; 7f7r()
z M...~ 0.08 0.08z A0
8I-uWU) 0.06 0.06LL..0
Z C0,
t- 0.04 0.04.~-.JLL"W0
-I 0.02 0.02«<...>l-~W>
0.00 0.00
~
Span:Beam Spacing':
Roadway Width:
61' - 6"71 -2"301-0"
Fig. 50 Influence Lines for Vertical Deflections of BeamsDrehersville Briqge - Section"M
-84-
II '
I
.;....)fIfif
71 1 -9 11
91
- 611
-40 1"0"
Span:
Beam Spacing:Roadway Width:
c
-0- With Diaphragms
- -lz-- Without Diaphragms
0.12 0.12
S. ~A;#; /737-M
0.10 0.10
B
0.08 0.08
O.021-------'------'----------'----+-------+---3Il~.,.-+---+-----iO.02
. O.OO'----------.-+--:.---<---f------il-----+---'"O~OO
Fig. 51 Influence Lines for Vertical Deflections of BeamsPhiladelphiaBridge - Section M
-85-

if:O··········.. ···t fl:O·········.. ·..}
t----·-~1 ; Jt------ItI 11~......................... .;......•..: ;.:..;..
Span: ' 65'-3"Beam Spacing:. 8 8
_ 9 3/e"Roadway Width: 28'- OU '
Fig. 52 Influence Lines for Vertical Deflections of BeamsBerwick Bridge - Section L
-86-
lI

O.021-----f-----.....-----+-----f--~--t------tO.02
0.10 0.10A
~) ~?hB
0,08 0.08
~
t.-
0',06 0.06
ft
:a:zot(JW(f)
lL.'oZo.....~ O.04J----4---+-----+--~---+-----+----tO.04
-IlJ...Wo-I«()
t-o::W>
0.00""'"""'---+------+-----+-----+----+'---'0.00
,Span:
Beam S,pacing :Roadway Width
64'. aU9' .. 0"28'-0"
!t
I
\II
Fig. 53 Influence Lines for Vertical DefLections of BeamsWhite Haven Bridge - Section M
-87-
{
I\tI
}

20.4'
Deflected Shape
L
13.0'
i I 8.~3.55'
PL38=C--
EI
c P L E* I** IiBridge kips ft. ksi · 4 106 in.In. x
Drehersville 0.594 4 61.5 6800 1.33 0.106
Philadelphia 0.627 6 71.8 5400 2.19 0.203
Berwick 0.615 4 65.2 7300 1.58 0.102 .
White Haven 0.614 4 64.7 6000 1.60 0.120
*Measured in Flexural Investigation
**Assumed as ·Sum of Values for Individual CompositeBeams t = 7.5 i,n. , k =0.7 I Curb and Parapet Fully Effectiv~
See Figures 37 to 49
Fig .. 54 Idealized Bridge Deflections - Test Vehicle atSection of Maximum Moment
-88-
(-(
~'
',>,c'
i;'Af:'::':i,,<,":~
,{ .-t'{
/:\ ~'~:, t;', ;'~L"',~,
:'.,
'}'
·C.,
',,"'"
; I:;
::'f"
;\,:~;;': ",
;.,'::,
'; :~>}~'.\~ ';~,-j:, ..
,Ii:.
0.05
0.10
0.15
0.20
0.05
0.10'
0.15
6'-.8U
PHILADELPHIA
--0- With Diaphragms
--t:r--Without Diaphragms
6'-a"
0.15
0.05
0.05
0.10
0.15
DDD[[p[] ~ ~
0.25 0.25
0.20
o '--_--J.-__~__-.L,..-__-'----~_ ___' 0
0,10
(/)
~<:CtJJcolL.oZo en.... wu :cw <->-I ZlL. ""-""Wo-I<!(J
r.:~w>
DREHERSVILLE
Fig. 5S Beam Deflection Profiles (All lanes loaded)Drehersville and Philadelphia Bridges
-89-

7' 7' 7' 7'
0.15 0.15
0.10 0.10
0.05 0.05
0.10
0.15
0.05
7' .
BERWICK
WHITE HAVEN
7'
0.10
0.05
-90-
Fig. 56 Beam Deflection Profiles (All lanes loaded)Berwick and White Haven Bridges
en~ 0 '---_--a..-__-+-__---'- ...r....--.,.._---J 0Wenu_oz0....-..
(f)
b WW J:....J t.>IJ.. Zw ..........a-J«u·I-
-a:::w> 0.15

10. REFERENCES
1. American Association of State Highway OfficialsSTANDARD SPECIFICATIONS FOR HIGHWAY BRIDGES,Ninth Edition, AASHO, Washington, D. C., 1965
2. Douglas, W. J. and VanHorn, D. A.LATERAL DISTRIBUTION OF STATIC LOADS IN A PRESTRESSEDCONCRETE BOX-BEAM BRIDGE, DREHERSVILLE BRIDGE, Lehigh·'University, Fritz Engineering Laboratory ReportNo. 315.1, August 1966
3. Guilford,' A. A. and VanHorn, D. A.LATERAL DISTRIBUTION OF DYNAMIC LOADS IN A PRESTRESSEDCONCRETE BOX-BEAM BRIDGE, DREHERSVILLE BRIDGE, LehighUniversity, Fritz Engineering Laboratory ReportNo. 315.2, February 1967 .
4. Fang, Shu-jin, Macias-Rendon, M. A. and VanHorn, D. A. I
ESTIMATION OF BENDING MOMENTS IN BOX-BEAM BRIDGESUSING CROSS-SECTIONAL DEFLECTIONS, LeJ1igh Universi ty,Fritz Engineering Labor~tory Repo~t No. 322.2, June 1968
S. Guilford, A. A. and Variliorn, D. A.LATERAL DISTRIBUTION OF VEHICULAR LOADS IN A PRESTRESSEDCONCRETE BOX-BEAM BRIDGE, BERWICK BRIDGE, Lehigh University, Fritz Engineering Laboratory Report No. 315.4,-October 1967
6. Guilford, A. A. and VanHorn, D. A..IATERAL DISTRIBUTION OF VEHICULAR LOADS IN A' PRESTRESSEDCONCRETE BOX-BEAM BRIDGE, WHITE HAVEN BRIDGE, LehighUniversity, Fritz Engineering Laboratory Report No. 315.7,August 1968
7. Lin, Cheng-shung and VanHorn, D. A.THE EFFECT OF MIDSPAN DIAPHRAGMS ON LOAD DISTRIBUTIONIN A PRESTRESSED CONCRETE BOX-BEAM BRIDGE, PHILADELPHIABRIDGE, Lehigh University, Fritz Engineering LaboratoryReport No. 315.6, June 1968
8. Macias-Rendon, Miguel A. and VanHorn, D. A.A STRUCTURAL MODEL STUDY OF LOAD DISTRIBUTION INBOX-BEAM BRIDGES, Lehigh University, Fritz EngineeringLaboratory Report No. 322.1, May 1968
9. Penpsylvania Department of Highways - Bridge DivisionSTA~mARDS FOR PRESTRESSED CONCRETE BRIDGES, ST~200 ST-208, Harrisburg, Pennsylvania, August 17, 1964
-91-.

10. Sanders, W. W. and Elleby, H. A.DISTRIBUTION OF WHEEL LOADS ON HIGHWAY BRIDGES,Engineering Research Institute Report No. 361,Iowa ,State U~iversity, Ames, Iowa, December 1968
11. Schaffer, T. and VanHorn, D. A.STRUCTURAL RESPONSE OF A 45° SIffiW PRESTRESSEDCONCRETE BOX-GIRDER HIGHWAY BRIDGE SUBJECTED TOVEHICULAR LOADING - BROOKVILLE BRIDGE, LehighUniversity, Fritz Engineering Laboratory Report'No. 315.5, October 1967
12. Motarjemi, D. and VanHorn, D. A.THEORETICAL ANALYSIS OF LOAD DISTRIBUTION INPRESTRESSED CONCRETE BOX-BEAM BRIDGES, LehighUniversity Fritz Engineering Laboratory ReportNo. 315.9, October 1969
-92-


![Ralph Waldo jE,nerSon a11d William ]am,es as Public](https://img.pdfslide.net/doc/110x75/617568b10748ce47c629662b/ralph-waldo-jenerson-a11d-william-ames-as-public-.jpg)