Embed Size (px)
Citation preview
Leica SP8 X Laser Scanning Confocal Microscopeat the Advanced Microscopy and Imaging Center
University of Tennessee, KnoxvilleJohn Dunlap, PhD, Manager
FEATURES
Spectral Detection
• a prism (1) splits fluorescence emission
• sliders (2) define which wavelengths reach different detectors (3)
• can detect up to five different fluorophores at the same time
• higher sensitivity with hybrid detctors (HyD)
White Light Laser
• any wavelength from 470 to 670 nm• up to 8 simultaneous laser lines• pulsed laser (for LightGate)• near UV (405 nm) also available• argon laser (458, 488, 496, 514
nm) also available
LightGate
• reject photon based on fluorescence lifetime• eliminate reflections• block autofluorescence• collect more signal
Resonant Scanner
• fast scanning of 8,000 lines per second• up to 16,000 lines per second with
bidirectional scanning• for highly dynamic events• reduced bleaching of fluorophores
Optical Scan Field Rotation
• adjust scan direction to cell• smaller scan area required
Fluorescence Recover After Photobleaching (FRAP)
• for measuring protein dynamics in living cells
• diffusion constants, turnover rates• software wizard for easy setup and
analysis
Fluorescence Resonance Energy Transfer (FRET)
• for detecting protein-protein interactions
• sensitive to changes in distances < 10 nm
• acceptor bleaching method• sensitized emission method• software wizard for easy setup
10 µm
Organelle Movement in Plant Cells
CFPYFPmCherry
50
45
40
35
30
25
20
15
10
5
0
400 500 600 700 800 900
wavelength (nm)
GaAsP PMT
HyD
QE (%
)
50
45
40
35
30
25
20
15
10
5
0
400 500 600 700 800 900
wavelength (nm)
HyD
Multialkali PMT
QE (%
)
Time of flight dispersion in PMTs
Short transit time spread in HyD
Low light intensity High light intensity
Emitted photons
Rapid detector5 counted events
Slow detector3 counted events
http://www.leica-microsystems.com/hyd-guide-qr/
CONNECT WITH US
LEICA HYD'S QUANTUM EFFICIENCY IS SUPERIOR TO STANDARD PMTS AND GaAsP PMTS
Quantum efficiency is a measure for a detector’s capability
to translate photons into electrons. With a typical quantum
efficiency of 45% at 500 nm, the hybrid detector is two to
three times more sensitive than a standard PMT. This new
level of sensitivity improves low-light applications where
traditional PMT-based confocals would fail, such as imaging
of yeast or C. elegans.
Traditional PMTs using a GaAsP (Gallium-Arsenide-Phosphide)
photocathode are susceptible to damage by overexposure.
The Leica HyD’s design avoids this shortcoming, making
the detector both highly sensitive and versatile with a large
dynamic range. In terms of quantum efficiency the Leica HyD
even supersedes standard GaAsP PMTs by delivering
outstanding sensitivity along with durability..
peroxisomes
mitochondria
Golgi stacks
peroxisomesmitochondriaGolgi stacks
simultaneous image capture with HyD detectorsresonant scanner, bidirectional scanning76 ms per frame7 focal planes 0.5 µm apart (maximum intensity projection)547 ms delay between Z stacks
kymographs showing all organelles in cell:
10 s
18
No gating
With gating
λ (nm)
Gain
by
Ligh
tGat
e
The LightGate –Filter Free Removal of Unwanted SignalIn conventional microscopy, reflected and backscattered light is removed by spectral
blocking filters. Leica HyD detectors together with the White Light Laser as a pulsed
excitation source allow the restriction of detection to a certain time gate after the detec-
tion pulse. This removes unwanted signal in an ingeniously simple way.
LIGHTGATE FOR MAXIMUM IMAGE CONTRAST
LightGate utilizes the time decay of the fluorescence signal.
A light pulse from the White Light Laser (WLL) excites the
fluorophores and triggers the start point for time measurement.
Only signals arriving at the hybrid detector in a flexible and
adjustable time window are collected. Unwanted signal from
autofluorescence, backscattered light at the begin of the
fluorescent decay, or detector noise at the end of decay
can be removed. This way, the highest image contrast can
be obtained – even from weakly stained samples.
LightGate onoff
LightGate allows direct detection underneath the laser line to collect more data.
LightGate completely removes cover glass reflection. HeLa cells, nucleus stained with Chromeo 505. Excitation: 510 nm (within detection range). Detection: 495-540 nm
Leica TCS SP8 X –The Only Freely Tunable Confocal SystemThe white light laser source of the Leica TCS SP8 X perfectlymatches the spectral properties of any fluorophore excitable inthe visible spectral range. Continuously tunable excitation and detection ensure best image quality and sample protection. Up to eight excitation lines can be used – simultaneously.
› Tuning range of 470 to 670 nm in 1 nm intervals
› Minimum cross-talk in multiple stained specimen
› Change of Illumination regimes within microseconds
› Lambda Square Mapping: full spectral information by excitation-
emission correlation
› LightGate: background quenching using time-gated detection
› True FLIM results by adjustable excitation wavelength and variable
pulse repetition rate
www.leica-microsystems.com
Cells expressing a cell cycle stage marker. Green: non-S1 phase. Red: S1 phase. Courtesy of Dr. Malte Wachsmuth and Dr. Lars Hufnagel, EMBL,Heidelberg, Germany
Non-S1 phase
S1 phase
Fig. 5 Left: without FRAP Booster. Right: with FRAP Booster. The same laser settings were used for both images . GFP-Tubulin in HeLa cells, EMBL Heidelberg.
5reSOLUTION – FRAP WITH TCS SP8 RESONANT SCANNER
Fig. 6 FRAP experiment without FRAP Booster, without FRAP Zoomer. The red line indicates the bleach pulse.
Fig. 7 FRAP experiment without FRAP Booster, with FRAP Zoomer. The red line indicates the bleach interval
Fig. 8 FRAP experiment with FRAP Booster and with FRAP Zoomer. The red line indicates the bleach interval.
sec
sec
inte
rval
sec
inte
rval
inte
rval
Fig. 6 to 8 is showing the results of FRAP experiments with the resonant scanner.
Fig. 6 Without FRAP booster, without FRAP ZoomerFig. 7 Without FRAP booster, with FRAP ZoomerFig. 8 With FRAP Booster and with FRAP Zoomer
HeLa cells with free YFP were used for the experiments. The FRAP series were taken with a 40x 1.1 lens and zoom factor of 8 was used during the whole ex-periment. The frame rate was about 36 fps, the bleaching time about 200 msec. If you need to bleach even faster, you may use all Ar-laser lines for bleaching.
It can be summarized that during FRAP experiments with RS it may happen that the time to apply the needed laser power is too short to bleach the region of interest efficiently. Then appropriate adjustments are needed to concentrate the available amount of light to a smaller area: The best bleaching results can be achieved by combining the FRAP Zoomer and the FRAP Booster.
2 resolution
F R E T W I T H T C S S P 8
Donor
Acceptor
S1
S1
FRET with Leica TCS SP8 LAS AF
In the event of FRET an excited fluorophore transfers its energy to another light-absorbing molecule.
IntroductionFluorescence Resonance Energy Transfer (FRET) is a tech-nique which allows insights into interactions between pro-teins or molecules in proximities beyond light microscopic resolution. The principle: An excited fluorophore, called donor, transfers its excited state energy to a light-absorbing molecule which is called acceptor. This transfer of energy is non-radiative.
FRET Acceptor PhotobleachingThe method
In the event of FRET the donor encounters a quenching of fluorescence due to its energy transfer to the acceptor. The donor fluorescence will be unquenched after photo-bleaching of the acceptor. The difference in the intensity of the donor before and after photobleaching gives a direct
indication of the FRET efficiency and can be quantified as follows:
FRETeff = (Dpost - Dpre) / Dpost
where Dpost is the fluorescence intensity of the donor after photobleaching and Dpre is the fluorescence intensity of the donor before photobleaching.
Acceptor photobleaching is an established method for the evaluation of FRET efficiencies. It is usually applied to fixed samples, as any relocation of donor molecules during measurement will lead to false intensity correlations.
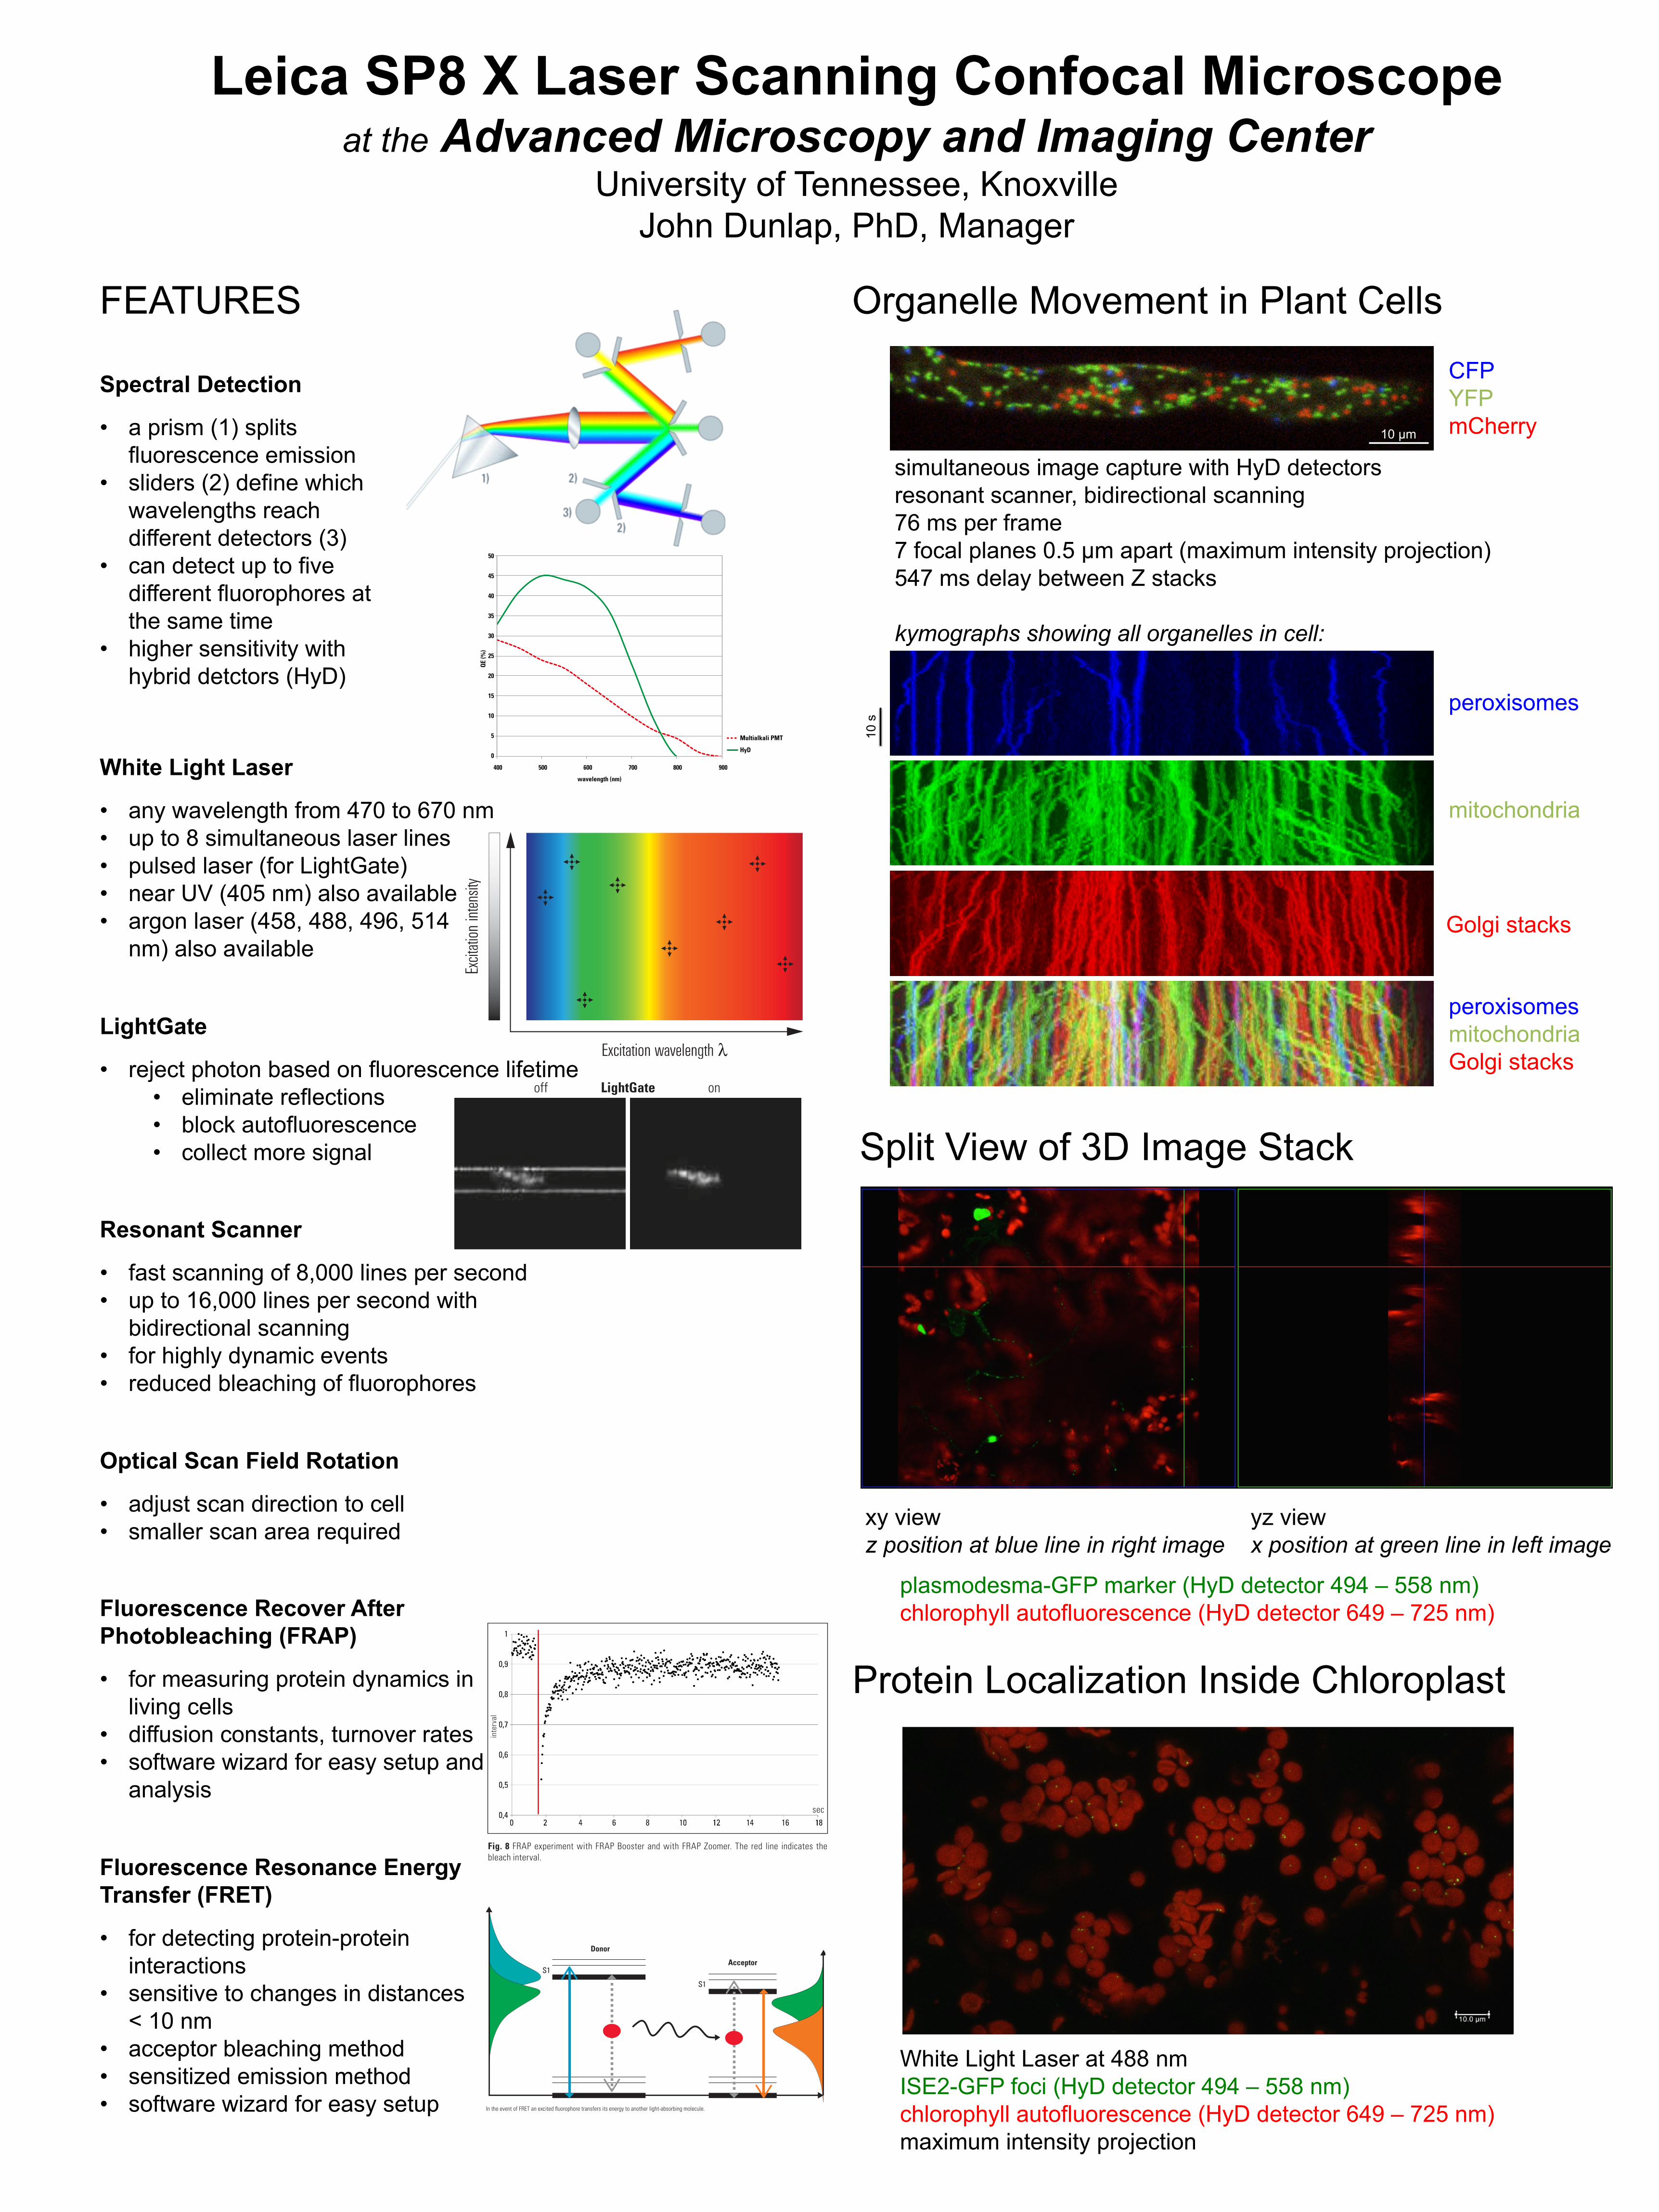
Split View of 3D Image Stack
Protein Localization Inside Chloroplast
White Light Laser at 488 nmISE2-GFP foci (HyD detector 494 – 558 nm)chlorophyll autofluorescence (HyD detector 649 – 725 nm)maximum intensity projection
xy viewz position at blue line in right image
yz viewx position at green line in left image
plasmodesma-GFP marker (HyD detector 494 – 558 nm)chlorophyll autofluorescence (HyD detector 649 – 725 nm)