Embed Size (px)
Citation preview
8/2/2019 LenaPerenius_Assessment of Key Resources
http://slidepdf.com/reader/full/lenapereniusassessment-of-key-resources 1/18
1
Global Chemical industry: Profile and Trends
Global Outlook for chemicals and wasteGeneva June 26,Geneva June 26, 20092009
LenaLena PereniusPerenius,,
Executive DirectorExecutive DirectorProgramme Product StewardshipProgramme Product Stewardship
8/2/2019 LenaPerenius_Assessment of Key Resources
http://slidepdf.com/reader/full/lenapereniusassessment-of-key-resources 2/18
2
International Council of Chemical Associations (ICCA)
• Council of chemical industry associations from:
Australia, New Zealand, Japan, Europe, North and SouthAmerica, and South Africa
• Represent approximately 75% of global chemicalsproduction
• World chemical production is € 2 trillion annually and 45%
of this is traded internationally• Develop industry positions and programs on international
issues:
health, safety, and the environment; international transportsafety; intellectual property; trade policy; elimination ofchemical weapons
• Promote and coordinate Responsible Care® and other
voluntary chemical industry initiatives
8/2/2019 LenaPerenius_Assessment of Key Resources
http://slidepdf.com/reader/full/lenapereniusassessment-of-key-resources 3/18
3
Responsible Care ®
• Voluntary chemical industry initiative
• Started in Canada in 1985 and now in 53 countries
• Commitment to continued improvement in all aspects ofhealth, safety and environmental performance and to opencommunication
• Rigorous system of checklists, performance indicators andverification procedures enables the industry to measureimprovement
• Industry associations implement initiative in their countries.
All programs are monitored and coordinated by ICCA.
8/2/2019 LenaPerenius_Assessment of Key Resources
http://slidepdf.com/reader/full/lenapereniusassessment-of-key-resources 4/184
ICCA is committed to meeting WSSD’s sustainable development challenge
ICCA is making a significant contribution in these areas:
• Chemical safety: extending Responsible Care ® toGlobal Product Strategy
• Innovation: developing new products and technologies
• Capacity building: improving knowledge aboutchemicals through training, education andcommunication and promoting health, safety andenvironmental standards worldwide
• Globalization: transferring efficient technologiesthroughout the world and improving education andtraining
8/2/2019 LenaPerenius_Assessment of Key Resources
http://slidepdf.com/reader/full/lenapereniusassessment-of-key-resources 5/185
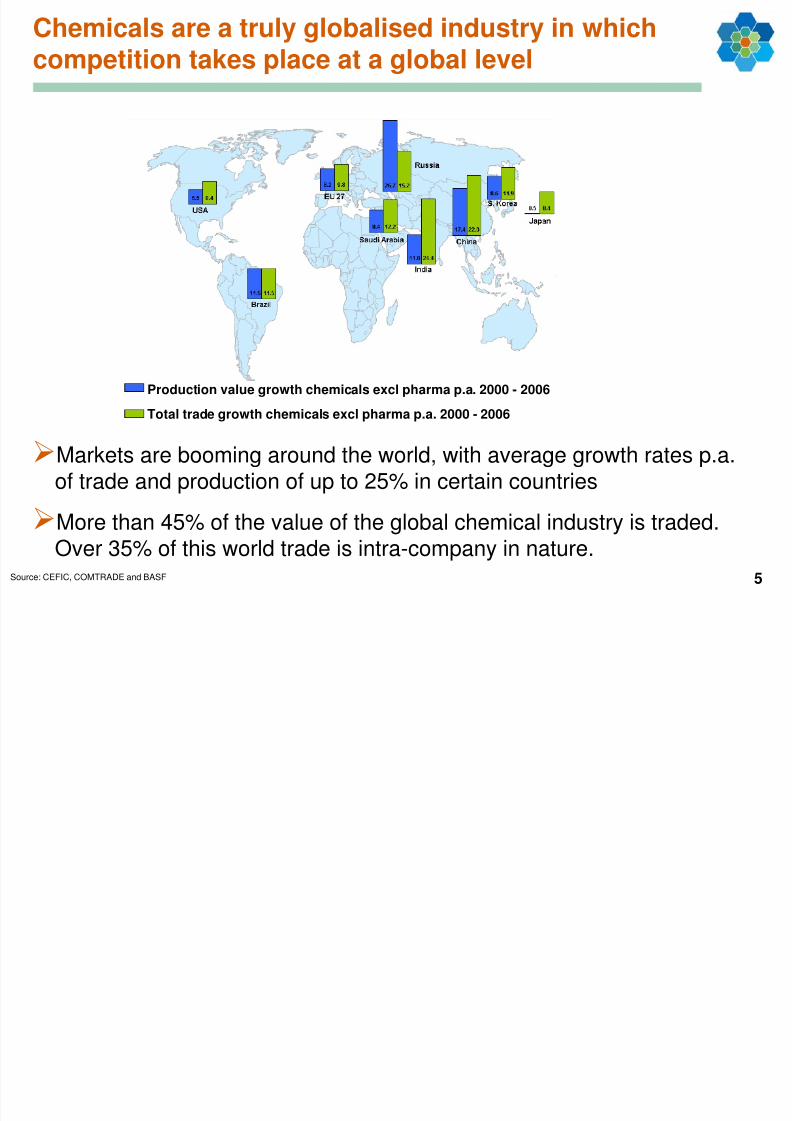
Chemicals are a truly globalised industry in whichcompetition takes place at a global level
Markets are booming around the world, with average growth rates p.a.of trade and production of up to 25% in certain countries
More than 45% of the value of the global chemical industry is traded.Over 35% of this world trade is intra-company in nature.
Production value growth chemicals excl pharma p.a. 2000 - 2006
Total trade growth chemicals excl pharma p.a. 2000 - 2006
Source: CEFIC, COMTRADE and BASF
8/2/2019 LenaPerenius_Assessment of Key Resources
http://slidepdf.com/reader/full/lenapereniusassessment-of-key-resources 6/186
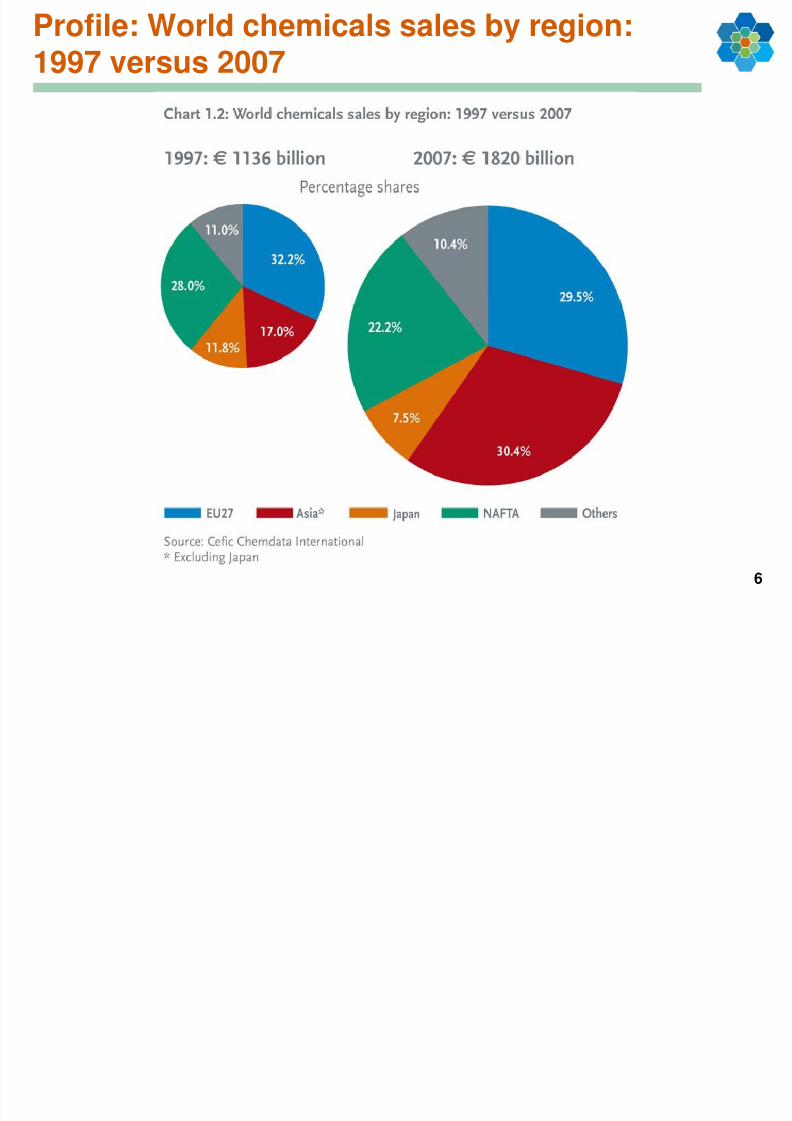
Profile: World chemicals sales by region:1997 versus 2007
8/2/2019 LenaPerenius_Assessment of Key Resources
http://slidepdf.com/reader/full/lenapereniusassessment-of-key-resources 7/187
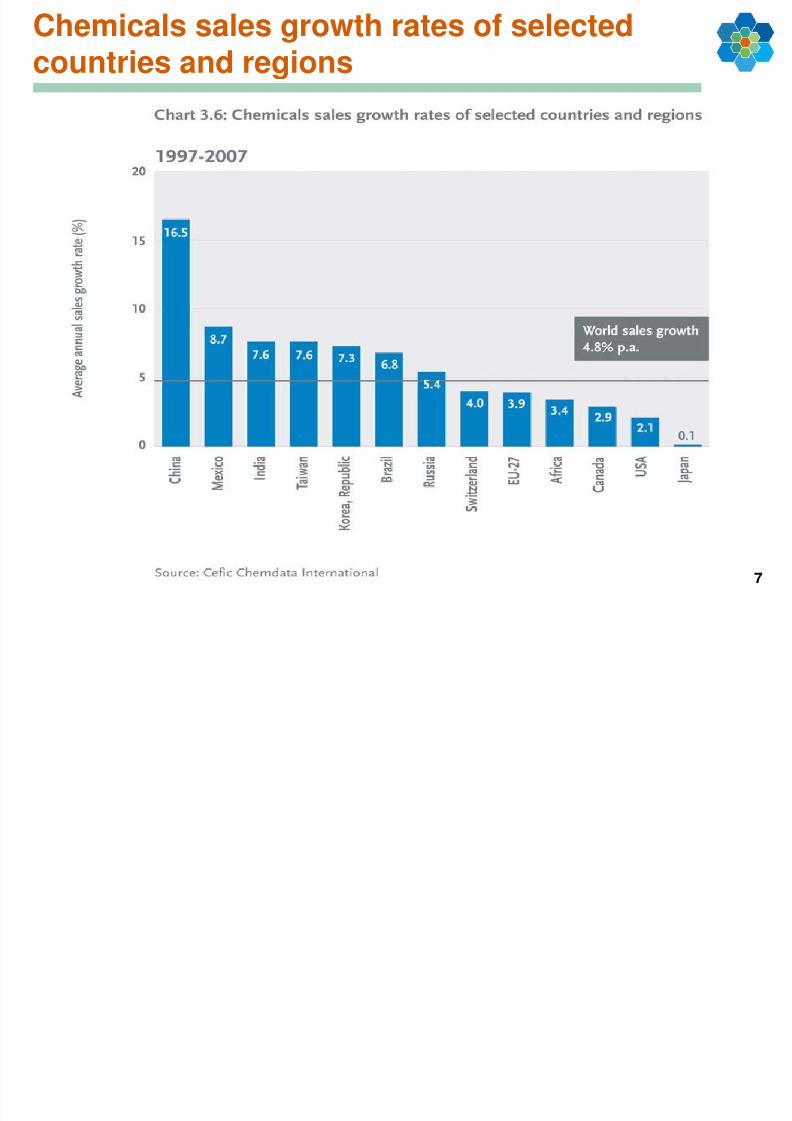
Chemicals sales growth rates of selectedcountries and regions
8/2/2019 LenaPerenius_Assessment of Key Resources
http://slidepdf.com/reader/full/lenapereniusassessment-of-key-resources 8/188
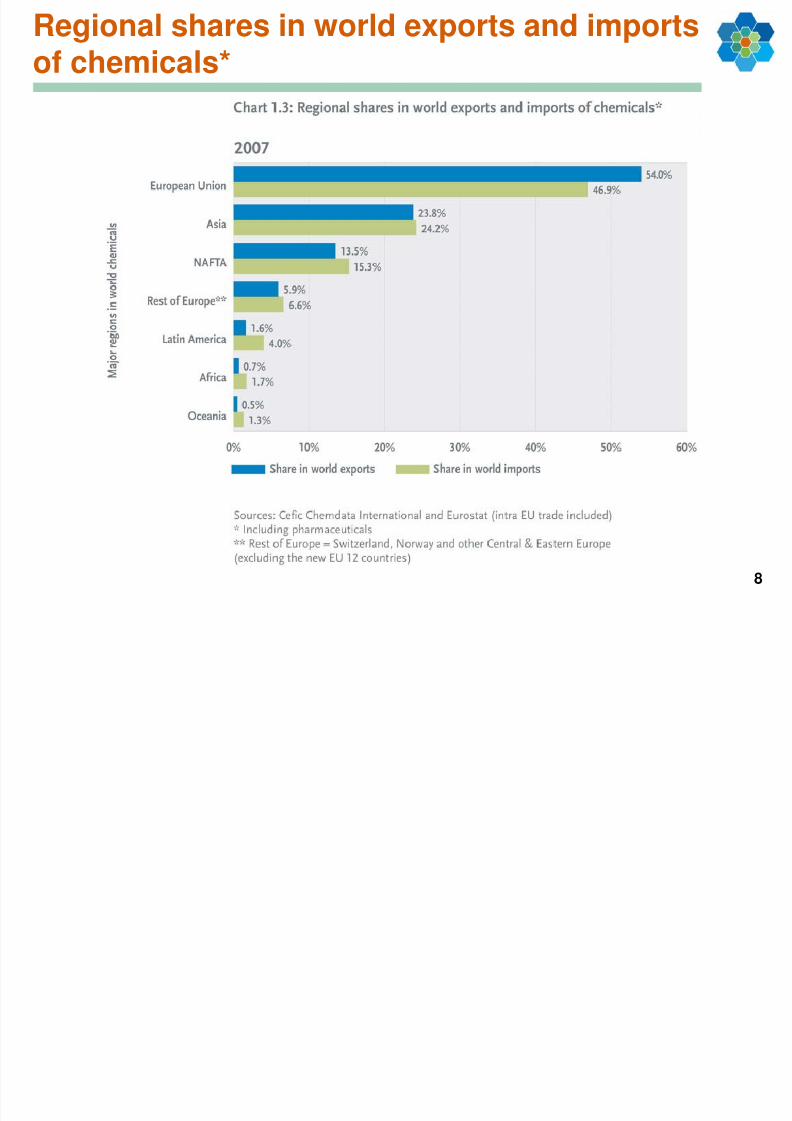
Regional shares in world exports and importsof chemicals*
8/2/2019 LenaPerenius_Assessment of Key Resources
http://slidepdf.com/reader/full/lenapereniusassessment-of-key-resources 9/189
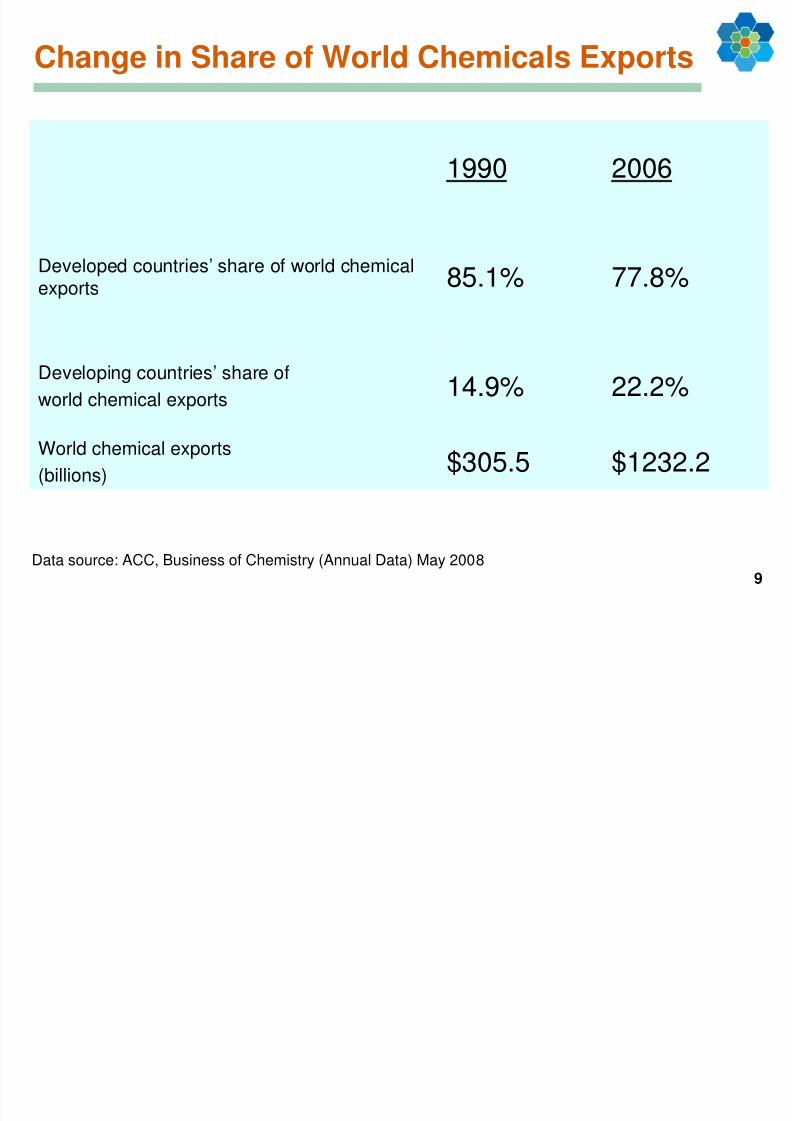
Change in Share of World Chemicals Exports
1990 2006
Developed countries’ share of world chemicalexports 85.1% 77.8%
Developing countries’ share of
world chemical exports14.9% 22.2%
World chemical exports
(billions)$305.5 $1232.2
Data source: ACC, Business of Chemistry (Annual Data) May 2008
8/2/2019 LenaPerenius_Assessment of Key Resources
http://slidepdf.com/reader/full/lenapereniusassessment-of-key-resources 10/1810
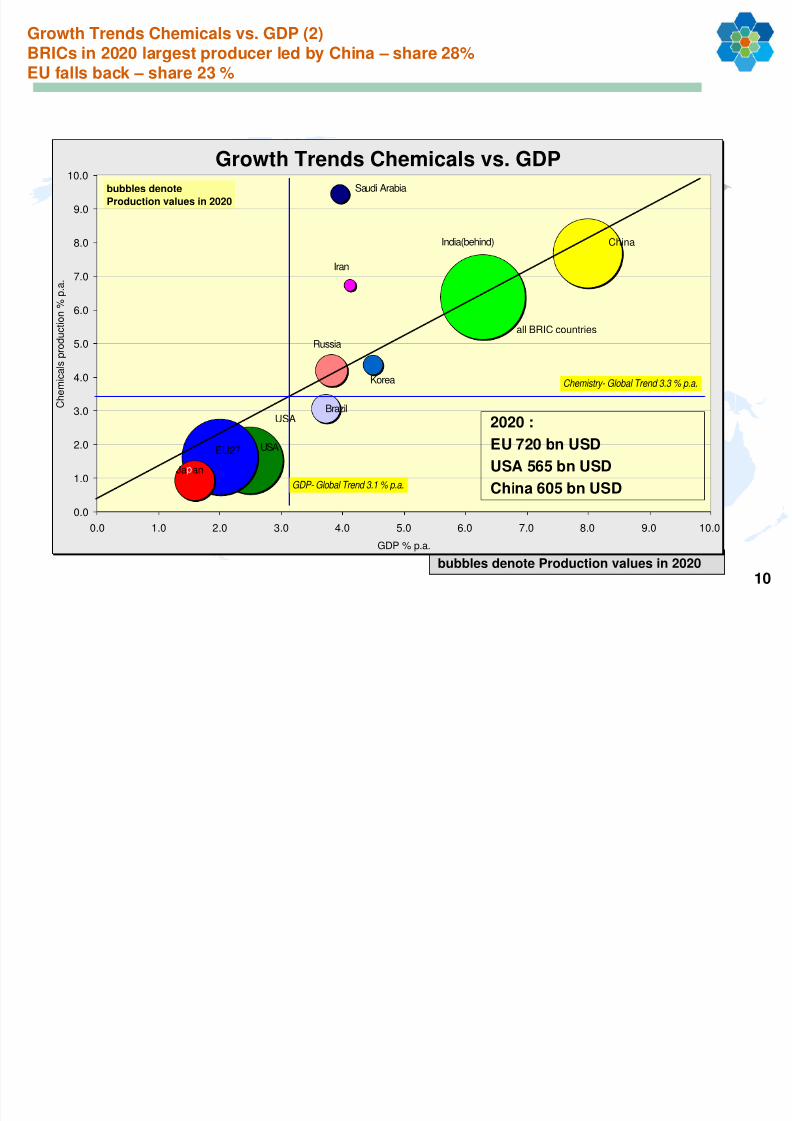
Growth Trends Chemicals vs. GDP (2)BRICs in 2020 largest producer led by China – share 28%EU falls back – share 23 %
bubbles denote Production values in 2020
Growth Trends Chemicals vs. GDP
0.0
1.0
2.0
3.0
4.0
5.0
6.0
7.0
8.0
9.0
10.0
0.0 1.0 2.0 3.0 4.0 5.0 6.0 7.0 8.0 9.0 10.0
GDP % p.a.
C h e m i c a l s p r o d u c t i o n
% p . a .
bubbles denote
Production values in 2020
EU27
USA
China
Ja an
India(behind)
Saudi Arabia
Iran
Korea
Russia
Brazil
all BRIC countries
USA
Chemistry- Global Trend 3.3 % p.a.
GDP- Global Trend 3.1 % p.a.
2020 :
EU 720 bn USD
USA 565 bn USD
China 605 bn USD
8/2/2019 LenaPerenius_Assessment of Key Resources
http://slidepdf.com/reader/full/lenapereniusassessment-of-key-resources 11/1811
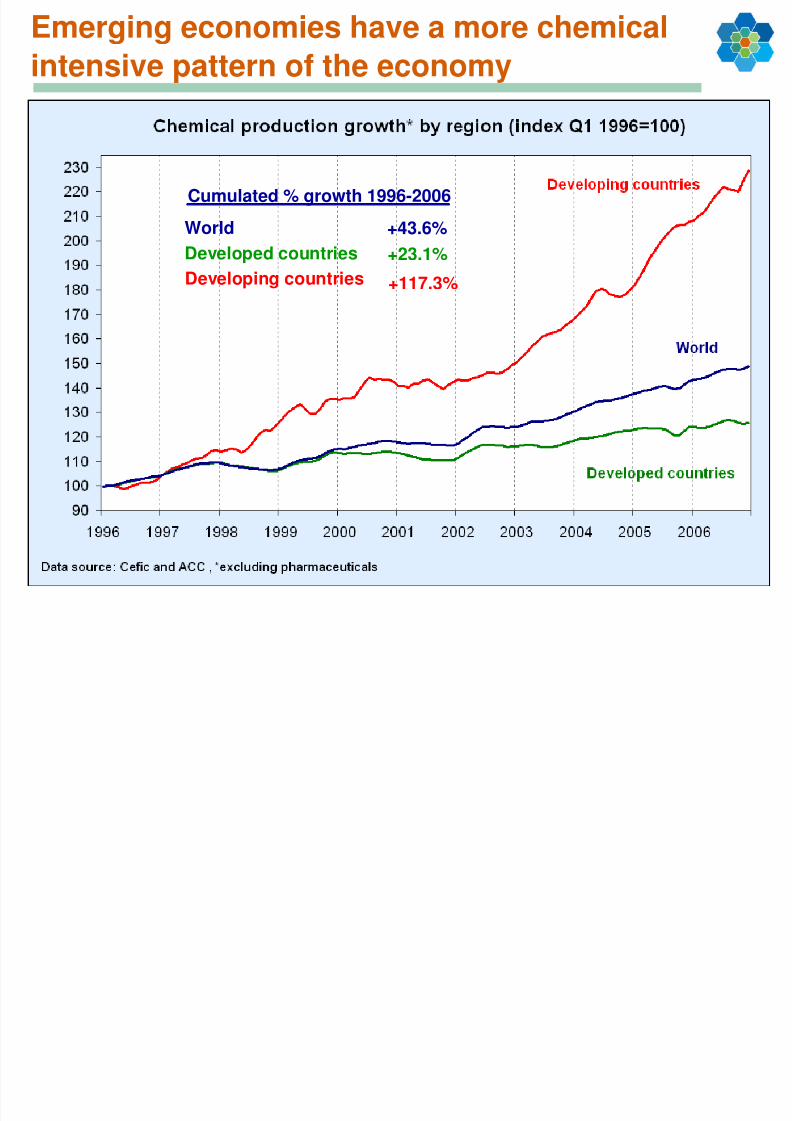
Emerging economies have a more chemical
intensive pattern of the economy
World
Developed countries
Developing countries +117.3%
Cumulated % growth 1996-2006
+43.6%
+23.1%
8/2/2019 LenaPerenius_Assessment of Key Resources
http://slidepdf.com/reader/full/lenapereniusassessment-of-key-resources 12/1812
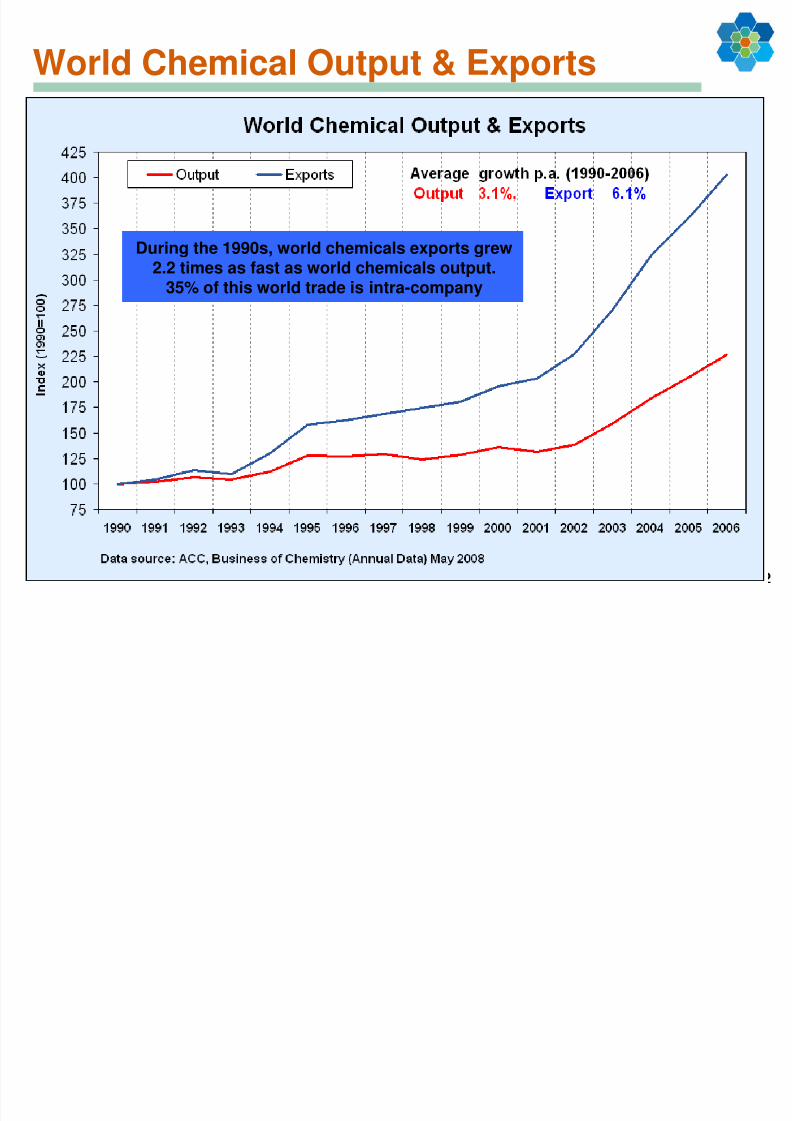
World Chemical Output & Exports
During the 1990s, world chemicals exports grew2.2 times as fast as world chemicals output.
35% of this world trade is intra-company
8/2/2019 LenaPerenius_Assessment of Key Resources
http://slidepdf.com/reader/full/lenapereniusassessment-of-key-resources 13/18
13
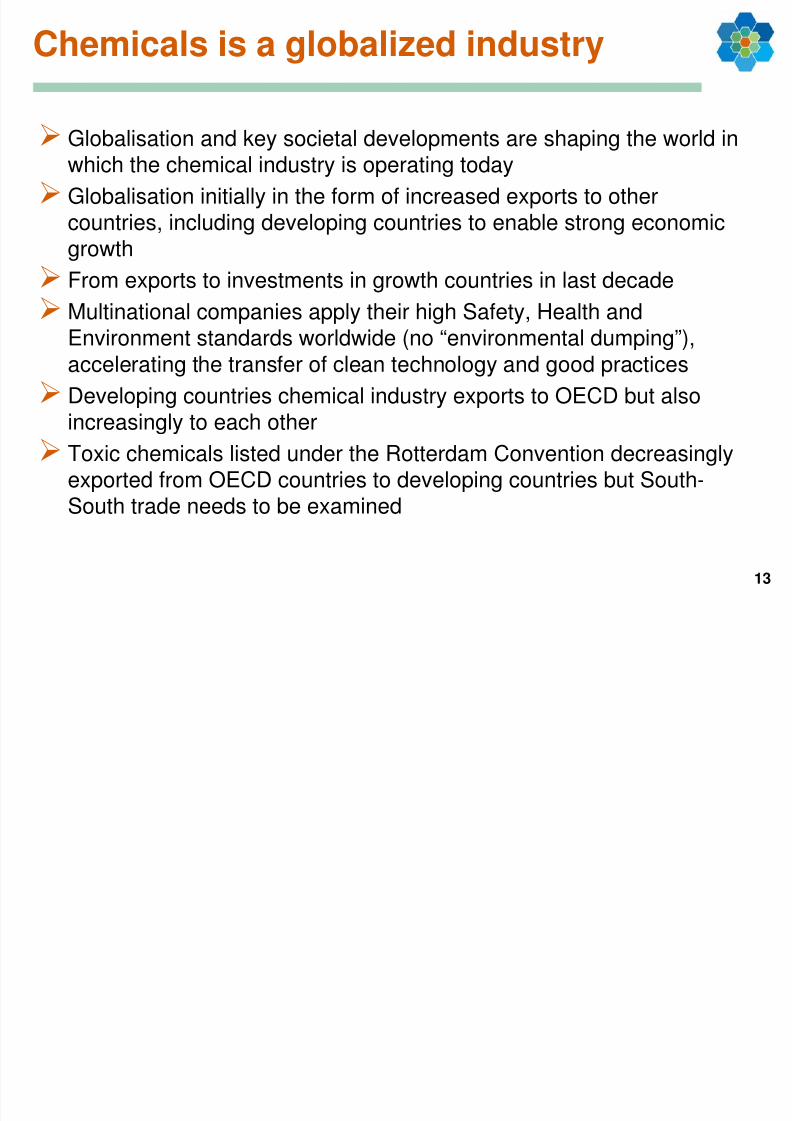
Globalisation and key societal developments are shaping the world inwhich the chemical industry is operating today
Globalisation initially in the form of increased exports to othercountries, including developing countries to enable strong economicgrowth
From exports to investments in growth countries in last decade
Multinational companies apply their high Safety, Health andEnvironment standards worldwide (no “environmental dumping”),accelerating the transfer of clean technology and good practices
Developing countries chemical industry exports to OECD but also
increasingly to each other
Toxic chemicals listed under the Rotterdam Convention decreasinglyexported from OECD countries to developing countries but South-South trade needs to be examined
Chemicals is a globalized industry

8/2/2019 LenaPerenius_Assessment of Key Resources
http://slidepdf.com/reader/full/lenapereniusassessment-of-key-resources 14/18
14
Back-up slides
Geographic breakdo n of orld chemicals
8/2/2019 LenaPerenius_Assessment of Key Resources
http://slidepdf.com/reader/full/lenapereniusassessment-of-key-resources 15/18
15
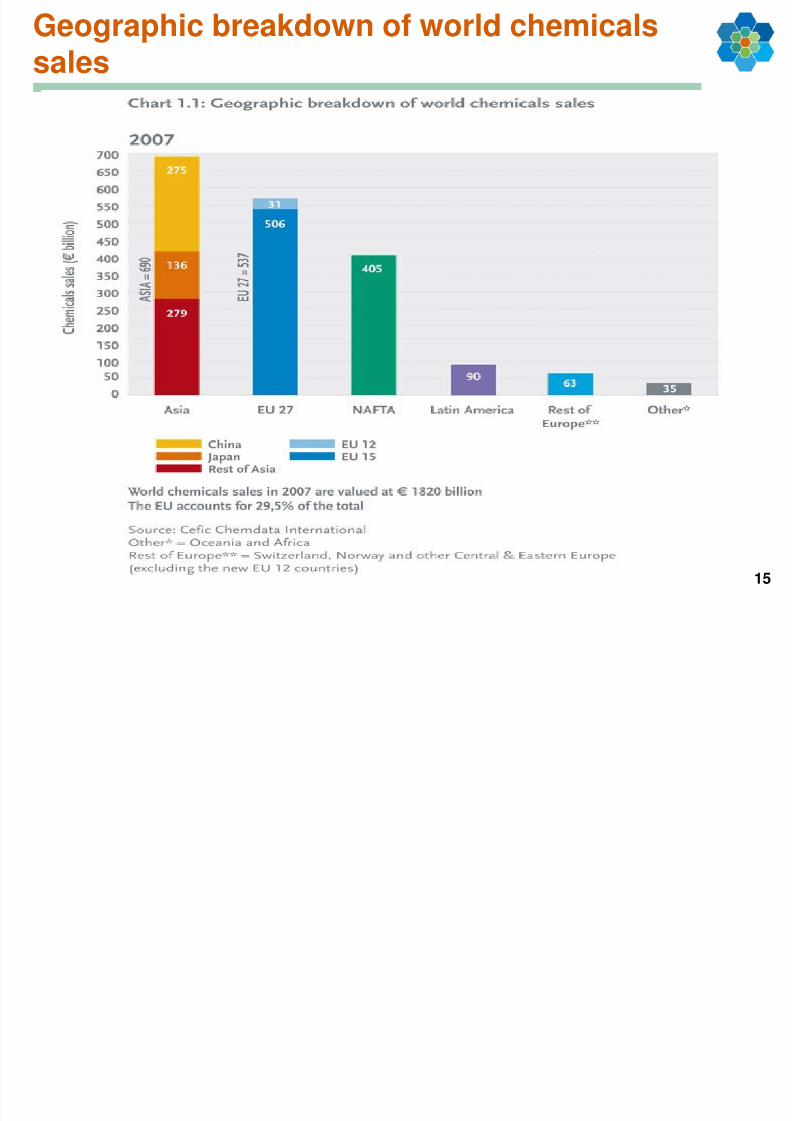
Geographic breakdown of world chemicalssales
Profile: Extra EU chemicals trade flows with
8/2/2019 LenaPerenius_Assessment of Key Resources
http://slidepdf.com/reader/full/lenapereniusassessment-of-key-resources 16/18
16
NAFTA26.1
35.3
LAC**3.0
6.6
Africa2.9
7.7Oceania
0.5
2.1
Rest ofEurope
32.4
21.9
Asia*26.1
26.0
Japan5.9
6.2
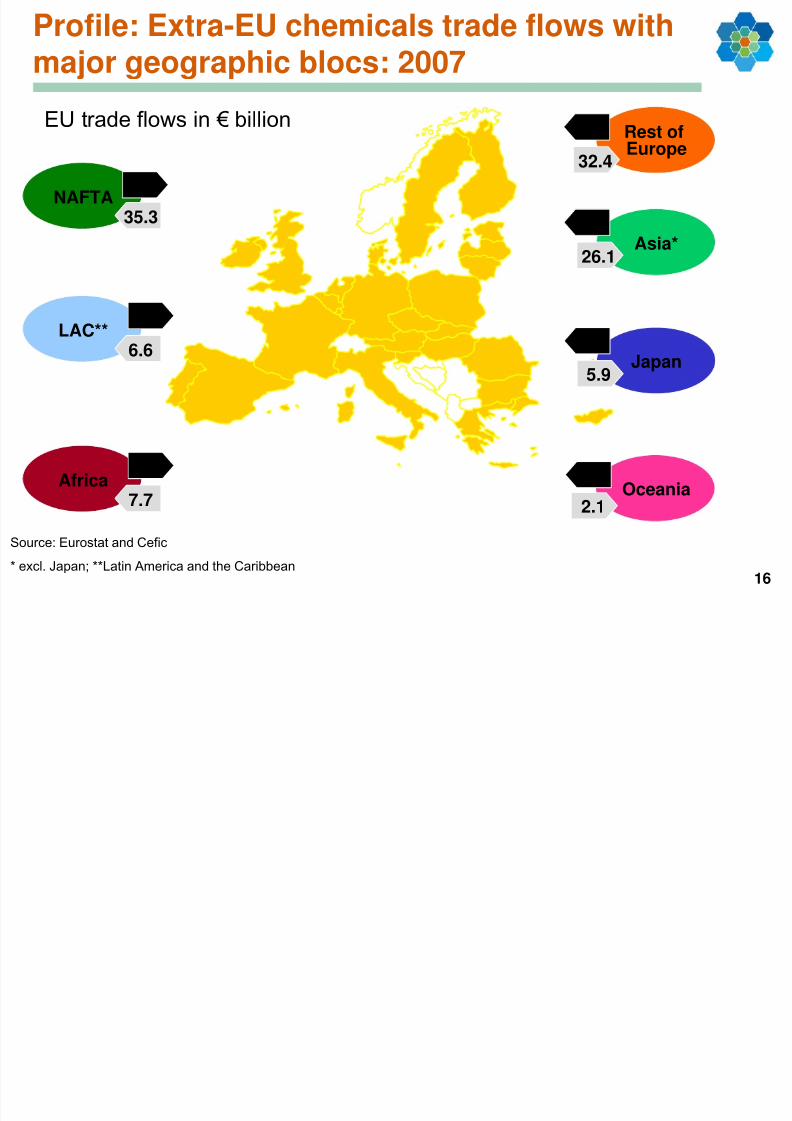
EU trade flows in € billion
Profile: Extra-EU chemicals trade flows withmajor geographic blocs: 2007
Source: Eurostat and Cefic
* excl. Japan; **Latin America and the Caribbean
8/2/2019 LenaPerenius_Assessment of Key Resources
http://slidepdf.com/reader/full/lenapereniusassessment-of-key-resources 17/18
17
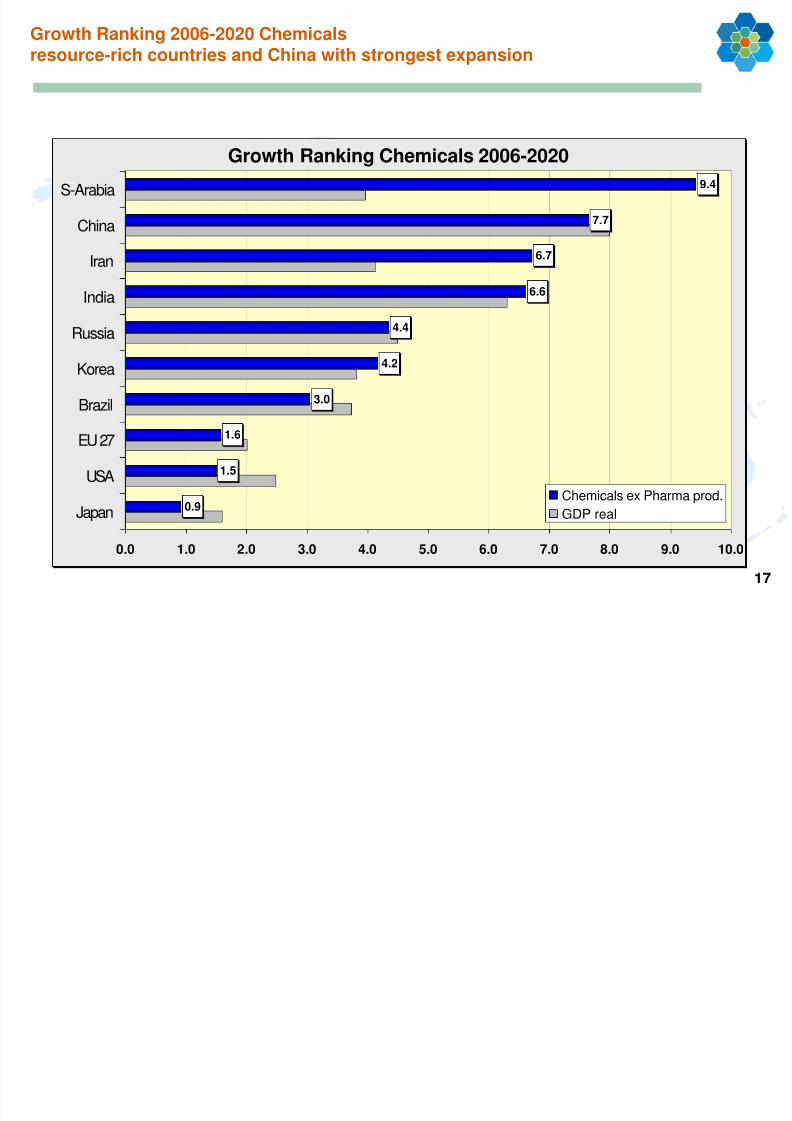
Growth Ranking 2006-2020 Chemicalsresource-rich countries and China with strongest expansion
Growth Ranking Chemicals 2006-2020
0.9
1.5
1.6
3.0
4.2
4.4
6.6
6.7
7.7
9.4
0.0 1.0 2.0 3.0 4.0 5.0 6.0 7.0 8.0 9.0 10.0
Japan
USA
EU 27
Brazil
Korea
Russia
India
Iran
China
S-Arabia
Chemicals ex Pharma prod.
GDP real
Chart 1 8: EU* chemicals industry
8/2/2019 LenaPerenius_Assessment of Key Resources
http://slidepdf.com/reader/full/lenapereniusassessment-of-key-resources 18/18
18
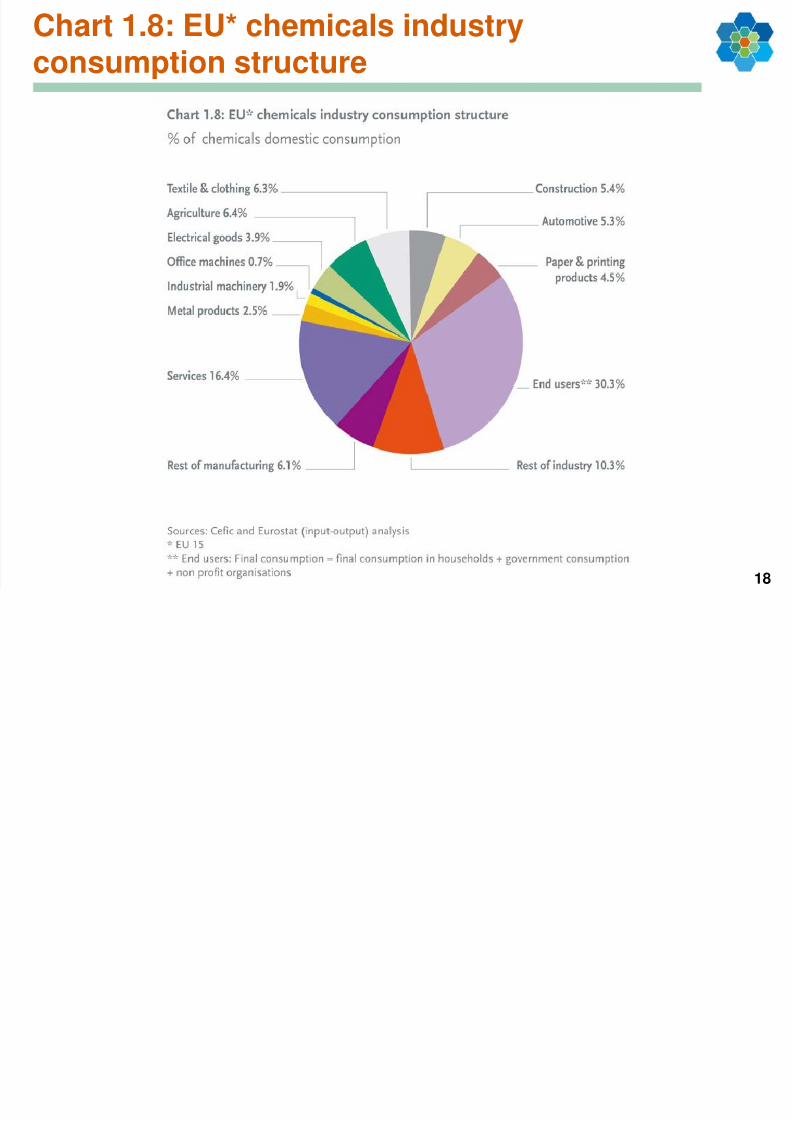
Chart 1.8: EU chemicals industryconsumption structure


![Human Resources Key Performance Indicators []](https://img.pdfslide.net/doc/110x75/5868d50f1a28ab3d018b8212/human-resources-key-performance-indicators-pdf-file.jpg)