Embed Size (px)
Citation preview
Journal of Agricultural and Applied Economics, 31,2(August 1999):201–2140 1999 Southern Agricultural Economics Association
Lending by Rural Banks Involved inMergers
Nicholas A. Walraven
ABSTRACT
This paper employed a variety of sources of data and a number of methods to describe
rural lending markets. Over the sample period, 1992 through 1998, there was a pronounced
trend towards affiliation of banks, both urban and rural, with holding companies, although
over this period there was little change in the concentration of banking offices in ruralareas. Using data from the 1993 National Survey of Small Business Finances, the study
found some evidence that rural small businesses were less likely to apply for a loan than
urban small firms although those rural firms that did apply were more likely to have their
application accepted.
Key Words: merger, rural banks
The purpose of this paper is to review dataregarding banking consolidation with a partic-ular focus on rural areas. The general themeof the paper is that rural markets and financialinstitutions may differ fundamentally from ur-ban ones. Thus one should perhaps distinguishthese markets when examining some of the ef-fects of consolidation on the borrowers in amarket area. For instance, the number and typeof banks that operate in rural areas may differsignificant y from the norm for urban markets.Also, rural borrowers may differ fundamen-tally from urban borrowers, and if this is true,the type of financial relationships that theymaintain also might differ. I plan to carry outthis examination of consolidation in ruralbanking markets by developing the three ma-jor themes outlined below.
Nicholas A. Walraven is affiliated with the Federal Re-serve Board/Federal Reserve System.
The views expressed in this paper are those of theauthor and do not indicate concurrence by the FederalReserve Board or the Federal Reserve System. I thankMelissa Post for research assistance and Jon Hacker,Linda Powell, and Hank Leddon for help in assemblingthe data.
In the first part of the paper I plan to doc-ument the incidence and character of structuralchanges in rural banking markets relative totheir urban counterparts. Using data from theNational Information Center (NIC) database,’I identified 3780 instances of structural changeamong commercial banks in the United Statesfrom January 1992 until September 1998 inwhich a banking charter disappeared. Thesechanges encompassed structural changesamong both urban and rural commercial banksand among independent banks as well as bankholding companies. The acquired institutionmay have become a branch of the purchasingbank or banking subsidiary or it may havebeen closed. Note that I included the closingof a banking office only when the closure wasa part of the consolidation; that is, I did notinclude closing of branches that had been op-
1A version of the National Information Center(NIC) database is available at www.ffiec.gov/nic/deafult.htm. The FDIC also maintains structure infor-mation at www2.fdic.gov/structur/search/ and WWW2.fdic.govlidl.
202 Journal of Agricultural and Applied Economics, August 1999
erated for a time after the date of consolida-tion.
1 also identified 3820 instances of changein the control of subsidiaries of bank holdingcompanies. These changes can either reflectpurchases of subsidiaries or independent banksby a top holding company or the purchase ofone top holding company by another.Throughout the paper an urban bank or sub-sidiary is one that is located in a MetropolitanStatistical Area (MSA), and its market area istaken as the entire MSA. A rural bank or sub-sidiary has its headquarters outside a MSA,and its market area is the county of the head-quarters of the bank or banking subsidiary.z Icombine these cases of structural transactionswith data from the quarterly reports of con-dition (Call reports) to characterize the finan-cial condition of both the target and acquiringinstitutions,
In the second section of the paper I developthe notion that structural activity in a bankingmarket need not necessarily lead to more con-centration. For instance, if a bank holding com-pany acquires banking entities in a marketwhere previously it had not operated, then it isnot immediately clear whether or not that mar-ket will become more concentrated. Indeed, im-mediately following such a transaction the mostcommon measure of the competitiveness of amarket, the Herfindahl-Hirshman Index (HHI),which is the sum of the squared market sharesof all the competitors in the market, would re-main unchanged. Similarly, the conversion ofa bank or a banking subsidiary into a branchdoes not automatically increase the HHI, and,in a more intuitive sense, if the banking officeremains open under the control of a bank thatpreviously was not in the market it is not clearwhether customers in the banking market havetheir choices restricted.
I plan to document the concentration aris-ing from structural reorganization of banks bylooking at changes in the HHI calculated from
2Keeton (1996) found that acquisitions by out-of-state bank holding companies reduced the levels oflending by the subsidiary that was acquired. Out-of-state acquisitions are not distinguished from others inthe cument paper.
the deposits originating in each banking mar-ket. In this part of the paper, rural banks, sub-sidiaries, or branches are those located outsideMS AS, although I list as rural a rural subsid-iary or branch that is controlled by an urbanholding company. While it is almost tautolog-ically true that rural markets have a higherHHI than urban markets, it does not followthat the degree of concentration given by thismeasure has risen significantly in recent yearsin rural markets.
A final difference between urban and rurallending markets likely lies in the financialcharacteristics of the potential borrowers ineach market. I use data from the Federal Re-serve’s 1993 Survey of Small Business Fi-nances to examine differences between urbanand rural small businesses and their financing.In this part of the paper, rural borrowers aretaken to be those where the main offices ofthe business are outside a MSA.
The Incidence of Structural Change inBanking Markets
Structural changes were identified as a changein any one of several parts of the NIC databasefor a commercial bank. First, a banking chartercan disappear as a result of a bank merger.Second, a bank holding company may pur-chase some of the subsidiaries of another bankholding company, changing the control of thesubsidiary but otherwise leaving the charterunchanged. Finally, a bank or bank holdingcompany may purchase a bank holding com-pany (and all of its subsidiaries) changing onlythe holding company structure but not thecharacter of individual subsidiary banks.Counting these three types of structural trans-actions, 7600 instances of structural changeoccurred during 1992 through September1998, and 3488 of these transactions involvedrural targets, either independent banks or sub-sidiaries. I consider only targets that werecommercial banks, although acquirers may beother banks, thrifts, savings banks, bank hold-ing companies, or nonbank holding compa-nies.
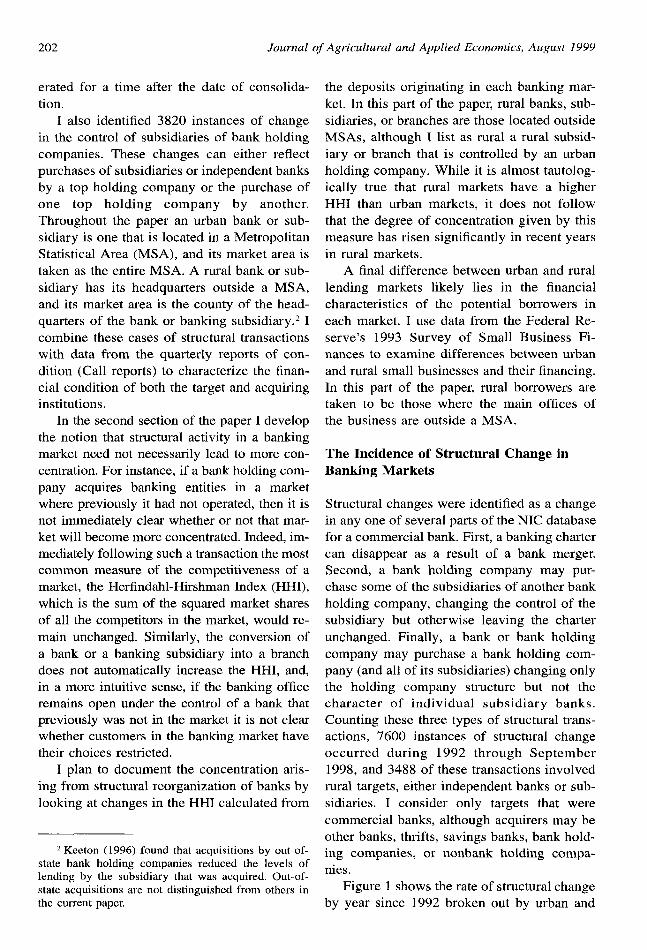
Figure 1 shows the rate of structural changeby year since 1992 broken out by urban and
Walraven: Rural Banks Involved in Mergers 203
, ,- Legend
6
v
1992 1993 1994 1995 1996 1997 1998
Figure 1. The incident of urban and ruralconsolidation*
rural targets. Roughly 45 percent of all bankmerger activity during this period has involvedrural targets, and the proportion of mergerswith rural targets has remained fairly constantover that period, even though rural banks ac-count for only about one third of the numberof commercial banks. Because rural bankstend to be more profitable than urban banks ofa similar size, rural markets might be expectedto attract entrants (as discussed in Rhoades1995 and elsewhere), and some of this entrymight manifest itself in a higher rate of con-solidation as entrants buy up existing bankingoperations.
Table 1 displays the means of several char-acteristics of urban and rural targets of take-overs, as well as a simple t-test of the differ-ence in the means of the characteristics.q
7Test for the equality of the variance for urban ver-
Roughly three fourths of both urban and ruraltargets were affiliated with a bank holdingcompany before the merger, and although ur-ban targets were slightly more likely to be inholding companies before the merger, the dif-ference was statistically insignificant. Urbantargets were significantly larger than rural tar-gets. The return on assets (ROA) was signifi-cantly lower for urban targets than for ruralones over the sample period, although this re-sult obscures a rather pronounced tendencyearly in the sample period (1992 to 1994) forrural banks to have significantly higher ROASthan urban banks, while in the last few years,the difference has been insignificant. This di-vergence over the period under study almostexactly mirrors the results for the delinquencyrate, which is significantly lower for rural tar-gets in 1992 through 1994. Finally, rural banksthat were acquired held a significantly lowerfraction of their assets as loans than urbanbanks that were acquired.
Although, as mentioned above, both urbanand rural targets tended to be members ofbank holding companies, the prevalence ofthis type of organizational structure has grownmuch more quickly for rural banks than forurban banks in recent years. Looking throughthe data from the Call reports, about 73 per-cent of commercial banks with headquarters inrural areas were members of holding compa-
sus ruraitargetsindicatedthatsome of the t-statisticswere not strictly valid. Nevertheless,approximatet-testson the differencesbetween characteristicsof ur-ban and ruraltargetsassumingthatthe variancedif-fered between urbanand ruraltargetswere consistentwiththe regulart-tests.
Table 1. Average of Financial Variables and Characteristics of Targets of Acquisitions 1992–
T-statistic for
Variable Urban Banks Rural Banks difference
BHC Member (percent) 74.3 73.5 0.8
Assets (million dollars) 732 87 91**
ROA (percent) 0.75 1.00 –2.2*
Delinquent/Total Loans (percent) 3.5 3.1 4.8**
Total Loans/Assets (percent) 58.1 54.7 9.4**
** Statistically significant at the 1-percent Ieve[.
* Statistically significant at the 5-percent level.
204
10000
8000
6000
$
~
4000
2000
(1 L1992
Rural
Journal of Agricultural and Applied Economics, August 1999
LegendI 95% ‘a 90% m 75% ! 50%! 25% * 10!4 5%
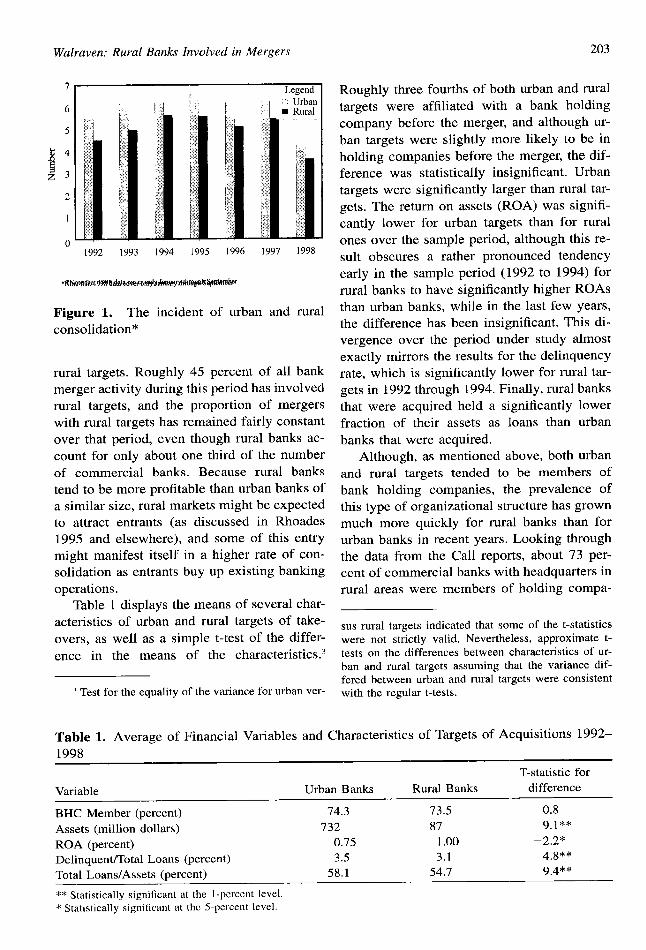
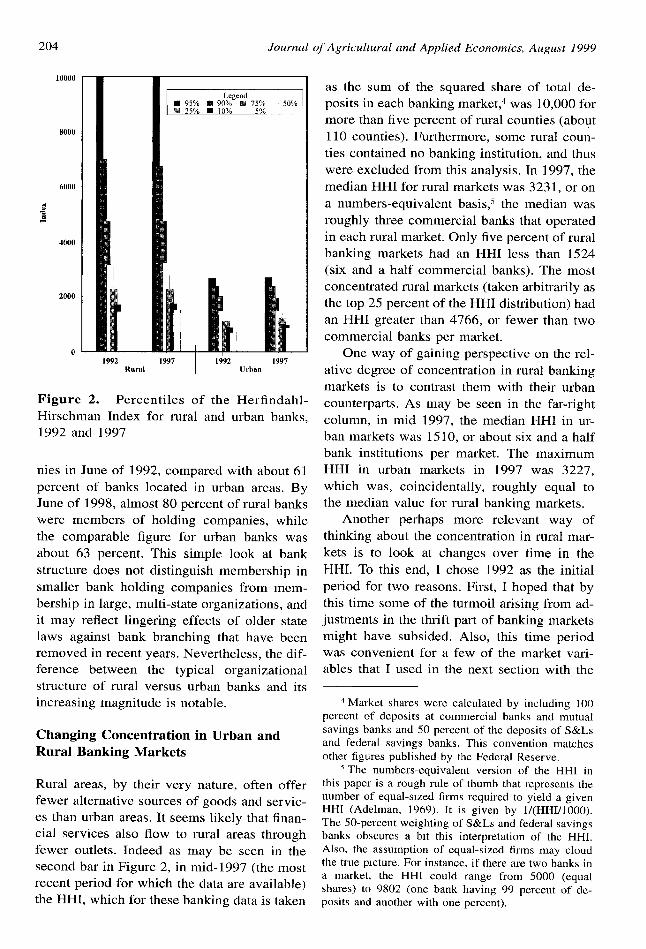
Figure 2. Percentiles of the Herfindahl-
Hirschman Index for rural and urban banks,1992 and 1997
nies in June of 1992, compared with about 61percent of banks located in urban areas. ByJune of 1998, almost 80 percent of rural bankswere members of holding companies, whilethe comparable figure for urban banks wasabout 63 percent. This simple look at bankstructure does not distinguish membership insmaller bank holding companies from mem-bership in large, multi-state organizations, andit may reflect lingering effects of older statelaws against bank branching that have beenremoved in recent years. Nevertheless, the dif-ference between the typical organizationalstructure of rural versus urban banks and itsincreasing magnitude is notable.
Changing Concentration in Urban andRural Banking Markets
Rural areas, by their very nature, often offerfewer alternative sources of goods and servic-es than urban areas. It seems likely that finan-cial services also flow to rural areas throughfewer outlets. Indeed as may be seen in thesecond bar in Figure 2, in mid-1997 (the mostrecent period for which the data are available)the HHI, which for these banking data is taken
as the sum of the squared share of total de-
posits in each banking market,4 was 10,000 for
more than five percent of rural counties (about
110 counties). Furthermore, some rural coun-
ties contained no banking institution, and thus
were excluded from this analysis. In 1997, themedian HHI for rural markets was 3231, or ona numbers-equivalent basis,~ the median wasroughly three commercial banks that operatedin each rural market. Only five percent of ruralbanking markets had an HHI less than 1524(six and a half commercial banks), The mostconcentrated rural markets (taken arbitrarily asthe top 25 percent of the HHI distribution) hadan HHI greater than 4766, or fewer than twocommercial banks per market.
One way of gaining perspective on the rel-ative degree of concentration in rural bankingmarkets is to contrast them with their urbancounterparts. As may be seen in the far-rightcolumn, in mid 1997, the median HHI in ur-ban markets was 1510, or about six and a halfbank institutions per market. The maximumHHI in urban markets in 1997 was 3227,which was, coincidentally, roughly equal tothe median value for rural banking markets.
Another perhaps more relevant way ofthinking about the concentration in rural mar-kets is to look at changes over time in theHHI. To this end, I chose 1992 as the initialperiod for two reasons. First, I hoped that bythis time some of the turmoil arising from ad-justments in the thrift part of banking marketsmight have subsided. Also, this time periodwas convenient for a few of the market vari-ables that I used in the next section with the
4Market shares were calculated by including 100percent of deposits at commercial banks and mutualsavings banks and 50 percent of the deposits of S&Lsand federal savings banks. This convention matchesother figures published by the Federal Reserve.
f The numbers-equivalent version of the HHI inthis paper is a rough rule of thumb that represents thenumber of equal-sized firms required to yield a givenHHI (Adelman, 1969), It is given by l/( HHI/1000).The 50-percent weighting of S&Ls and federal savingsbanks obscures a btt this interpretation of the HHI.Also, the assumption of equal-sized firms may cloudthe true picture. For instance, if there are two banks ina market, the HHI could range from 5000 (equalshares) to 9802 (one bank having 99 percent of de-posits and another with one percent).
Walraven: Rural Banks Involved in Mergers 205
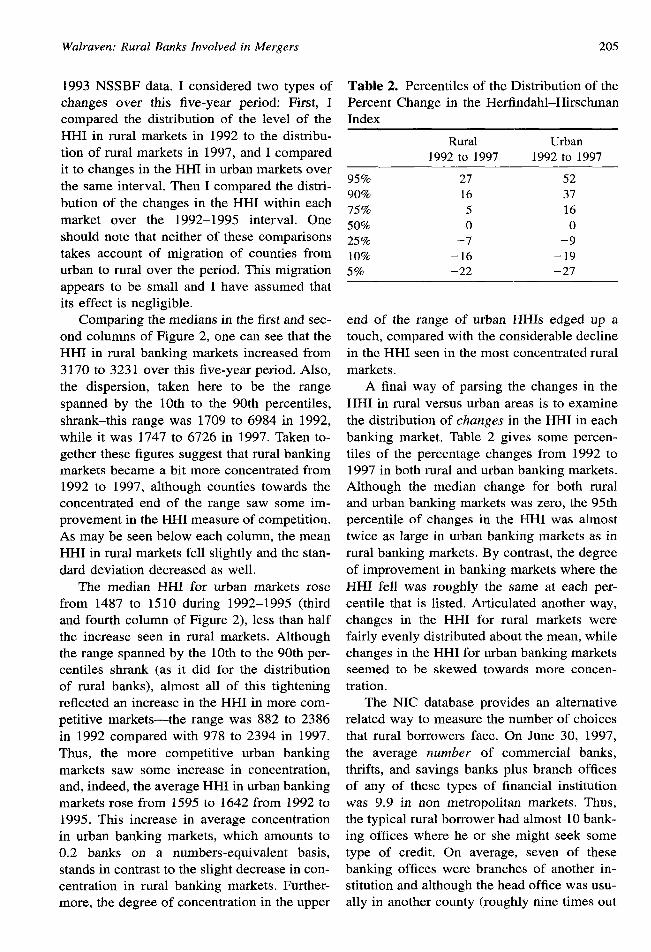
1993 NSSBF data. I considered two types ofchanges over this five-year period: First, Icompared the distribution of the level of theHHI in rural markets in 1992 to the distribu-tion of rural markets in 1997, and I comparedit to changes in the HHI in urban markets overthe same interval. Then I compared the distri-bution of the changes in the HHI within eachmarket over the 1992–1 995 interval. Oneshould note that neither of these comparisonstakes account of migration of counties fromurban to rural over the period. This migrationappears to be small and I have assumed thatits effect is negligible,
Comparing the medians in the first and sec-ond columns of Figure 2, one can see that theHHI in rural banking markets increased from3170 to 3231 over this five-year period. Also,the dispersion, taken here to be the rangespanned by the 10th to the 90th percentiles,shrank-this range was 1709 to 6984 in 1992,while it was 1747 to 6726 in 1997. Taken to-gether these figures suggest that rural bankingmarkets became a bit more concentrated from1992 to 1997, although counties towards theconcentrated end of the range saw some im-provement in the HHI measure of competition.As may be seen below each column, the meanHHI in rural markets fell slightly and the stan-dard deviation decreased as well.
The median HHI for urban markets rosefrom 1487 to 1510 during 1992–1995 (thirdand fourth column of Figure 2), less than halfthe increase seen in rural markets. Althoughthe range spanned by the 10th to the 90th per-centiles shrank (as it did for the distributionof rural banks), almost all of this tighteningreflected an increase in the HHI in more com-petitive markets-the range was 882 to 2386in 1992 compared with 978 to 2394 in 1997.Thus, the more competitive urban bankingmarkets saw some increase in concentration,and, indeed, the average HHI in urban bankingmarkets rose from 1595 to 1642 from 1992 to1995. This increase in average concentrationin urban banking markets, which amounts to0.2 banks on a numbers-equivalent basis,stands in contrast to the slight decrease in con-centration in rural banking markets. Further-more, the degree of concentration in the upper
Table 2. Percentiles of the Distribution of thePercent Change in the Herfindahl-HirschmanIndex
Rural Urban1992 to 1997 1992 to 1997
9570 27 5290% 16 37
75% 5 16
50~o o 0
25yo –7 –9
1090 –16 –19
5~o –22 –27
end of the range of urban HHIs edged up atouch, compared with the considerable declinein the HHI seen in the most concentrated ruralmarkets.
A final way of parsing the changes in theHHI in rural versus urban areas is to examinethe distribution of changes in the HHI in eachbanking market, Table 2 gives some percen-tiles of the percentage changes from 1992 to1997 in both rural and urban banking markets.Although the median change for both ruraland urban banking markets was zero, the 95thpercentile of changes in the HHI was almosttwice as large in urban banking markets as inrural banking markets. By contrast, the degreeof improvement in banking markets where theHHI fell was roughly the same at each per-centile that is listed, Articulated another way,changes in the HHI for rural markets werefairly evenly distributed about the mean, whilechanges in the HHI for urban banking marketsseemed to be skewed towards more concen-tration.
The NIC database provides an alternativerelated way to measure the number of choicesthat rural borrowers face. C)n June 30, 1997,the average number of commercial banks,thrifts, and savings banks plus branch officesof any of these types of financial institutionwas 9.9 in non metropolitan markets. Thus,the typical rural borrower had almost 10 bank-ing offices where he or she might seek sometype of credit. On average, seven of thesebanking offices were branches of another in-stitution and although the head office was usu-ally in another county (roughly nine times out
206 Journal of Agricultural and Applied Economics, August 1999
of 10) the head office was within the samestate as the branch. Not surprisingly, urbanbanking markets had many more banks andbranches—the average number was 1030, al-though this average was lifted substantially bythe largest cities.
As was the case when the HHI values for1997 were compared with those from 1992,there was little substantial change in the com-plexion of rural banking markets when onecompares the number of offices in 1992 and1997. On average, there were 9,3 banking of-fices in each rural banking market in 1992, andabout six of these offices were branches. Thehead office of these branches was again usu-ally in the same state as the branch, and almosthalf of the branches had head offices in thesame county as the branch.
Characteristics of Rural Small BusinessBorrowers
The preceding sections of the paper have fo-cussed on the characteristics of rural bankingmarkets relative to their urban counterparts. Ihave documented a number of differences inthe nature of the market itself and of the banksthat are targets of acquisitions. In this sectionI compare rural versus urban small businessfirms,using data from the Federal Reserve’s1993 Survey of Small Business Finances(NSSBF), which was co-sponsored and co-funded by the Federal Reserve Board and theU.S. Small Business Administration.G firmssurveyed constitute a nationally representativesample of small businesses operating in theUnited States as of yem-end 1992, where asmall business is defined as a non-financial,non-farm business employing fewer than 500full-time equivalent employees. The samplewas stratified by nine Census regions, urbanor rural location,7 employment size, race, and
~For a detaileddescriptionof the 1993 NSSBF, see
Cole and Woken (1995). For a description of the 1987NSSBF which was used by Petersen and Rajan (1994)and Berger and Udell (1995), see Elliehausen andWolken (1990).
7 The data were stratified by urban and rural loca-tion, and this suggests that statistical comparisonsshould take account of this stratification. Thus, the sim-ple statistics presented here should not be taken as es-timates for the U.S. as a whole.
ethnicit y. Data from the 1993 NSSBF arebroadly representative of approximately 5.0million firms operating in the U.S. as of year-end 1992.
The 1993 NSSBF provides information oneach firm’s balance sheet, income statement,and credit history. The survey also collectedother characteristics of the firm-includingstandard industrial classification, organization-al form, and age—as well as demographiccharacteristics of each firm’s primary owner,including age, education, experience, andcredit history.
The survey also provides detailed infor-
mation about each firm’s most recent borrow-ing experience (the experience may have oc-curred from 1991 –1 994.), including whetheror not the firm applied for credit, the identityand characteristics of the potential lender towhich the firm applied, what other financialservices (if any) the firm obtained from thatpotential lender, whether the potential lenderdenied or extended credit to the firm, and, ifthe lender extended credit, the terms of theloan.
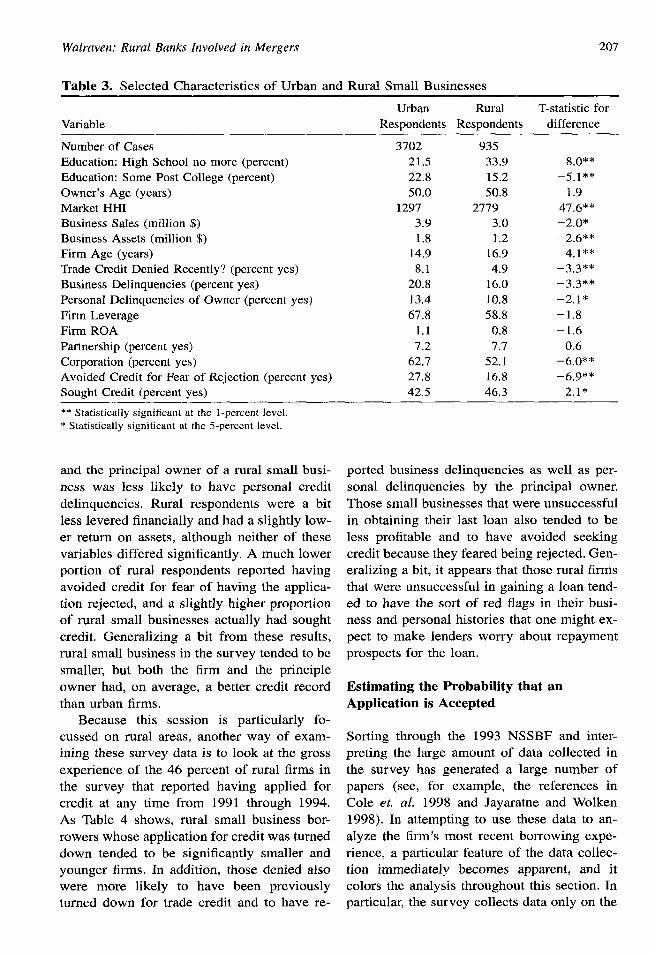
In total, there are 4637 firms in the 1993NSSBE Businesses located in rural areas ac-counted for about 20 percent of respondents.Table 3 contains a simple comparison of themeans of the sample, and I plan to discussonly those differences between urban and ruralsmall businesses that seem likely to influencethe subsequent estimations. The subsequentestimations take account of the samplingweights from the survey, and thus they pro-vide a more accurate comparison of the char-acteristics of urban and rural borrowers.
As may be seen in the first few lines ofTable 3, owners of rural small businesses inthe survey had significantly less schoolingthan their urban counterparts, even thoughboth urban and rural owners were roughly thesame age (50 years). Rural small businesses inthe survey were significantly smaller in termsof either sales or assets, even though the ruralsmall businesses had existed for two moreyears, on average, than urban respondents. Ru-ral survey participants were significantly lesslikely to have had trade credit denied or tohave been delinquent on business obligations,
Walraven: Rural Banks Involved in Mergers 207
Table 3. Selected Characteristics of Urban and Rural Small Businesses
Urban Rural T-statistic for
Variable Responclents Respondents difference
Number of Cases 3702 935Education: High School no more (percent) 21.5 33,9 80**
Education: Some Post College (percent) 22.8 15.2 –5,1**
Owner’s Age (years) 50.0 50.8 1.9Market HHI 1297 2779 47.6**Business Sales (million $) 3.9 3.0 _20*
Business Assets (million $) 1.8 1.2 –2.6**
Firm Age (years) 14.9 16.9 4,1**
Trade Credit Denied Recently? (percent yes) 8.1 4.9 –3.3**
Business Delinquencies (percent yes) 20.8 16.0 –3.3**
Personal Delinquencies of Owner (percent yes) 13.4 10.8 –2.1*
Firm Leverage 67,8 58.8 –1.8
Firm ROA 1.1 0.8 –1,6
Partnership (percent yes) 7.2 7.7 0.6
Corporation (percent yes) 62.7 52.1 –60**
Avoided Credit for Fear of Rejection (percent yes) 27.8 16,8 –69**
Sought Credit (percent yes) 42.5 46.3 2.1*
** Stati~ticallY significant at the l-percent level.
* Statistically significant at the 5-percent level.
and the principal owner of a rural small busi-ness was less likely to have personal creditdelinquencies. Rural respondents were a bitless levered financially and had a slightly low-er return on assets, although neither of thesevariables differed significantly. A much lowerportion of rural respondents reported havingavoided credit for fear of having the applica-tion rejected, and a slightly higher proportionof rural small businesses actually had soughtcredit. Generalizing a bit from these results,rural small business in the survey tended to besmaller, but both the firm and the principleowner had, on average, a better credit recordthan urban firms.
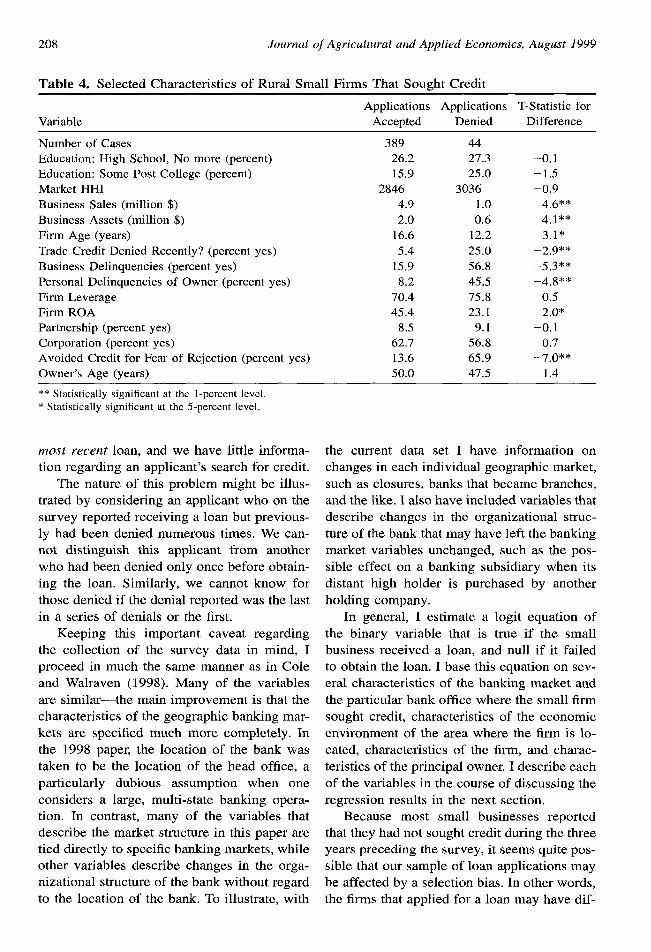
Because this session is particularly fo-cussed on rural areas, another way of exam-ining these survey data is to look at the grossexperience of the 46 percent of rural firms inthe survey that reported having applied forcredit at any time from 1991 through 1994.As Table 4 shows, rural small business bor-rowers whose application for credit was turneddown tended to be significantly smaller andyounger firms. In addition, those denied alsowere more likely to have been previouslyturned down for trade credit and to have re-
ported business delinquencies as well as per-sonal delinquencies by the principal owner.Those small businesses that were unsuccessfulin obtaining their last loan also tended to beless profitable and to have avoided seekingcredit because they feared being rejected. Gen-eralizing a bit, it appears that those rural firmsthat were unsuccessful in gaining a loan tend-ed to have the sort of red flags in their busi-ness and personal histories that one might ex-pect to make lenders worry about repaymentprospects for the loan.
Estimating the Probability that anApplication is Accepted
Sorting through the 1993 NSSBF and inter-preting the large amount of data collected inthe survey has generated a large number ofpapers (see, for example, the references inCole et. al. 1998 and Jayaratne and Wolken1998). In attempting to use these data to an-alyze the firm’s most recent borrowing expe-rience, a particular feature of the data collec-tion immediately becomes apparent, and itcolors the analysis throughout this section. Inparticular, the survey collects data only on the
208 Journal of Agricultural and Applied Economics, August 1999
Table 4. Selected Characteristics of Rural Small Firms That Sought Credit
Applications Applications T-Statistic forVariable Accepted Denied Difference
Number of Cases 389 44Education: High School, No more (percent) 26.2 27.3 –0.1
Education: Some Post College (percent) 15.9 25.0 –1.5Market HHI 2846 3036 –0.9
Business Sales (million $) 4.9 1.0 46**
Business Assets (million $) 2.0 0.6 4.1**
Firm Age (years) 16.6 12.2 3.1*
Trade Credit Denied Recently? (percent yes) 5.4 25.0 –2.9**
Business Delinquencies (percent yes) 15.9 56.8 –5.3**
Personal Delinquencies of Owner (percent yes) 8.2 45.5 –4.8**
Firm Leverage 70.4 75.8 –0.5
Firm ROA 45.4 23.1 20*
Partnership (percent yes) 8.5 9.1 –0.1
Corporation (percent yes) 62.7 56.8 0.7
Avoided Credit for Fear of Rejection (percent yes) 13.6 65.9 _7.o**
Owner’s Age (years) 50.0 47.5 1.4
** ,Statistically significant at the l-percent level.
* Statistically significant at the 5-percent level.
most recent loan, and we have little informa-tion regarding an applicant’s search for credit.
The nature of this problem might be illus-trated by considering an applicant who on thesurvey reported receiving a loan but previous-ly had been denied numerous times. We can-not distinguish this applicant from anotherwho had been denied only once before obtain-ing the loan. Similarly, we cannot know forthose denied if the denial reported was the lastin a series of denials or the first.
Keeping this important caveat regardingthe collection of the survey data in mind, Iproceed in much the same manner as in Coleand Walraven (1998). Many of the variablesare similar—the main improvement is that thecharacteristics of the geographic banking mar-kets are specified much more completely. Inthe 1998 paper, the location of the bank wastaken to be the location of the head office, aparticularly dubious assumption when oneconsiders a large, multi-state banking opera-tion. In contrast, many of the variables thatdescribe the market structure in this paper aretied directly to specific banking markets, whileother variables describe changes in the orga-nizational structure of the bank without regardto the location of the bank. To illustrate, with
the current data set I have information onchanges in each individual geographic market,such as closures, banks that became branches,and the like. I also have included variables thatdescribe changes in the organizational struc-ture of the bank that may have left the bankingmarket variables unchanged, such as the pos-sible effect on a banking subsidiary when itsdistant high holder is purchased by anotherholding company.
In general, I estimate a logit equation ofthe binary variable that is true if the smallbusiness received a loan, and null if it failedto obtain the loan. I base this equation on sev-eral characteristics of the banking market andthe particular bank office where the small firmsought credit, characteristics of the economicenvironment of the area where the firm is lo-cated, characteristics of the firm, and charac-teristics of the principal owner. I describe eachof the variables in the course of discussing theregression results in the next section.
Because most small businesses reportedthat they had not sought credit during the threeyears preceding the survey, it seems quite pos-sible that our sample of loan applications maybe affected by a selection bias. In other words,the firms that applied for a loan may have dif-
Walraven: Rural Banks Involved in Mergers 209
fered fundamentally from firms that did notapply, and this difference may have affectedour parameter estimates in a systematic way.An elegant description of this type of econo-metric situation, as well as an effective intui-tive remedy was first given in Heckrnan.
Following the general pattern of Heck-man’s approach in our problem, we first use aprobit regression to estimate the probabilitythat the small business sought a loan in theperiod covered by the survey. Then, we cal-culate the inverse of Mill’s ratio (MR) for eachobservation, which reflects the probability thata small business applied for a loan from acommercial bank, and includes this variable:
MR = [+(z,)]/[1 – ~(z,)],
where Zj is the predicted probability that re-spondent j applied for a loan, and ~(.) and Q(.)are, respectively, the density and the cumula-tive distribution function for a standard normalvariable in the accepted/denied equation (theprimary equation of interest). The inclusion ofthis variable purges the equation of selectionbias, allowing one to gain consistent estimatesof the parameters.
Our problem differs from the standardHeckman formulation in two ways. First, theequation of interest has a dependent variablethat only can take values of O or 1. Second,as mentioned earlier in this section, one shouldtake account of the sample weights when es-timating the parameters. While neither of thesedeviations from the orthodox Heckman for-mulation alters the consistency of the param-eter estimates,g both complicate the estimationof the appropriate standard errors of the esti-mates. In fact, to the author’s knowledge, noprocedures are currently in place to estimatestandard errors in this situation.
When confronted with consistent parameterestimates and difficult or even intractable ex-pressions of the precision of the estimates, re-searchers often resort to bootstrap-type pro-
cedures (Efron and Tibshirani), and we alsohave adopted this plan. Thus, our strategy forimplementing a Heckman-style correction forselection bias when the data come from astratified random sample and the dependentvariable of the equation of interest can take ononly a value of O or 1 is as follows. First,estimate a survey weighted probit equation forall 4637 observations using the svyprobt pro-cedure that is available in Stata statistical soft-ware (StataCorp). This gives a consistent es-timate of the probability that a firm sought aloan. Second, calculate the inverse Mill’s ratioand include it in a survey weighted logit re-gression estimated using svylogit, also avail-able in Stata. These two steps yield consistentestimates of the parameters. To get proper es-timates of the standard errors of these param-eter estimates, we repeated Steps 1 and 2 onethousand times using a sample that was drawnwith replacement from the original 4637 ob-servation dataset. As is standard in bootstrapapplications, the standard error of the meanparameter estimate of these 1000 replicationsis an estimate of the true standard error of theparameter.y
Construction of the Banking MarketVariables
Much of this description of the data followsthat in Cole and Walraven (1998). We use fourindicator variables to characterize the mergerstatus of the bank that received the loan ap-plication: (1) Acquirer Before Loan Applica-
tion indicates a bank that acquired anotherbank during the 18 months prior to the loanapplication. This is the period of adjustmentthat most researchers have considered whenassessing the effects of mergers. (2) Acquirer
After Loan Application indicates a bank thatacquired another bank during the 18 monthssubsequent to the loan application, This indi-cator spans the time after a merger has beenannounced, or possibly is in the works, and
XHere we assume that the sampling weights weredetermined exogenously, That is, the size of the sam-pling weights is assumed to be uncorrelated with thelikelihood that a small business will seek a loan.
g Note that each re-sample likely yielded a differentproportion of firms that sought a loan, as well as adifferent pattern of weighting than was exhibited in theoriginal data set.

210 Journal of Agricultural and Applied Economics, August 1999
the date that it legally is completed. (3) Target
Before Loan Application indicates a bank thatwas acquired by another bank during the 18months prior to the loan application. And (4)Target After Loan Application indicates abank that was acquired by another bank duringthe 18 months subsequent to the loan appli-cation.
By matching the bank number with datafrom the Call report, we were able to constructseveral measures of banking performance thatmight be expected to affect lending decisions.I use (the log of) bank assets, Equity/Assets,Delinquent Loans/Total Loans, and Loan LossAllowance/Total Loans for each bank where asmall business respondent reported seeking aloan, I also include a dummy variable formembership in a bank holding company, andI include the set of banking performance var-iables that are aggregated to the holding com-pany level. (I set to zero all of the holdingcompany variables for an independent bank.)
Using some of the data generated from theanalysis in the first several sections, one alsocan construct variables specific to the geo-graphic banking market of the firm. Number
of Banking Oj6ces in a A4arket represents acount of the commercial banks, thrifts, savingsbanks, and the offices of any of these financialinstitutions that are open in the county or met-ropolitan area of the small business on the daythat the respondent applied for the loan. Num-
ber of Closures of Banks/O fices represents thesum of closures from January 1992 until theday of the loan application in the banking mar-ket of the small business. Number oj A4ergers
in a Market is the count of the commercialbanks (not other types of targets or of branch-es) that were targets of mergers in the bankingmarket from January 1992 until the day of theloan application.
One can use the NSSBF data to constructa variable indicating whether a respondentwho reported seeking a loan had maintainedsome sort of banking relationship with the in-stitution where the loan was sought. Becausea market that had experienced a great deal ofstructural change might be expected to have alarger number of these types of borrowers, Iconstructed a market variable Disruption that
is the interaction of this “no relationship” var-iable with the sum of closures and mergers inthe market.
Estimation Results
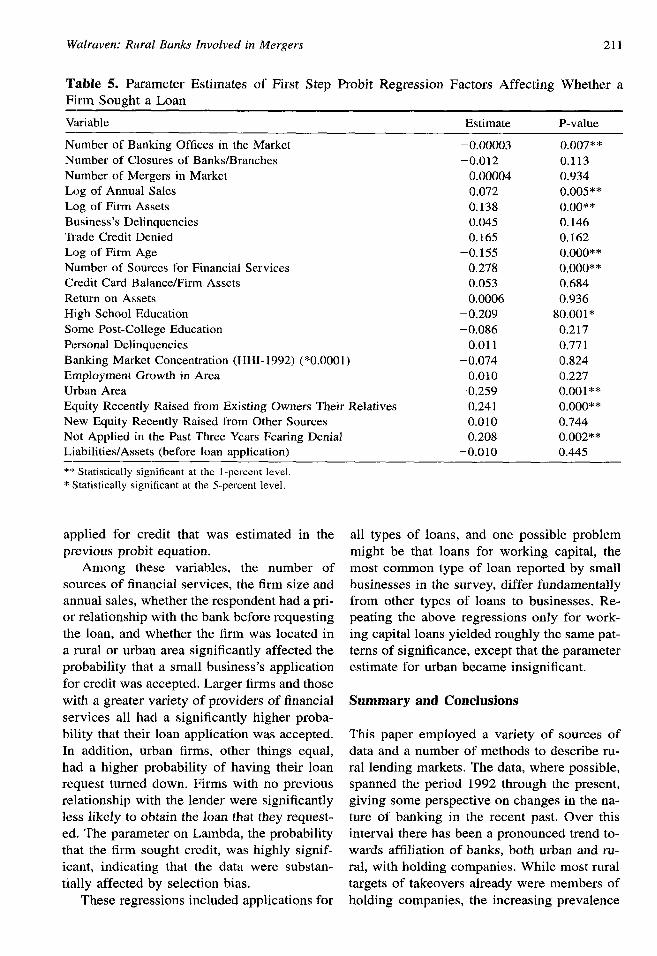
Tables 5 and 6 give the results of estimatinga single equation using the Heckman adjust-ment. Table 5 shows the parameter estimatesfrom the initial probit equation, which showthe contribution of a set of firm, market, andbank variables on the probability that a samplerespondent had sought a loan.
The only one of the banking market vari-ables that seemed correlated with whether theowner of a small business sought a loan wasthe number of banking offices that were openin the market. However, the negative sign in-dicates that firms located in markets with morebanking offices were less likely to seek a loan.
Several of the firm characteristics seemedto be significantly correlated with the decisionto seek a loan. Larger firms and those withmore sales were more likely to seek a loan.Older firms were less likely to seek a loan,perhaps reflecting some dependence on accu-mulated retained earnings. Firms that used fi-nancial services from a greater variety ofsources were more likely to seek a loan, per-haps reflecting better relationships with poten-tial lenders. Finally, rural small firms in thesample were more likely to seek a loan thantheir urban counterparts.
Among those characteristics of the primaryowner of the firm, those who recently had ob-tained new equity from relatives were morelikely to seek a bank loan, while those withno more than a high school education wereless likely to seek credit. Those owners whoreported having avoided applying for a loanduring the past three years because they fearedthat they might be rejected were more likelyto report seeking a loan on the survey.
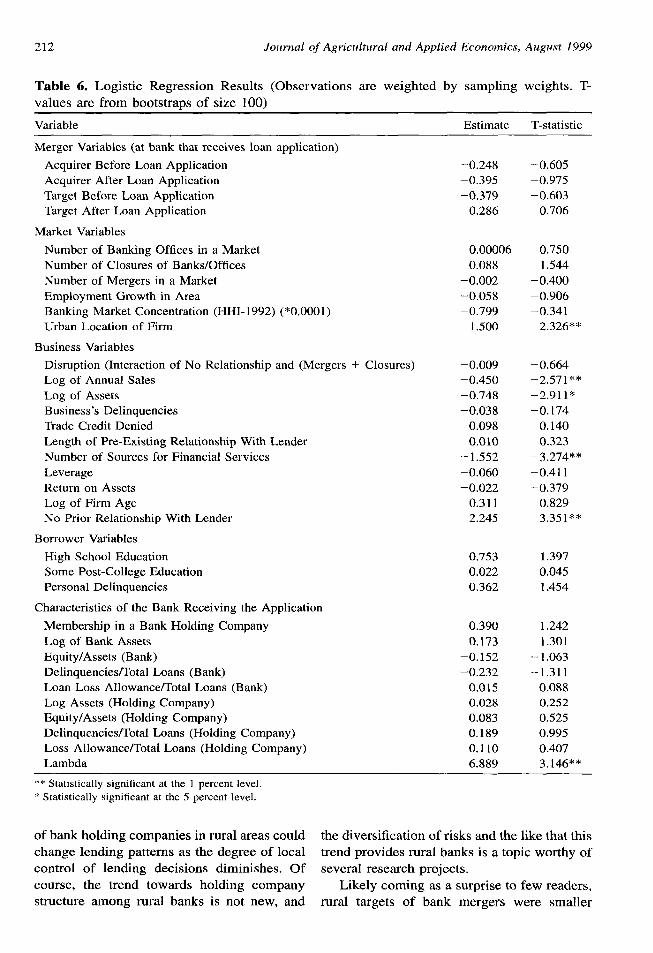
Table 6 shows the parameter estimatesfrom the logistic regression of whether or nota small business was denied credit on a num-ber of characteristics of the firm, the market,the principal owner, the bank that received theapplication, and the probability that the firm
Walraven: Rural Banks Involved in Mergers 211
Table 5. Parameter Estimates of First Step Probit Regression Factors Affecting Whether aFirm Sotwht a Loan
Viiriable—
Number of Banking Offices in the Market
Number of Closures of Banks/Branches
Number of Mergers in Market
Log of Annual Sales
Log of Firm Assets
Business’s Delinquencies
Trade Credit Denied
Log of Firm Age
Number of Sources for Financial Services
Credit Card Balance/Firm Assets
Return on Assets
High School Education
Some Post-College Education
Personal Delinquencies
Banking Market Concentration (HHI- 1992) (*0.0001)
Employment Growth in Area
Urban Area
Equity Recently Raised from Existing Owners Their Relatives
New Equity Recently Raised from Other Sources
Not AppIied in the Past Three Years Fearing Denial
Liabilities/Assets (before loan application)
Estimate
–0.00003
–0.012
0.00004
0.072
0.138
0.045
0.165
–0.155
0.278
0.053
0.0006
–0.209
–0.086
0.011
–0.074
0.010
–0,259
0,241
0.010
0.208
–0.010
P-value
0.007**
0.113
0.934
0.005**
O.00**
0.146
0.162
O.000**
0,000**
0.684
0,936
80.001*
0.217
0.771
0.824
0.227
O.001**
O.000**
0.7440.002**
0.445
** Statistically significant at the 1-percent level,
* Statistically significant at the 5-percent level.
applied for credit that was estimated in theprevious probit equation.
Among these variables, the number ofsources of financial services, the firm size andannual sales, whether the respondent had a pri-or relationship with the bank before requestingthe loan, and whether the firm was located ina rural or urban area significantly affected theprobability that a small business’s applicationfor credit was accepted. Larger firms and thosewith a greater variety of providers of financialservices all had a significantly higher proba-bility that their loan application was accepted.In addition, urban firms, other things equal,had a higher probability of having their loanrequest turned down. Firms with no previousrelationship with the lender were significantlyless likely to obtain the loan that they request-ed. The parameter on Lambda, the probabilitythat the firm sought credit, was highly signif-icant, indicating that the data were substan-tially affected by selection bias.
These regressions included applications for
all types of loans, and one possible problemmight be that loans for working capital, themost common type of loan reported by smallbusinesses in the survey, differ fundamentallyfrom other types of loans to businesses. Re-peating the above regressions only for work-ing capital loans yielded roughly the same pat-terns of significance, except that the parameterestimate for urban became insignificant.
Summary and Conclusions
This paper employed a variety of sources ofdata and a number of methods to describe ru-ral lending markets. The data, where possible,spanned the period 1992 through the present,giving some perspective on changes in the na-ture of banking in the recent past. Over thisinterval there has been a pronounced trend to-wards affiliation of banks, both urban and ru-ral, with holding companies. While most ruraltargets of takeovers already were members ofholding companies, the increasing prevalence
212 Journal of Agricultural and Applied Economics, August 1999
Table 6. Logistic Regression Results (Observations are weighted by sampling weights. T-valttes are from bootstraps of size 100)
Variable Estimate T-statistic
Merger Variables (at bank that receives loan application)
Acquirer Before Loan Application
Acquirer After Loan Application
Target Before Loan Application
Target After Loan Application
Market Variables
Number of Banking Offices in a Market
Number of Closures of Banks/Offices
Number of Mergers in a Market
Employment Growth in Area
Banking Market Concentration (HHI- 1992) (*0,0001)
Urban Location of Firm
Business Variables
Disruption (Interaction of No Relationship and (Mergers + Closures)
Log of Annual Sales
Log of Assets
Business’s Delinquencies
Trade Credit Denied
Length of Pre-Existing Relationship With Lender
Number of Sources for Financial Services
Leverage
Return on Assets
Log of Firm Age
No Prior Relationship With Lender
Borrower Variables
High School Education
Some Post-College Education
Personal Delinquencies
Characteristics of the Bank Receiving the Application
Membership in a Bank Holding Company
Log of Bank Assets
Equity/Assets (Bank)
Delinquencies/Total Loans (Bank)
Loan Loss Allowance/Total Loans (Bank)
Log Assets (Holding Company)
Equity/Assets (Holding Company)
Delinquencies/Total Loans (Holding Company)
Loss Allowance/Total Loans (Holding Company)
Lambda
–0,248–0.395–0.379
0.286
0.000060.088
–0,002–0.058–0.799
1.500
–0.009–0,450–0.748–0.038
0.0980.010
–1.552
–0.060
–0.022
0.311
2.245
0.753
0.022
0.362
0.390
0.173
–0.152
–0.232
0.015
0.028
0.083
0.189
0.110
6.889
–0.605–0.975–0.603
0.706
0.7501.544
–0.400–0.906–0.341
2.326*”
–0.664–2.571**–2.911*
–0.174
0.140
0.323
–3.274**
–0.41 1
–0.379
0.829
3.351**
1.397
0.045
1.454
1.242
1.301
– 1.063
–1.311
0.088
0.252
0.525
0.995
0.407
3.146**
** Statistically significant at the 1 percent level.
* Statistical y significant at the 5 percent level.
of bank holding companies in rural areas could the diversification of risks and the like that thischange lending patterns as the degree of local trend provides rural banks is a topic worthy ofcontrol of lending decisions diminishes. Of several research projects.course, the trend towards holding company Likely coming as a surprise to few readers,structure among rural banks is not new, and rural targets of bank mergers were smaller
Walraven: Raral Banks Involved in Mergers 213
than urban targets. Rural targets also were
more profitable and had lower rates of delin-quency. Nevertheless, rural targets of mergersheld a significantly smaller portion of their as-sets as loans, perhaps explaining some of theirattraction to buyers.
The second section of the paper looked atthe level and changes in banking market con-centration from mid 1992 until mid 1997.Concentration in rural banking markets in-creased a bit more than in urban markets overthis five-year span. However, the degree ofconcentration in the least competitive ruralmarkets improved a bit–that is, the value ofthe upper percentiles of the distribution fellback towards the median. One topic thatseems a fruitful area for future research is therelative effect of de now banks on the con-centration in urban and rural areas. Another isthe effect of technological change in the fi-nancial industry, where standardization of loanterms, securitization of loans, and innovationssuch as electronic banking may graduallymake geographic measures of competitionsuch as the HHI obsolete.
The final section of the paper looked spe-cifically at rural borrowers using data from the1993 NSSBE The model of credit search usedin this overview found some evidence that al-though rural small businesses were less likelyto apply for a loan, those that did were morelikely to have their application accepted thanurban firms that applied for credit. That is, af-ter one controlled for characteristics of thesmall business firm, the principal owner, andthe banking market; the urban or rural locationof the small business had a significant effecton both the probability that a firm sought aloan and on the likelihood that the loan wasgranted. Of the variables constructed to de-scribe banking markets, only the number ofbanking offices had a significant effect on thelikelihood that a small business sought a loan,and the data indicate that the more bankingoffices in a market, the less likely a small busi-ness is to seek a loan. After one adjusts forthe probability that a firm seeks a loan, thesize and annual sales of the small business, thenumber of sources of financial services thatthe firm maintained, and whether the firm had
maintained a relationship with the bank thatreceived the loan application also had a sig-nificant effect on whether the firm was grantedthe loan.
One shouldn’t read too much into these re-sults, The sample seems fairly small-only 44loan requests originating from rural smallbusinesses were reported to have been turneddown in the survey. However, keeping in mindthe relative paucity of rural loans and the sur-vey problems mentioned in the paper, largerfirms and those that maintained banking rela-tionships seemed the least likely to be refuseda loan. Furthermore, there was some tentativeevidence that rural small businesses wereslightly less likely to be turned down for aloan, although they were less likely to apply,suggesting some self-selection.
Of course, these results may be addressinga different point than some specialists in ruraldevelopment might prefer. Namely, many ofthe most notable features of rural small busi-nesses are those that tend to lower the jointprobability (the probability that the loan isgranted conditional on the probability thatthey applied) that they receive a bank loan.Just reviewing some of the list of significantvariables in the probit equation, smaller firmsand those with fewer sources of financial ser-vices were significantly less likely to seek aloan. Some observers might assert that these
are inherent characteristics of rural small busi-nesses.
References
Berger, Allen N., and Gregory 1? Udell. “Relation-
ship lending and lines of credit in small firm
finance. ” Journal of Business 68(1995):35 l–382.
Berger, Allen N., Anthony Saunders, Joseph M.
Scalise, and Gregory I? Udell. “The effect ofbank mergers and acquisitions on small busi-
ness lending. ” Mimeo, Federal Reserve Board,
1997.
Cole, Rebel A. “The Importance of Relationships
to the Availability of Credit,” Journal of Bank-ing and Finance, forthcoming.
, and John D. Wolken. “Sources and uses
of financial services by small businesses: Evi-dence from the 1993 National Survey of Small-
214 Journal of Agricultural and Applied Economics, August 1999
Business Finances,” Federal Reserve Bulletin81 (1995):629–670.
—, and Louise Woodburn. “Bank and non-
bank competition for small business credit: Ev-idence from the 1987 and 1993 National Sur-veys of Small Business Finances, ” FederalReserve Bulletin 82 (1996):983–995.
Cornett, Marcia Millon and Hassan Tehranian.
“Changes in corporate performance associatedwith bank acquisitions, ” Journal of FinancialEconomics 31(1992):21 1–234,
Efron, B. The JackKnife, the Bootstrap, and OtherResampling Plans. Philadelphia: Society for In-
dustrial and Applied Mathematics, 1982.Efron, B. and R. Tibshirani. “Bootstrap measures
for standard errors, confidence intervals, andother measures of statistical accuracy,” Statis-tical Science 1(1986): 54–77.
Elliehausen, Gregory E. and John D. Wolken.
“Banking markets and the use of financial ser-vices by small and medium-sized businesses”
Federal Reserve Bulletin 76( 1990):801–8 17.Goldberg, G. Lawrence, and Lawrence J. White.
“De novo banks and lending to small business-
es: An Exploratory Analysis. ” Journal of Bank-ing and Finance forthcoming.
Greene, William. “Sample selection bias as a spec-
ification error. ” Econometrics 49(1 981):795–798.
Heckman, James. “Sample selection bias as a spec-
ification error. ” Econometrics 47( 1979): 153–161.
Hosmer, D. W., Jr., and S. Lemshow. Applied Lo-gistic Regression, New York, NY John Wiley
& Sons, Inc., 1989.
Houston Joel E, and Michael D. Ryngaert, “Theoverall gains from large bank mergers. ” Jour-nal of Banking and Finance 18(1994):11 55–1176.
Jayaratne, Jith and John D. Wolken. “How Impor-tant are Small Banks to Small Business Lend-ing? New Evidence From a Survey of Small
Firms, The Consolidation of the Financial Ser-vices Industry. ” Federal Reserve Bank of NewYork, March 1998.
Keeton, William R. “Do bank mergers reduce lend-ing to businesses and farmers? New evidencefrom Tenth District states. “ Mimeo, FederalReserve Bank of Kansas City, 1996.
Maddala, G. S. Limited Dependent and QualitativeVariables in Econometrics. Cambridge Univer-
sity Press: Cambridge, 1983.
Munnell, Alicia, Geoffery Tootell, Lynne Browne,
And James McEneaney. “Mortgage Lending in
Boston: Interpreting the HMDA Data. ” Ameri-can Economic Review 86( 1996):25–53.
Peek, Joseph, and Eric Rosengren. “Bank consoli-
dation and small business lending: It’s not justbank size that matters. ” Journal of Banking andFinance, forthcoming.
Petersen, Mitchell A., and Raghuram G. Rajan.
“The benefits of lending relationships: Evi-
dence from small businesses. ” Journal of Fi-nance 49(1994):3–37.
—, “The effect of credit market competition
on lending relationships.” Quarterly Journal ofEconomics 105(1995):407–443.
Pilloff, Steven J. “Performance changes and share-holder wealth creation associated with mergers
of publicly traded banking institutions. ” Jour-nal of Money, Credit, and Banking 28(1996):294–310.
Rhoades, Stephen A. “Market Share Inequality, theHHI, and Other Measures of the Firm-Compo-
sition of a Market. ” Review of Industrial Or-ganization, 10(1995):657–674.
Schrantz, Mary S. “Takeovers improve perfor-
mance: Evidence from the banking industry. ”
Journal of Political Economy 101( 1993) :299–326.
StataCorp. Stata Statistical Software: Release 5.0College Station, TX: Stata Corporation, 1997.
Strahan, Philip E. and James Weston. “Small busi-ness lending and the changing structure of the
banking industry. ” Journal of Banking and Fi-nance, forthcoming.
Walraven, Nicholas. “Small business lending bybanks involved in mergers. ” Finance and Dis-cussion Series 97–25, Federal Reserve Board,
Washington, DC, 1997,