Embed Size (px)
Citation preview

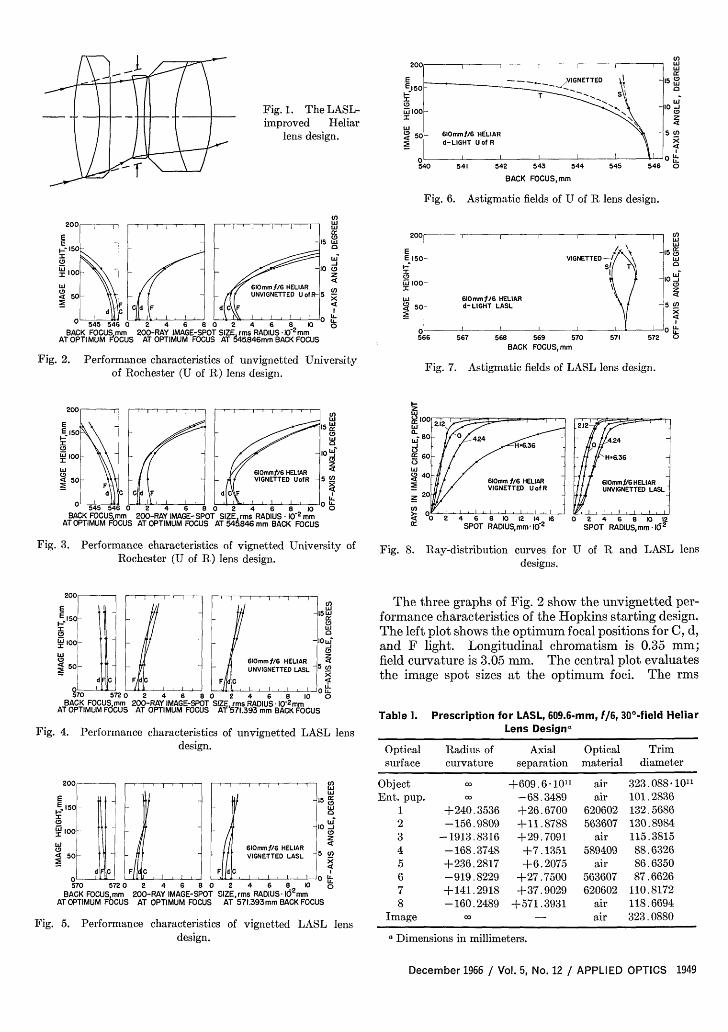
Lens Design for a 609.6-mm, f/6, 300-field Objective
Berlyn Brixner
As a test problem, an attempt was made to optimize a Heliar aerial photography lens already designed for
optimum performance by classical methods. Improved performance was obtained in off-axis imageresolution and contrast. Evaluations of both lens designs are given, together with the modifications pre-scribed as a result of machine analysis with the LASL program, which analyzes statistically the tracedskew rays generating the geometrical image spots.
As a test of the LASL Lens Design program' R. E.Hopkins suggested that the program try to improve theperformance of an aerial camera lens design which hehad developed for the U. S. Air Force. The test lenshad been designed by means of a powerful automaticlens correcting program that followed classical meth-ods.2 The specifications were rather rigid: Heliartype, 609.6-mm focal length, f/6 relative aperture, fullfield coverage for a 228.6 X 228.6-mm format, andC-F achromatization-for use on Plus-X Aerecon film.Since Hopkins' Heliar design was a reference objectivedesigned for optimum performance', it was to be thestarting lens. The procedure for evaluating the im-proved design would also be rigid: cat's-eye vignettingof up to 30% of the rays making the lateral image points,image spot analysis by geometrical energy distributionderived from eighty-ray traces in d light and twenty-raytraces in F and C light, geometrical frequency responsecharacteristics calculated from energy distribution data,and an estimate of the resolving power on film by anunspecified calculation. Also, the design would beevaluated by the many general criteria known to thoseskilled in the art.
The purpose of the cat's-eye aperture is to reduce thedeleterious effect of astigmatism by progressively re-ducing the aperture's radial size as the off-axis imageangle increases, even though this vignetting reduces theillumination of the film edge. For this analysis, it ispresumably statistically effective to trace only a smallnumber of rays for C and F light in order to reduce theeffect of chromatic defects. Although it is a commonpractice to analyze the geometrical frequency response
The author is with the University of California, Los AlamosScientific Laboratory, Los Alamos, New Mexico 87544.
Received 6 June 1966.This work was done under the auspices of the U. S. Atomic
Energy Commission.
of traced ray spot diagrams, the difficulty of predictingmeasured resolution from the data so obtained is wellknown. 4
To assist appraisal of the computer program, it wasdesired to minimize the amount of human direction.Therefore, efforts to optimize the Heliar design were re-stricted to two types of parameter change, the radii ofcurvature, and the air and glass thicknesses. The firststep was to determine the performance characteristics ofthe original lens, using the LASL method of statisticalanalysis.* Twenty-six ray traces in C, d, and F lightwere used for images at 0, /3, 2/3, and a maximum imageheight of 161.5 mm. Next the designing program wasallowed to change the surface curvatures for ten 5-minruns. Thus, the error function was reduced from 1.22to 0.45. Finally, axial thickness changes of the glassand the air were added. The error function was re-duced further to 0.31 to produce the design describedhere, Fig. 1 and Table I.
Figures 2 through 8 give details of the analysis of thestarting and the final designs. Two hundred ray pat-terns analyzed each design for both unvignetted andvignetted conditions in order to show the effect of vig-netting on the image size and on the position character-istics over the 161.5-mm half field of view (140 50' offaxis).
* The LASL program analyzes statistically the traced skewrays generating image spots of the lens. The spot's centroid is theimage position; the image size is the root-mean-square (rms)radius of the rays from the centroid. The resolution is defined asthe rms radius of the spot. The rms spot radius calculation auto-matically includes the effect of longitudinal chromatism. Thelateral variation of the centroid positions of the colored spots ineach image gives the effect of lateral chromatism. Distortion isthe deviation of the centroid position from the position requiredby rectilinear geometry. The longitudinal chromatism and thefield curvature characteristics are evaluated by observing theimage spots on a series of equally spaced accessory focal planes
adjacent to the focal plane of interest.
1948 APPLIED OPTICS / Vol. 5, No. 12 / December 1966
2C
,E6.15
~II
rC!4.
544 545 546
U)wwCDw0
Id
CD
1
U.
0
Fig. 6. Astigmatic fields of U of R lens design.
U)200 -- T---
X 0
I __X Z~~~~~~~~~~~~~~~~0C
\\ 610mmf/6 HELIAR
4 50 F UNVIGNETTED U of R5 -
d C
p545 546 0 2 4 6 8 0 2 4 6 8 10 oBACK FOCUS mm 200-RAY IMAGE-SPOT SIZE rms RADIUS 10-
2mm
AT OPTIMUM FoCUS AT OPTIMUM FOCUS AT 545.846mm BACK FOCUS
Fig. 2. Performance characteristics of unvignetted Universityof Rochester (U of R) lens design.
200-
EE ISoI-CD0 100
Id4 50
566 567 568 569 570 571 572
BACK FOCUS,mm
Fig. 7. Astigmatic fields of LASL lens design.
E1I50 VN
X
CD10 0
-.
CD ~~~~~~~~~~~~~6 mt/6 HELIAR< 50 F VIGNETTED UofR
0545 546 0 2 4 6 8 0 2 4 6 8 10BACKFOCUS mm 200-RAYIMAGE-SPOT SIZE rms RADIUS 10.2 mm
AT OPTIMUM FOCUS AT OPTIMUM FOCUS AT 545846 mm BACK FOCUS
CDa:
0ir
0
CD
4.
1U)
4ia:
100 2.1.2 1 -
6 0 0 4X24
60
40-610mm f16 HELIARVIGNETTED UofR
20
0 2 4 6 10 12 14 16SPOT RADIUSmm 102
2 2 I
E }~4.24
- H-6.36
610mmf/6HELIARUNVIGNETTED LASL
li ~- I I
0 2 4 6 6 10 12SPOT RADIUSmm .102
Fig. 3. Performance characteristics of vignetted University ofRochester (U of R) lens design.
200 . . . . . . .
E SEISO- It
w 100 - -I AS 5 SCD
5tO 572 0 2 4 6 80 2 6mmf/6 HELIARE 50 UNVIGNETTED LASL 5
I~~~~~~~~~~~~
: 0 O570 572 0 2 4 6 8 0 2 4 6 8 10 0
BACK FOCUS mm 200-RAY IMAGE-SPOT SIZE rms RADIUS- 102
mmATOPTIMUM FCUS AT OPTIMUM FOCUS AT6571.393mmBACKFOCUS
Fig. 4. Performance characteristics of unvignetted LASL lensdesign.
I5 0 -- I
I~~~~~~~~~~~
:100 CD
Id 610mmf/6 HELIARCD41 50 VIGNETTED LASL 5S
I~~~~~~~~~~~~F~~~~~
0 L570 572 0 2 4 6 8 0 2 4 6 8 10 o
BACK FOCUS,mm 200-RAY IMAGE-SPOT SIZE, rms RADIUS 10 mmAT OPTIMUM FOCUS AT OPTIMUM FOCUS AT57TI.393mm BACK FOCUS
Fig. 5. Performance characteristics of vignetted LASL lensdesign.
Fig. 8. Ray-distribution curves for U of R and LASL lensdesigns.
The three graphs of Fig. 2 show the unvignetted per-formance characteristics of the Hopkins starting design.The left plot shows the optimum focal positions for C, d,and F light. Longitudinal chromatism is 0.35 mm;field curvature is 3.05 mm. The central plot evaluatesthe image spot sizes at the optimum foci. The rms
Table 1. Prescription for LASL, 609.6-mm, f/6, 30°-field HeliarLens Designa
Optical Radius of Axial Optical Trimsurface curvature separation material diameter
Object o +609.61011 air 323.088 101Ent. pup. o -68.3489 air 101.2836
1 +240.3536 +26.6700 620602 132.56862 -156.9809 +11.8788 563607 130.89843 -1913.8316 +29.7091 air 115.38154 -168.3748 +7.1351 589409 88.63265 +236.2817 +6.2075 air 86.63506 -919.8229 +27.7500 563607 87.66267 +141.2918 +37.9029 620602 110.81728 -160.2489 +571.3931 air 118.6694
Image o - air 323.0880
a Dimensions in millimeters.
December 1966 / Vol. 5, No. 12 / APPLIED OPTICS 1949
Fig. 1. The LASL-improved Heliar
lens design.
100 I I I __
-_ __VIGNETTED I - 150 _ __ = -- _I g
T *-
'0 - I
5 610mmt/6 HELIAR - 5d-LIGHT U of R
- I I I I I l ' 1
540 541 542 543
BACK FOCUS,mm
_ l I I I I I
VIGNETTED--SI T
610mml/6 HELIARd-LIGHT LASL
I
U)
I a:In
OL
10
CD
4
311
00' ' ' ' ' ' I
) I I I * I . I I I I Io
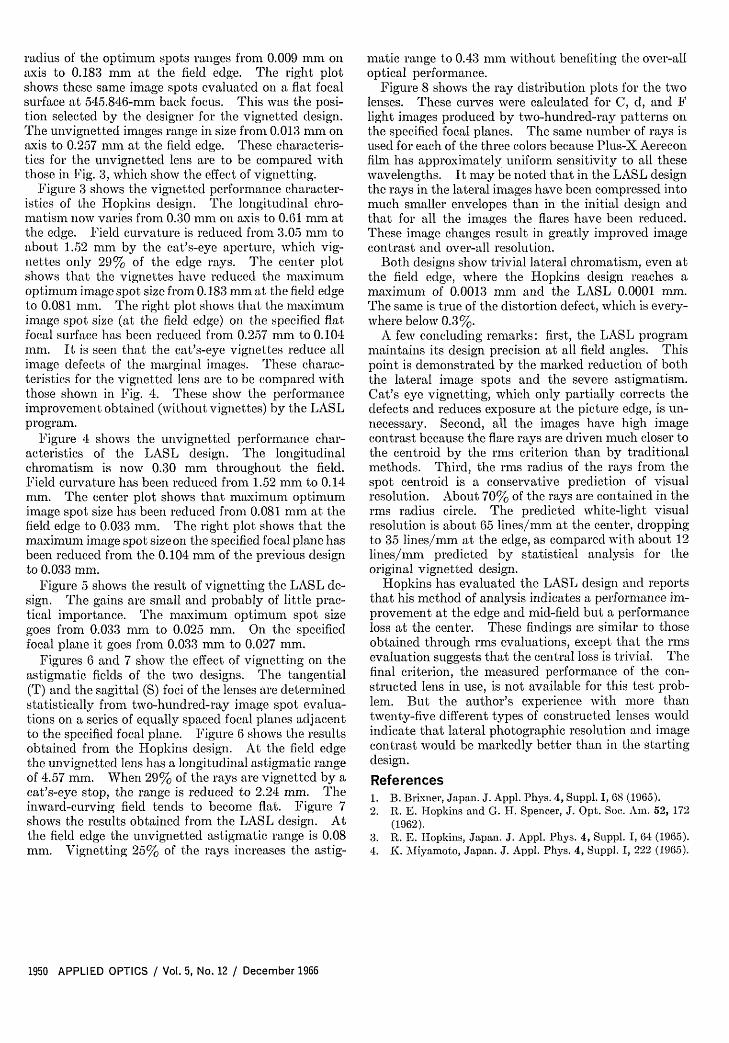
radius of the optimum spots ranges from 0.009 mm oiaxis to 0.183 mm at the field edge. The right plotshows these same image spots evaluated on a flat focalsurface at 545.846-mm back focus. This was the posi-tion selected by the designer for the vignetted design.The unvignetted images range in size from 0.013 mm onaxis to 0.257 mm at the field edge. These characteris-tics for the unvignetted lens are to be compared withthose in Fig. 3, which show the effect of vignetting.
Figure 3 shows the vignetted performance character-istics of the Hopkins design. The longitudinal chro-matism now varies from 0.30 mm oil axis to 0.61 mm atthe edge. Field curvature is reduced from 3.05 mm toabout 1.52 mm by the cat's-eye aperture, which vig-nettes only 29% of the edge rays. The center plotshows that the vignettes have reduced the maximumoptimum image spot size from 0.183 mm at the field edgeto 0.081 mm. The right plot shows that the maximumimage spot size (at the field edge) on the specified flatfocal surface has been reduced from 0.257 mm to 0.104mm. It is seen that the cat's-eye vignettes reduce allimage defects of the marginal images. These charac-teristics for the vignetted lens are to be compared withthose shown in Fig. 4. These show the performanceimprovement obtained (without vignettes) by the LASLprogram.
Figure 4 shows the unvignetted performance char-acteristics of the LASL design. The longitudinalchromatism is now 0.30 mm throughout the field.Field curvature has been reduced from 1.52 mm to 0.14mm. The center plot shows that maximum optimumimage spot size has been reduced from 0.081 mm at thefield edge to 0.033 mm. The right plot shows that themaximum image spot size oil the specified focal plane hasbeen reduced from the 0.104 mm of the previous designto 0.033 mm.
Figure 5 shows the result of vignetting the LASL de-sign. The gains are small and probably of little prac-tical importance. The maximum optimum spot sizegoes from 0.033 mm to 0.025 mm. O the specifiedfocal plane it goes from 0.033 mm to 0.027 mm.
Figures 6 and 7 show the effect of vignetting on theastigmatic fields of the two designs. The tangential(T) and the sagittal () foci of the lenses are determinedstatistically from two-hundred-ray image spot evalua-tions on a series of equally spaced focal planes adjacentto the specified focal plane. Figure 6 shows the resultsobtained from the Hopkins design. At the field edgethe unvignetted lens has a longitudinal astigmatic rangeof 4.57 mm. When 29% of the rays are vignetted by acat's-eye stop, the range is reduced to 2.24 mm. Theinward-curving field tends to become flat. Figure 7shows the results obtained from the LASL design. Atthe field edge the unvignetted astigmatic range is 0.08mm. Vignetting 25% of the rays increases the astig-
matic range to 0.43 mm without benefiting the over-alloptical performance.
Figure 8 shows the ray distribution plots for the twolenses. These curves were calculated for C, d, and Flight images produced by two-hundred-ray patterns onthe specified focal planes. The same number of rays isused for each of the three colors because Plus-X Aereconfilm has approximately uniform sensitivity to all thesewavelengths. It may be noted that in the LASL designthe rays in the lateral images have been compressed intomuch smaller envelopes than in the initial design andthat for all the images the flares have been reduced.These image changes result in greatly improved imagecontrast and over-all resolution.
Both designs show trivial lateral chromatism, even atthe field edge, where the Hopkins design reaches amaximum of 0.0013 mm and the LASL 0.0001 mm.The same is true of the distortion defect, which is every-where below 0.3%.
A few concluding remarks: first, the LASL programmaintains its design precision at all field angles. Thispoint is demonstrated by the marked reduction of boththe lateral image spots and the severe astigmatism.Cat's eye vignetting, which only partially corrects thedefects and reduces exposure at the picture edge, is un-necessary. Second, all the images have high imagecontrast because the flare rays are driven much closer tothe centroid by the rms criterion than by traditionalmethods. Third, the rms radius of the rays from thespot centroid is a conservative prediction of visualresolution. About 70% of the rays are contained in therms radius circle. The predicted white-light visualresolution is about 65 lines/mm at the center, droppingto 35 lines/mm at the edge, as compared with about 12lines/mm predicted by statistical analysis for theoriginal vignetted design.
Hopkins has evaluated the LASL design and reportsthat his method of analysis indicates a performance im-provement at the edge and mid-field but a performanceloss at the center. These findings are similar to thoseobtained through rms evaluations, except that the rmsevaluation suggests that the central loss is trivial. Thefinal criterion, the measured performance of the coI-structed lens in use, is not available for this test prob-lem. But the author's experience with more thantwenty-five different types of constructed lenses wouldindicate that lateral photographic resolution and imagecontrast would be markedly better than in the startingdesign.
References1. B. Brixner, Japan. J. Appl. Phys. 4, Suppl. I, 68 (1965).2. R. E. I-Iopkins and G. H. Spencer, J. Opt. Soc. Am. 52, 172
(1962).3. R. E. Hopkins, Japan. J. Appl. Phys. 4, Suppl. I, 64 (1965).4. K. Mliyamoto, Japan. J. Appl. Phys. 4, Suppl. I, 222 (1965).
1950 APPLIED OPTICS / Vol. 5, No. 12 / December 1966