Embed Size (px)
Citation preview

Anitha Sampath, Inga Doherty
Version One April 2020
LEO Integrated Land Use Map

1
Report Title: Integrated Land Use Map Author(s): Anitha Sampath, Inga Doherty
Organisation(s): Oxfordshire County Council
Version: 1 Date: May 2020
Workpack*: 4 Deliverable: 4.1.8
Reviewed by: Professor Rajat Gupta, Dr Angelines Donastorg Sosa
Date: April 2020
Signed off by: Llewelyn Morgan
Date: June 2020
FRONT COVER © Crown copyright and database rights 2020 OS
0100023343

2
Context The UK Government has legislated to reduce its carbon emissions to net zero by 2050. Meeting this
target will require significant decarbonisation and an increased demand upon the electricity
network. Traditionally an increase in demand on the network would require network reinforcement.
However, technology and the ability to balance demand on the system at different periods provides
opportunities for new markets to be created, and new demand to be accommodated through a
smarter, secure and more flexible network.
The future energy market offers the opportunity to create a decentralised energy system, supporting
local renewable energy sources, and new markets that everyone can benefit from through providing
flexibility services. To accommodate this change, Distribution Network Operators (DNOs) are
changing to become Distribution System Operators (DSOs).
Project Local Energy Oxfordshire (LEO) is an important step in understanding how new markets can
work and improving customer engagement. Project LEO is part funded via the Industrial Strategy
Challenge Fund (ISCF) who set up a fund in 2018 of £102.5m for UK industry and research to develop
systems that can support the global move to renewable energy called: Prospering From the Energy
Revolution (PFER).
Project LEO is one of the most ambitious, wide-ranging, innovative, and holistic smart grid trials ever
conducted in the UK. LEO will improve our understanding of how opportunities can be maximised
and unlocked from the transition to a smarter, flexible electricity system and how households,
businesses and communities can realise the benefits. The increase in small-scale renewables and
low-carbon technologies is creating opportunities for consumers to generate and sell electricity,
store electricity using batteries, and even for electric vehicles (EVs) to alleviate demand on the
electricity system. To ensure the benefits of this are realised, Distribution Network Operators (DNO)
like Scottish and Southern Electricity Networks (SSEN) are becoming Distribution System Operators
(DSO).
Project LEO seeks to create the conditions that replicate the electricity system of the future to better
understand these relationships and grow an evidence base that can inform how we manage the
transition to a smarter electricity system. It will inform how DSOs function in the future, show how
markets can be unlocked and supported, create new investment models for community
engagement, and support the development of a skilled community positioned to thrive and benefit
from a smarter, responsive and flexible electricity network.
Project LEO brings together an exceptional group of stakeholders as Partners to deliver a common
goal of creating a sustainable local energy system. This partnership represents the entire energy
value chain in a compact and focused consortium and is further enhanced through global leading
energy systems research brought by the University of Oxford and Oxford Brookes University
consolidating multiple data sources and analysis tools to deliver a model for future local energy
system mapping across all energy vectors.

3
Table of Contents Executive Summary 4
1 Introduction 5
2 Background and Context 5
3 Purpose of the map 6
4 Methodology 6
4.1 Participants 6
4.2 Process 7
5 Layer List and Explanations 11
5.1 Planning and environmental constraints 11
5.2 Aerial Photography 16
6 Renewable Generation Potential 17
7 Web Application 21
7.1 Developing the web application 21
7.2 Review and feedback on the land use map web application 22
7.3 Accessing the web application 22
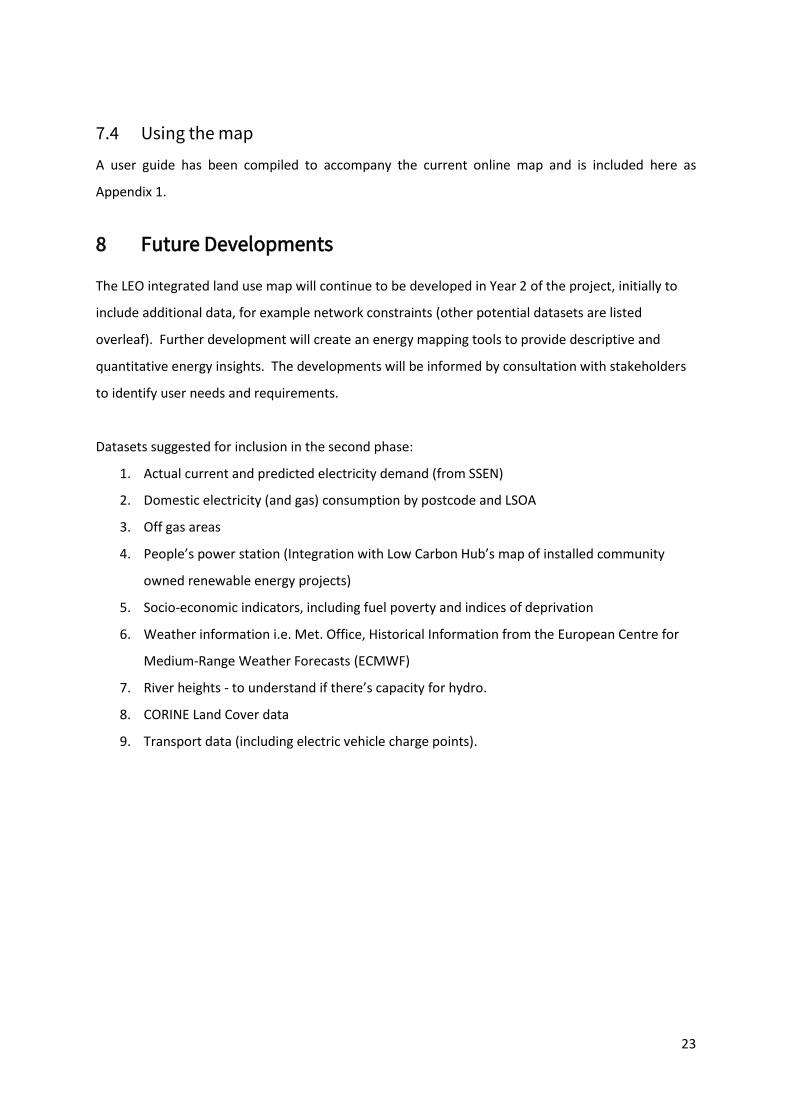
7.4 Using the map 23
8 Future Developments 23
Appendices 24
A: User Guide for Integrated Land Use Web Application 24
List of Figures and Tables Figure 1: Process for developing the Integrated Land Use Map ............................................................ 7
Figure 2: Oxfordshire County boundary including constituent Local Authorities .............................. 12
Figure 3: Example of planning constraint layers .................................................................................. 13
Figure 4: Sample Aerial Photography for Oxford City .......................................................................... 16
Figure 5: Assessment of ground mount solar suitability across Oxfordshire ...................................... 19
Table 1 Boundaries ............................................................................................................................... 11
Table 2 Planning Layers ........................................................................................................................ 13
Table 3 Environment Layers ................................................................................................................. 14
Table 4 Archaeology Layers ................................................................................................................. 15
Table 5 Specification for solar suitability assessment ......................................................................... 18
Table 6 Specification for estimating wind energy suitability ............................................................... 18
Table 7 Timeline of web application development .............................................................................. 21
Table 8 Review of initial web application ............................................................................................ 22

4
Executive Summary
The LEO Integrated Land Use map has been developed by Oxfordshire County Council (OCC) as the
first deliverable of Work Package 4.1. The map, delivered to partners as an ArcGIS web application,
aims to provide an accessible overview of land use designations and energy assets within the
Oxfordshire county area to inform energy system planning in the consolidation phase of Project LEO.
In addition, the map will provide evidence to support delivery of the Oxfordshire Countywide Energy
Strategy.
The process for developing the map was set out as an MVS (Minimum Viable System) in line with the
approach being taken across Project LEO. The content of the map was informed by consultation with
LEO partners and external stakeholders. As well as drawing on existing land use data held by OCC
and available through national databases (including planned housing and employment growth,
planning constraints, aerial photography), the map includes new data on the potential for solar PV
and wind generation across the county created for LEO by Energeo Limited.
To make the map accessible to LEO partners, the mapping layers were added to an ArcGIS web
application created by the council’s GIS team. The web application development included multiple
iterations based on comments received internally within OCC and from WP4.1 partner, Oxford
Brookes University. Data in the map is shared under the Public Sector Geospatial Agreement. A user
guide to accompany the online map is included here as Appendix 1.
The LEO Integrated Land Use Map will continue to be developed by updating and adding new data
and functionality over the course of the LEO project.

5
1 Introduction
The LEO Integrated Land Use Map has been developed by Oxfordshire County Council (OCC) as the
first deliverable of Work Package 4.1. The map aims to provide an accessible overview of land use
designations and energy assets within the Oxfordshire county area to inform energy system planning
in the consolidation phase of Project LEO. The map will also provide evidence to support delivery of
the Oxfordshire Energy Strategy (Section 2).
This report outlines the development and key features of the map and identifies next steps and
opportunities for further development. A separate user guide has been prepared to accompany the
online map and is included here as Appendix 1.
2 Background and Context
Work Package 4 focuses on Future Energy System Planning. It has three components:
4.1 Spatial Mapping – led by Oxfordshire County Council and Oxford Brookes University
4.2 Temporal mapping – led by University of Oxford
4.3 Insights – led by University of Oxford
Oxfordshire County Council (OCC) is working alongside Oxford Brookes University (OBU) in Work
Package 4.1 to provide spatial energy mapping intelligence to:
• aid identification of locations for smart grid and capacity testing
• support decisions to optimise use of existing infrastructure
• aid identification of location and potential capacity for low carbon energy generation
• identify communities and households for targeted energy efficiency programmes to reduce
energy demand.
As well as supporting decisions in LEO the spatial mapping intelligence will provide evidence to
support the Oxfordshire Plan 2050 (the county’s Joint Statutory Spatial Plan)1 and delivery of the
Oxfordshire Energy Strategy2. Owned by the Oxfordshire Local Enterprise Partnership and
developed in partnership with the county’s local authorities, the University of Oxford, Low Carbon
Hub, SSEN and with input from a wide range of local stakeholders, the Energy Strategy provides the
framework to support clean growth and meet public commitments to reduce countywide carbon
emissions by 50% between 2008 and 2030 and set a pathway to net zero carbon by 2050.
Delivery of the Energy Strategy to meet this objective – and the county’s ambitious plans for housing
and economic growth - will be through many avenues and organisations and will require significant
interventions across all sectors. For example, emissions modelling commissioned to inform the
1 https://oxfordshireplan.org/ 2 Oxfordshire Energy Strategy, 2019. https://www.oxfordshirelep.com/energystrategy

6
Strategy3 indicates that renewable generation will need to provide more than 50% of the county’s
power and 40% of heat by 2030 to meet this objective, an estimated additional 2000 GWh. This will
require delivery of new generation at dwelling, community and strategic scale. Developing a
countywide energy plan based on sound evidence and data on the county’s energy resources,
demand and opportunities will be critical.
3 Purpose of the map
The integrated land use map for Oxfordshire is the first step in providing the spatial intelligence to
support energy systems planning in LEO and strategic planning for delivery of the Oxfordshire Energy
Strategy.
The map draws together a wide range of information on land use, including environmental and
landscape designations, agricultural grade, flood risk zones, planned housing and employment
growth and energy assets (including the location and installed capacity of existing renewables),
primarily shown through geographical placemarks and polygons. It also includes a new data set
created for LEO by Energeo Limited indicating areas across the county which may be suitable for
installation of additional renewables at a variety of scales, including potential strategic sites which
may be considered through the Oxfordshire Plan 2050. Further details of the Renewable Energy
Potential dataset are provided in section 6 of this report.
Presenting land use layers together in a single map, will make it easier for LEO partners in the first
instance and then for a wider group of stakeholders to identify areas of opportunity for growth of
renewable energy to inform strategic decision making.
Development of the map will continue over the coming year with the addition of further datasets
and functionality informed by the needs of project partners and other key stakeholders.
4 Methodology
The process for developing the Integrated Land Use Map was set out as MVSB1.1 in line with the
approach being taken across Project LEO4. Details are set out below and summarised in Figure 1.
4.1 Participants
i. MVS leads
The map has been developed by the Energy Insights team at Oxfordshire County Council (Anitha
Sampath and Inga Doherty), working in conjunction with the council’s GIS and digital data team.
Oxford Brookes University (Professor Rajat Gupta and Dr Angelines Donastorg Sosa) provided
support and reviewed the map prior to its release to all LEO partners5.
3 Aether, 2008. Oxfordshire Greenhouse Gas Projections. 2018 update for Oxfordshire County Council 4 Land Use Mapping MVS (Available on LEO SharePoint) 5 Integrated Land Use Map Review (Available on LEO SharePoint)

7
ii. Data providers
Data for the land use layers has been provided by Oxfordshire County Council and Energeo.
iii. Data Users will be Oxford Brookes University, the University of Oxford, Low Carbon Hub,
District Councils.
4.2 Process
Figure 1: Process for developing the Integrated Land Use Map
Pre-LEO
•Identify need for energy mapping tool
Q1-Q2
•Data Survey, Summer 2019
•Data Workshop, Sept 2019
Q2-Q3
•Energy Insights team identify & collate mapping layers
•Work with GIS team to agree scope and format
Jan 2020
•Energeo carry out countywide renewable generation assessment for LEO map
Feb 2020
•GIS team create map and develop web app
Mar 2020
•Online demo for WP4 colleagues
Review•OBU test access, review and feedback
Update
•Feedback incorporated; web app updated
•Report detailing map development created
May
2020
•Integrated land use map available to LEO partners
Year 2•Develop Local Energy Mapping Tools

8
i. Identification of need
OCC holds a wide range of geospatial data used to inform service planning and delivery. The value in
drawing together key aspects of this data into an integrated land use map to inform county-wide
energy planning was identified by OCC and partners developing the Countywide Energy Strategy and
included in Project LEO under Work Package 4 (future system learning). Consultation with LEO
partners and external stakeholders, in particular the County Energy Officers’ Network, helped define
the purpose and requirements for the map.
ii. Identifying data
A data survey was conducted by Oxford Brookes University and University of Oxford in Summer 2019
to determine data availability, data owners and access. The survey results identified many of the
data layers relevant for the mapping project and showed that the majority were held by OCC. 6
Following the initial survey, the Council’s LEO Insights Officer identified and consulted further with
teams across Oxfordshire County Council (OCC) that generate and/or manage a variety of land use
data.
• Environment Strategy Team works on natural environment issues, promoting environmental
quality and maintaining partnerships with environmental groups across Oxfordshire. They
maintain various spatial data sets relevant to energy planning which can be included in the LEO
map: county ecology; landscape management; nature conservation areas; biodiversity. In
addition, the team is close to finalising a project mapping county wide natural capital which can
be a future addition to the land use map.
• Strategic Planning Team works closely with the District and City Councils (the Local Planning
Authorities) on Local Plans and the Oxfordshire Plan. To enable a countywide overview of
planned housing and employment growth, the team have collated data from each Local
Planning Authority. This information was agreed as essential data for the land use map.
• Thames Valley Environmental Records Centre (TVERC), part funded by OCC, provides
comprehensive species and habitat data to support scientific research and planning
decisions. TVERC has provided GIS data for Local Wildlife and Geological Sites, NERC Act S41
Habitats of Principal Importance (previously called UK Biodiversity Action Plan (BAP)
6 Report on Data Survey, August 2019 (Available on LEO SharePoint)

9
habitats) and Ecological Networks (Conservation Target Areas and Biodiversity Opportunity
Areas).
• OCC’s Digital and GIS Team maintain and deliver a wide range of spatial datasets for use
within the county council as well as for an external audience. The team made available the
following data (identified in the data survey): Ordinance Survey base map, administrative
and statistical boundaries within the county, Environmental Agency flood zone classification
layers and Aerial Imagery.
iii. Agree data requirements with Stakeholders
• LEO Partners were consulted on uses and content of the mapping as part of the LEO Data
Workshop held on 30 September 20197. OCC and OBU presented the initial list of datasets
gathered. Discussions highlighted additional data requirements and considered: how to link
spatial data with temporal and metering data being used by the Technical MVS; ownership
and replicability within a local authority remit; and business models for the long-term
sustainability of an energy map or energy tool.
• External stakeholders
The County Energy Officers’ Network includes members from each of the six Oxfordshire
local authorities and is a key stakeholder and potential user for the LEO map. While the first
version of the integrated land use map is primarily for internal use by LEO partners, we
envision that future iterations with additional functionality will be available to the District
and City Councils. Ongoing discussions with the Energy Officers will keep them updated on
the wider LEO project and gain their views and uses for the land use map.
• The Greater South East Energy Hub (GSEEH) is funded by the Department of Business,
Energy and Industrial Strategy (BEIS) to support development of public sector energy
projects. As part of their work, the GSEEH have been identifying current and recent energy
mapping projects across the UK. To help develop the scope and specification of the LEO
map, we had a number of discussions with GSEEH on mapping projects completed by other
local authorities to understand what worked and what did not. Many of the issues focus on
longevity of the project (ie how to keep it live beyond the funding period), others highlighted
7 Data Workshop Report, September 2019 (Available on LEO SharePoint)

10
challenges in access to data, including feed in tariff data for property level renewables as
well as grid constraint data.
iv. Data processing
Once the LEO team within OCC had finalised the list of layers required, the GIS team worked towards
building the online version of the map on the ESRI platform. All layers included in the map are listed
and described in Section 5, with further details on new data generated for the project explained in
Section 6. A detailed description of the methodology used to develop the web application is
presented in Section 7.
v. Feedback on the integrated land use map application
The web application, once created, was tested by OBU, who provided an impartial review of the
integrated land use map in terms of user interface ease and layer positioning8.
vi. Refinement of the integrated land use map
Recommendations made by OBU were used to refine the final iteration of the map before making it
available to LEO partners.
vii. Sharing the Integrated land use map web application
OCC is able to share the online map through their Public Sector Geospatial Agreement (previously
the Public Sector Mapping Agreement). All parties accessing the map were required to sign the
Ordnance Survey PSGA data license and the APGB (Aerial Photography Great Britain) licensing
agreement.
8 Integrated Land Use Map Review (Available on LEO SharePoint)

11
5 Layer List and Explanations
In this section, we provide a brief description of each of the data layers identified for inclusion in the
Integrated Land Use Map following discussions with stakeholders. The data has been organised into
four categories:
i. Planning and environmental constraints – includes details on planned housing and employment growth and planning constraints (e.g. areas with nature conservation designations, flood risk zones)
ii. Electricity network
iii. Aerial photography
iv. Renewable generation potential.
The fourth category is a new data set created for the LEO project by Energeo Ltd. Full details are
provided in Section 6. Details of each mapping layer are given in the following tables.
5.1 Planning and environmental constraints
Table 1 Boundaries
Layer Description
District and City Council boundaries
Oxfordshire County is a 2-tier authority area. This layer provides the boundaries for the district areas.
Parish boundaries Boundaries of 280 civil parishes within Oxfordshire county.
Ward boundaries Boundaries of 112 wards in the county.
LSOAs Boundaries of 404 LSOA in Oxfordshire.
Lower Layer Super Output Area (LSOA) is a geospatial statistical unit created by the Office for National Statistics (ONS). Each LSOA has a minimum population of 1000 and the mean is 1500.
MSOAs Boundaries of 86 MSOAs in Oxfordshire.
Middle Layer Super Output Area (MSOA) is a geospatial statistical unit created by ONS with a population between 5000 and 7200

12
Figure 2: Oxfordshire County boundary including constituent Local Authorities 9
9 For this and all other maps in this report -- © Crown copyright and database rights 2020 OS 0100023343
© Crown copyright and database rights 2020 OS 0100023343 © Crown copyright and database rights 2020 OS 0100023343
West Oxfordshire
Cherwell
South
Oxfordshire Vale of
White Horse
Oxford City

13
Table 2 Planning Layers
Layer Description
Oxfordshire adopted housing and mixed-use allocations
These are sites that have been allocated for housing and/or employment in adopted Local Plans.
Oxfordshire commitments and completions, May 2019
Development sites that have secured planning permission and are currently being built or already completed by May 2019 (latest data).
Oxfordshire emerging allocations
Areas being proposed for inclusion in future revisions of the Local Plans (those not adopted by May 2019).
Figure 3: Example of planning constraint layers

14
Table 3 Environment Layers
Layer Description
Areas of Outstanding Natural Beauty (AONBs)
Areas designated by Natural England to protect and manage the areas for conservation, visitors, and residents.
Green Belt 2018 Area of open countryside maintained through National Planning Policy to prevent urban sprawl
Ancient Woodland Areas of woodland that have persisted since 1600 in England and Wales. They are unique and complex communities of plants, fungi, insects and other microorganisms.
Special Areas of Conservation (SAC)
Conservation areas of international importance and defined in the EU Habitats Directive (92/43/EEC), also known as the Directive on the Conservation of Natural Habitats and of Wild Fauna and Flora.
Sites of Special Scientific Interest (SSSI)
A formal conservation designation used by Natural England for the finest sites for wildlife and natural features in England, supporting many characteristically rare and endangered species, habitats and natural features.
SSSI Impact Risk Zones (IRZ) A GIS tool developed by Natural England to make rapid initial assessment of the potential risks posed by development proposals to SSSIs.
Conservation Target Areas, Oxfordshire (CTA Oxon)
Some of the most important areas for wildlife conservation in Oxfordshire, where targeted conservation action will have the greatest benefit.
CTA (Conservation Target Areas) Key link zones
The key link zones of CTA include surrounding land which can buffer and link areas thereby creating important larger and better-connected landscapes.
District Wildlife sites Sites of importance within each district for wildlife which include important and rare habitats and species.
County Wildlife sites Sites of importance at the county level for wildlife which include important and rare habitats and species.
National Nature Reserves Sites designated by Natural England as key places for wildlife and natural features in England.
RSPB reserves England The Royal Society for the Protection of Birds (RSPB) reserves serve to promote conservation and protection of birds and the wider environment through public awareness campaigns, petitions and through the operation of nature reserves throughout the United Kingdom.

15
Environment Agency (EA) layers
a. EA admin boundaries: Water Companies
b. EA Admin boundaries: Water Management Companies
c. EA detailed river network
d. EA flood map defences
e. EA Flood map areas benefit
f. EA flood zones
g. EA ground water vulnerability 100K
h. EA ground water vulnerability drift 100K
i. EA areas susceptible to groundwater flooding
Landscape Types This data is an investigation of landscape character and biodiversity across the county.
Common Land Land owned by a person (or persons) over which another person has certain rights, e.g. the ‘right to roam’.
National Trust Land Land owned and/or looked after by the National Trust including countryside and heritage landscapes.
Parks and gardens Boundaries of parks and gardens within the county as registered on the Historic England list.
Public Rights of Way Public rights of way allow the public to walk, or sometimes ride, cycle or drive, along specific routes over land which belongs to someone else – the land itself is often privately owned.
National Trails Long distance footpaths and bridleways administered by Natural England.
Table 4 Archaeology Layers
Layer Description
Listed buildings Buildings with special historical or architectural importance and are of national interest.
Scheduled Monuments The most important archaeological remains are designated as Scheduled Monuments by Historic England.

16
5.2 Electricity Network Layers
Layer Description
Existing renewable energy sites The Renewable Energy Planning Database (REPD) is managed by Eunomia Research and Consulting Ltd (Eunomia) on behalf of the Department for Business, Energy and Industrial Strategy (BEIS). The database tracks the progress of renewable energy projects (including those that can be used for combined heat and power (CHP)) though various stages such as – inception, planning, construction, operation, and decommissioning.
LEO Site Selection Primary Substations
12 primary substation areas selected for LEO flexibility trials.
Substation site Location of electricity substations
Electricity pylons Location of electricity pylons
Electricity Lines Location of electricity lines
5.2 Aerial Photography
This layer includes the 25cm resolution aerial imagery captured by Blue Sky, part of the Aerial
Photography Great Britain consortium and available under the Public Sector Geospatial Agreement of
which the County Council is a member.
Figure 4: Sample Aerial Photography for Oxford City

17
5.4 Renewable generation potential layers
a) Solar suitable land and estimate of potential generation capacity
b) Wind suitable land and estimate of potential generation capacity.
Details of this dataset are provided in the following section.
6 Renewable Generation Potential
As well as including existing data on land use and planning constraints, the web application includes
new data generated for the LEO spatial mapping project by Energeo Limited as set out below.
Energeo was identified as organisation offering new insights for energy planning through their use of
geospatial Big Data and Machine Learning and was selected by Oxfordshire County Council (OCC)
and the LEO consortium to undertake a detailed study into the potential to deploy a variety of low
carbon technologies across the county.
In the first stage of this study, Energeo undertook a desk-based analysis to:
i. Assess all individual land areas across Oxfordshire of 0.5 hectares or more to identify areas
suitable for solar and / or wind generation.
ii. For each suitable area identified, estimate the potential generation capacity of the
installation.
Energeo used the criteria set out in Tables 5 and 6 to determine whether an area was potentially
suitable for solar and/or wind generation.

18
Table 5 Specification for solar suitability assessment
Step Specification for solar suitability
1 Not on Grade 1 or 2 agricultural land
2 Not in the green belt
3 Not in flood zones 2 or 3
4 Not in a SSSI, AONB, or other conservation zone
5 No buildings within field parcel
6 No woodland within field parcel
7 No water within field parcel
8 Pitch 0-10 degrees within the 90-270 (through south) aspect arc
9 Pitch 0-3 degrees within the 270-90 (through north) aspect arc
10 Minimum size 0.5 hectares
11 For sites that meet all the above criteria, estimate potential install capacity: Capacity: 1MW installed per hectare
Table 6 Specification for estimating wind energy suitability
Step Specification for wind suitability
1 Not on Grade 1 or 2 agricultural land
2 Not in the green belt
3 Not in flood zones 2 or 3
4 Not in a SSSI, AONB, or other conservation zone
5 No buildings within field parcel or immediately adjacent parcels
6 No woodland within field parcel or immediately adjacent parcels
7 No water within field parcel or immediately adjacent parcels
8 Pitch 0-10 degrees within the 180-270-0 degree arc
9 Average wind speed 6 metres per second at 45m above ground level (AGL)
10 Minimum size 0.6 hectares
11 For sites that meet all the above criteria, estimate potential install capacity Capacity: 1MW installed per 0.3 hectare (estimation of potential installed capacity not energy generation)

19
Based on the above specifications, Energeo assessed 32,096 parcels of land across the county. Of
these, 9,520 land parcels, a total area of approximately 46,095 hectares, were estimated to be
suitable for solar generation (Figure 5); 517 land parcels over approximately 2,122 hectares of land
were estimated suitable for wind generation (Figure 6).
The dataset is intended as an indicator of potential suitability only and may inform selection of areas
for deeper investigation.
Figure 5: Assessment of ground mount solar suitability across Oxfordshire

20
Figure 6: Assessment of wind generation suitability across Oxfordshire
The solar and wind generation estimates have been incorporated in the first iteration of the LEO web
application. In future parts of this work, Energeo will digitally study over 110 square kilometres of
urban conurbation and over 250,000 buildings in 10 market towns in Oxfordshire to determine their
potential for low carbon technologies and the benefits of deployment.

21
7 Web Application
7.1 Developing the web application
It is vitally important that the digital data generated for the mapping can be readily accessed by the
stakeholders that need it. The data is therefore hosted by OCC and made available through a web
application which will be accessible to LEO partners and to our district councils, and other key
stakeholders as required.
Once the LEO team within OCC had finalised the list of layers required, the GIS team developed the
online version of the map on the ESRI platform. ESRI (Environmental Systems Research Institute) is an
international supplier of geographic information system software, web GIS and geodatabase
management applications. OCC has an enterprise partnership with ESRI which allows us to host our
data on the ArcGIS web application through our Oxfordshire Online Map Portal. The steps to
developing the web application are set out in Table 7 below.
Table 7 Timeline of web application development
Step Activity Time Line Description
1 Initial Map Developed Feb 2020 The OCC GIS team developed an initial map based on specifications and list of layers provided by the Energy Insights Team.
2 Feedback and re-work 26th Feb 2020 Based on internal feedback on the initial map, the GIS team exported an updated version onto the ArcGIS web portal
3 Demo to WP4 partners 5th Mar 2020 A demonstration of the initial map was done for WP4 partners from Oxford Brookes University. Along with the demonstration, OBU were provided access to the map on ArcGIS online.
4 Feedback from Oxford Brookes University (OBU)
1st Apr 2020 Oxford Brookes University provided feedback on the web app developed by OCC.
5 Updated App May 2020 The GIS team updated the web app based on feedback received.
6 Data sharing licences agreed
May 2020 All partners who wish to view the map need to sign the Public Sector Geospatial Agreement and the licenses for Aerial Photography Great Britain.
6 Sharing with LEO partners
Jun 2020 The first version of the LEO integrated land use map will be shared with all LEO partners.

22
7.2 Review and feedback on the land use map web application
The feedback provided by OBU aided the creation of the final iteration of the land use map. Table 8
below provides a summary of the feedback provided by OBU.
Table 8 Review of initial web application
No. Recommendations
1 Grouping the layers into 3 categories: (1) Existing (2) Potential (inferred using
assumption/calculations) and (3) Aerial photos, would clarify the validity of the layers.
2 Percentage of the unsuitable and potentially suitable areas (for solar or wind energy
potential) could be added.
3 Addition of a help button to provide information on what each button and feature does
4 Provision to download layer(s) can be added. This is subject to signing of the data sharing
agreement.
5 Lowering the colour intensity of some layers and adding transparency to polygon layers.
6 Provision to see multiple pop-ups for the different layers.
7 Other energy vectors must be taken into account, information regarding heating, storage
and transport vector should be added.
Where possible, the current iteration of the integrated land use map reflects these
recommendations.
7.3 Accessing the web application
The data in the online Integrated Land Use map is shared through the Public Sector Geospatial
Agreement (previously the Public Sector Mapping Agreement). This is a central government funded
scheme which enables local authority members to access:
• Ordnance Survey premium chargeable digital spatial data,
• APGB Aerial Photography Great Britain Mapping Consortium imagery and digital terrain
models, and
• GeoPlace and OS gazetteer data including Royal Mail postcode address files.
The terms of the agreement allow the council to share data with partners to deliver their core
business. To do this and meet the requirements of the council’s PSGA, all partners will be required to
sign the Ordnance Survey PSGA data license and the APGB (Aerial Photography Great Britain)
licensing agreement.
23
7.4 Using the map
A user guide has been compiled to accompany the current online map and is included here as
Appendix 1.
8 Future Developments
The LEO integrated land use map will continue to be developed in Year 2 of the project, initially to
include additional data, for example network constraints (other potential datasets are listed
overleaf). Further development will create an energy mapping tools to provide descriptive and
quantitative energy insights. The developments will be informed by consultation with stakeholders
to identify user needs and requirements.
Datasets suggested for inclusion in the second phase:
1. Actual current and predicted electricity demand (from SSEN)
2. Domestic electricity (and gas) consumption by postcode and LSOA
3. Off gas areas
4. People’s power station (Integration with Low Carbon Hub’s map of installed community
owned renewable energy projects)
5. Socio-economic indicators, including fuel poverty and indices of deprivation
6. Weather information i.e. Met. Office, Historical Information from the European Centre for
Medium-Range Weather Forecasts (ECMWF)
7. River heights - to understand if there’s capacity for hydro.
8. CORINE Land Cover data
9. Transport data (including electric vehicle charge points).

24
Appendices
A: User Guide for Integrated Land Use Web Application
Introduction The LEO Integrated Land Use Map is an ArcGIS web application hosted by Oxfordshire County
Council. This web application will help to identify locations across Oxfordshire which may be suitable
for infrastructure related to the LEO project. It draws together a wide range of spatial data layers
(full details are presented in the body of this report) which the user can switch on as required. This
guide sets out how to use the web application.
The LEO Integrated Land Use Map The LEO integrated Land Use Map opens to show the Oxfordshire county area displayed in Figure 1
below. The navigation and zoom functions appear on the top left corner of the map. The various
features of the web application are shown as icons on the bar at the right of the screen. Each
feature is explained in the following sections.
Figure 7: Landing page of LEO map10
10 For this and all other maps in this report -- © Crown copyright and database rights 2020 OS 0100023343
Feature
buttons
Zoom in
or out
Find an
address
o

25
Navigation The LEO map uses an Ordnance Survey base map
• Find your way round by dragging your mouse across the map.
• Zoom in and out using the buttons on screen or by using your mouse.
• Enter an address or postcode to zoom to an area using the address finder widget.
Figure 8: Navigating the map

26
Layers When the App is launched it opens to display the countywide solar potential dataset created for
Project LEO by Energeo. All other layers in the application are switched off by default to increase the
speed at which the App launches.
To open the complete list of layers click on the layers button on the top right of the map as
shown in figure 3 below.
Figure 9: Viewing layers on the map
The data layers in the map are divided into four broad categories:
1. Renewable potential estimation
2. Electricity network layers
3. Planning and environmental constraint layers
4. Aerial imagery
The full list of layers and a short definition for each of the data sets is given in Appendix A.
Click here to
open layers
27
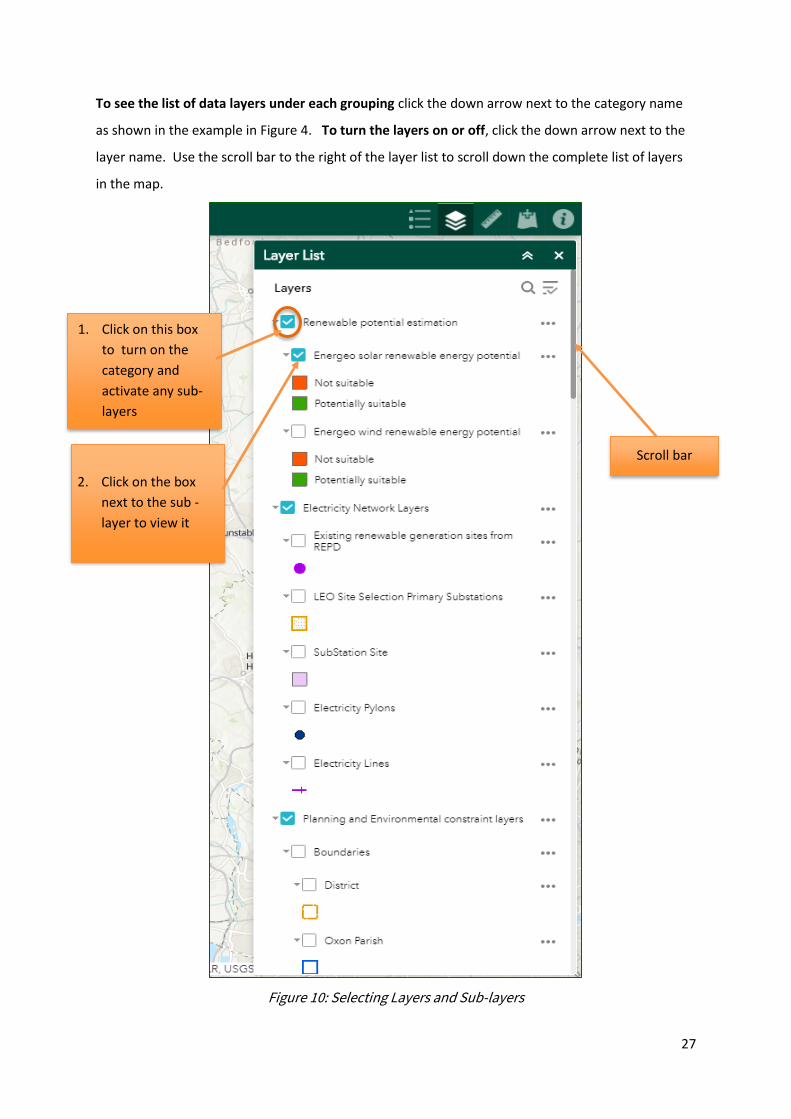
To see the list of data layers under each grouping click the down arrow next to the category name
as shown in the example in Figure 4. To turn the layers on or off, click the down arrow next to the
layer name. Use the scroll bar to the right of the layer list to scroll down the complete list of layers
in the map.
Figure 10: Selecting Layers and Sub-layers
1. Click on this box
to turn on the
category and
activate any sub-
layers
2. Click on the box
next to the sub -
layer to view it
Scroll bar

28
Legend To view the legend of the map, click on the legend button in the top right of the map
(figure 5).
When you have multiple layers turned on, the legend displays the symbology for each of the
associated layers as shown in figure 6.
Figure 11: View the Legend for the map
Click here to
open legend

29
Figure 12: Legend when multiple layers are viewed at the same time
Lists all the layers that are
being viewed and the
corresponding symbology for
each of the active layers

30
Attributes Clicking on the map will bring up a text box showing the attributes for the selected mapping layers
for that area as shown in figure 7.
If more than one layer is switched on for the same area, the pop up will show details for each; the
example in figure 7 shows (2 of 2). Use the arrows in the top right of the pop-up box to view the
attributes for each layer.
Figure 13: Attribute box and details for each associated feature
1. Click on the
map to open
attribute box
2. Use the Arrow
buttons to
view all details
31
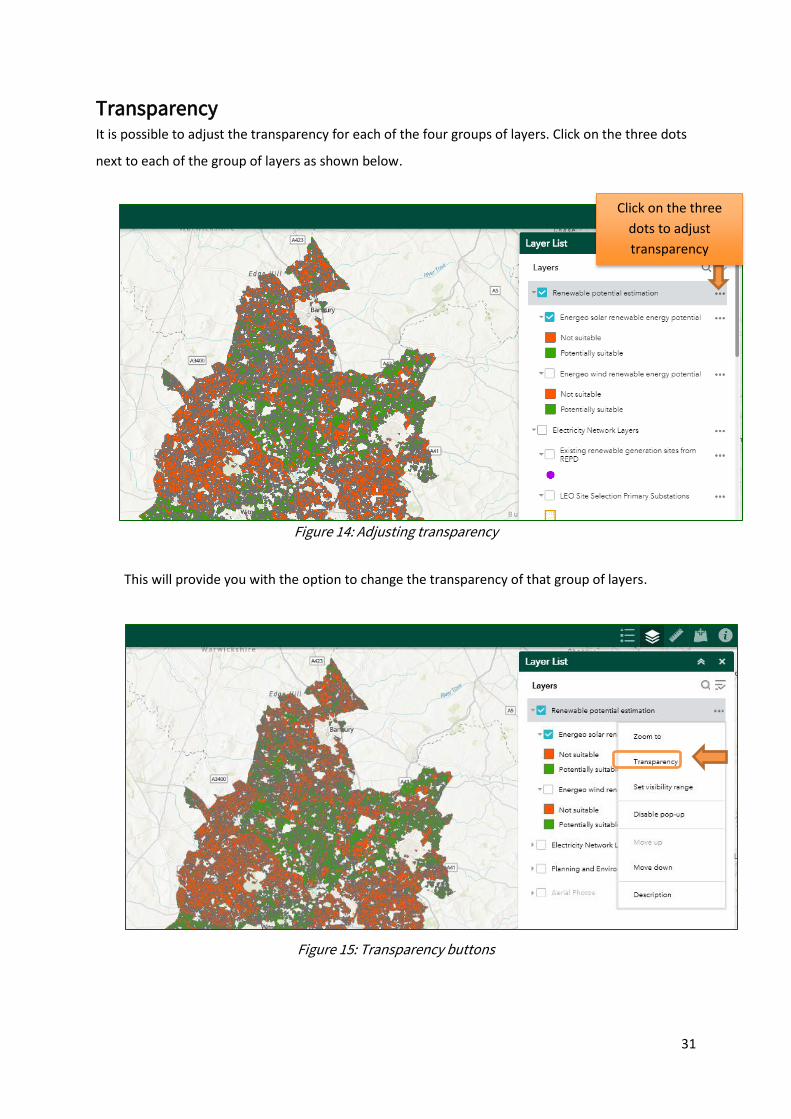
Transparency It is possible to adjust the transparency for each of the four groups of layers. Click on the three dots
next to each of the group of layers as shown below.
Figure 14: Adjusting transparency
This will provide you with the option to change the transparency of that group of layers.
Figure 15: Transparency buttons
Click on the three
dots to adjust
transparency

32
To adjust the transparency, click on the transparency option to open a moveable bar. Please note
that transparency can only be adjusted at the main category level (discussed in the Layer section)
but not for each individual layer.
Figure 16: Adjusting transparency
Adjustable
transparency bar

33
Adding data It is possible to add your own data to the map by using the add data button.
However, please note that this data does not get saved into the online map.
Click the ‘add data’ button to open a dialogue box. Drop (or browse for) your data file onto the box
as shown in figure 11. This adds the data which can be used for analysis at that moment but once
you close the map, it does not save the new data. The data can be added in any one of the following
formats:
• Zipped shape file
• .csv file
• KML file
• GPX file
• Geo JSON
Please note that the web application has limitations in the extent of analysis that can be done
online. For large scale data, it is best to conduct a desktop based analysis. Please contact us (details
in section 10) if you wish to conduct any intensive analysis on this data.
Figure 17: Adding data
Add Data
button
Click on ‘Browse’
to add the data

34
Measurement Widget Use the measurement widget to measure distances or areas within the map. The widget
provides three options as shown in figure 12:
i. calculate area of a selected polygon
ii. calculate distance between two or more points on the map
iii. identify a location with the corresponding latitude and longitude
Figure 18: Measurement widget
1. Click Measurement
button to open
dialogue box
ii. Measure
distance
iii. Identify
location
i. Measure
Area

35
About Button Click on the about button on the top right corner of the screen to see a brief summary of the map as
well as the link to this user guide.
Figure 19: About Button
Support If you have any questions about using the LEO Integrated Land Use Map, please contact
About
Button