Embed Size (px)
Citation preview
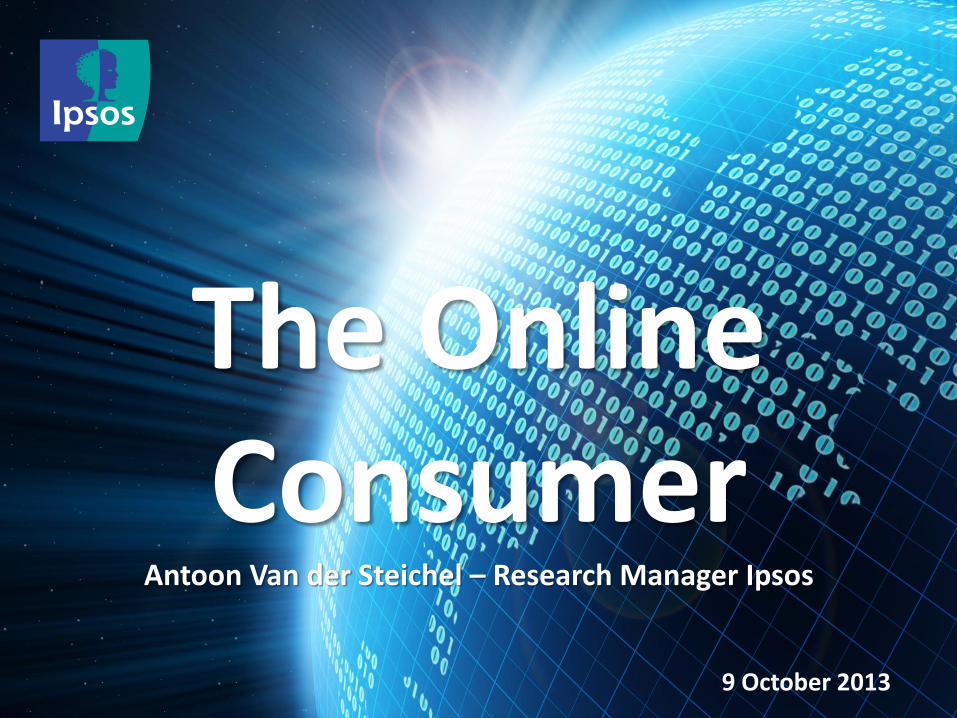
The Online Consumer
Antoon Van der Steichel – Research Manager Ipsos
9 October 2013
2
IPSOS
3
1
4
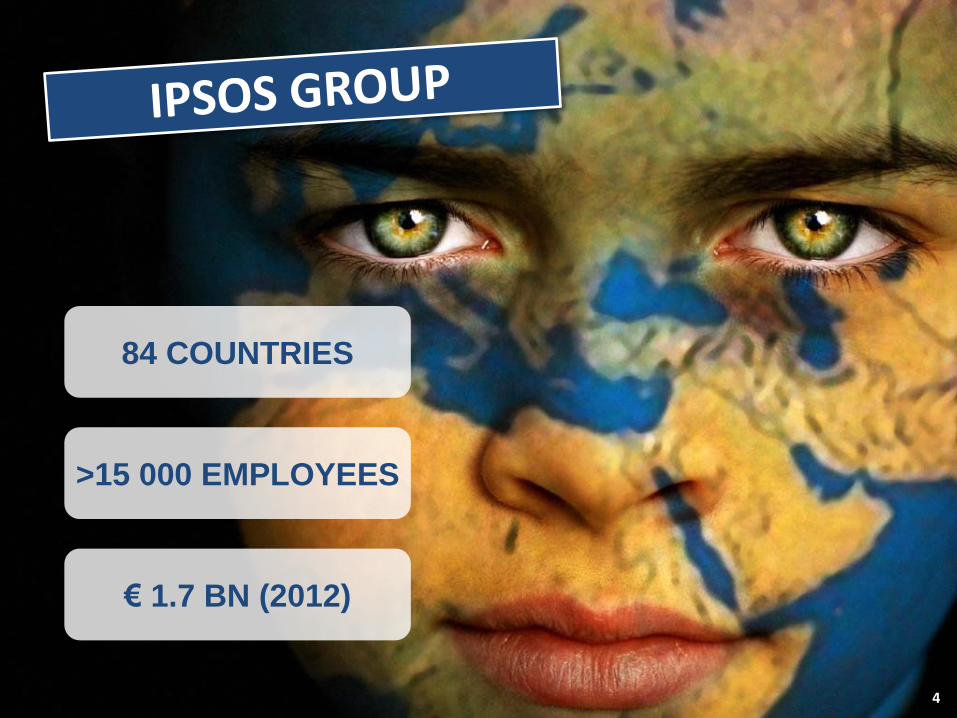
84 COUNTRIES
>15 000 EMPLOYEES
€ 1.7 BN (2012)
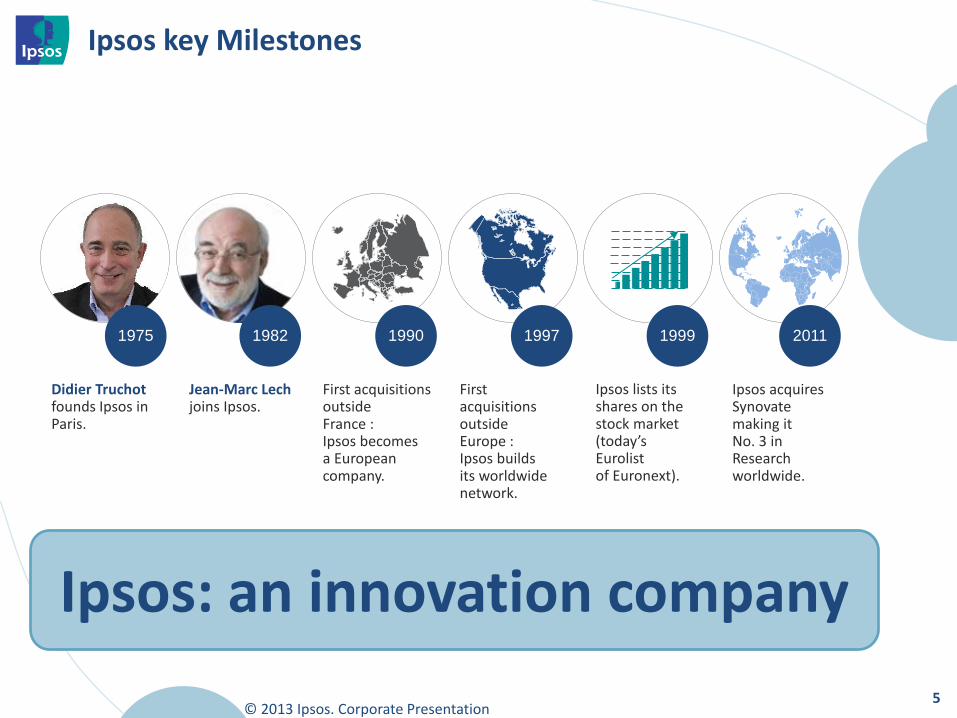
Ipsos key Milestones
© 2013 Ipsos. Corporate Presentation 5
First acquisitions outside France : Ipsos becomes a European company.
Didier Truchot founds Ipsos in Paris.
Jean-Marc Lech joins Ipsos.
First acquisitions outside Europe : Ipsos builds its worldwide network.
Ipsos acquires Synovate making it No. 3 in Research worldwide.
Ipsos lists its shares on the stock market (today’s Eurolist of Euronext).
1975 1982 1990 1997 1999 2011
Ipsos: an innovation company
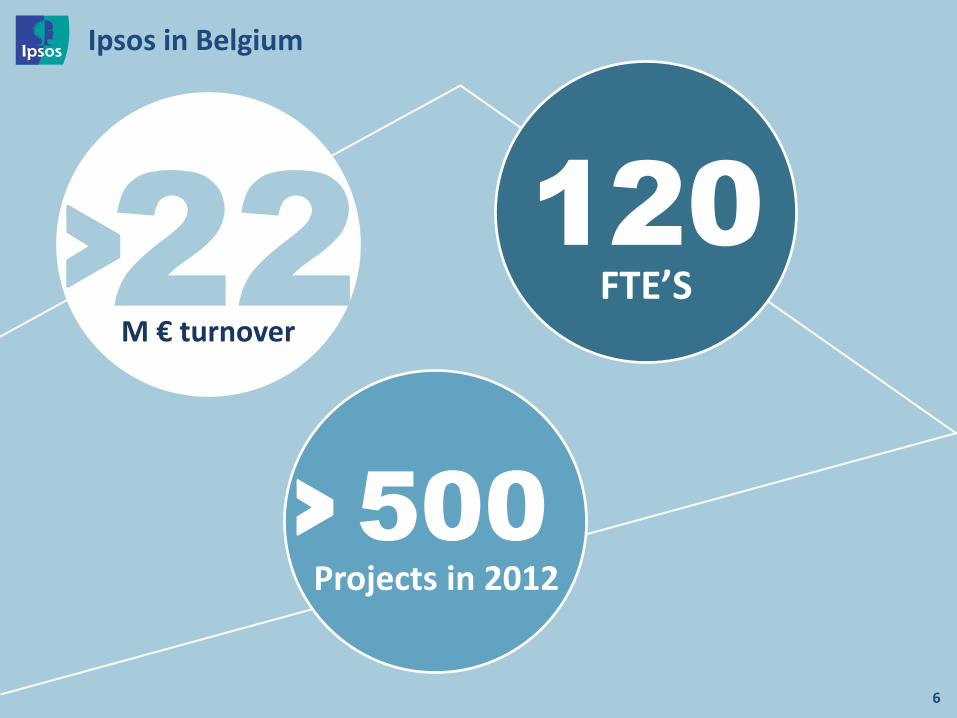
22 M € turnover
120 FTE’S
Projects in 2012
500 >
>
Ipsos in Belgium
6
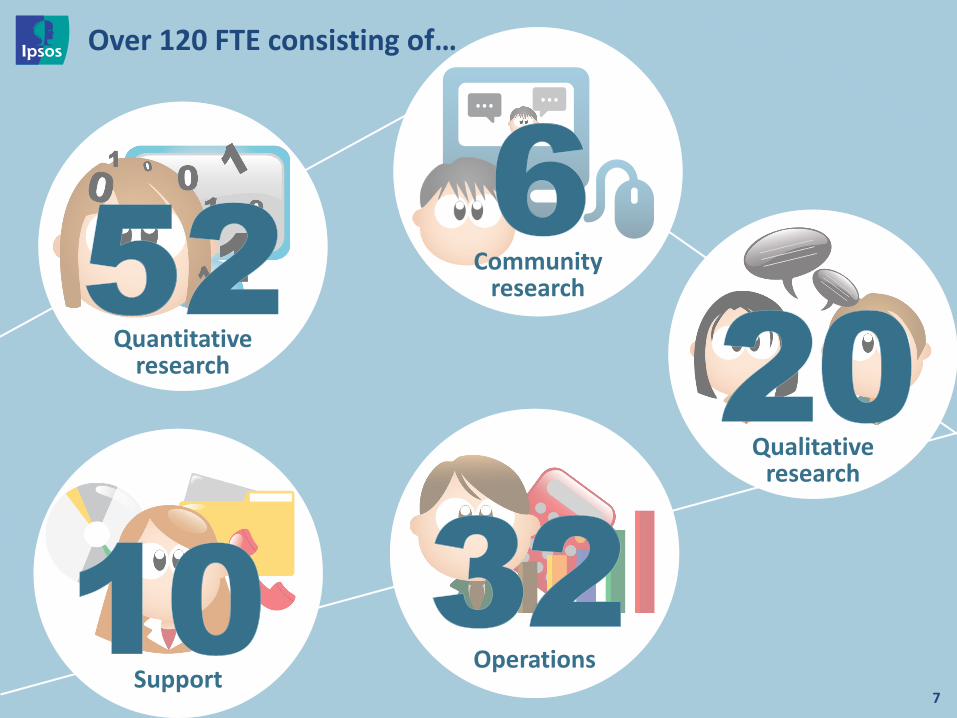
Over 120 FTE consisting of…
7
Qualitative research
0
Support
0
Operations
Quantitative research
Community research
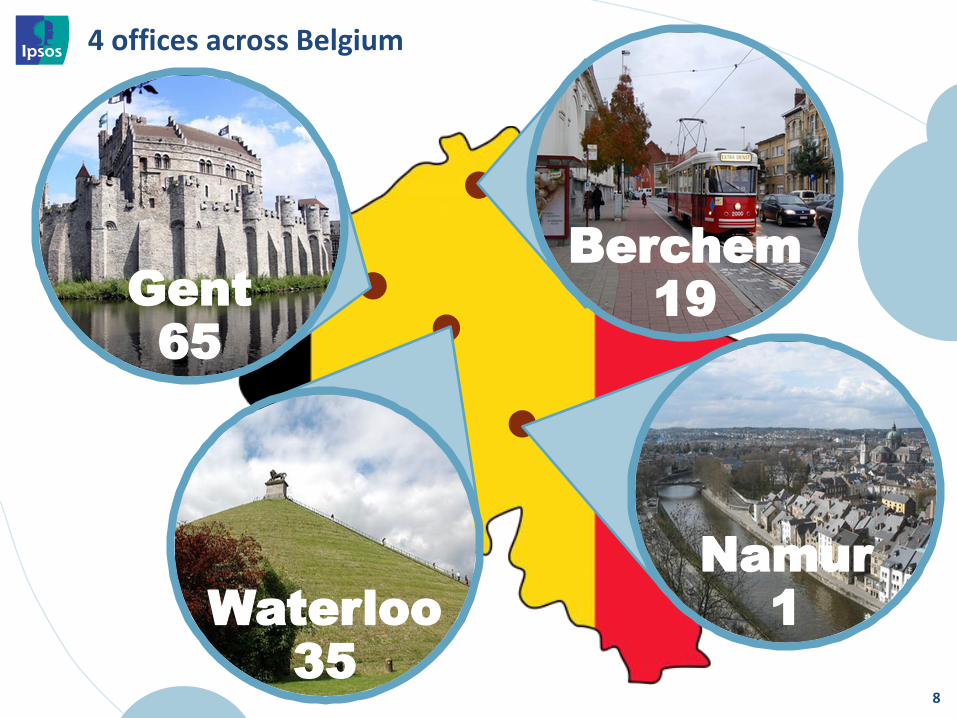
4 offices across Belgium
8
Gent
65
Berchem
19
Namur
1 Waterloo
35
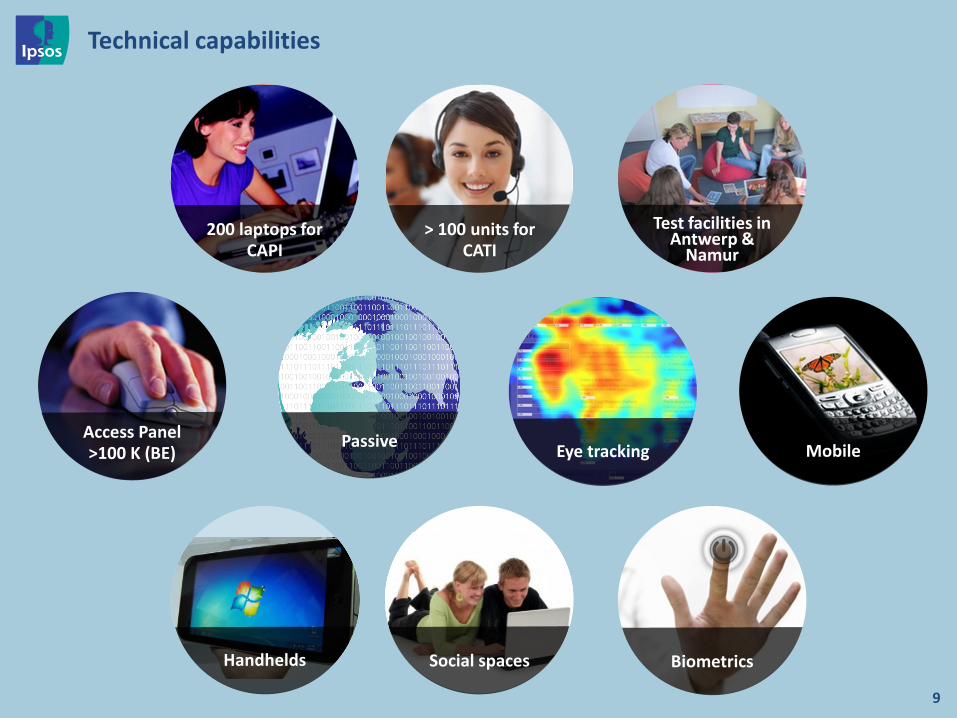
Technical capabilities
9
200 laptops for CAPI
> 100 units for CATI
Test facilities in Antwerp &
Namur
Access Panel >100 K (BE) Eye tracking Mobile
Handhelds Social spaces Biometrics
Passive
10
And many more
Ipsos Belgium : our references
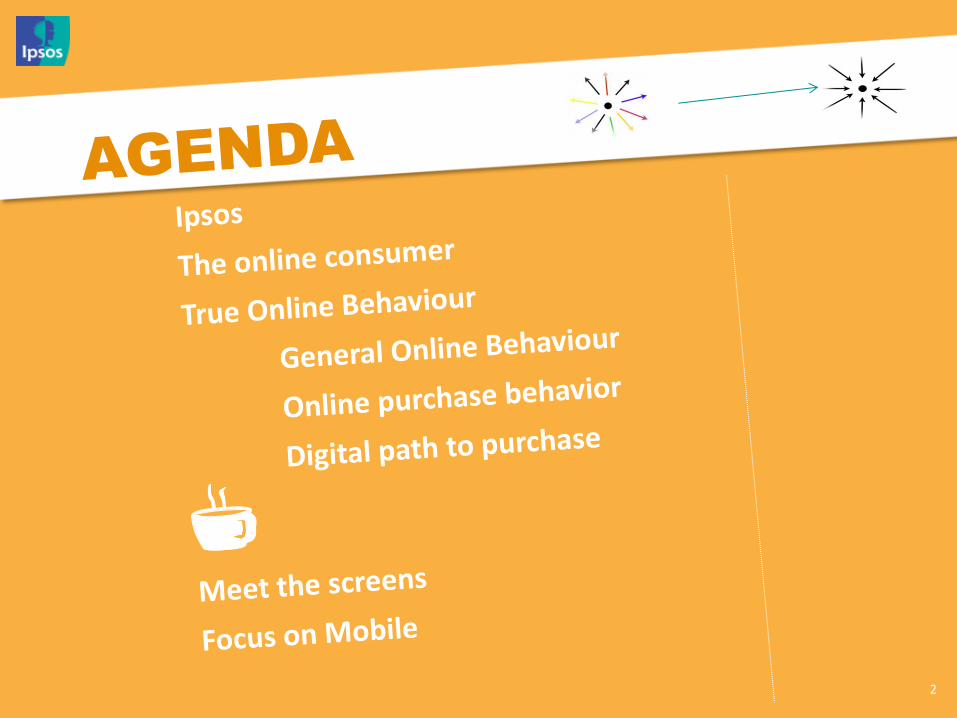
The online Consumer
12
2
WELCOME TO THE
NEW NORMAL
Where consumers are constantly
connected – and “always on” is their
default setting

WELCOME TO THE NEW NORMAL
Where we are accelerating towards the
new singularity – a tipping point where the
storing of a consumer’s life information will
be in a single portable digital device
WELCOME TO THE NEW NORMAL
Where we will need to learn to cope with
“super abundance” – tools, choices, apps will
move to “one touch” actions combined with the
visualization of information
WELCOME TO THE NEW NORMAL
Where we are moving towards a culture
where information about most things
becomes freely available
WELCOME TO THE NEW NORMAL
And where personalization via devices and
applications will continue to quickly grow
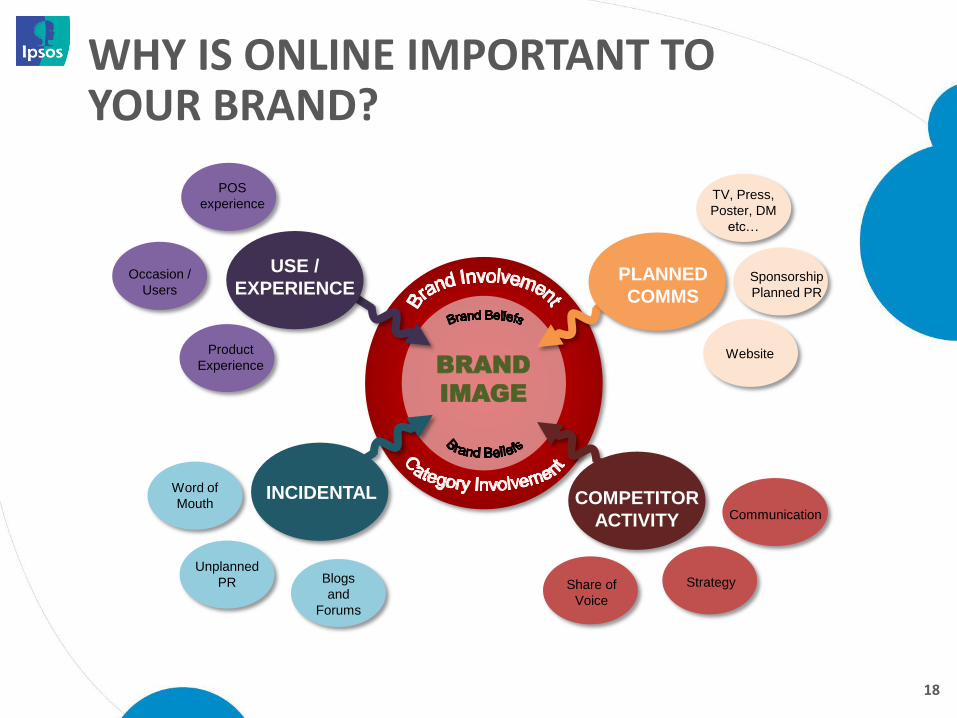
BRAND
IMAGE
TV, Press,
Poster, DM
etc…
Sponsorship
Planned PR
Website
PLANNED
COMMS
Share of
Voice
Strategy
Communication COMPETITOR
ACTIVITY
Word of
Mouth
Unplanned
PR Blogs
and
Forums
INCIDENTAL
Product
Experience
Occasion /
Users
POS
experience
USE /
EXPERIENCE
WHY IS ONLINE IMPORTANT TO YOUR BRAND?
18
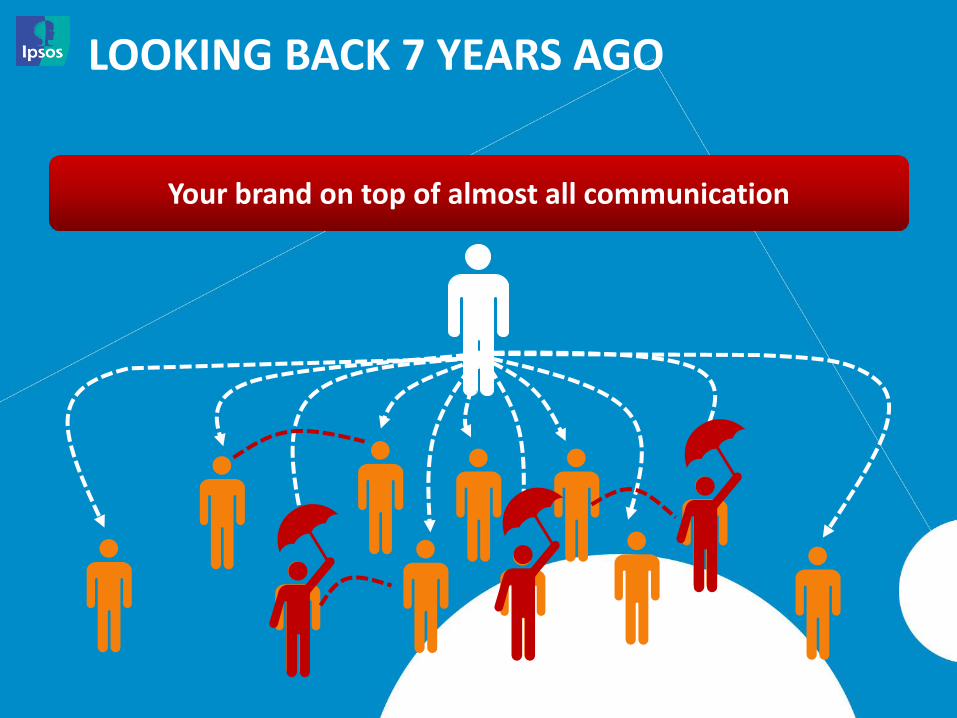
LOOKING BACK 7 YEARS AGO
Your brand on top of almost all communication
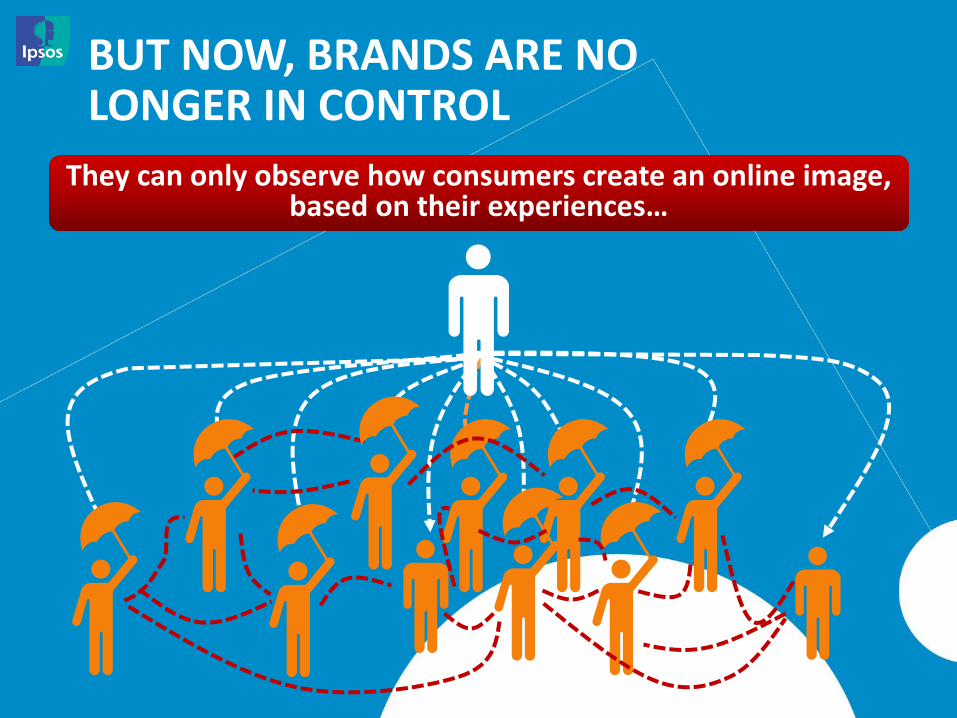
BUT NOW, BRANDS ARE NO LONGER IN CONTROL
They can only observe how consumers create an online image, based on their experiences…
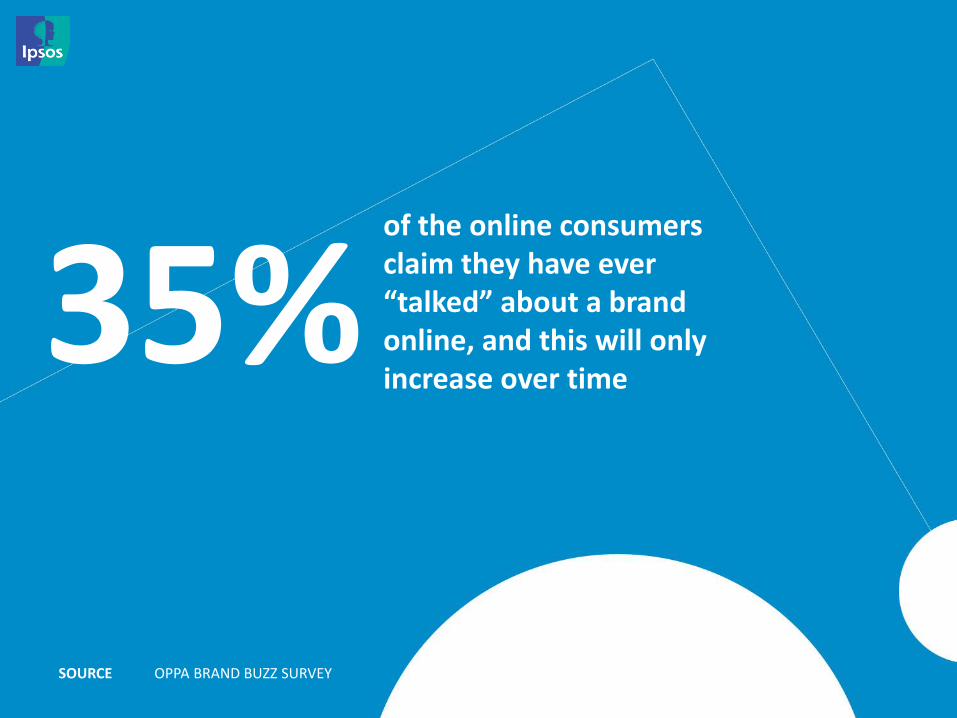
35% of the online consumers claim they have ever “talked” about a brand online, and this will only increase over time
SOURCE OPPA BRAND BUZZ SURVEY
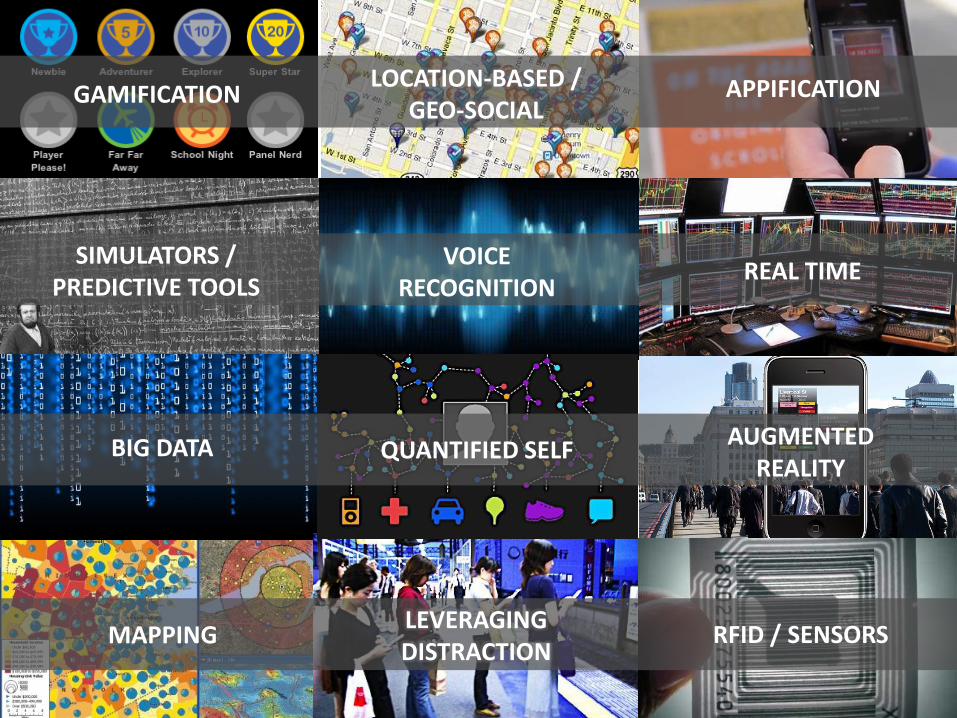
IMPLICATIONS FOR MARKET RESEARCH
23 23
GAMIFICATION
SIMULATORS / PREDICTIVE TOOLS
VOICE RECOGNITION
REAL TIME
QUANTIFIED SELF AUGMENTED
REALITY BIG DATA
MAPPING RFID / SENSORS LEVERAGING DISTRACTION
LOCATION-BASED / GEO-SOCIAL
APPIFICATION
We need to evolve our tools
TECHNOLOGY
WILL BE THE BIG ENABLER
OF THE MARKET RESEARCH
OF THE FUTURE
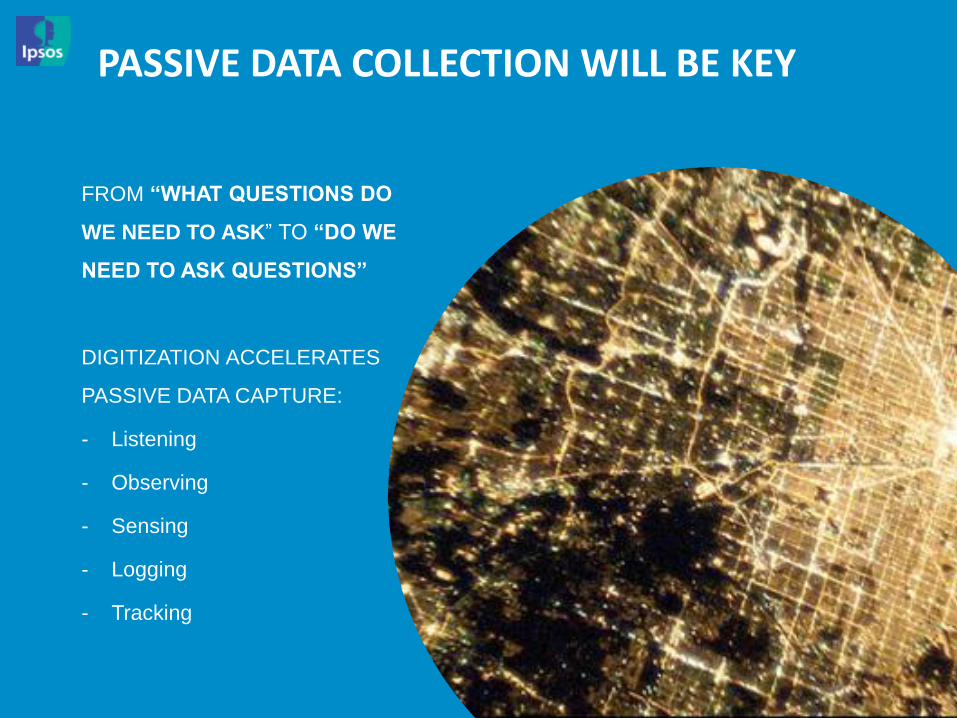
PASSIVE DATA COLLECTION WILL BE KEY
FROM “WHAT QUESTIONS DO
WE NEED TO ASK” TO “DO WE
NEED TO ASK QUESTIONS”
DIGITIZATION ACCELERATES
PASSIVE DATA CAPTURE:
- Listening
- Observing
- Sensing
- Logging
- Tracking
26
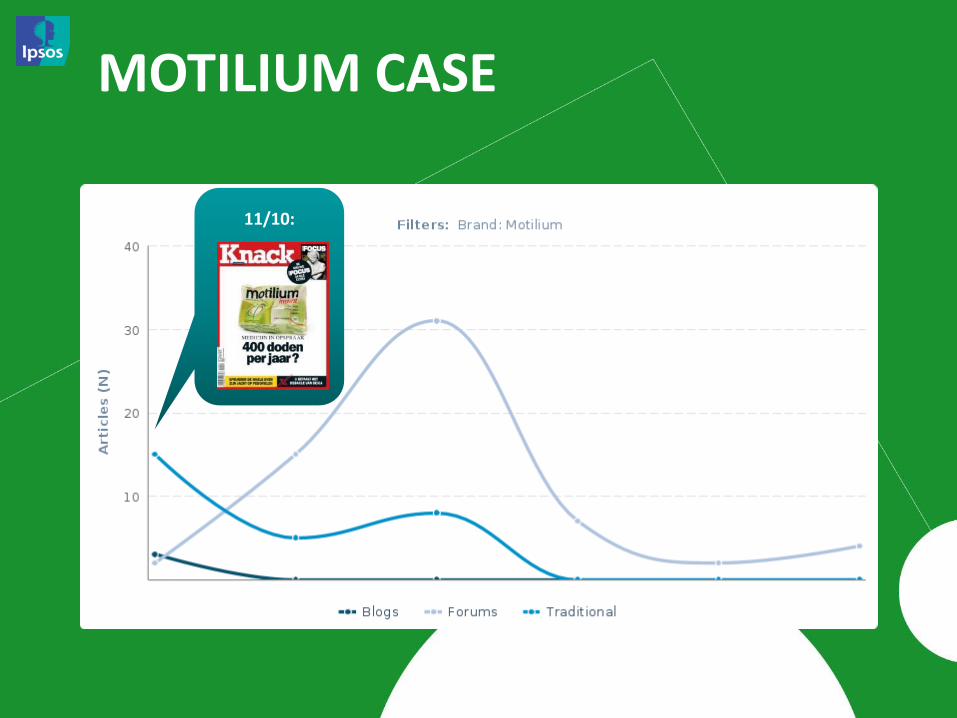
SOCIAL LISTENING OFFERS AN
UNFILTERED VIEW INTO HOW
PEOPLE TALK ABOUT, SHARE,
AND PROMOTE YOUR BRAND
ONLINE
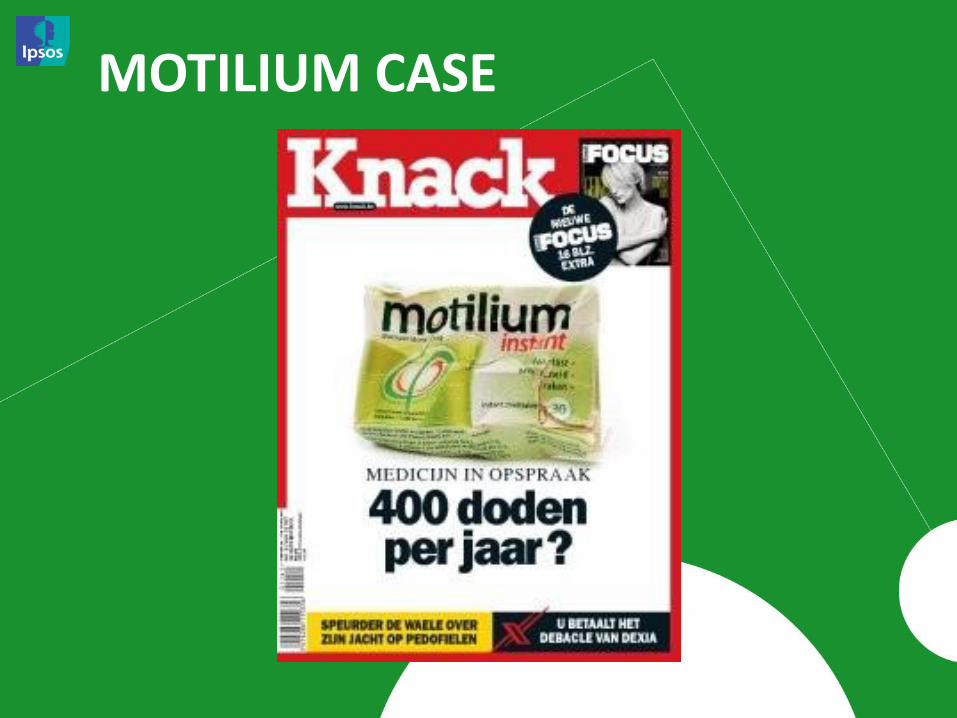
MOTILIUM CASE
27
28
11/10:
MOTILIUM CASE
29
PASSIVE MEASUREMENT
= REAL TIME
OBSERVATION OF
BEHAVIOUR
30
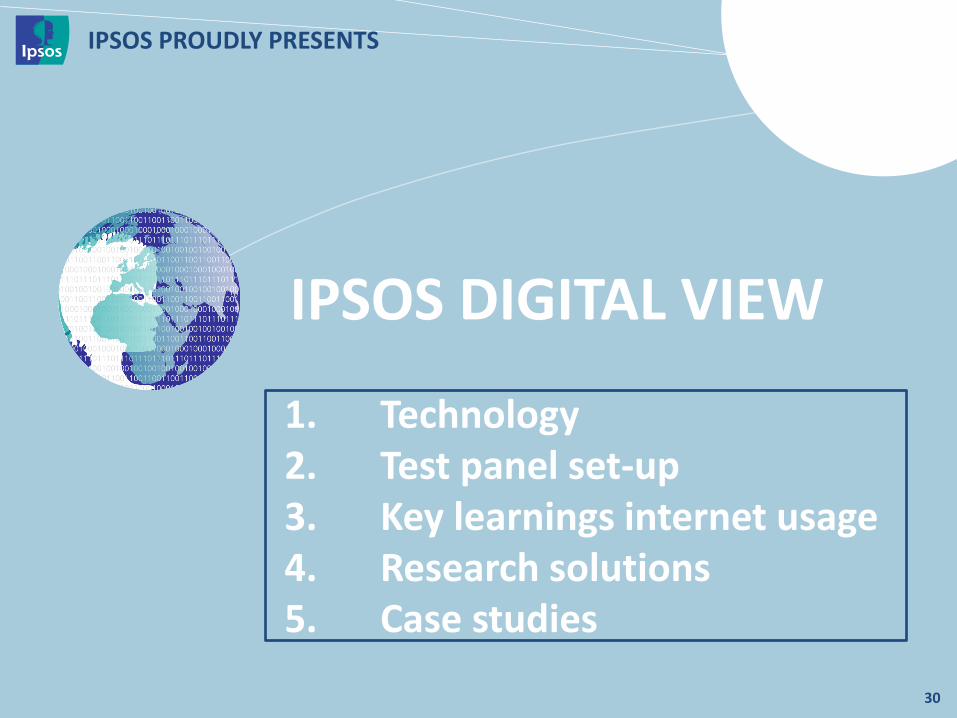
IPSOS PROUDLY PRESENTS
IPSOS DIGITAL VIEW
1. Technology 2. Test panel set-up 3. Key learnings internet usage 4. Research solutions 5. Case studies

IPSOS DIGITAL VIEW
The technology
31
Ipsos Digital View
32
33
EVERYTHING
Ipsos Digital View
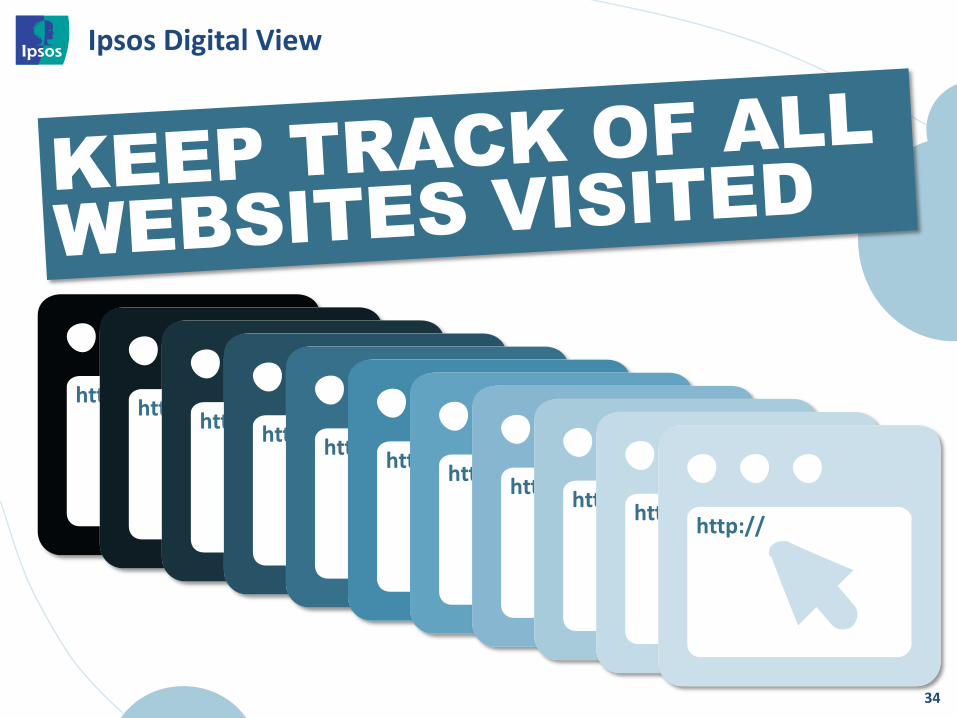
34
http:// http://
http:// http://
http:// http://
http:// http://
http:// http://
http://
Ipsos Digital View
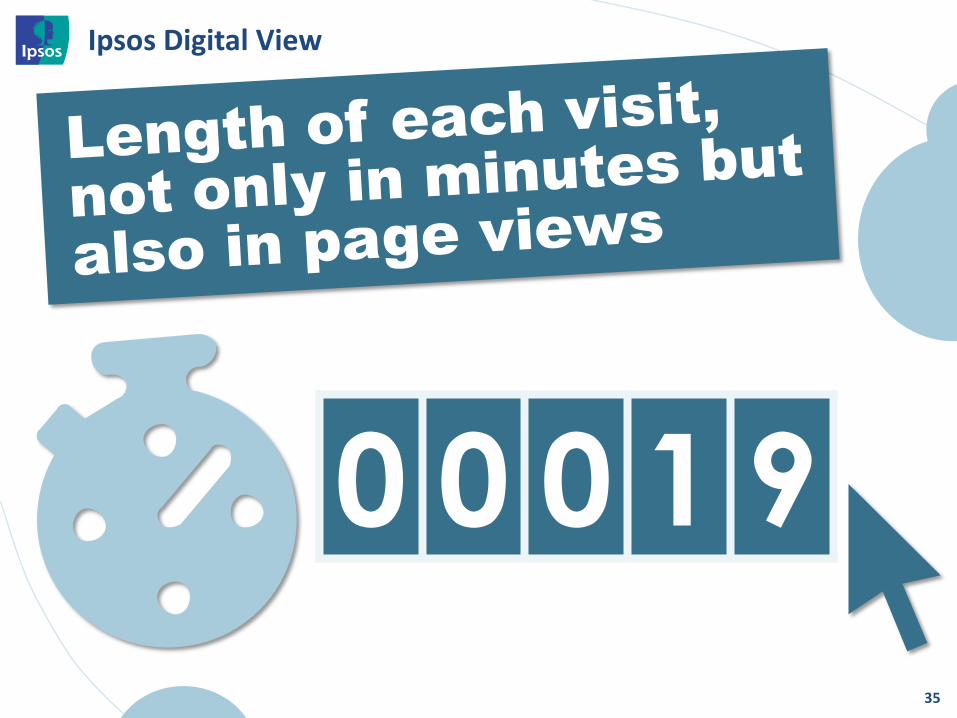
35
0 0 0 1 9
Ipsos Digital View
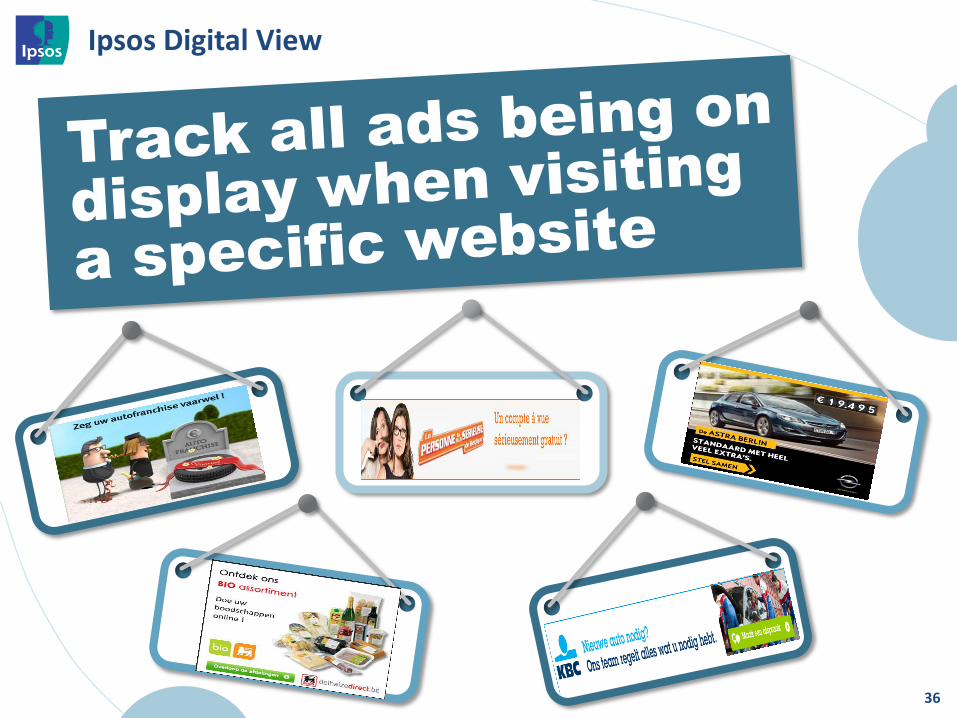
36
Ipsos Digital View
37
xx
Ipsos Digital View
IPSOS DIGITAL VIEW
Test panel set-up
38
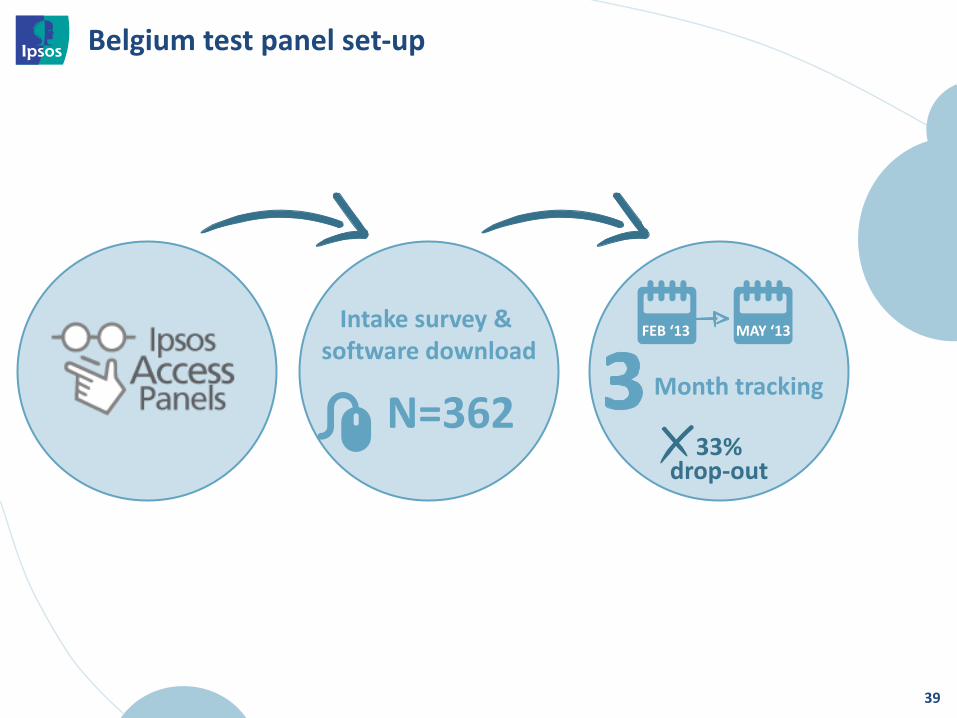
Intake survey & software download
N=362
33% drop-out
Belgium test panel set-up
Month tracking
FEB ‘13 MAY ‘13
39
40
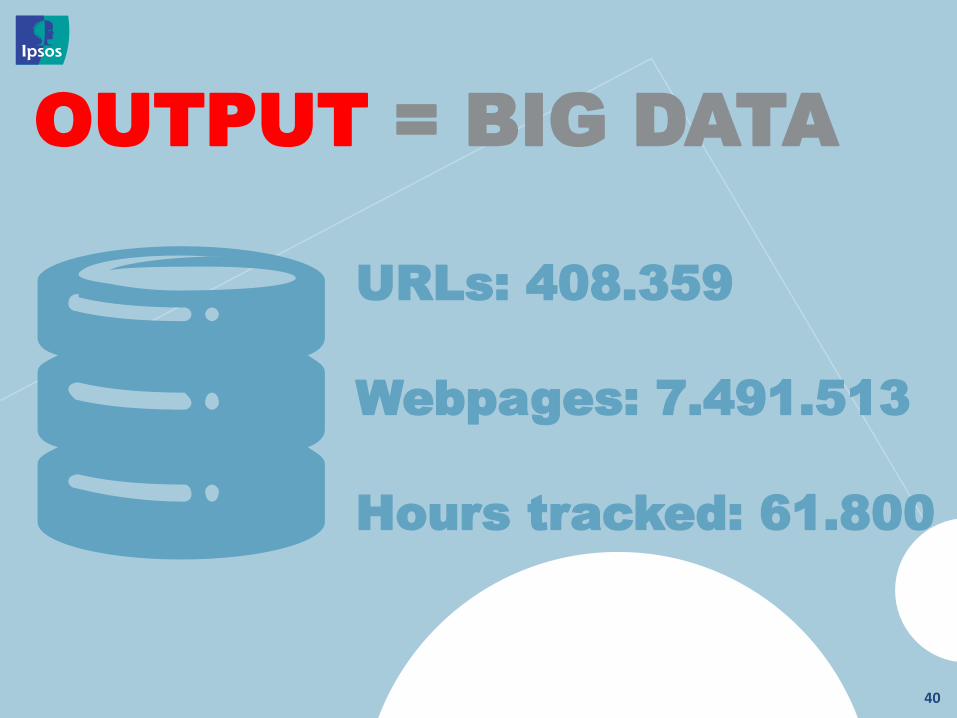
OUTPUT = BIG DATA
URLs: 408.359
Webpages: 7.491.513
Hours tracked: 61.800
IPSOS DIGITAL VIEW
General learning's on internet usage by Belgian consumers
41
TOTAL MALE FEMALE
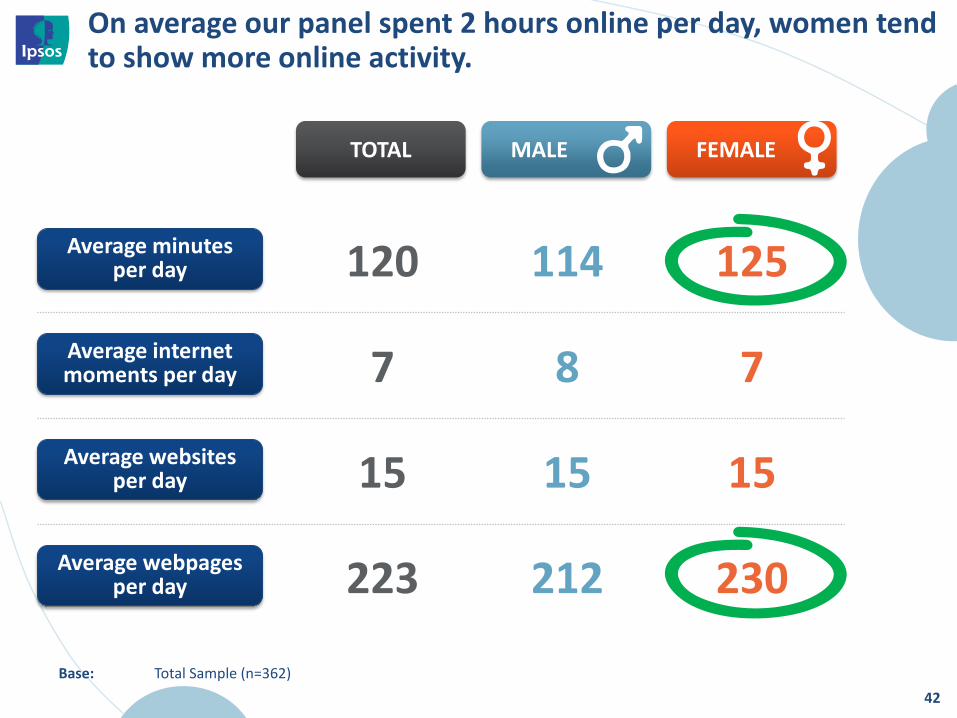
On average our panel spent 2 hours online per day, women tend to show more online activity.
42
120 114 125
7 8 7
15 15 15
223 212 230
Average minutes per day
Average internet moments per day
Average websites per day
Average webpages per day
Base: Total Sample (n=362)
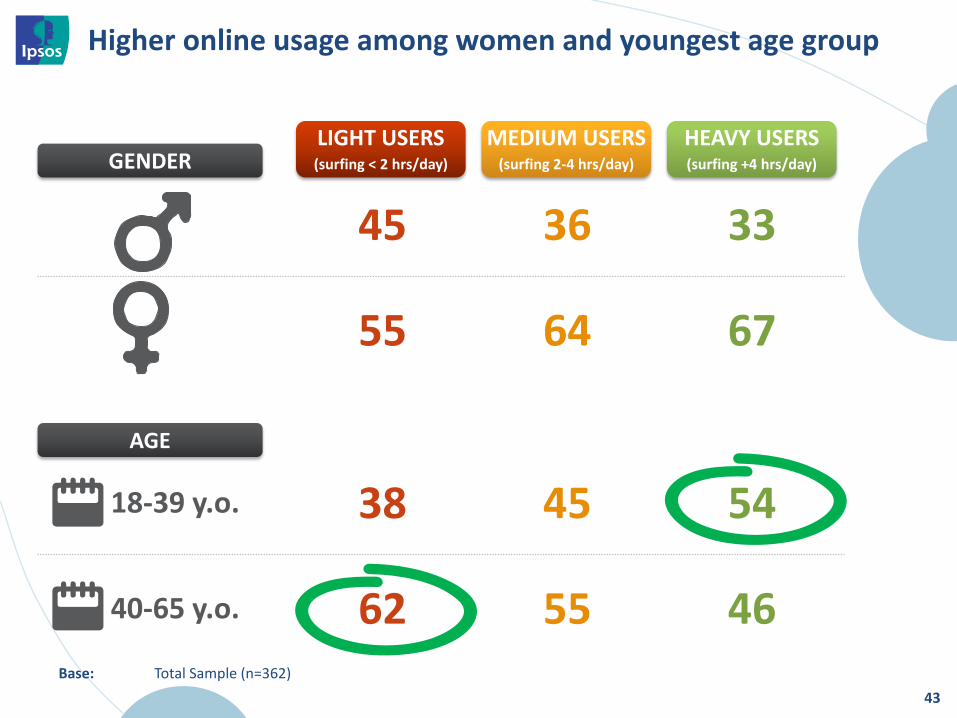
Higher online usage among women and youngest age group
43
45 36 33
55 64 67
38 45 54
62 55 46
GENDER
AGE
18-39 y.o.
40-65 y.o.
Base: Total Sample (n=362)
LIGHT USERS (surfing < 2 hrs/day)
MEDIUM USERS (surfing 2-4 hrs/day)
HEAVY USERS (surfing +4 hrs/day)
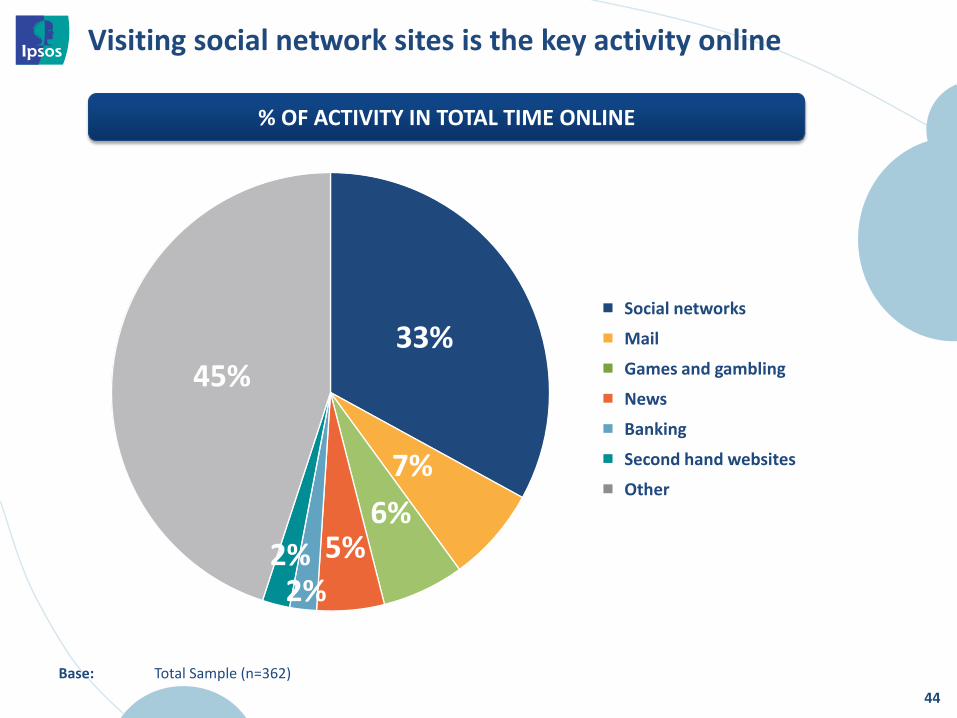
Visiting social network sites is the key activity online
44
33%
7%
6% 5%
2% 2%
45%
Social networks
Games and gambling
News
Banking
Second hand websites
Other
Base: Total Sample (n=362)
% OF ACTIVITY IN TOTAL TIME ONLINE
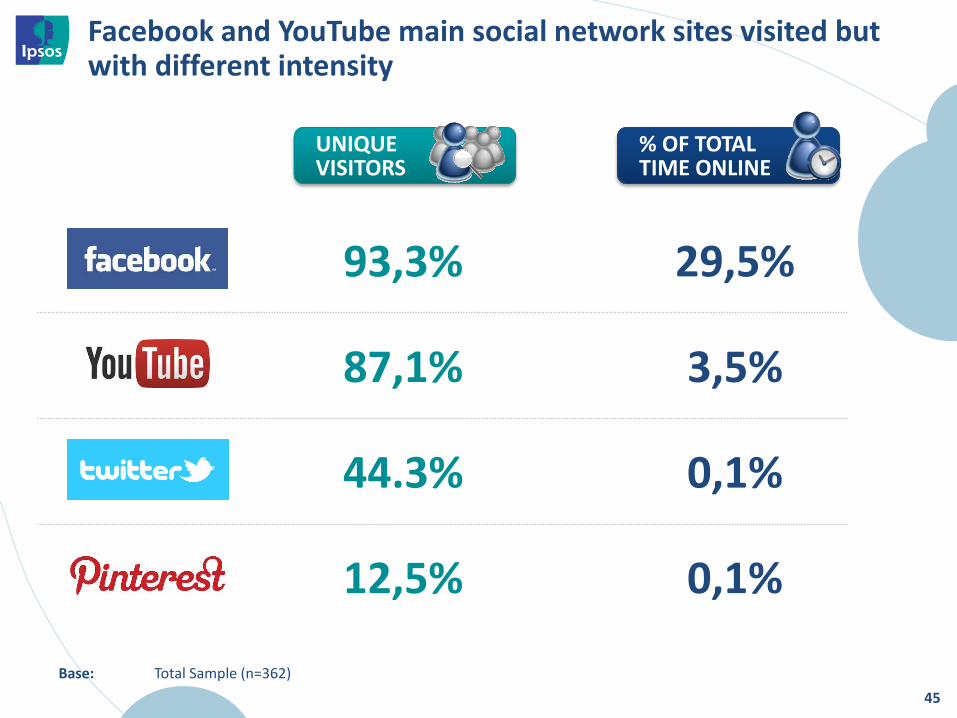
Facebook and YouTube main social network sites visited but with different intensity
45
93,3% 29,5%
87,1% 3,5%
44.3% 0,1%
12,5% 0,1%
UNIQUE VISITORS
% OF TOTAL TIME ONLINE
Base: Total Sample (n=362)
AVG VISITS/ VISITOR
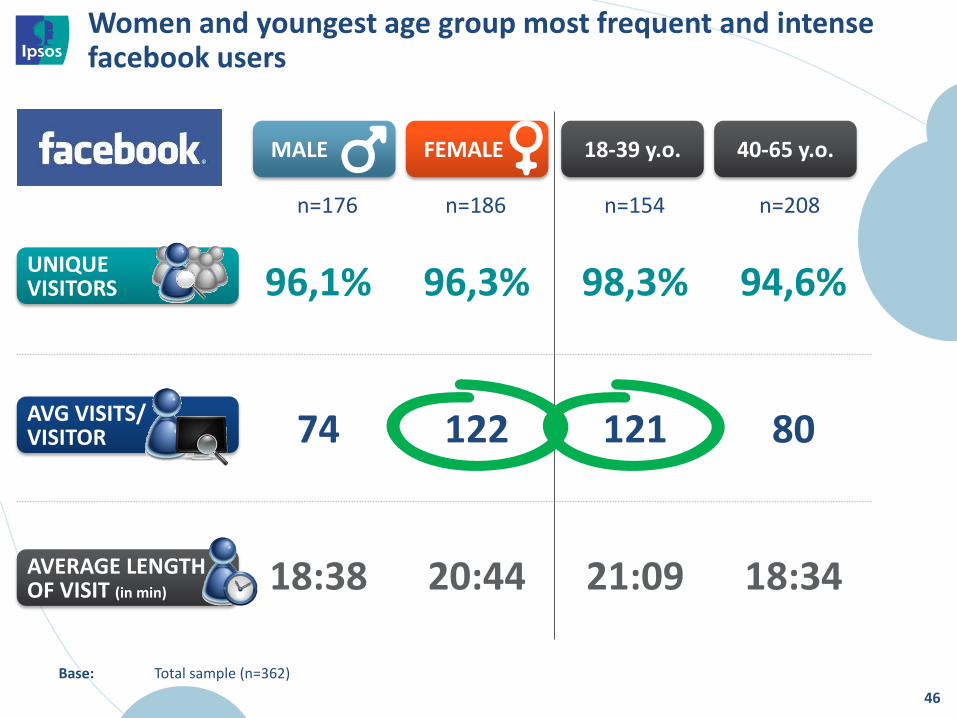
Women and youngest age group most frequent and intense facebook users
46
96,1% 96,3% 98,3% 94,6%
74 122 121 80
18:38 20:44 21:09 18:34
UNIQUE VISITORS
AVERAGE LENGTH OF VISIT (in min)
MALE FEMALE 18-39 y.o. 40-65 y.o.
Base: Total sample (n=362)
n=176 n=186 n=154 n=208

Twitter has a younger profile and is more frequently used by men.
47
45,4% 43,4% 51,2% 39,3%
4 3 4 3
03:52 03:02 02:30 04:35
UNIQUE VISITORS
AVERAGE LENGTH OF VISIT (in min)
AVG VISITS/ VISITOR
MALE FEMALE 18-39 y.o. 40-65 y.o.
AVG VISITS/ VISITOR
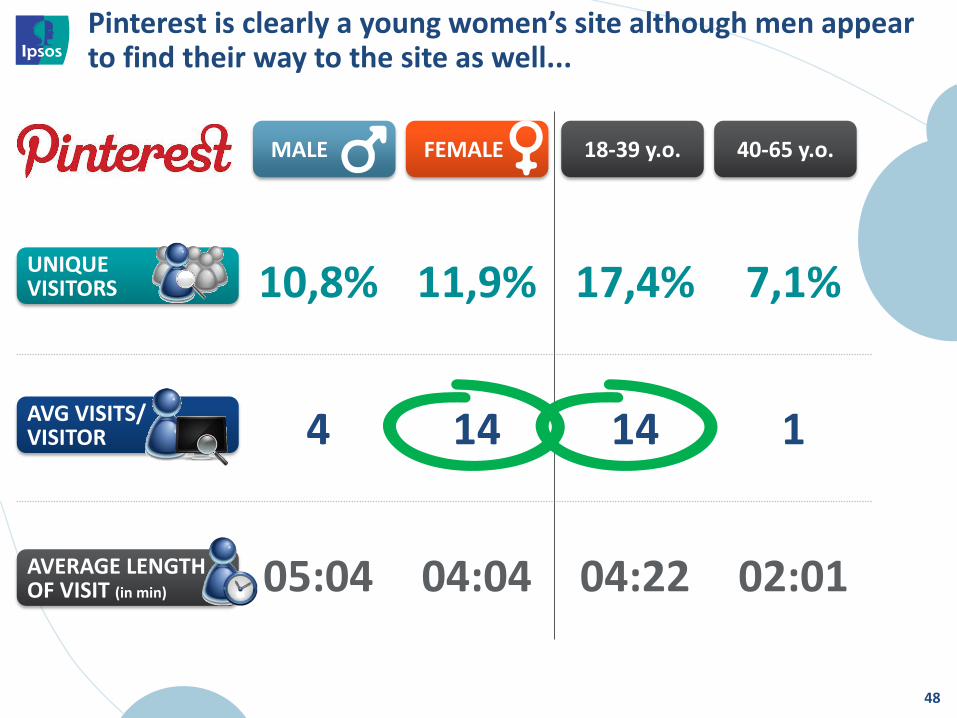
Pinterest is clearly a young women’s site although men appear to find their way to the site as well...
48
10,8% 11,9% 17,4% 7,1%
4 14 14 1
05:04 04:04 04:22 02:01
UNIQUE VISITORS
AVERAGE LENGTH OF VISIT (in min)
MALE FEMALE 18-39 y.o. 40-65 y.o.
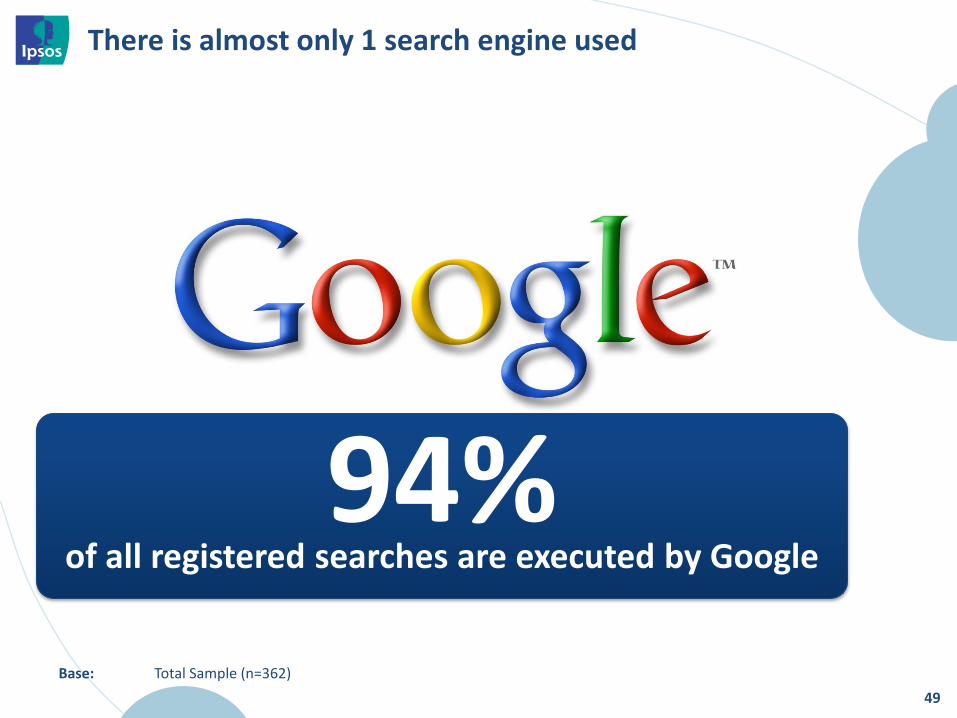
There is almost only 1 search engine used
49
94% of all registered searches are executed by Google
Base: Total Sample (n=362)
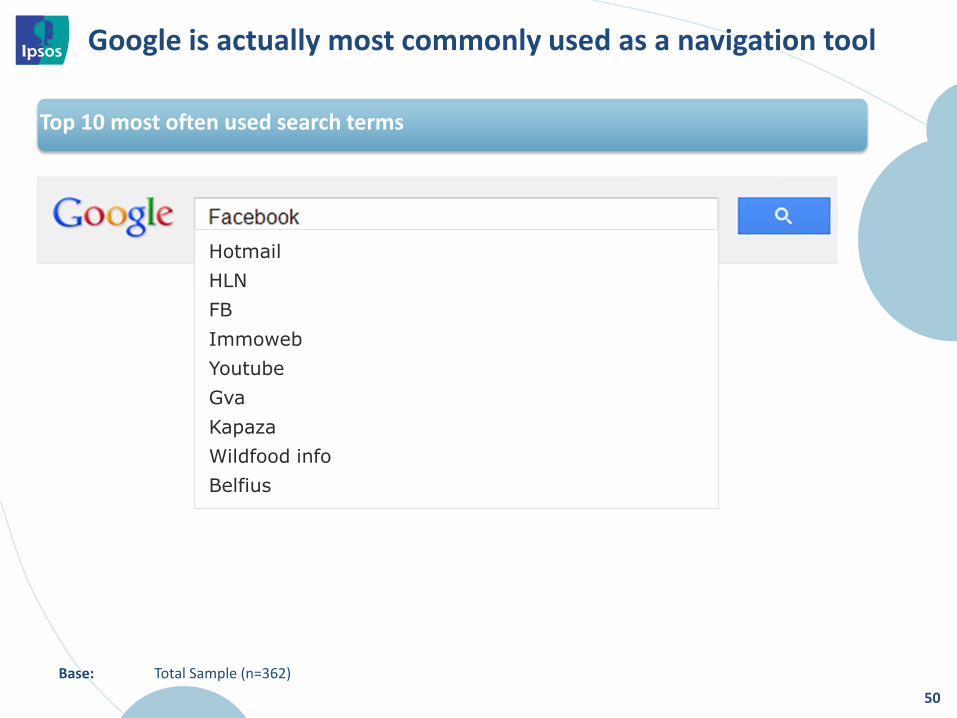
Google is actually most commonly used as a navigation tool
50
Hotmail
HLN
FB
Immoweb
Youtube
Gva
Kapaza
Wildfood info
Belfius
Base: Total Sample (n=362)
Top 10 most often used search terms
IPSOS DIGITAL VIEW
Research solutions & cases
51
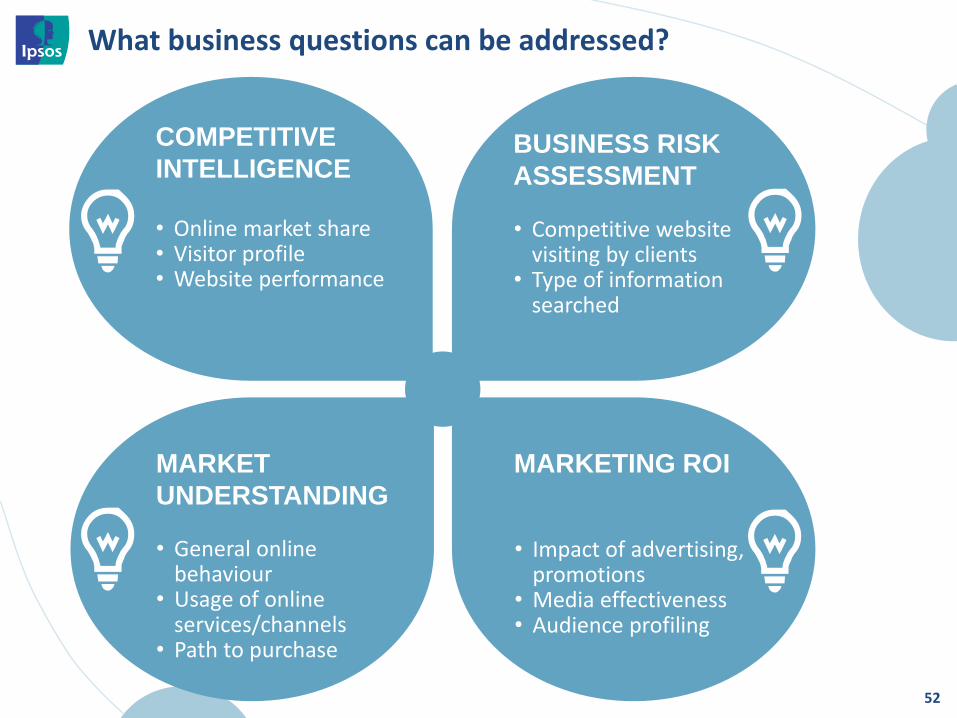
What business questions can be addressed?
52
COMPETITIVE
INTELLIGENCE
BUSINESS RISK
ASSESSMENT
MARKET
UNDERSTANDING
MARKETING ROI
• Online market share • Visitor profile • Website performance
• Competitive website visiting by clients
• Type of information searched
• General online behaviour
• Usage of online services/channels
• Path to purchase
• Impact of advertising, promotions
• Media effectiveness • Audience profiling
SOLUTION 1: COMPETITIVE INTELLIGENCE
53
CASE STUDY 1
54
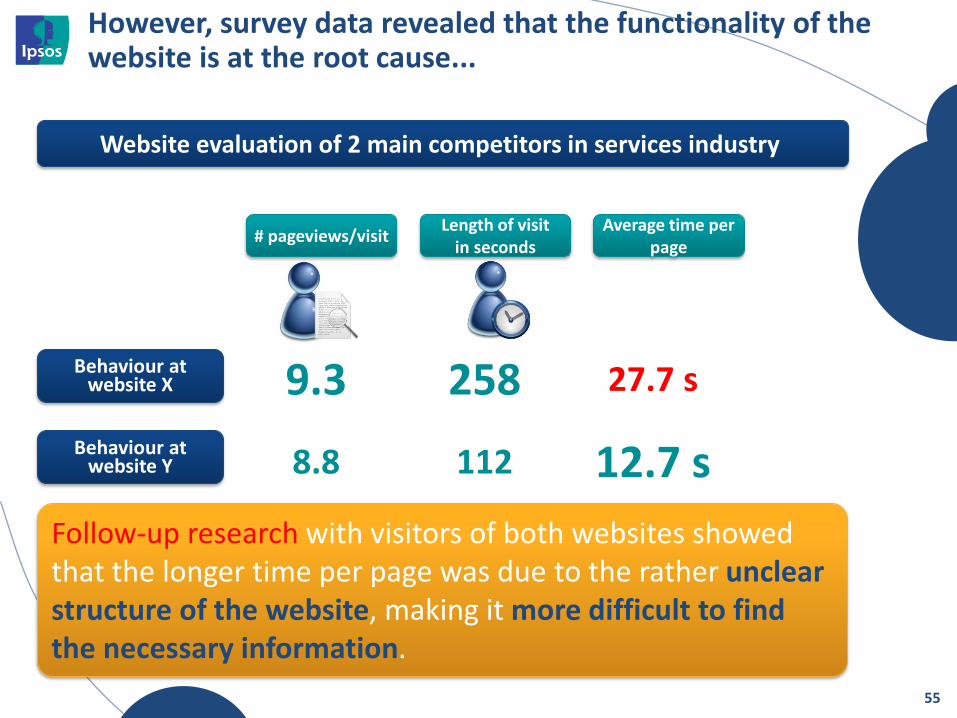
However, survey data revealed that the functionality of the website is at the root cause...
55
Website evaluation of 2 main competitors in services industry
9.3 258 27.7 s
8.8 112 12.7 s
Length of visit in seconds
Behaviour at website X
Behaviour at website Y
# pageviews/visit Average time per
page
Follow-up research with visitors of both websites showed that the longer time per page was due to the rather unclear structure of the website, making it more difficult to find the necessary information.
CASE STUDY 2
56
10%
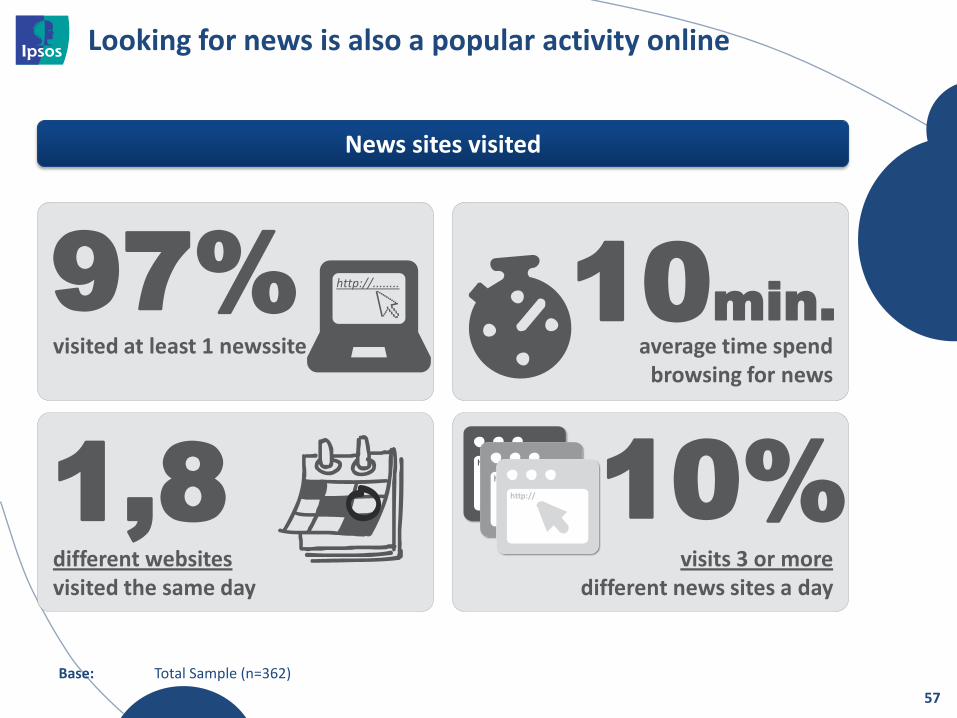
Looking for news is also a popular activity online
57
97% http://........
News sites visited
10min.
1,8 different websites visited the same day
visits 3 or more different news sites a day
http://
http://
http://
visited at least 1 newssite average time spend browsing for news
Base: Total Sample (n=362)
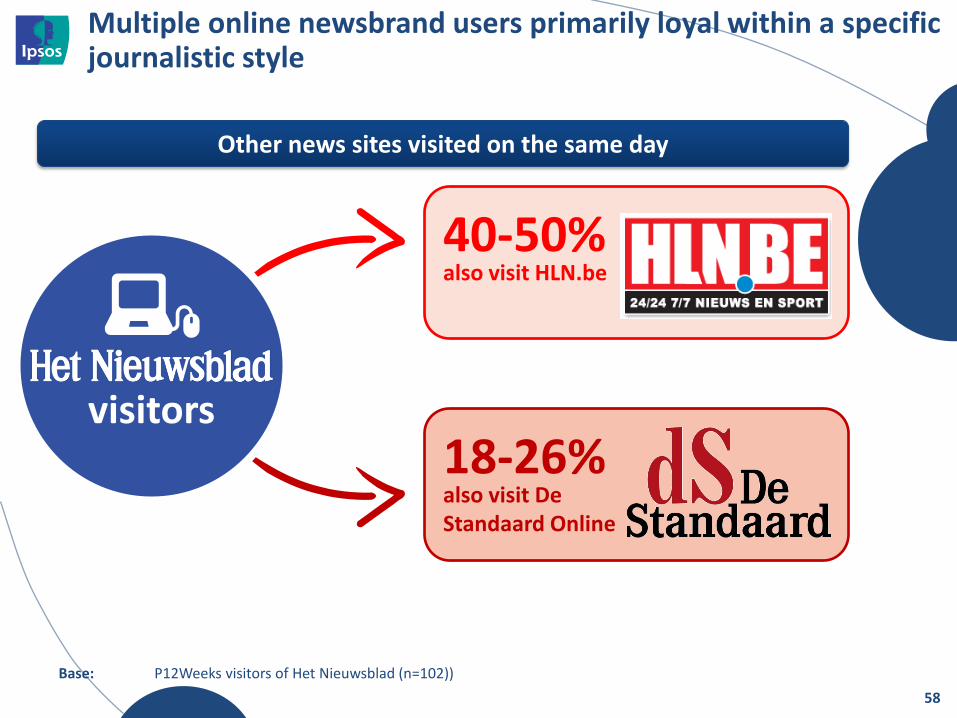
18-26% also visit De Standaard Online
40-50%
Multiple online newsbrand users primarily loyal within a specific journalistic style
58
also visit HLN.be
visitors
Other news sites visited on the same day
Base: P12Weeks visitors of Het Nieuwsblad (n=102))
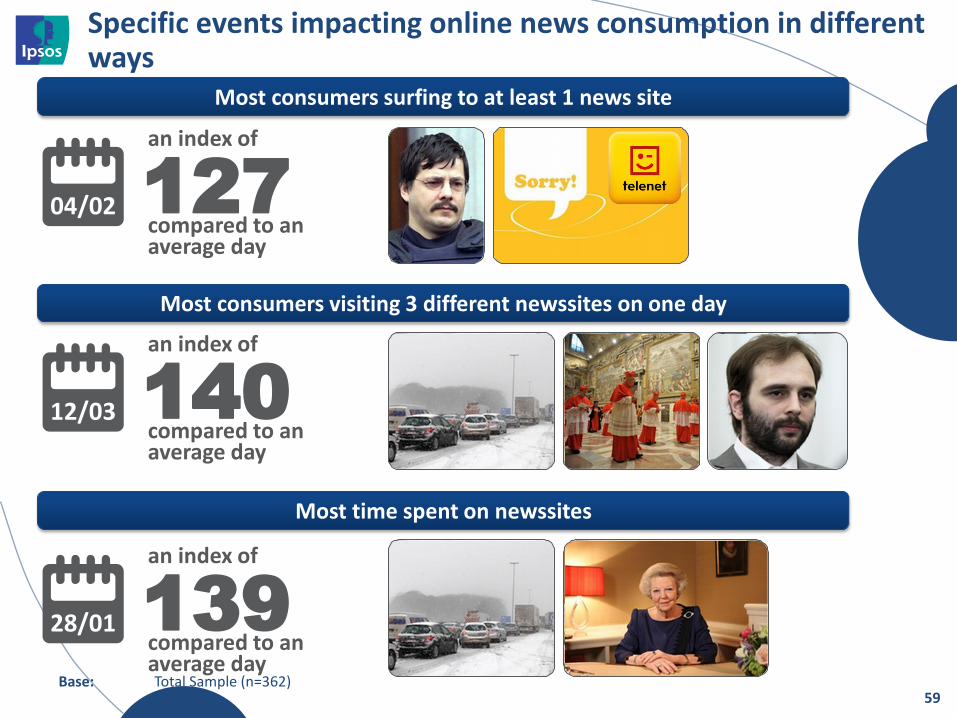
Specific events impacting online news consumption in different ways
59
127
Most consumers surfing to at least 1 news site
04/02 compared to an average day
Most consumers visiting 3 different newssites on one day
Most time spent on newssites
an index of
140 12/03 compared to an average day
an index of
139 28/01 compared to an average day
an index of
Base: Total Sample (n=362)
CASE STUDY 3
60
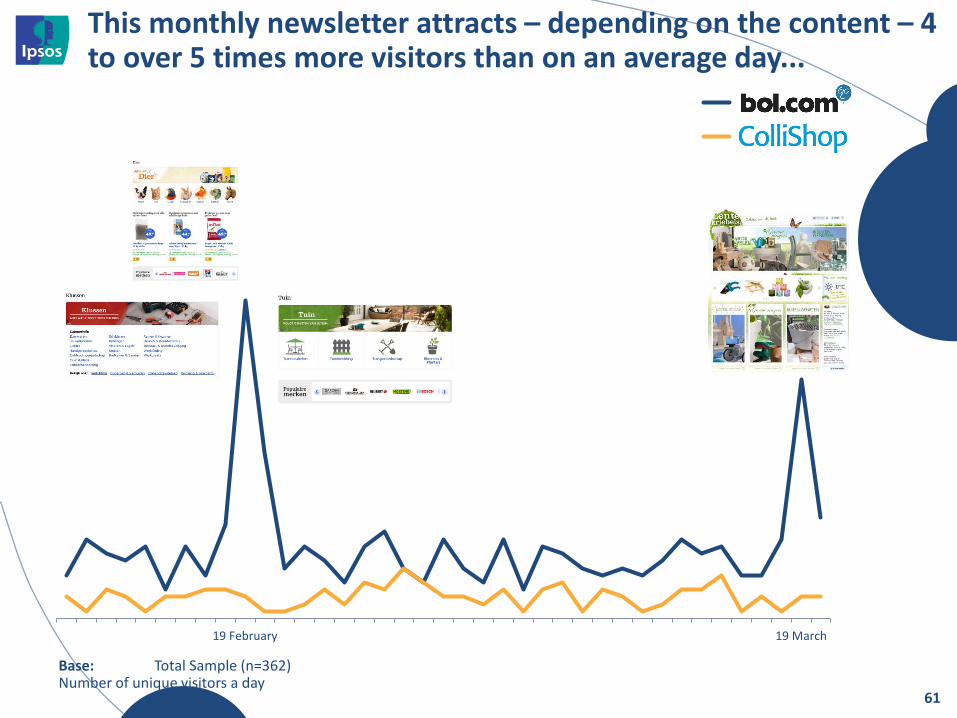
19 February 19 March
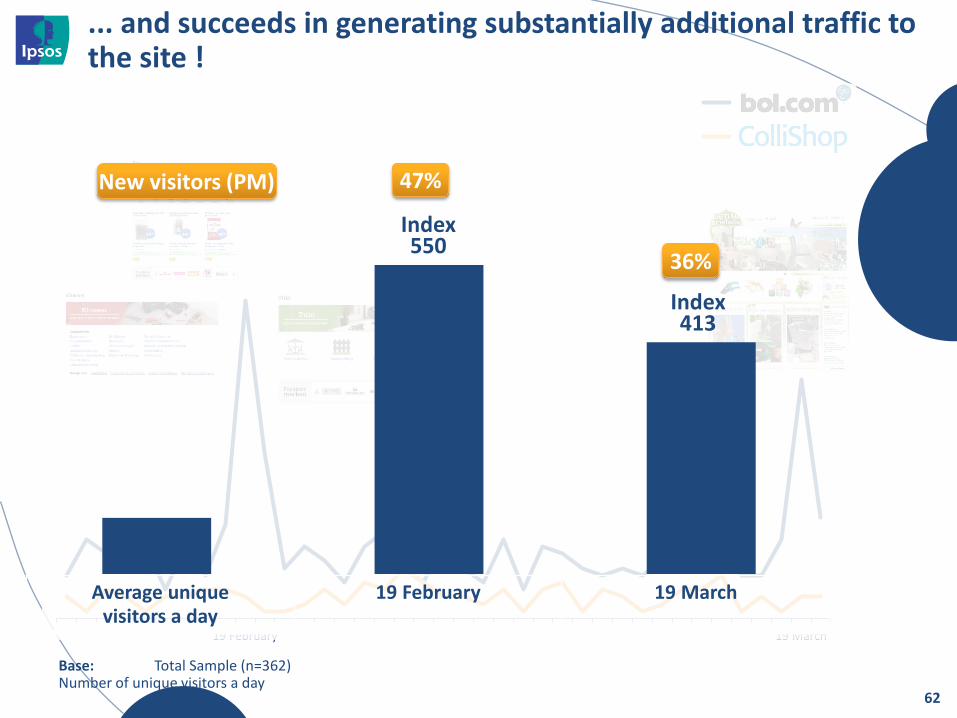
This monthly newsletter attracts – depending on the content – 4 to over 5 times more visitors than on an average day...
61
Base: Total Sample (n=362) Number of unique visitors a day
19 February 19 March
... and succeeds in generating substantially additional traffic to the site !
62
Index 550
Index 413
Average unique visitors a day
19 February 19 March
47%
36%
Base: Total Sample (n=362) Number of unique visitors a day
New visitors (PM)
SOLUTION 2: BUSINESS RISK ASSESSMENT
63
CASE STUDY 1
64
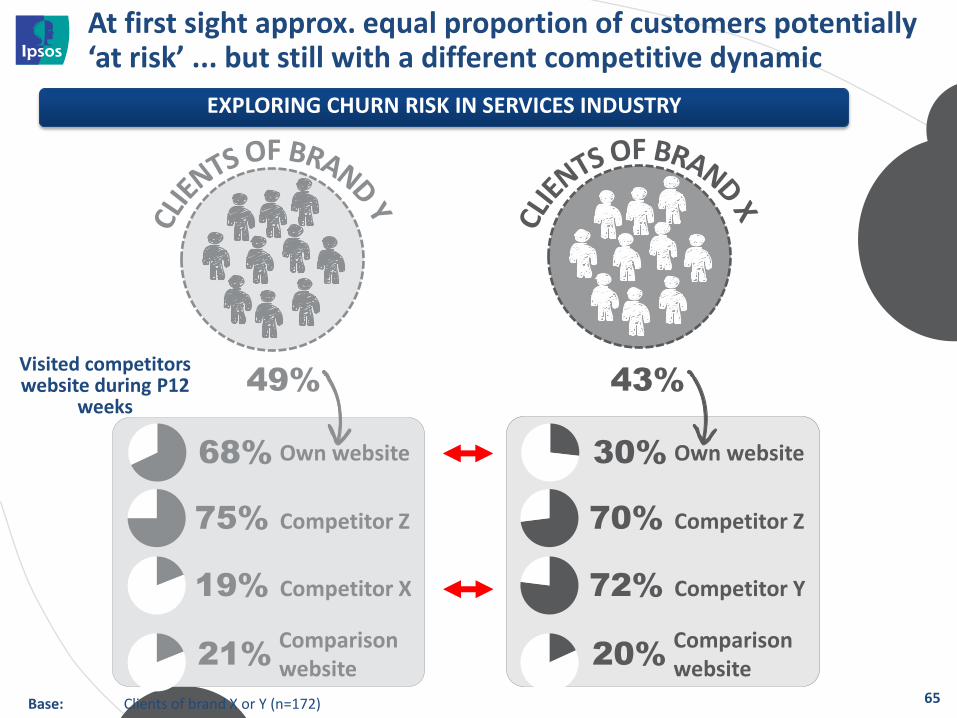
Visited competitors website during P12
weeks
At first sight approx. equal proportion of customers potentially ‘at risk’ ... but still with a different competitive dynamic
72% Competitor Y
70% Competitor Z
20% Comparison website
30% Own website
19% Competitor X
75% Competitor Z
21% Comparison website
68% Own website
43% 49%
EXPLORING CHURN RISK IN SERVICES INDUSTRY
65 Base: Clients of brand X or Y (n=172)
SOLUTION 3: MARKET
UNDERSTANDING
66
E-COMMERCE IN BELGIË
67
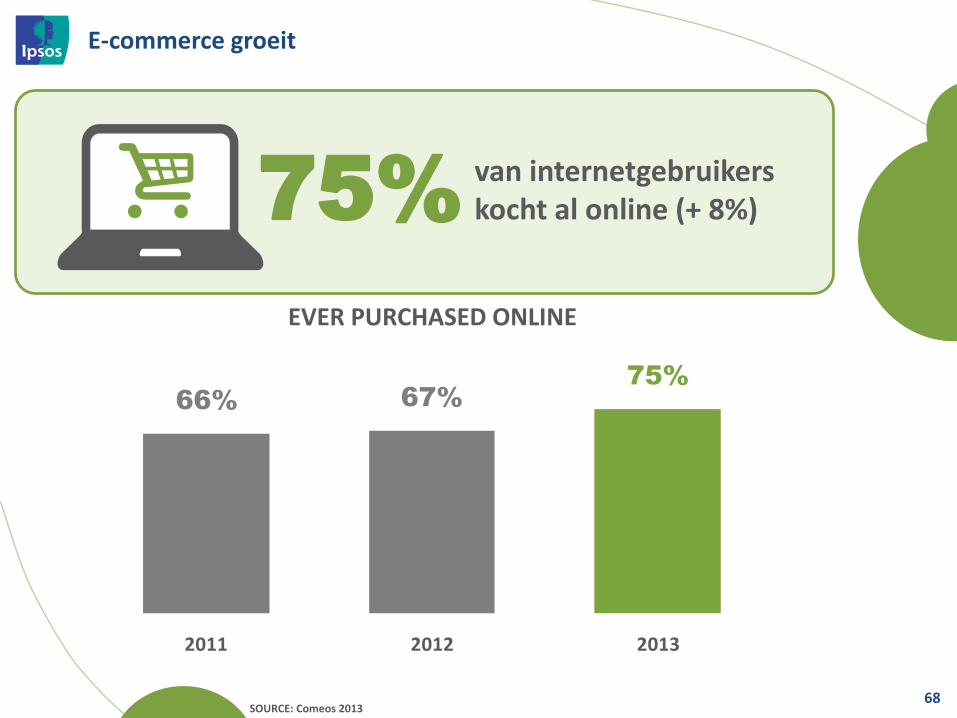
E-commerce groeit
68 SOURCE: Comeos 2013
66% 67%
75%
2011 2012 2013
van internetgebruikers kocht al online (+ 8%) 75%
EVER PURCHASED ONLINE
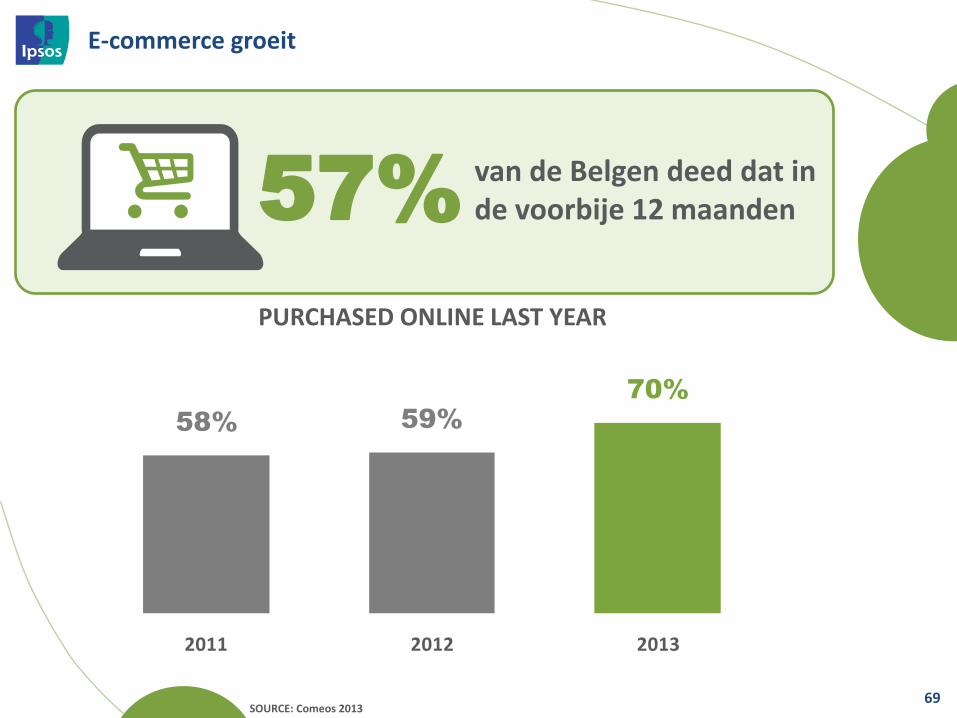
E-commerce groeit
69 SOURCE: Comeos 2013
van de Belgen deed dat in de voorbije 12 maanden 57%
58% 59%
70%
2011 2012 2013
PURCHASED ONLINE LAST YEAR
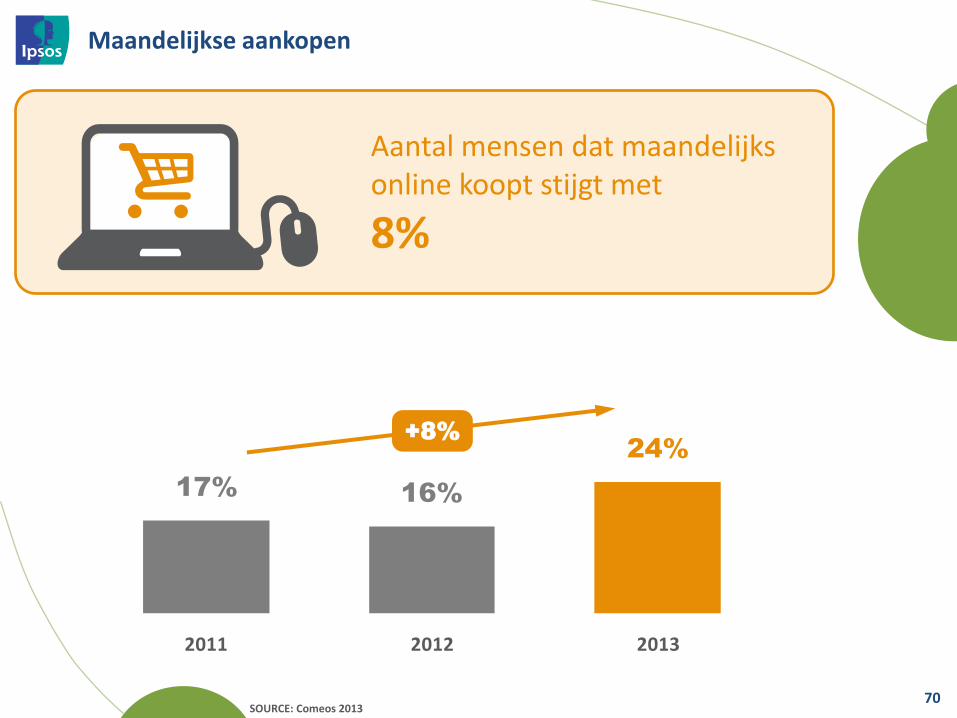
Maandelijkse aankopen
70 SOURCE: Comeos 2013
Aantal mensen dat maandelijks online koopt stijgt met
8%
17% 16%
24%
2011 2012 2013
+8%
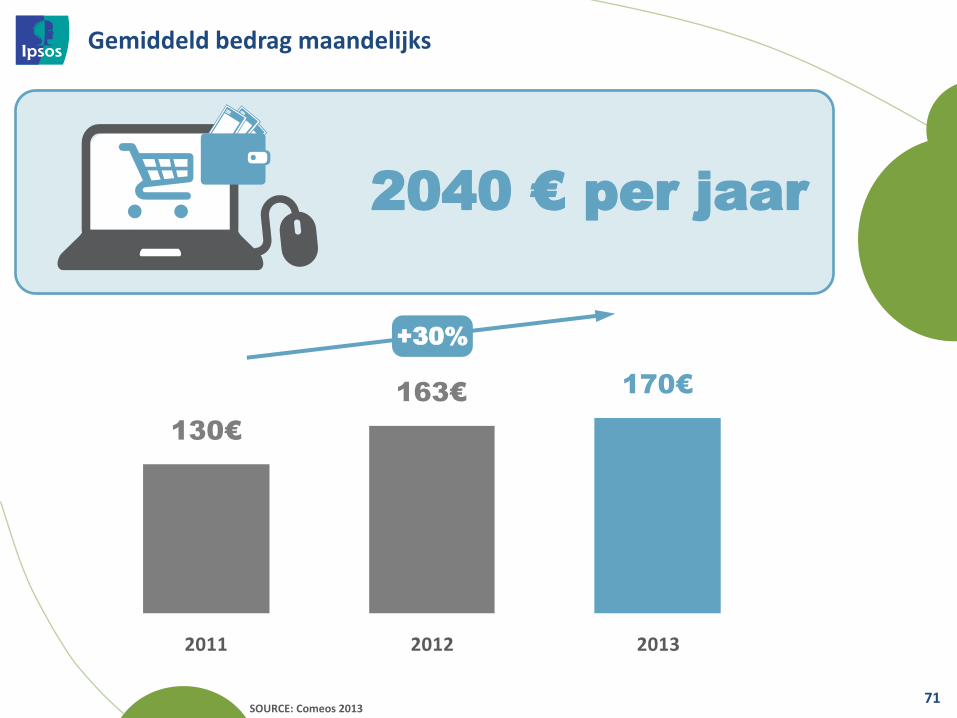
Gemiddeld bedrag maandelijks
71 SOURCE: Comeos 2013
2040 € per jaar
130€
163€170€
2011 2012 2013
+30%
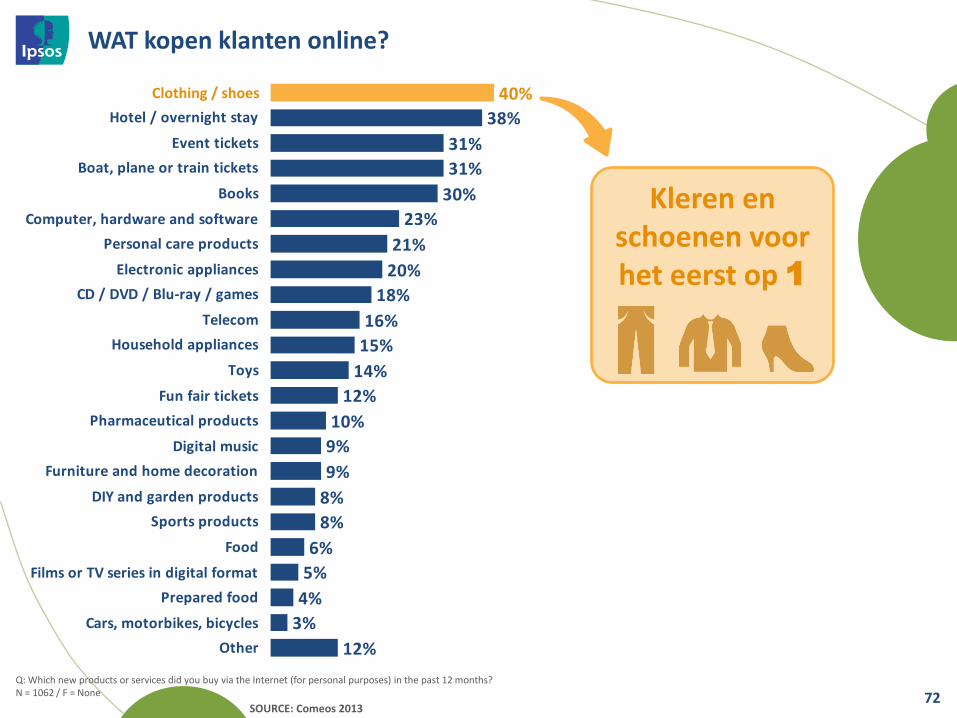
38%
31%
30%
23%
20%
14%
12%
10%
9%
9%
8%
8%
6%
5%
4%
3%
12%
21%
31%
40%
15%
16%
18%
Hotel / overnight stay
Event tickets
Boat, plane or train tickets
Books
Computer, hardware and software
Personal care products
Electronic appliances
CD / DVD / Blu-ray / games
Telecom
Household appliances
Toys
Fun fair tickets
Pharmaceutical products
Digital music
Furniture and home decoration
DIY and garden products
Sports products
Food
Films or TV series in digital format
Prepared food
Cars, motorbikes, bicycles
Other
WAT kopen klanten online?
72
Q: Which new products or services did you buy via the Internet (for personal purposes) in the past 12 months? N = 1062 / F = None
SOURCE: Comeos 2013
Kleren en schoenen voor het eerst op 1
Clothing / shoes
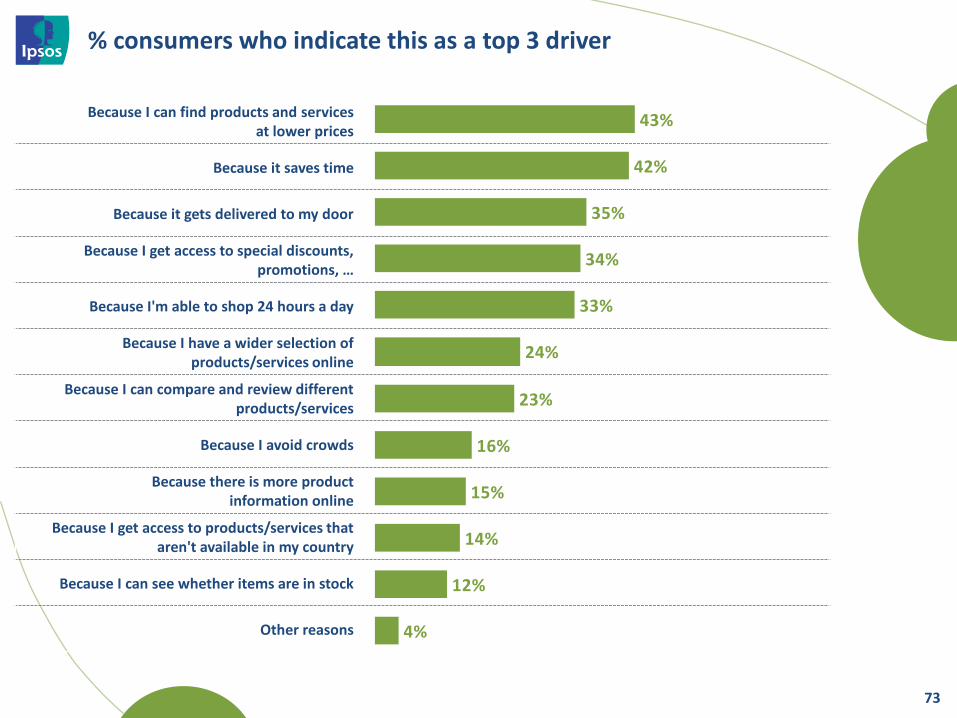
% consumers who indicate this as a top 3 driver
73
Because I can find products and services at lower prices
Because it saves time
Because it gets delivered to my door
Because I get access to special discounts, promotions, …
Because I'm able to shop 24 hours a day
Because I have a wider selection of products/services online
Because I can compare and review different products/services
Because I avoid crowds
Because there is more product information online
Because I get access to products/services that aren't available in my country
Because I can see whether items are in stock
Other reasons
42%
35%
33%
24%
16%
4%
23%
34%
43%
12%
14%
15%
CASE STUDY 1
74
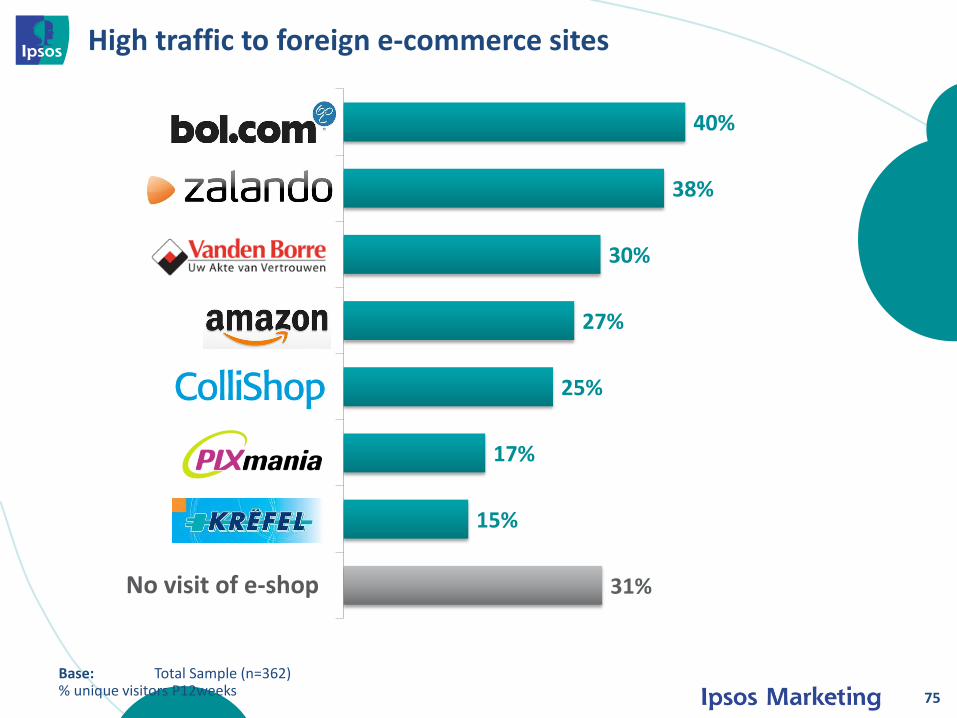
40%
38%
30%
27%
25%
17%
15%
31% No visit of e-shop
High traffic to foreign e-commerce sites
75
Base: Total Sample (n=362) % unique visitors P12weeks
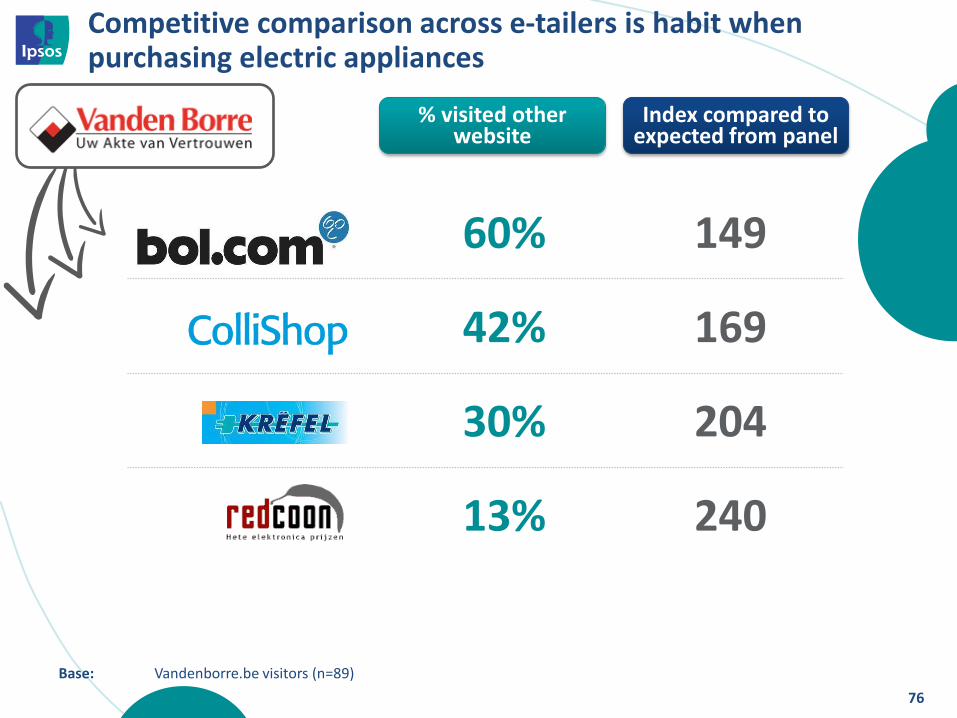
60% 149
42% 169
30% 204
13% 240
Competitive comparison across e-tailers is habit when purchasing electric appliances
76
% visited other website
Index compared to expected from panel
Base: Vandenborre.be visitors (n=89)
CASE STUDY 2
77
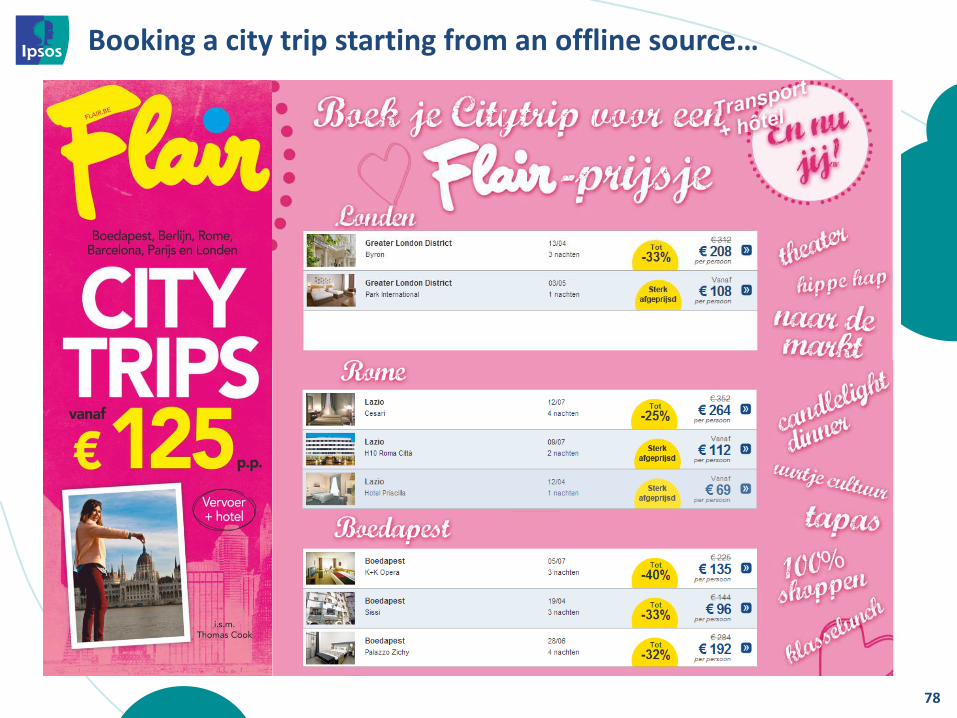
78
Booking a city trip starting from an offline source…
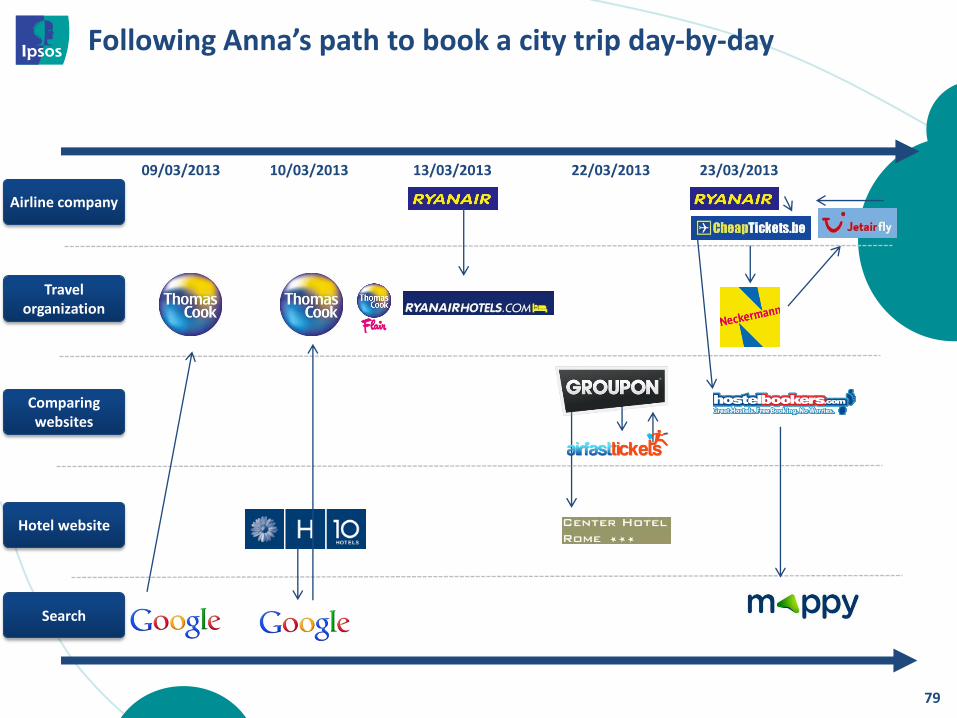
Following Anna’s path to book a city trip day-by-day
79
Airline company
Travel organization
Comparing websites
Hotel website
Search
09/03/2013 10/03/2013 13/03/2013 22/03/2013 23/03/2013
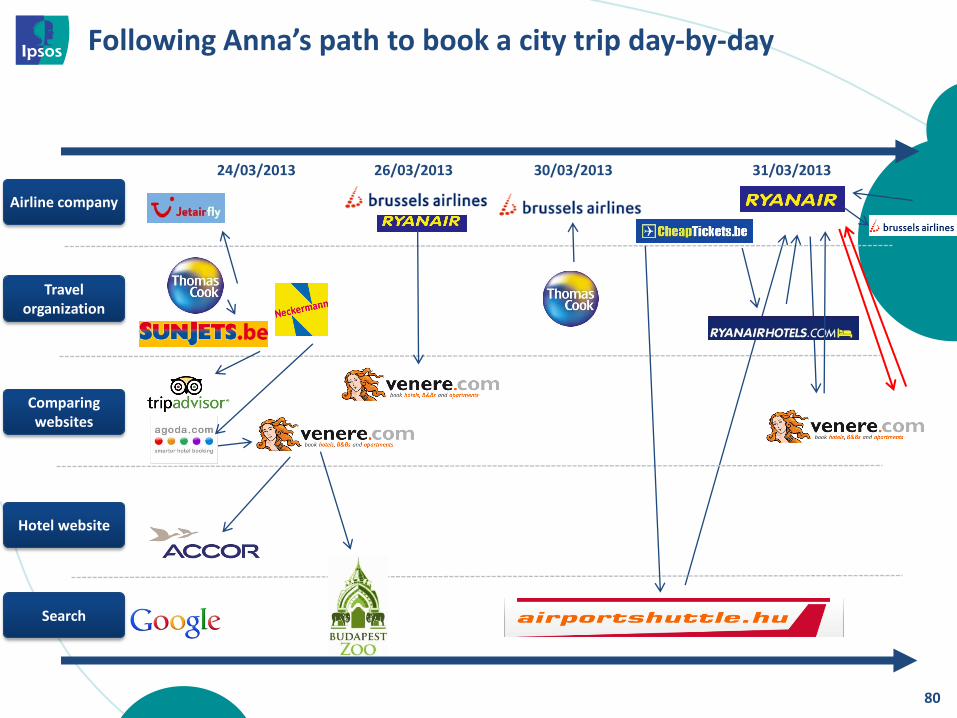
Following Anna’s path to book a city trip day-by-day
80
Airline company
Travel organization
Comparing websites
Hotel website
Search
24/03/2013 26/03/2013 30/03/2013 31/03/2013
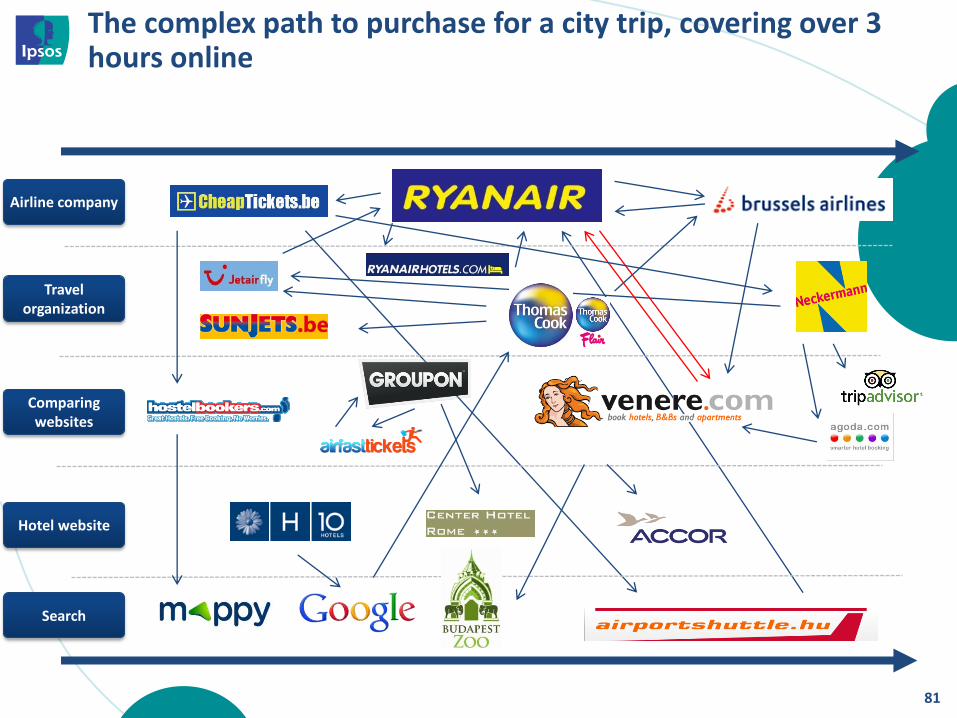
The complex path to purchase for a city trip, covering over 3 hours online
81
Airline company
Travel organization
Comparing websites
Hotel website
Search
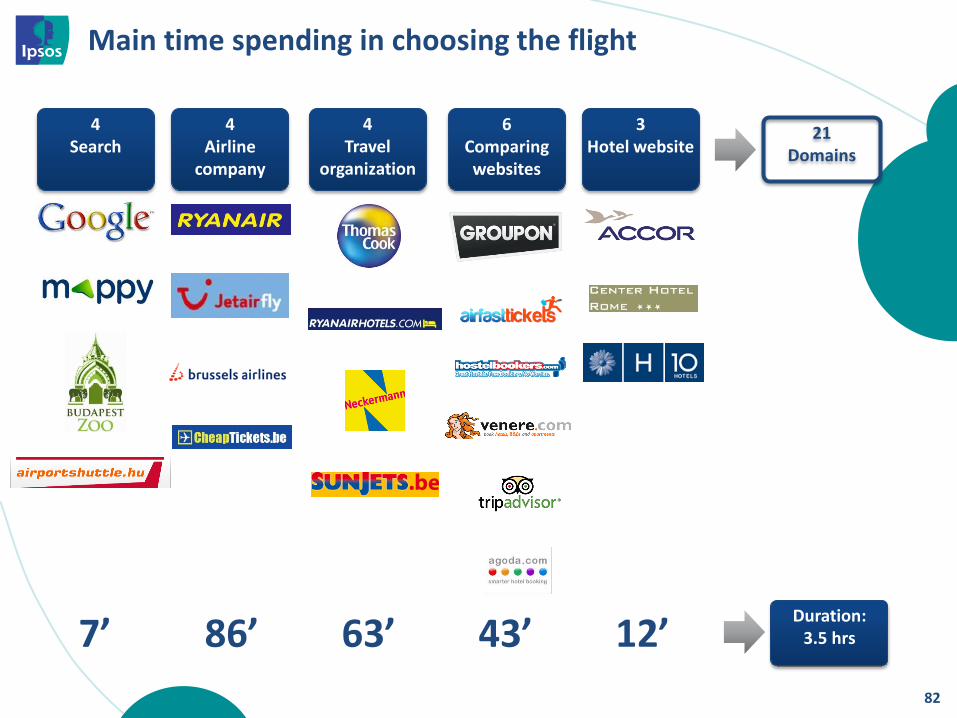
21 Domains
Main time spending in choosing the flight
82
4 Travel
organization
6 Comparing websites
3 Hotel website
4 Search
4 Airline
company
7’ 86’ 63’ 43’ 12’ Duration:
3.5 hrs
SOLUTION 4: MARKETING
ROI
83
CASE STUDY 1
84
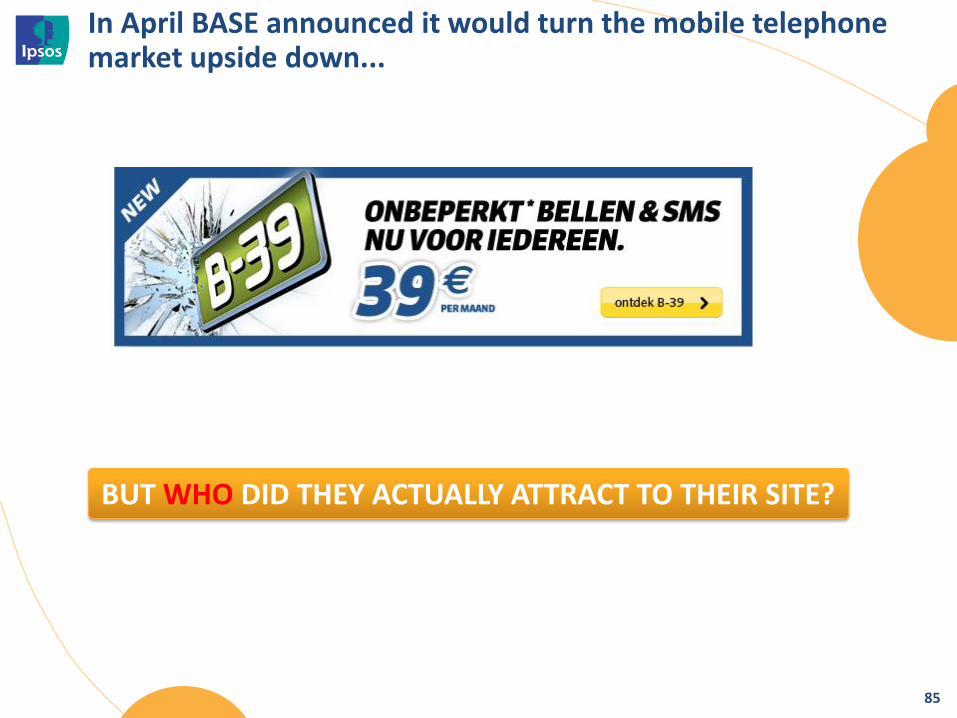
In April BASE announced it would turn the mobile telephone market upside down...
85
BUT WHO DID THEY ACTUALLY ATTRACT TO THEIR SITE?
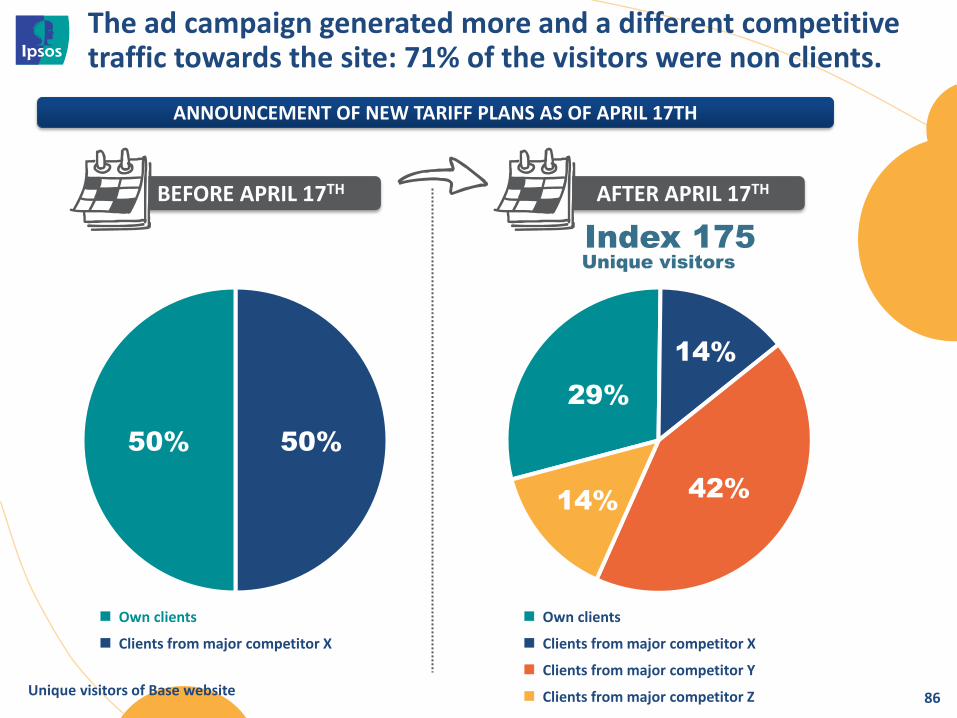
The ad campaign generated more and a different competitive traffic towards the site: 71% of the visitors were non clients.
86
50% 50%
29%
14%
42% 14%
BEFORE APRIL 17TH AFTER APRIL 17TH
ANNOUNCEMENT OF NEW TARIFF PLANS AS OF APRIL 17TH
Own clients
Clients from major competitor X
Own clients
Clients from major competitor X
Clients from major competitor Y
Clients from major competitor Z
Index 175
Unique visitors
Unique visitors of Base website
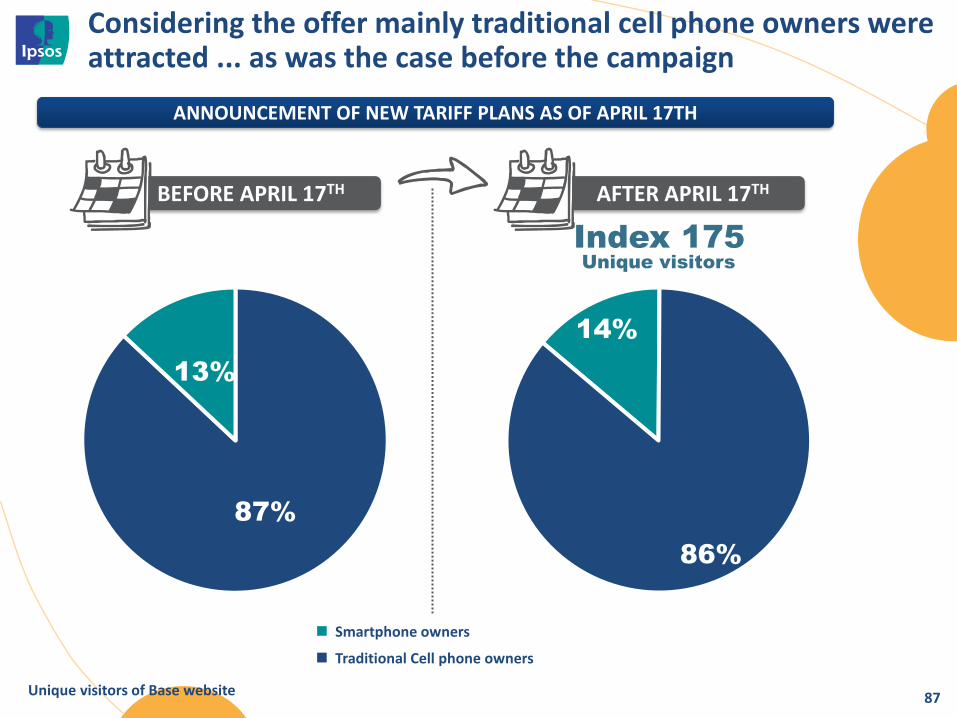
Considering the offer mainly traditional cell phone owners were attracted ... as was the case before the campaign
87
87%
13%
14%
86%
BEFORE APRIL 17TH AFTER APRIL 17TH
ANNOUNCEMENT OF NEW TARIFF PLANS AS OF APRIL 17TH
Smartphone owners
Traditional Cell phone owners
Index 175
Unique visitors
Unique visitors of Base website
88
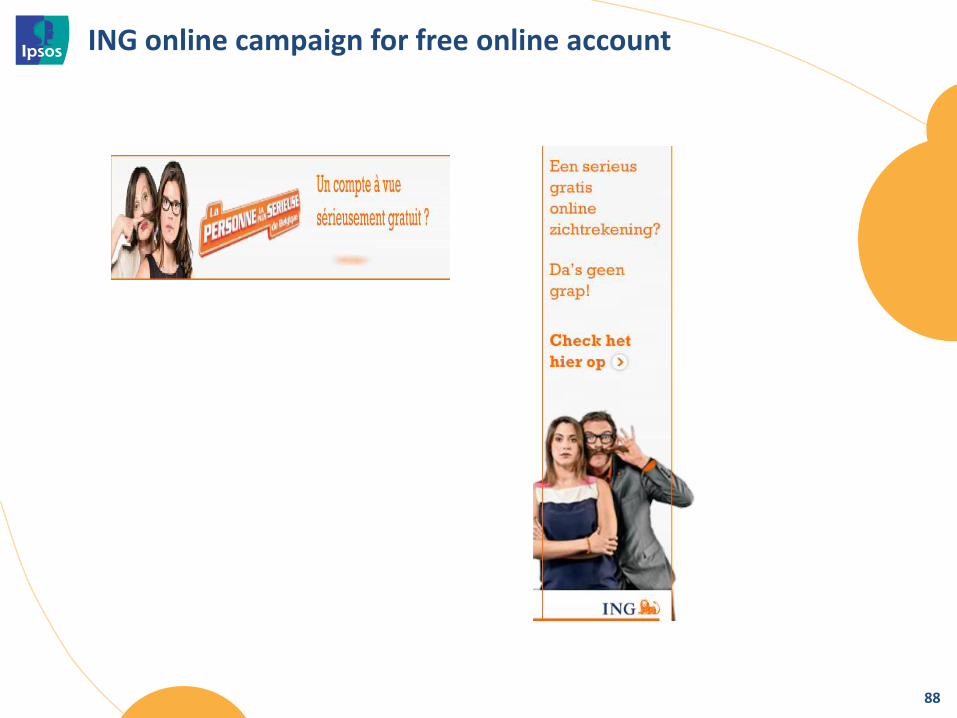
ING online campaign for free online account
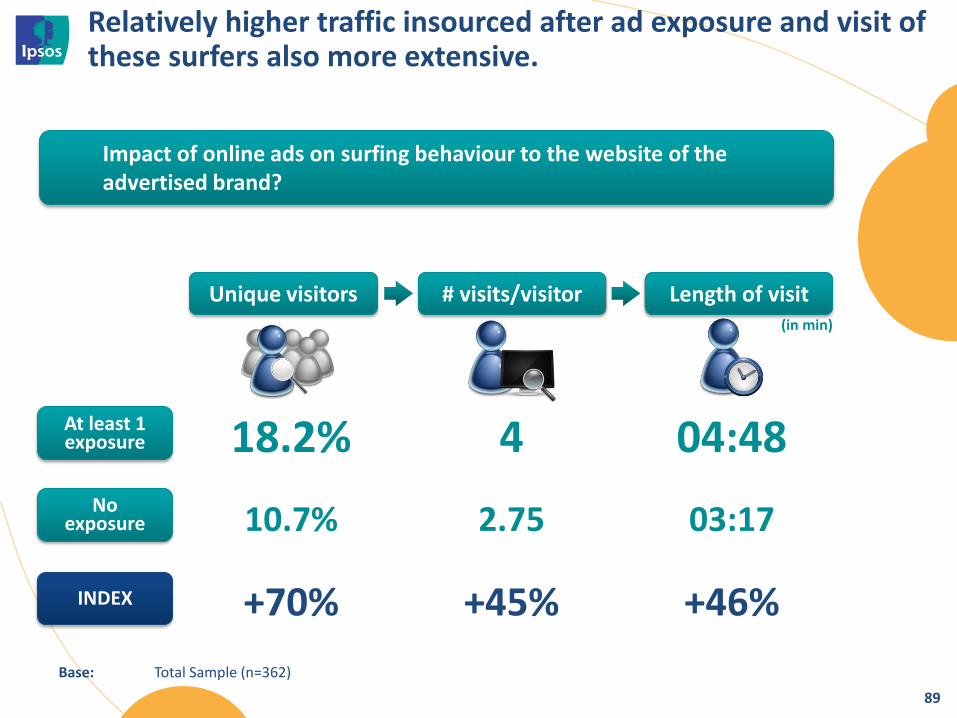
18.2% 4 04:48
10.7% 2.75 03:17
+70% +45% +46%
89
Unique visitors # visits/visitor Length of visit
At least 1 exposure
No exposure
INDEX
Relatively higher traffic insourced after ad exposure and visit of these surfers also more extensive.
(in min)
Impact of online ads on surfing behaviour to the website of the advertised brand?
Base: Total Sample (n=362)
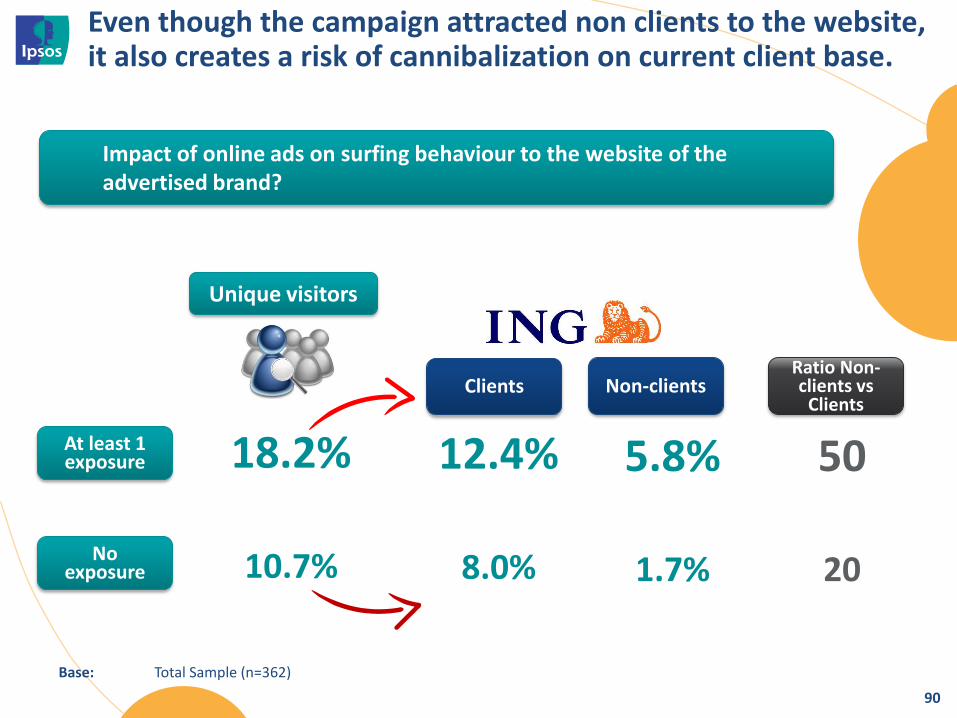
18.2%
10.7%
90
Unique visitors
At least 1 exposure
No exposure
Even though the campaign attracted non clients to the website, it also creates a risk of cannibalization on current client base.
Impact of online ads on surfing behaviour to the website of the advertised brand?
Clients Non-clients
12.4%
8.0%
5.8%
1.7%
50
20
Ratio Non-clients vs
Clients
Base: Total Sample (n=362)
91
screens meet the
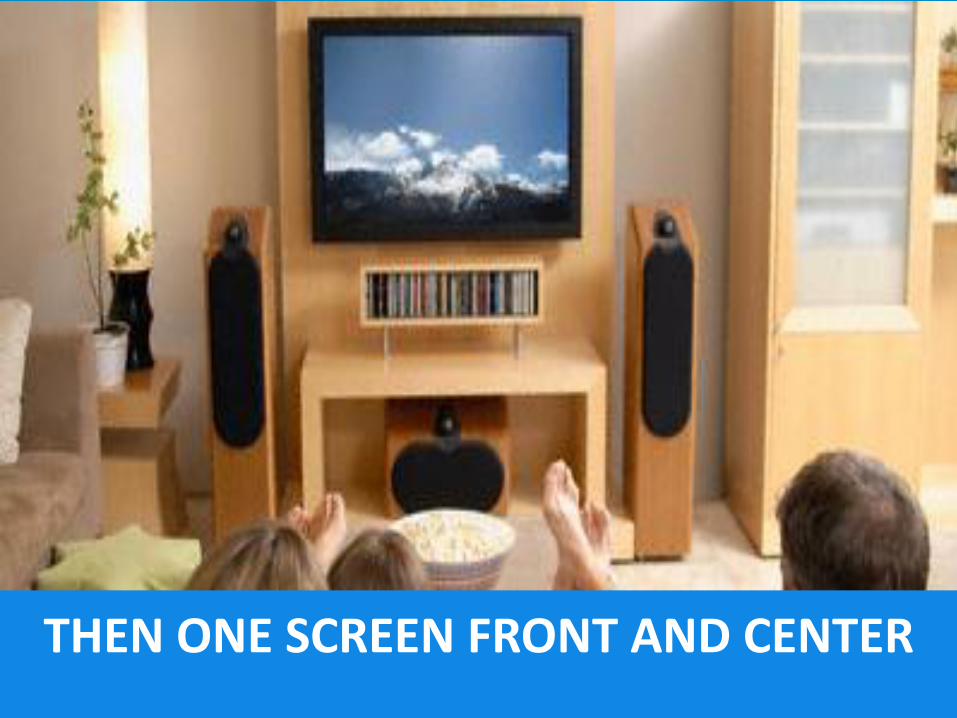
93
THEN ONE SCREEN FRONT AND CENTER
THEN ONE SCREEN FRONT AND CENTER
94
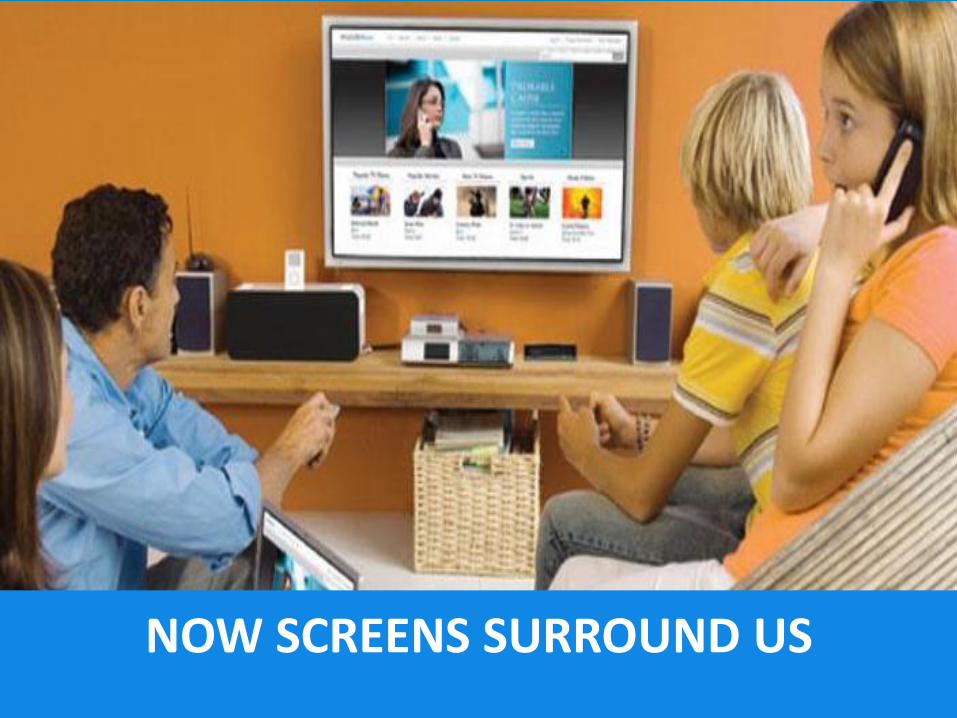
NOW SCREENS SURROUND US

of this world view
gain insight & understanding
created equal
screens are all important, but not
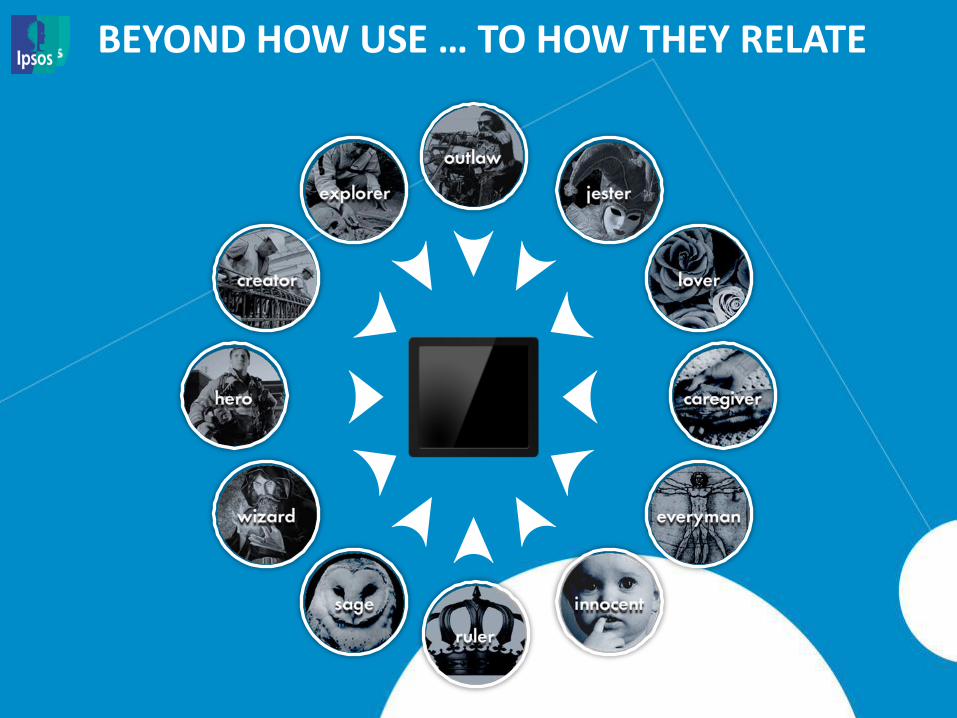
BEYOND HOW USE … TO HOW THEY RELATE
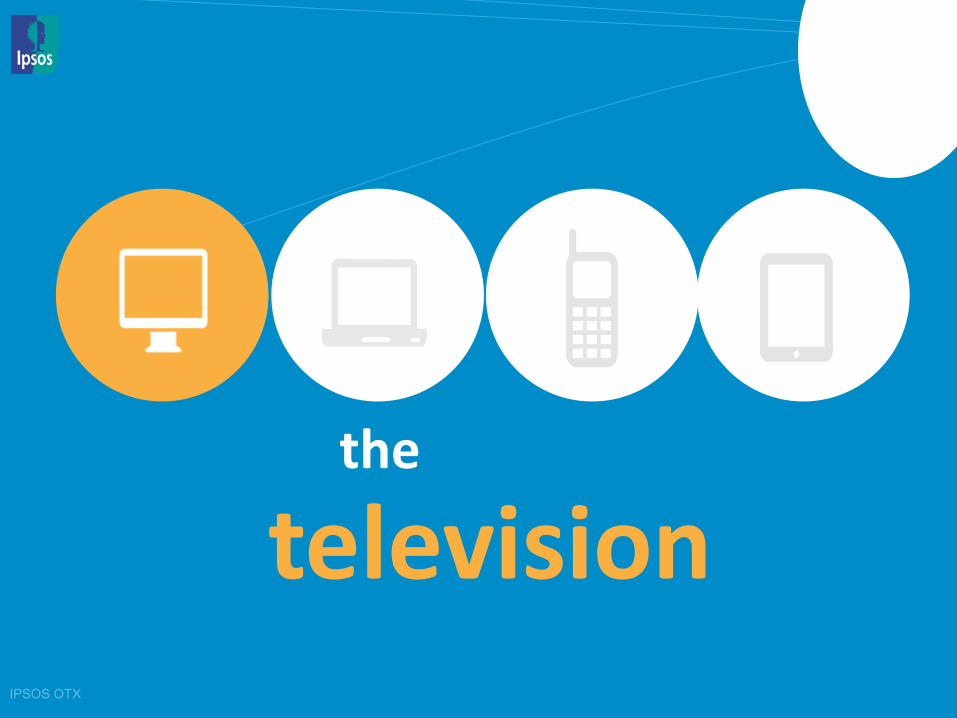
television the
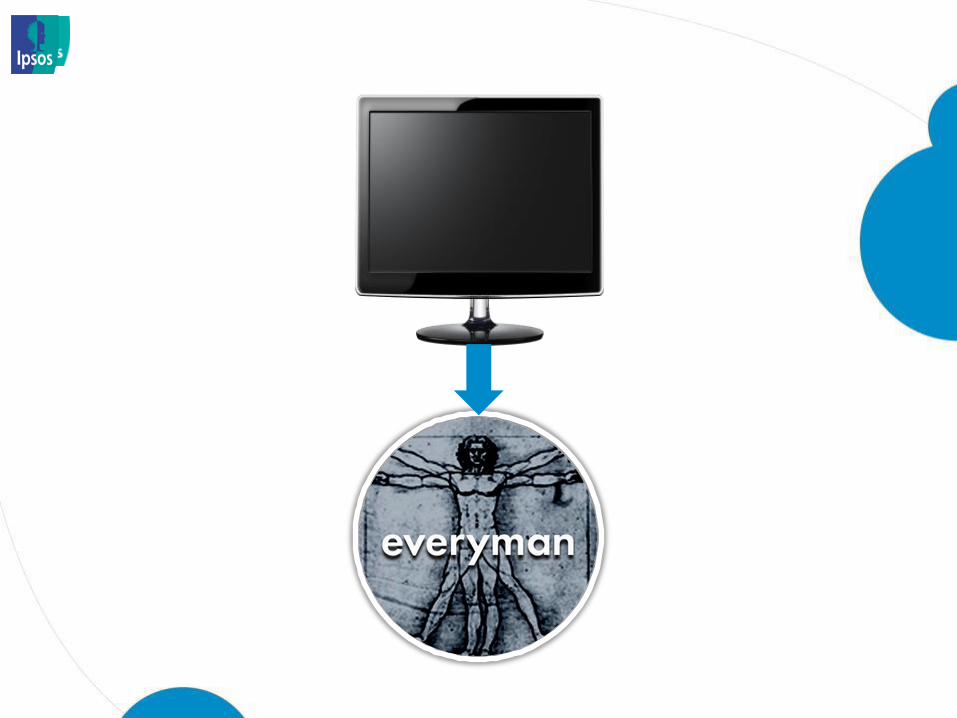
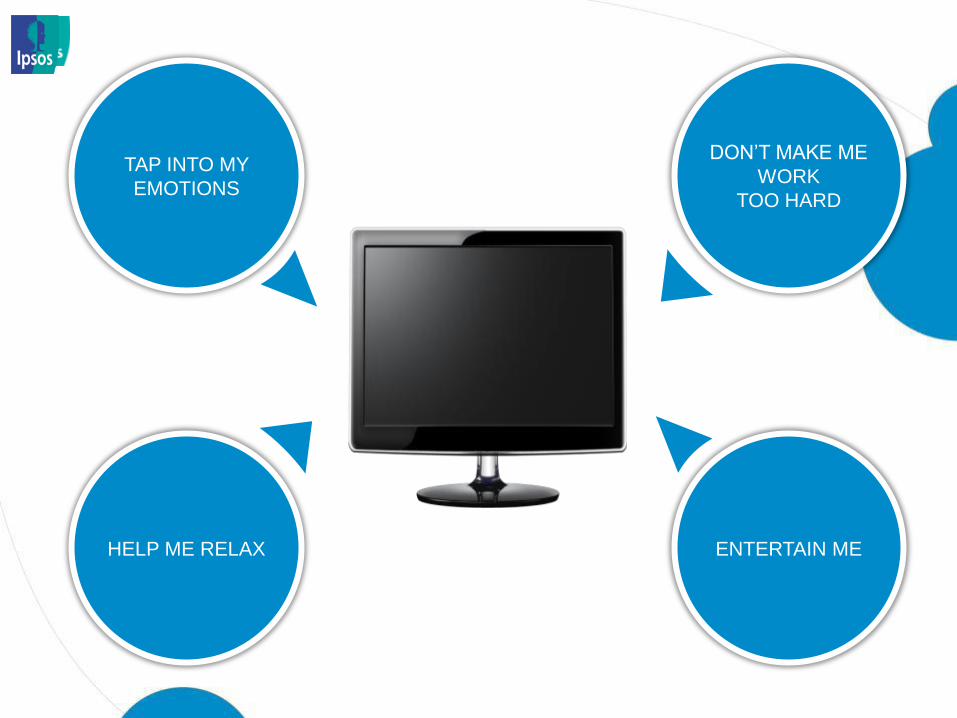
TAP INTO MY
EMOTIONS
DON’T MAKE ME
WORK
TOO HARD
ENTERTAIN ME HELP ME RELAX
computer the
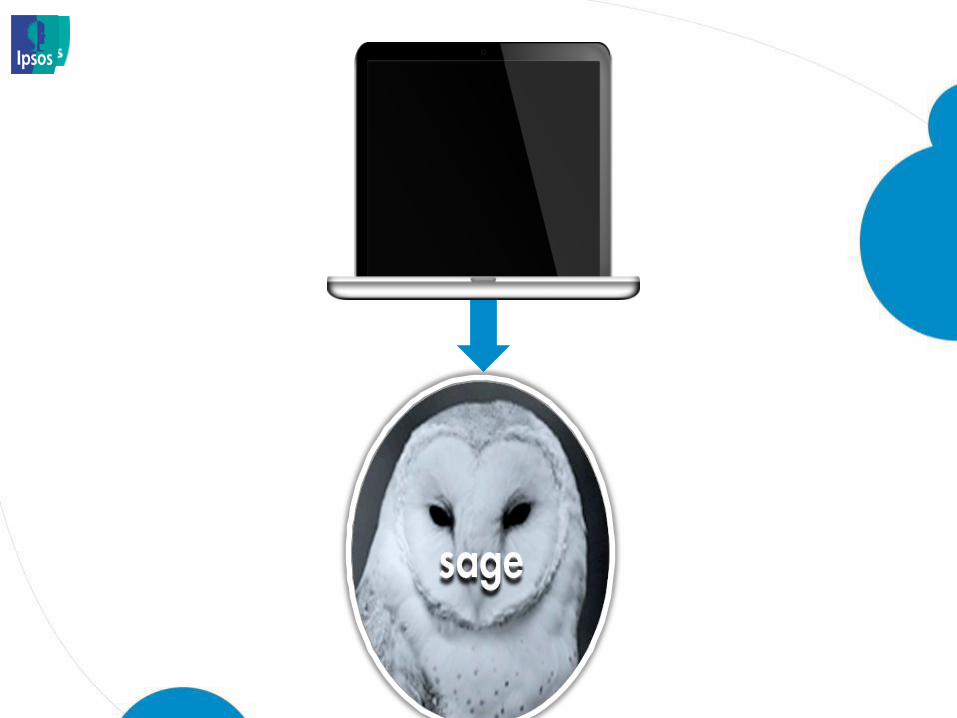
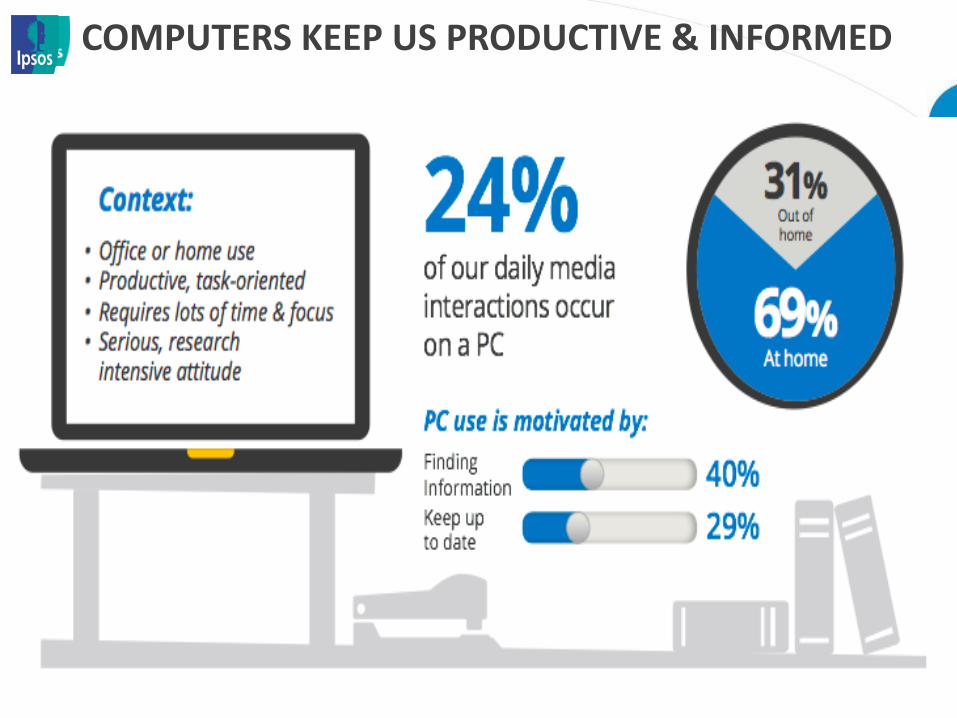
COMPUTERS KEEP US PRODUCTIVE & INFORMED
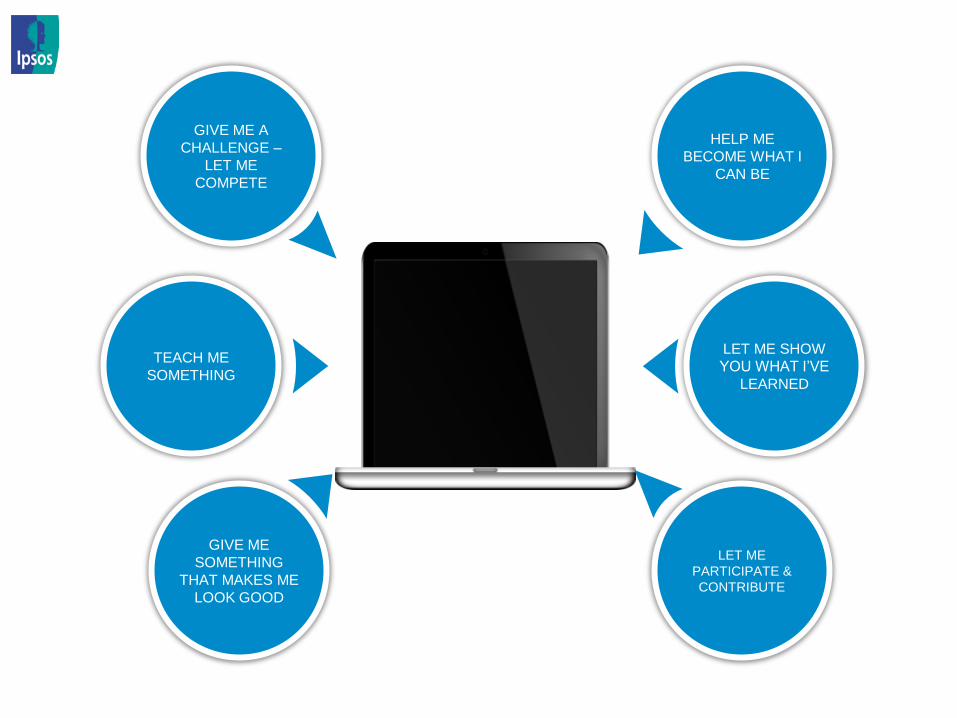
GIVE ME A
CHALLENGE –
LET ME
COMPETE
TEACH ME
SOMETHING
LET ME SHOW
YOU WHAT I’VE
LEARNED
HELP ME
BECOME WHAT I
CAN BE
LET ME
PARTICIPATE &
CONTRIBUTE
GIVE ME
SOMETHING
THAT MAKES ME
LOOK GOOD
mobile the
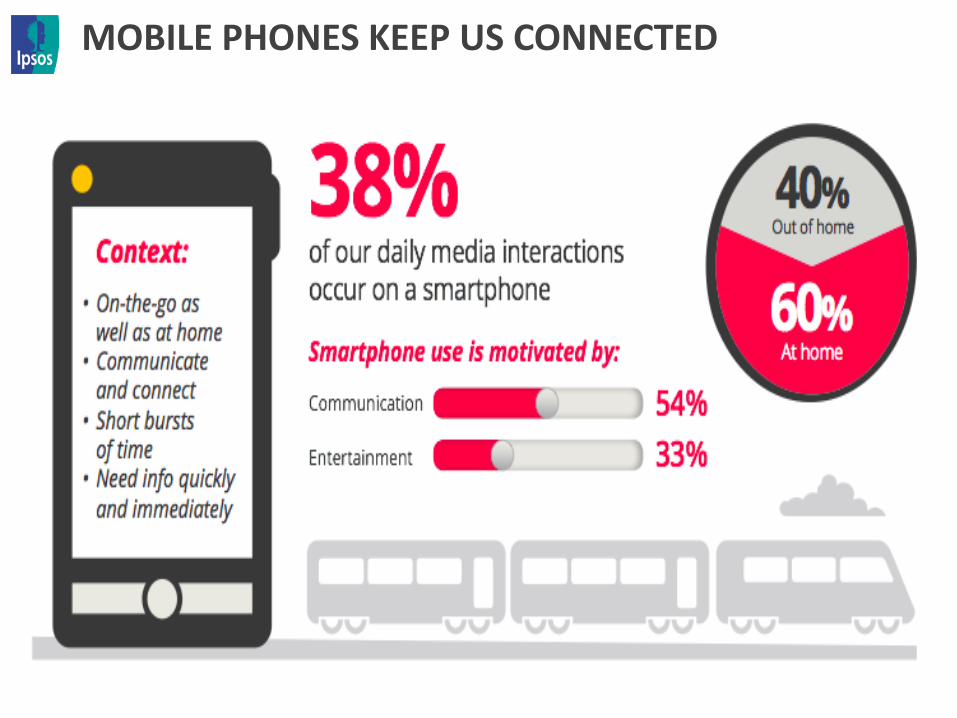
MOBILE PHONES KEEP US CONNECTED
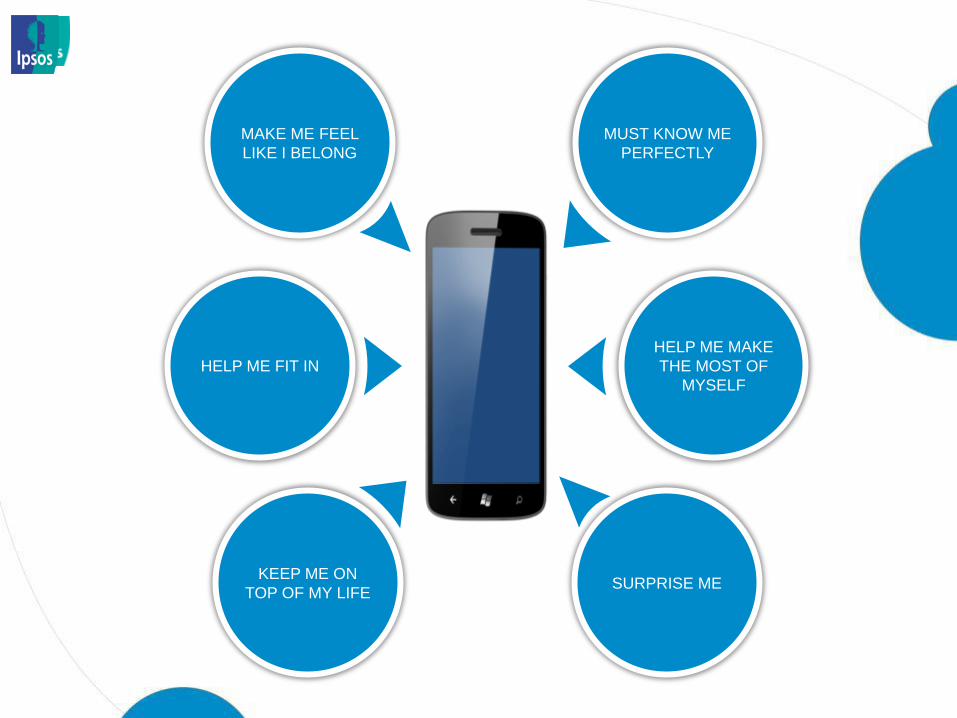
MAKE ME FEEL
LIKE I BELONG
HELP ME FIT IN
HELP ME MAKE
THE MOST OF
MYSELF
MUST KNOW ME
PERFECTLY
SURPRISE ME KEEP ME ON
TOP OF MY LIFE
the
tablet
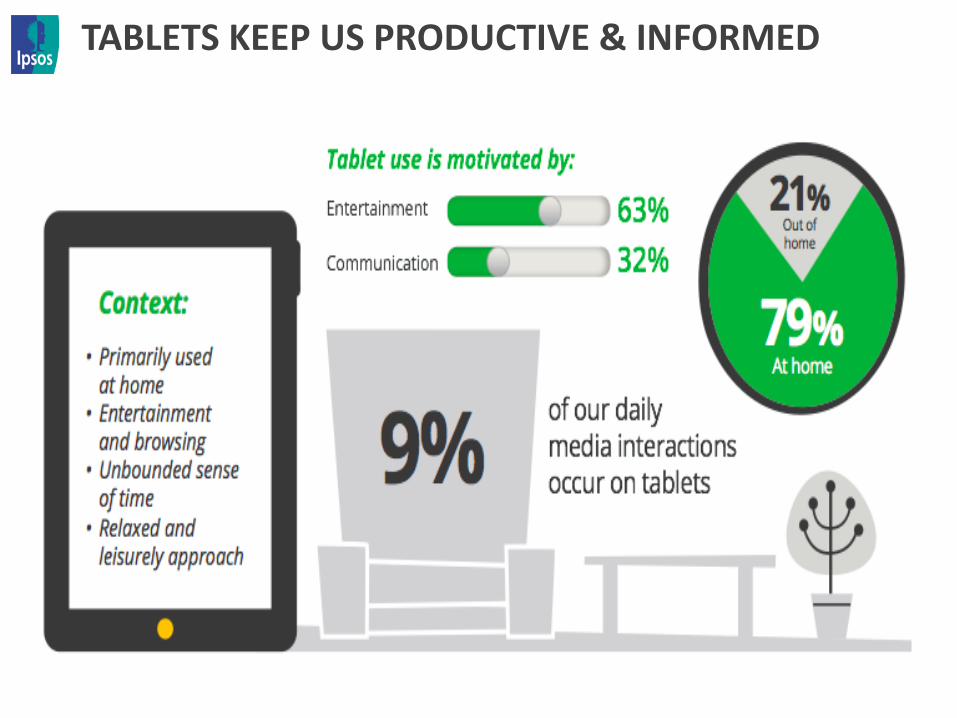
TABLETS KEEP US PRODUCTIVE & INFORMED
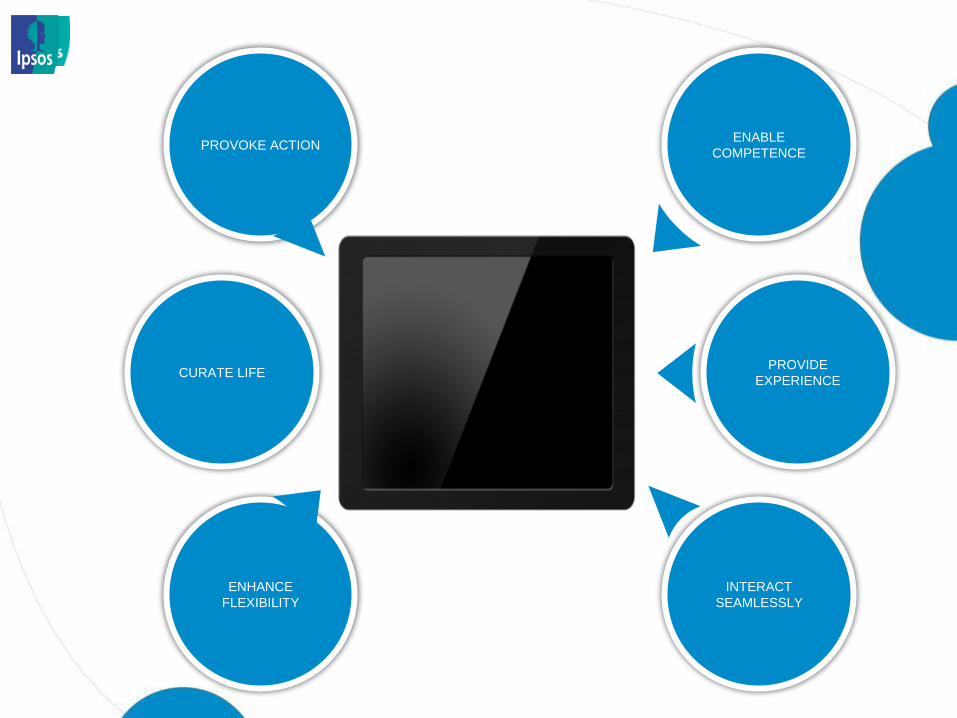
PROVOKE ACTION
CURATE LIFE PROVIDE
EXPERIENCE
ENABLE
COMPETENCE
INTERACT
SEAMLESSLY
ENHANCE
FLEXIBILITY
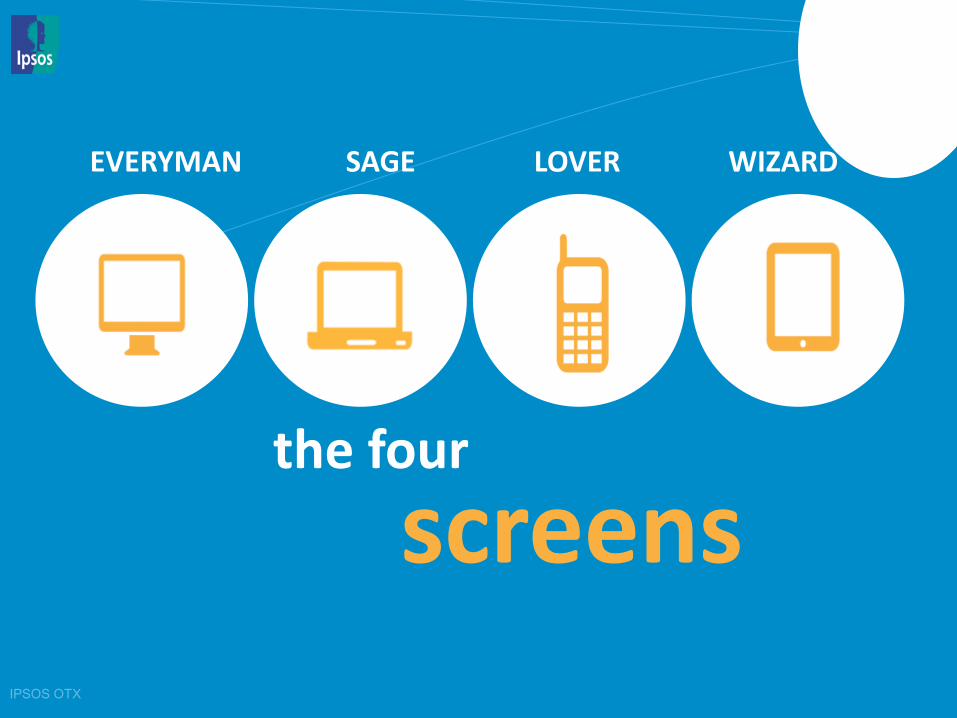
screens the four
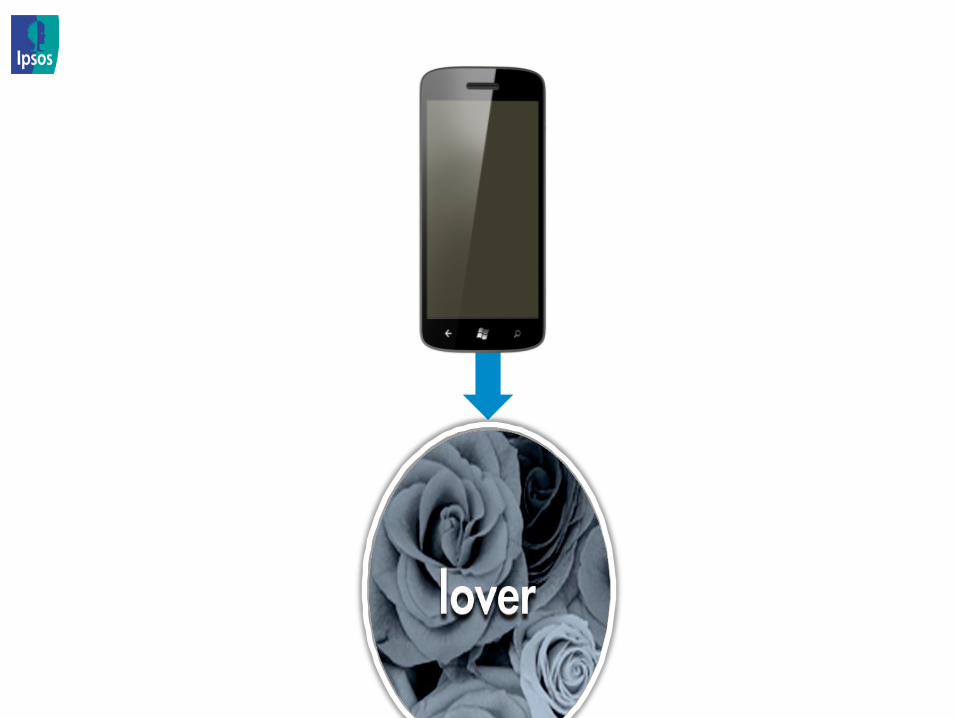
EVERYMAN LOVER WIZARD
SAGE

SCREEN RELATIONSHIPS AREN’T MONOGAMOUS
the code has not been
cracked
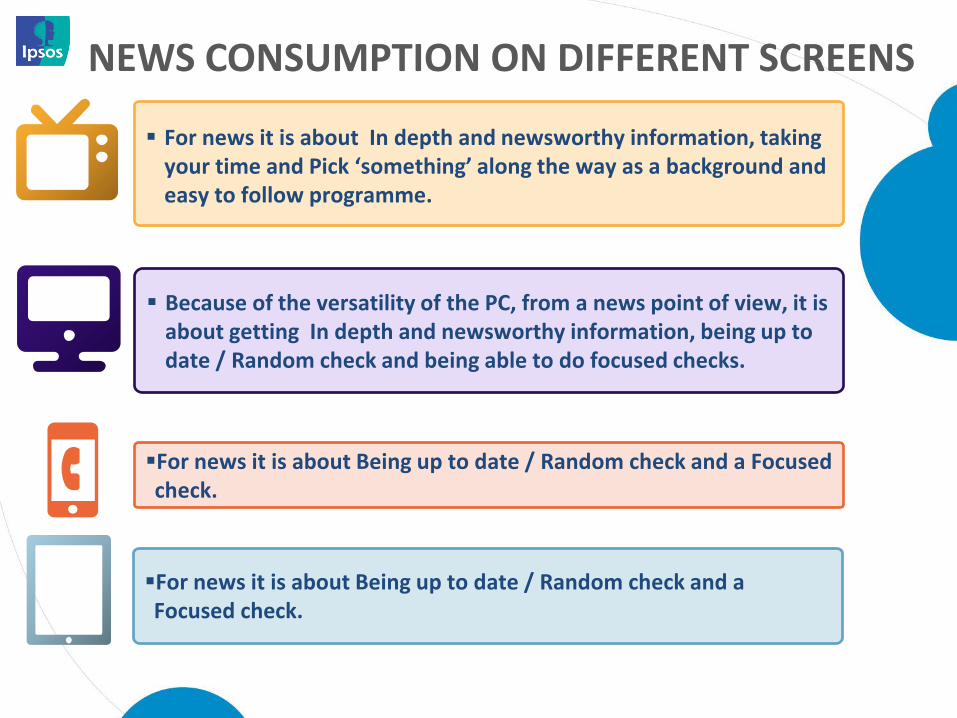
NEWS CONSUMPTION ON DIFFERENT SCREENS
For news it is about In depth and newsworthy information, taking your time and Pick ‘something’ along the way as a background and easy to follow programme.
Because of the versatility of the PC, from a news point of view, it is about getting In depth and newsworthy information, being up to date / Random check and being able to do focused checks.
For news it is about Being up to date / Random check and a Focused check.
For news it is about Being up to date / Random check and a Focused check.
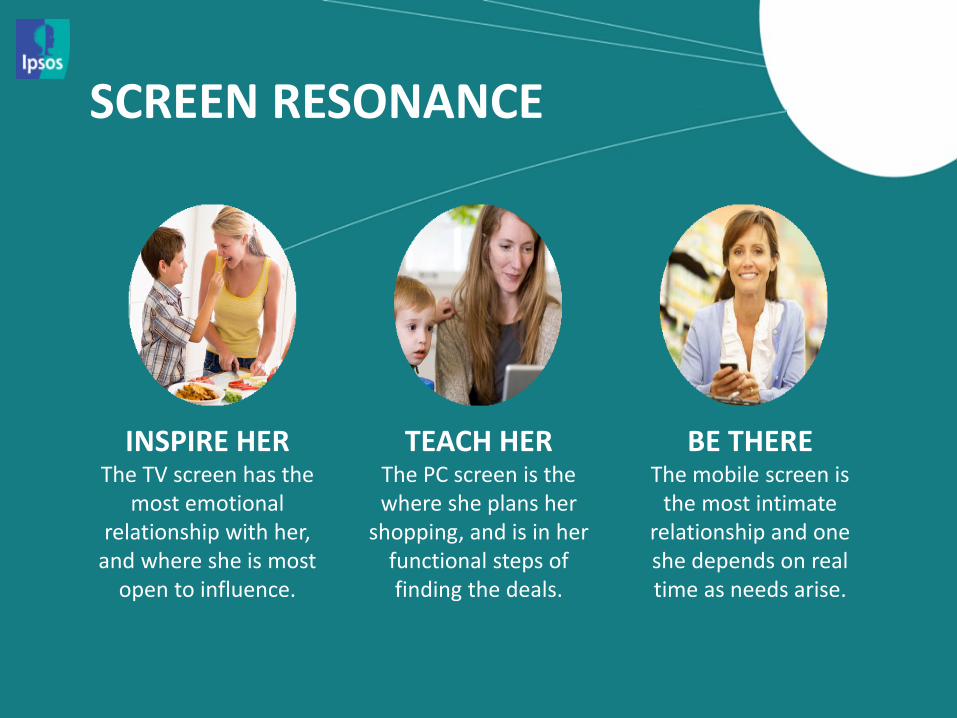
SCREEN RESONANCE
INSPIRE HER The TV screen has the
most emotional relationship with her,
and where she is most open to influence.
TEACH HER The PC screen is the where she plans her
shopping, and is in her functional steps of finding the deals.
BE THERE The mobile screen is
the most intimate relationship and one she depends on real time as needs arise.
122
OUR MOBILE PLANET
Understanding the Mobile Consumer
Ipsos/Google - 05/2013
123
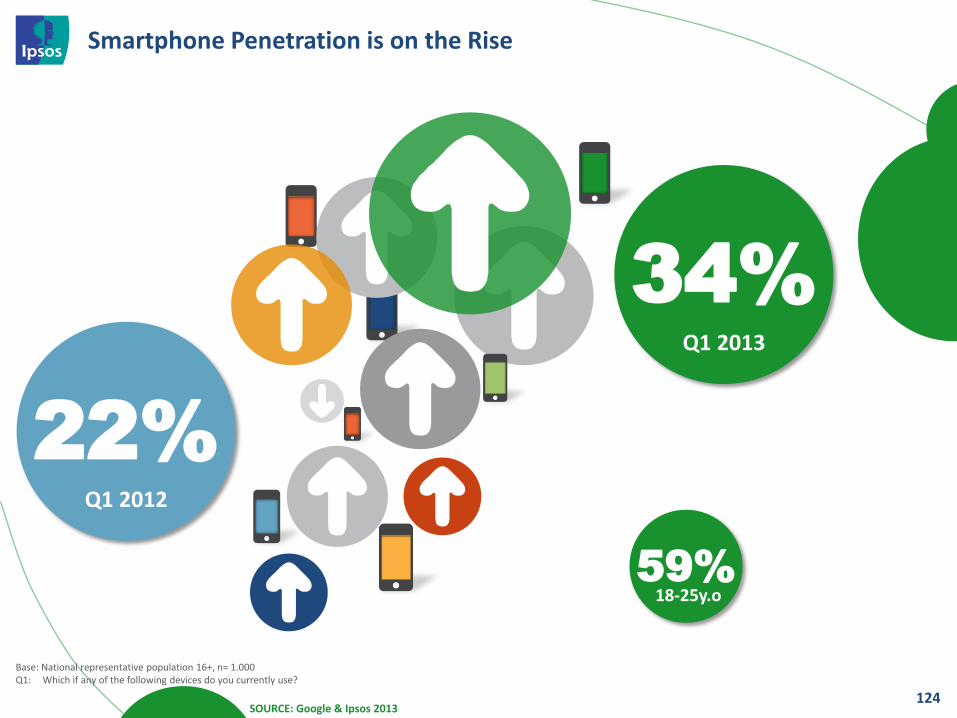
Smartphone Penetration is on the Rise
124
22%
Base: National representative population 16+, n= 1.000 Q1: Which if any of the following devices do you currently use?
SOURCE: Google & Ipsos 2013
Q1 2012
34% Q1 2013
59% 18-25y.o
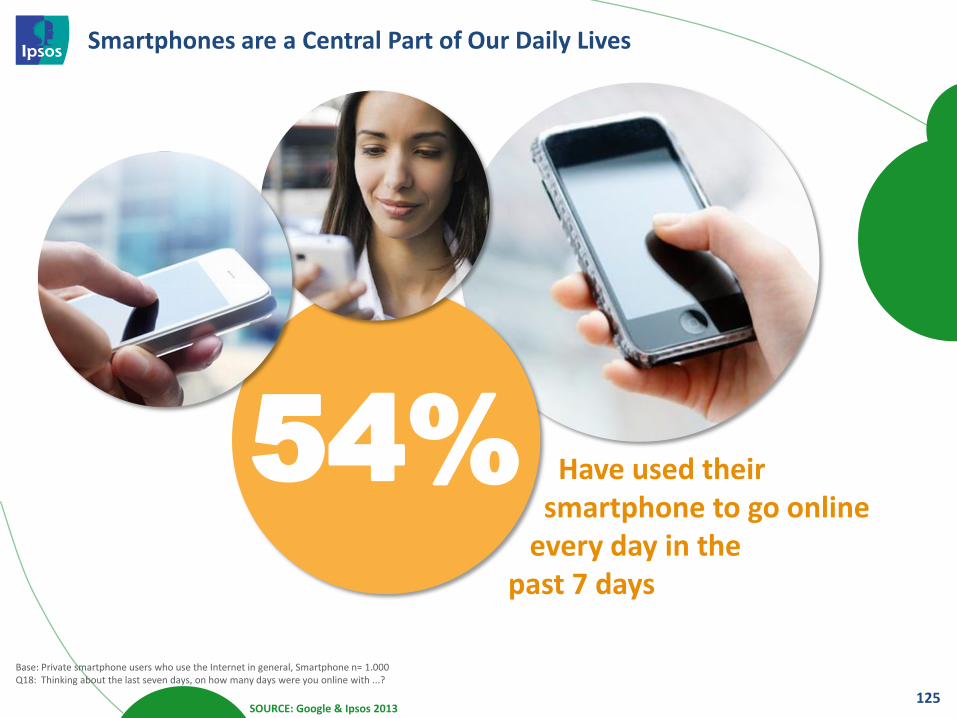
Smartphones are a Central Part of Our Daily Lives
125
Have used their smartphone to go online every day in the past 7 days
54%
Base: Private smartphone users who use the Internet in general, Smartphone n= 1.000 Q18: Thinking about the last seven days, on how many days were you online with ...?
SOURCE: Google & Ipsos 2013
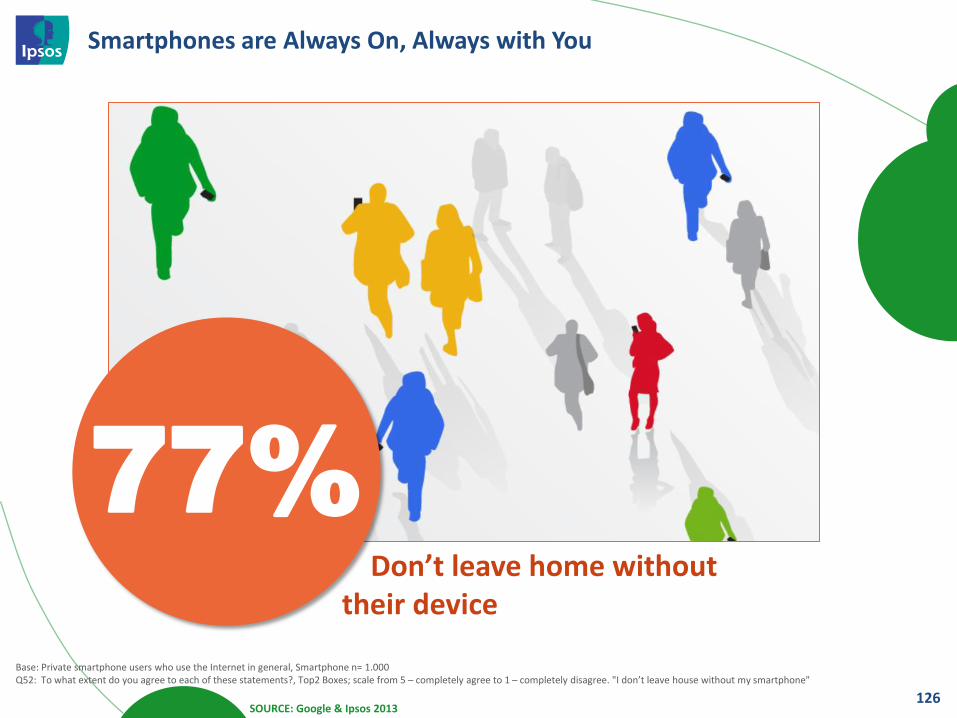
Smartphones are Always On, Always with You
126
77% Don’t leave home without their device
SOURCE: Google & Ipsos 2013
Base: Private smartphone users who use the Internet in general, Smartphone n= 1.000 Q52: To what extent do you agree to each of these statements?, Top2 Boxes; scale from 5 – completely agree to 1 – completely disagree. "I don’t leave house without my smartphone"
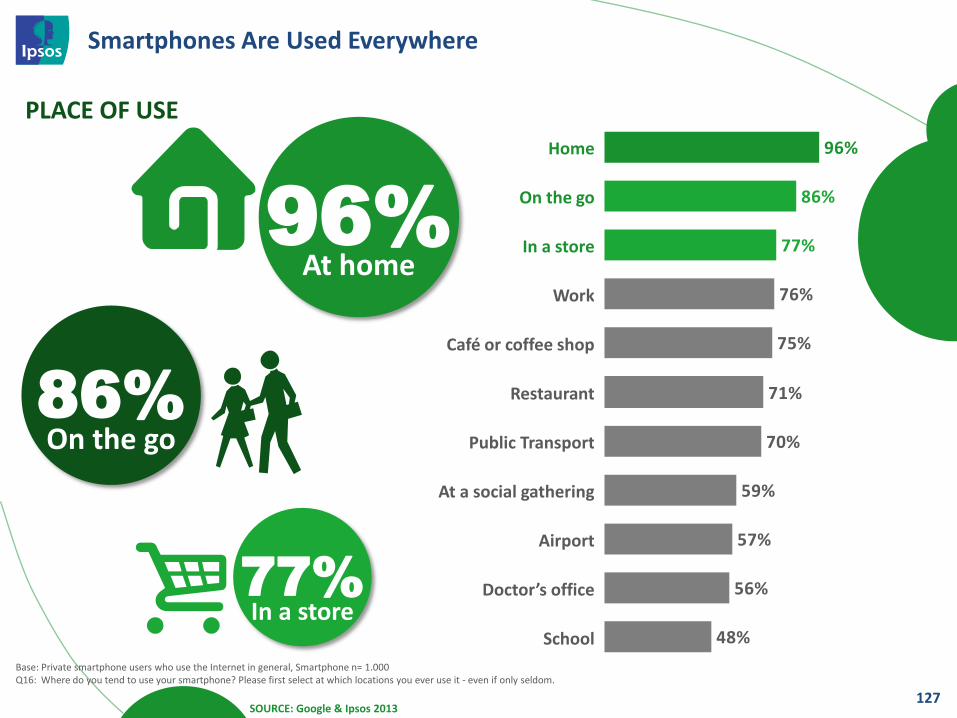
Smartphones Are Used Everywhere
127
76%
75%
71%
70%
59%
96%
86%
77%
48%
56%
57%
Home
On the go
In a store
Work
Café or coffee shop
Restaurant
Public Transport
At a social gathering
Airport
Doctor’s office
School
96% At home
86% On the go
77% In a store
PLACE OF USE
SOURCE: Google & Ipsos 2013
Base: Private smartphone users who use the Internet in general, Smartphone n= 1.000 Q16: Where do you tend to use your smartphone? Please first select at which locations you ever use it - even if only seldom.
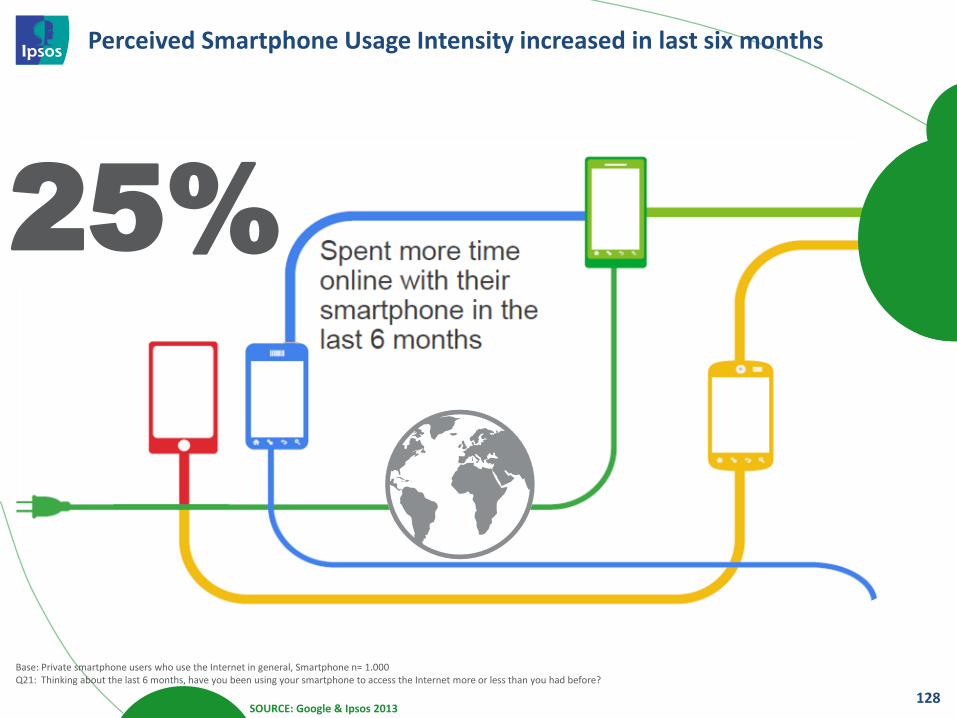
Perceived Smartphone Usage Intensity increased in last six months
128
Base: Private smartphone users who use the Internet in general, Smartphone n= 1.000 Q21: Thinking about the last 6 months, have you been using your smartphone to access the Internet more or less than you had before?
SOURCE: Google & Ipsos 2013
25%
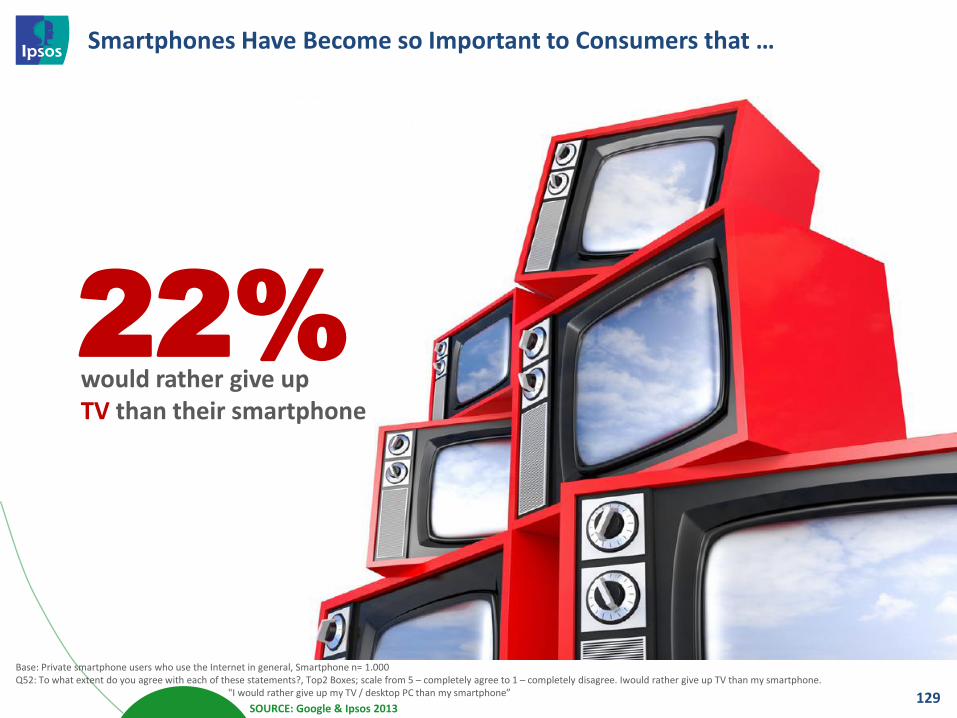
Smartphones Have Become so Important to Consumers that …
129
Base: Private smartphone users who use the Internet in general, Smartphone n= 1.000 Q52: To what extent do you agree with each of these statements?, Top2 Boxes; scale from 5 – completely agree to 1 – completely disagree. Iwould rather give up TV than my smartphone. "I would rather give up my TV / desktop PC than my smartphone”
SOURCE: Google & Ipsos 2013
would rather give up TV than their smartphone
22%
130
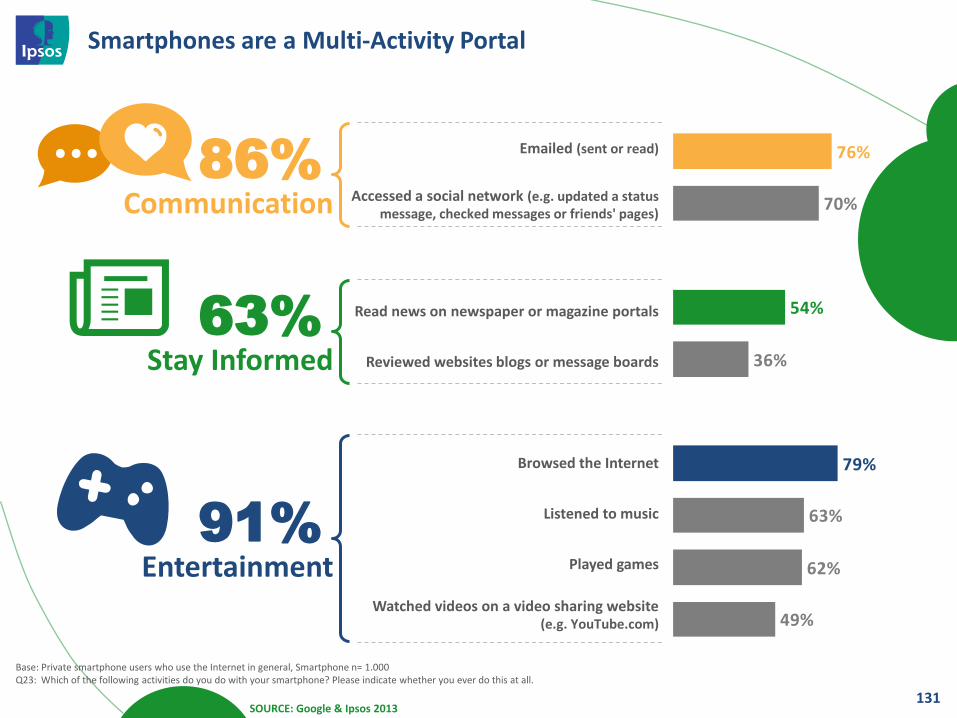
Smartphones are a Multi-Activity Portal
131
70%
36%
63%
79%
54%
76%
49%
62%
Emailed (sent or read)
Accessed a social network (e.g. updated a status message, checked messages or friends' pages)
Read news on newspaper or magazine portals
Reviewed websites blogs or message boards
Browsed the Internet
Listened to music
Played games
Watched videos on a video sharing website (e.g. YouTube.com)
Communication
Stay Informed
Entertainment
86%
63%
91%
SOURCE: Google & Ipsos 2013
Base: Private smartphone users who use the Internet in general, Smartphone n= 1.000 Q23: Which of the following activities do you do with your smartphone? Please indicate whether you ever do this at all.
25
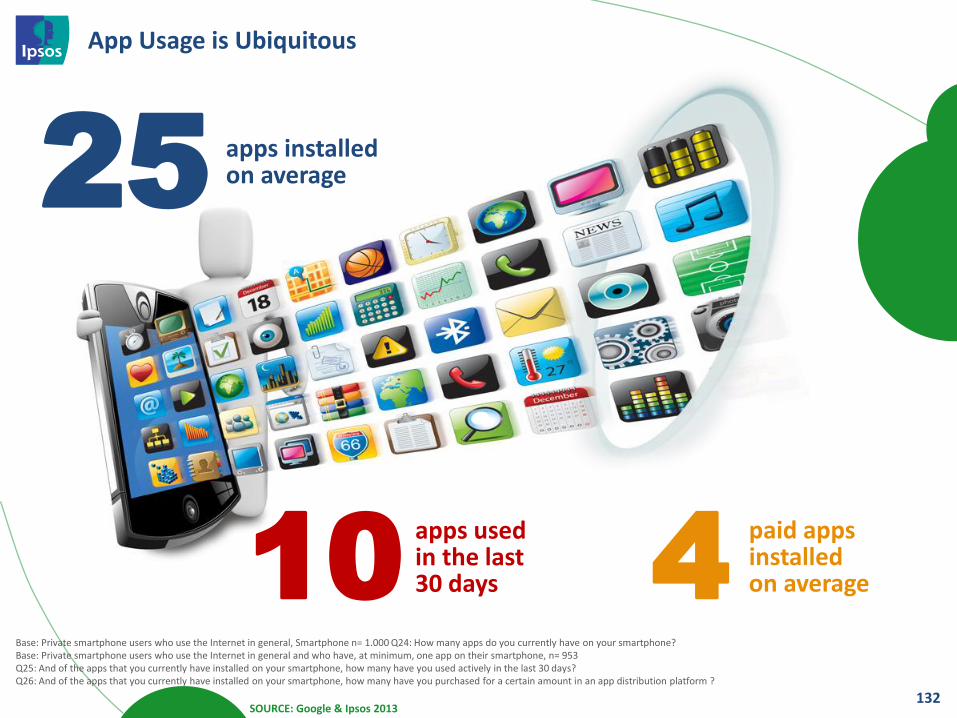
App Usage is Ubiquitous
132
apps installed on average
apps used in the last 30 days
paid apps installed on average 10 4
SOURCE: Google & Ipsos 2013
Base: Private smartphone users who use the Internet in general, Smartphone n= 1.000 Q24: How many apps do you currently have on your smartphone? Base: Private smartphone users who use the Internet in general and who have, at minimum, one app on their smartphone, n= 953 Q25: And of the apps that you currently have installed on your smartphone, how many have you used actively in the last 30 days? Q26: And of the apps that you currently have installed on your smartphone, how many have you purchased for a certain amount in an app distribution platform ?
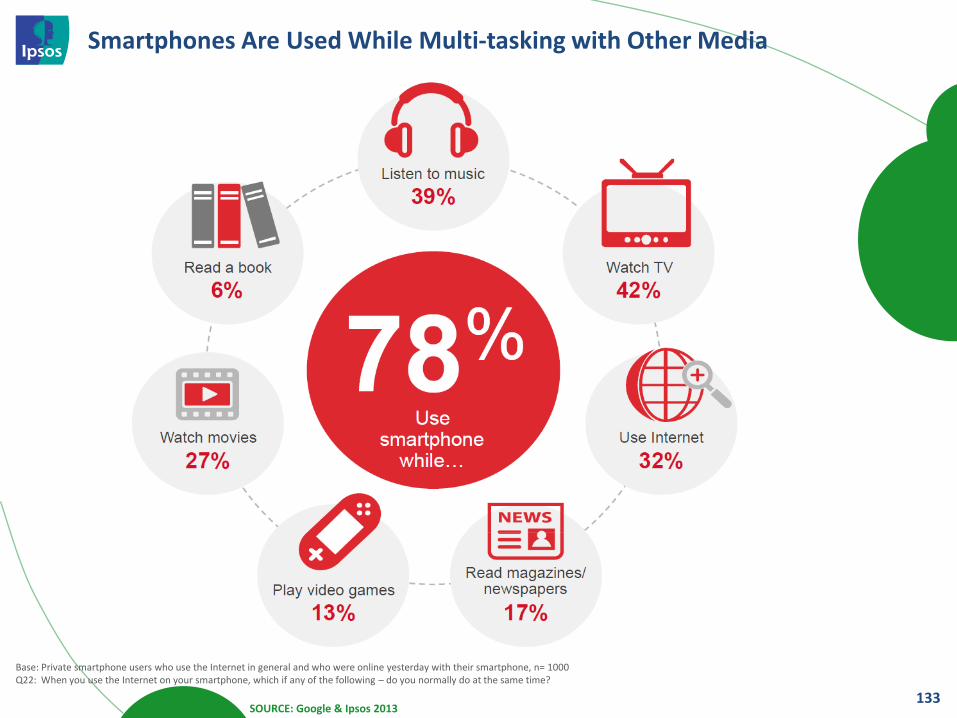
Smartphones Are Used While Multi-tasking with Other Media
133 SOURCE: Google & Ipsos 2013
Base: Private smartphone users who use the Internet in general and who were online yesterday with their smartphone, n= 1000 Q22: When you use the Internet on your smartphone, which if any of the following – do you normally do at the same time?
134
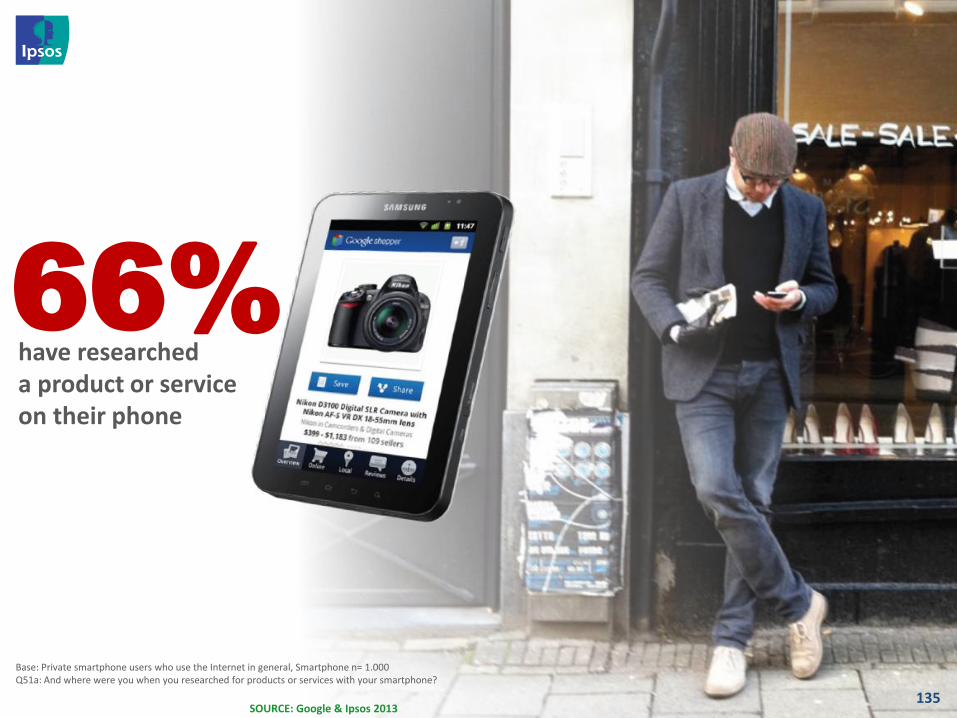
135 SOURCE: Google & Ipsos 2013
Base: Private smartphone users who use the Internet in general, Smartphone n= 1.000 Q51a: And where were you when you researched for products or services with your smartphone?
have researched a product or service on their phone
66%
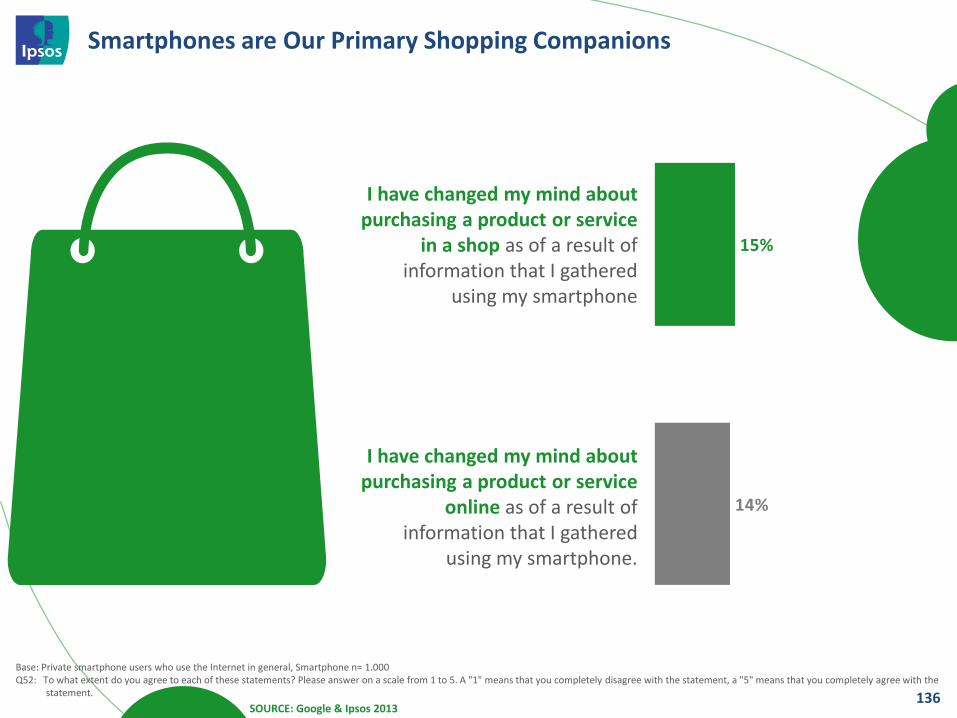
Smartphones are Our Primary Shopping Companions
136 SOURCE: Google & Ipsos 2013
Base: Private smartphone users who use the Internet in general, Smartphone n= 1.000 Q52: To what extent do you agree to each of these statements? Please answer on a scale from 1 to 5. A "1" means that you completely disagree with the statement, a "5" means that you completely agree with the statement.
I have changed my mind about purchasing a product or service
in a shop as of a result of information that I gathered
using my smartphone
I have changed my mind about purchasing a product or service
online as of a result of information that I gathered
using my smartphone.
14%
15%
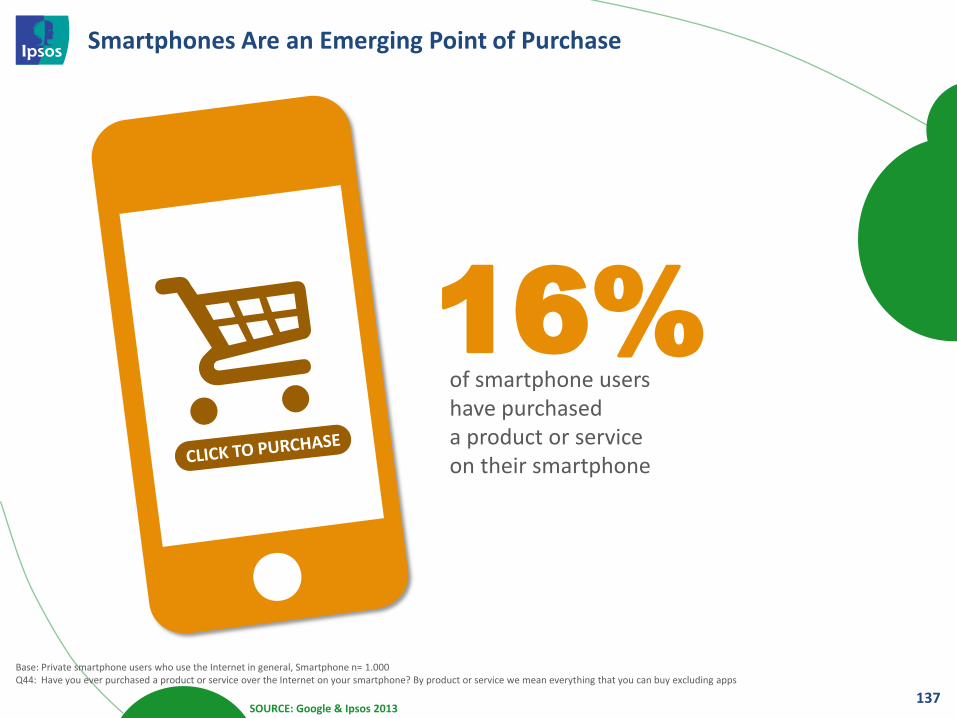
Smartphones Are an Emerging Point of Purchase
137
of smartphone users have purchased a product or service on their smartphone
16%
SOURCE: Google & Ipsos 2013
Base: Private smartphone users who use the Internet in general, Smartphone n= 1.000 Q44: Have you ever purchased a product or service over the Internet on your smartphone? By product or service we mean everything that you can buy excluding apps
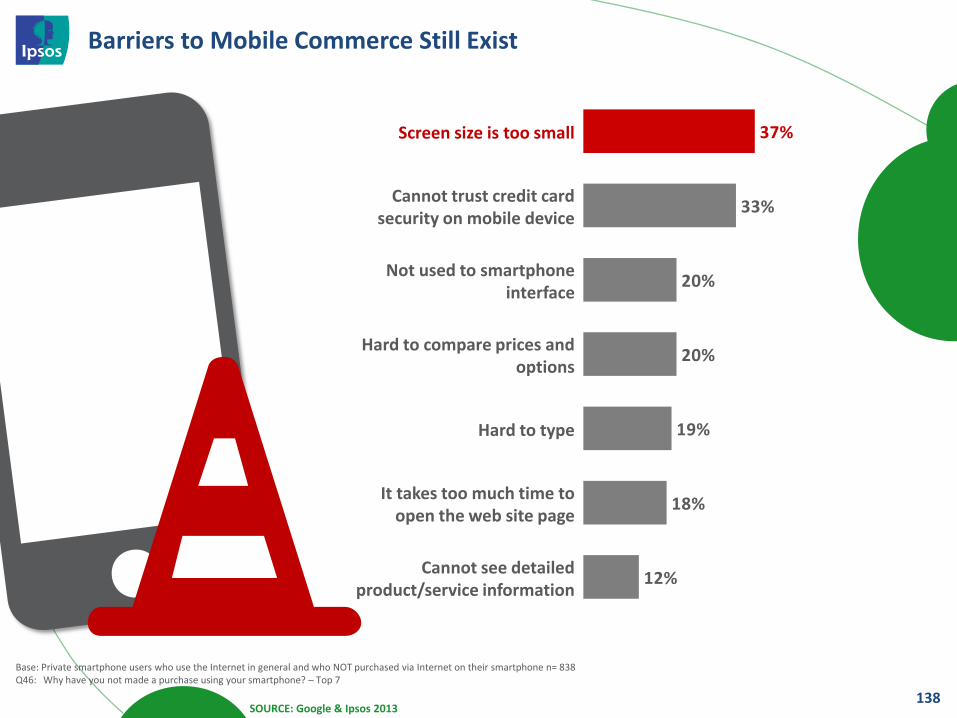
Barriers to Mobile Commerce Still Exist
138
33%
20%
19%
18%
12%
20%
37%Screen size is too small
Cannot trust credit card security on mobile device
Not used to smartphone interface
Hard to compare prices and options
Hard to type
It takes too much time to open the web site page
Cannot see detailed product/service information
SOURCE: Google & Ipsos 2013
Base: Private smartphone users who use the Internet in general and who NOT purchased via Internet on their smartphone n= 838 Q46: Why have you not made a purchase using your smartphone? – Top 7
139

Offline Ad Exposure Leads to Mobile Search
140
have performed a mobile search after
seeing an ad
42%
SOURCE: Google & Ipsos 2013
Base: Private smartphone users who use the Internet in general, n= 1000 Q43a: Thinking about the last 6 months, how often have you used your smartphone to do a search in response to an ad you have seen in a magazine, on a poster, on TV or in a shop/business?
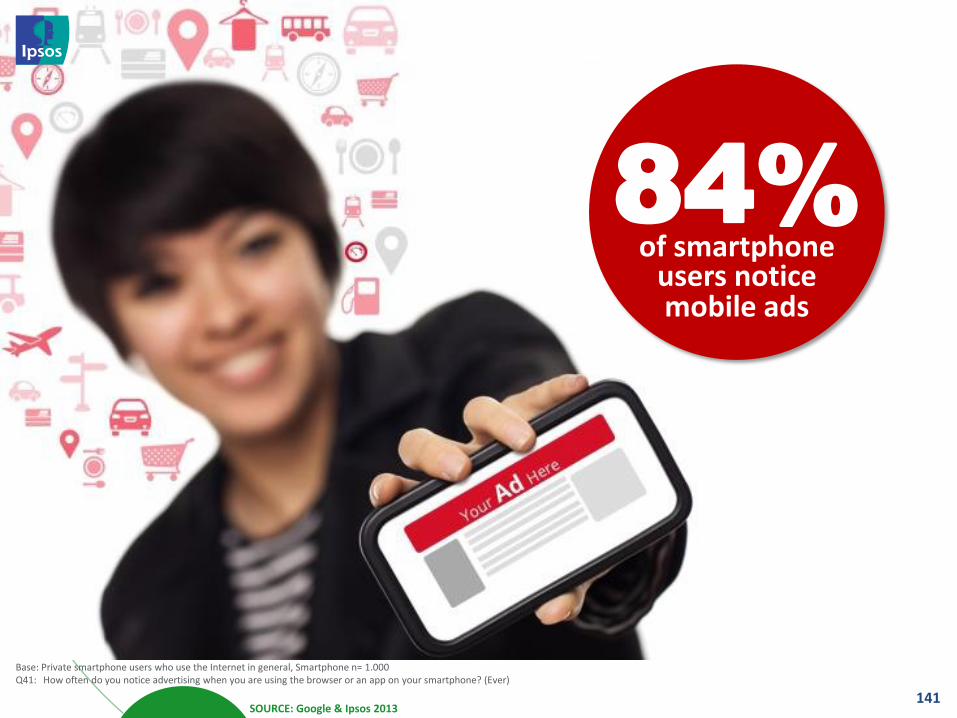
141
84% of smartphone
users notice mobile ads
SOURCE: Google & Ipsos 2013
Base: Private smartphone users who use the Internet in general, Smartphone n= 1.000 Q41: How often do you notice advertising when you are using the browser or an app on your smartphone? (Ever)
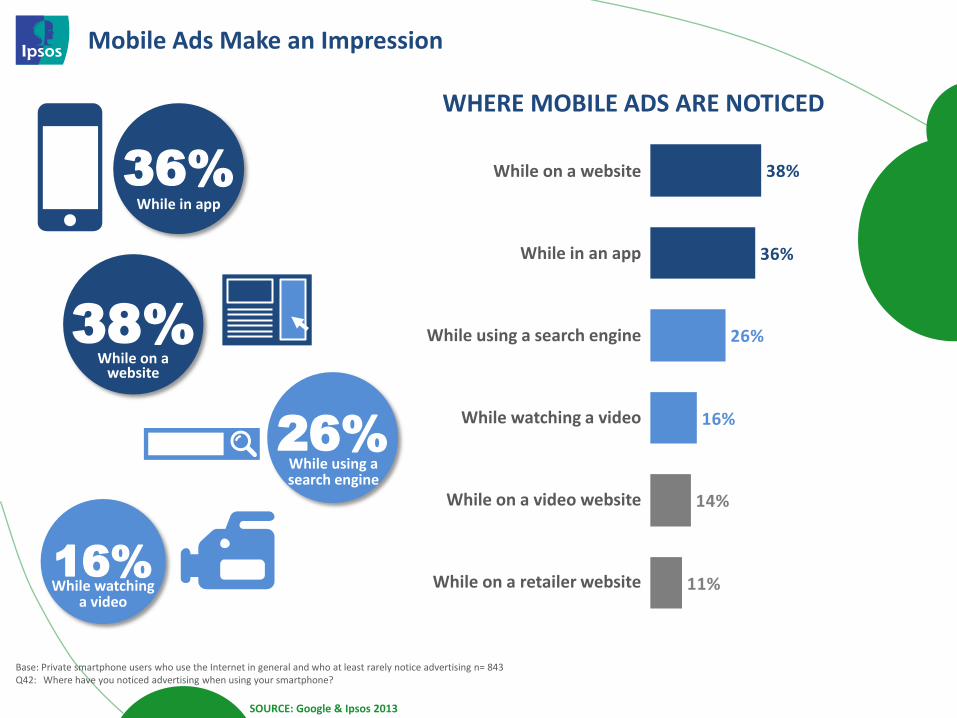
Mobile Ads Make an Impression
14%
11%
38%
36%
26%
16%
While on a website
While in an app
While using a search engine
While watching a video
While on a video website
While on a retailer website
WHERE MOBILE ADS ARE NOTICED
36% While in app
38% While on a
website
16% While watching
a video
26% While using a search engine
SOURCE: Google & Ipsos 2013
Base: Private smartphone users who use the Internet in general and who at least rarely notice advertising n= 843 Q42: Where have you noticed advertising when using your smartphone?
In Summary
143
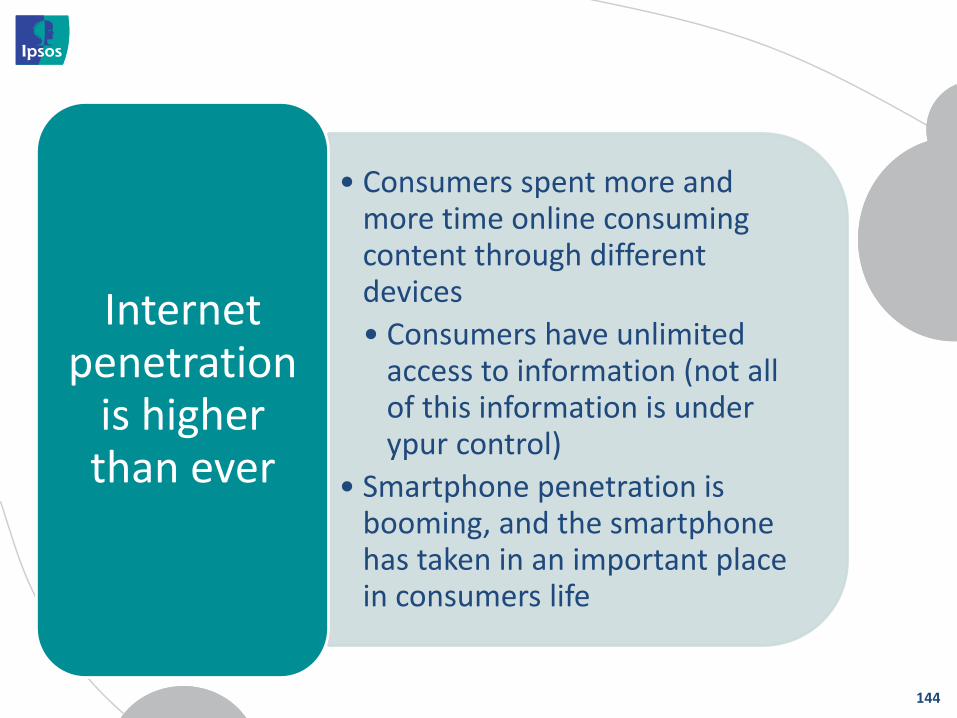
• Consumers spent more and more time online consuming content through different devices
• Consumers have unlimited access to information (not all of this information is under ypur control)
• Smartphone penetration is booming, and the smartphone has taken in an important place in consumers life
Internet penetration
is higher than ever
144
• Understand the relationship between a “screen” and your consumer
• Every “screen” has its personality, adapt your communication to it and make information relevant
• Gather insights in the digital path to purchase
• Acknowledge the impact of comparing products and services, on professional comparison websites or user generated fora and blogs
• Provide relevant information in every step of the digital journey
Relevance is KEY
145