Embed Size (px)
Citation preview

Lesson 1: Ferris Wheels—Tracking the Height of a Passenger Car Date: 8/18/14
11
© 2014 Common Core, Inc. Some rights reserved. commoncore.org This work is licensed under a Creative Commons Attribution-NonCommercial-ShareAlike 3.0 Unported License.
NYS COMMON CORE MATHEMATICS CURRICULUM M2 Lesson 1 ALGEBRA II
Lesson 1: Ferris Wheels—Tracking the Height of a
Passenger Car
Student Outcomes
Students apply geometric concepts in modeling situations. Specifically, they find distances between points of a
circle and a given line to represent the height above the ground of a passenger car on a Ferris wheel as it is
rotated a number of degrees about the origin from an initial reference point.
Students sketch the graph of a nonlinear relationship between variables.
Lesson Notes
This lesson sets the stage for the study of the sine function by asking students to explore the height of a Ferris wheel
passenger car at various points on its circular path. The main goal of this first lesson is for students to discover that the
relationship between the height and the number of degrees through which the car has rotated from an initial reference
position is not linear. In later lessons, we will relate this function to the sine function and see how the geometric
definitions of sine, cosine, and the other trigonometric ratios can be extended to these circular functions represented in
the coordinate plane. We purposely did not refer to this height function as the sine function in this lesson in order to
separate this new function from the domain-limited sine function that they know from triangle trigonometry.
To precisely define and describe the sine and cosine functions in later lessons, the domain must be the real numbers, so
that we take the sine (or cosine) of the number of degrees/radians that an initial ray (i.e., the nonnegative -axis) has
been rotated. In this situation, we specifically define rotations that do not involve any sense of time such as “a rotating
clock” or a “turning wheel.” However, it is very natural for students to conceptualize the situation as dependent on
time. Because of this conceptual difficulty, old textbooks often defined sine and cosine functions as “spinning a ray
about the origin,” where students got a sense of non-static motion. Of course, non-static motion is based upon time,
which is not how we precisely define these trigonometric functions. However, the conceptual image of the wheel
rotating is quite good and important for students to understand; it is just not a definition.
Since the goal of this lesson is not to explain the definition of sine, it is acceptable if the students have a conceptual
image of the wheel spinning with regards to time. However, we are also setting the stage for precise definitions of the
sine and cosine functions on the real line, and those precise definitions are based on the amount of rotation that has
occurred, not on any sense of how much time has elapsed. In Topic B, we will consider how to model the motion of the
Ferris wheel with respect to time, but until that point, we are concerned only with the amount of rotation that a car
undergoes from an initial position to a terminal position. Hence, we do not introduce time/motion into the first lessons
because those lessons are about graphing and plotting specific points (i.e., students measure the degrees of a specific
rotation and then measure the specific height associated with it). The motion of the Ferris wheel will be explored in a
later modeling lesson, but introducing the motion now would ultimately distract students from the definitions being
developed in these initial lessons.
To further explore the non-linearity of the Ferris wheel’s passenger car height function, students use a paper plate to
model a Ferris wheel and actually measure heights at various rotations from an initial reference point and create a graph
of the paired rotations and heights. During this module, you will need a classroom set of protractors marked in both

Lesson 1: Ferris Wheels—Tracking the Height of a Passenger Car Date: 8/18/14
12
© 2014 Common Core, Inc. Some rights reserved. commoncore.org This work is licensed under a Creative Commons Attribution-NonCommercial-ShareAlike 3.0 Unported License.
NYS COMMON CORE MATHEMATICS CURRICULUM M2 Lesson 1 ALGEBRA II
radians and degrees. We start the module using degrees to measure rotation, and progress in Lesson 9 to using radians
to measure rotation. Consistent use of protractors marked with both units will ease the transition from the familiar
degree measure to the unfamiliar radian measure. A template for these protractors is provided at the end of Lesson 9
and may be printed on transparencies to distribute to students.
Lesson 1 closes by offering a definition of a periodic function and asks students to reflect on why the Ferris wheel height
function is an example of a periodic function. In Lesson 2, we will use the paper plates again and create a graph of both
the vertical and horizontal displacements of the car from the axes with respect to the degrees of rotation, eventually
leading to the formal definition of sine and cosine functions as the - and -coordinates, respectively, of a point on a
circle of radius unit for a given number of degrees of rotation . Both of these lessons focus significantly on MP.2.
Students employ this mathematical practice in many places in these two lessons as they relate abstract representations
to the movement of the wheel.
Materials
Students will be modeling a Ferris wheel using simple, inexpensive supplies. Depending on your students, you may wish
to build one class model, one model per group or pair of students, or have each student create a model.
You will need the following tools for the next two lessons.
Rulers
Protractors marked in degree and radian units (Rotation will be measured in degrees in this lesson.)
Graph paper (optional)
Colored pencils or pens
You will need the following consumable materials for the next two lessons.
Paper plates, 1 per model
8.5 by 11 cardstock (half of a used manila folder), 1 per model
A metal brad/fastener (picture shown), 1 per model
Classwork
Opening (5 minutes)
In the last module, students used polynomial and rational functions to model various situations. In this module, we will
explore functions that represent phenomena that repeat in a predictable way. Show students a video of a Ferris wheel
in motion (http://shows.howstuffworks.com/stuff-of-genius/41719-george-ferris-and-his-amazing-wheel-video.htm) or a
picture of a Ferris wheel. The link provided above provides a bit of history about the first Ferris wheel, invented by
George Ferris in 1893, and also models the motion of the wheel. Ask them to consider how the height of a single
passenger car is changing as the car rotates around the wheel. Have them discuss their ideas with a partner, and then
have a few students share their thoughts with the whole class. Have students consider other quantities that are
changing in this situation such as the horizontal distance from the wheel’s center that will become relevant in Lesson 2.
The questions below can be used to motivate this discussion. Record student responses on the board or on a sheet of
chart paper for reference over the course of Lessons 1 and 2.

Lesson 1: Ferris Wheels—Tracking the Height of a Passenger Car Date: 8/18/14
13
© 2014 Common Core, Inc. Some rights reserved. commoncore.org This work is licensed under a Creative Commons Attribution-NonCommercial-ShareAlike 3.0 Unported License.
NYS COMMON CORE MATHEMATICS CURRICULUM M2 Lesson 1 ALGEBRA II
What quantities in this situation are changing as the Ferris wheel
rotates?
There are many possible answers, including the height of the
cars above the ground, the position of the cars with respect
the ground, the horizontal position of the cars from the
center of the wheel, the amount of time that is passing, the
amount the rotation is changing when the wheel is in
motion, and the speed the wheel is rotating.
How does the height of a single passenger car change as the car
rotates around the wheel?
The height above the ground increases and decreases as the
wheel rotates. There is a maximum and minimum height
because the cars are positioned on a circle of fixed diameter.
After one full rotation, a single car is back to the height
where it originally started.
Exploratory Challenge 1 (5 minutes): The Height of a Ferris Wheel Car
Start students on this problem to help them formalize their thinking from the Opening. The graphs they create will vary
widely based on the assumptions that they make. Some groups may want to select a specific height for their Ferris
wheel. Some may start the passenger car in different locations. Some may want to consider time as the independent
variable along the horizontal axis while others may use number of turns for the independent variable. The goal of this
first exercise is to get a rough sketch on paper and motivate students to want to explore this problem with more
precision when they create the paper plate model. Be sure to read through the discussion that follows this problem to
help you understand how to support students during this exploration phase.
Scaffolding:
Use questions that proceed from
concrete to abstract to support groups
that are having trouble getting started:
What quantities are going to be
included in the sketch? Which one
should be the dependent variable,
height or amount of rotation? Why
does it make sense for height to be the
dependent variable?
Have students create a simple table to help them make their graphs more precise.
Provide students with a set of axes labeled as shown below.

Lesson 1: Ferris Wheels—Tracking the Height of a Passenger Car Date: 8/18/14
14
© 2014 Common Core, Inc. Some rights reserved. commoncore.org This work is licensed under a Creative Commons Attribution-NonCommercial-ShareAlike 3.0 Unported License.
NYS COMMON CORE MATHEMATICS CURRICULUM M2 Lesson 1 ALGEBRA II
Exploratory Challenge 1: The Height of a Ferris Wheel Car
George Ferris built the first Ferris wheel in 1893 for the World’s Columbian Exhibition in Chicago. It had passenger
cars, was feet tall, and rotated once every minutes when all the cars were loaded. The ride cost .
a. Create a sketch of the height of a passenger car on the original Ferris wheel as that car rotates around the wheel
times. List any assumptions that you are making as you create your model.
Three possible solutions are shown. Notice
that the third response is closest to an actual
sinusoid graph.
We assumed the car was traveling at a
constant speed. We assumed that the car we
chose started at the bottom of the wheel. We
thought about where the car would be every
quarter rotation to help us create the graph.
We assumed that we were measuring height
above the ground, and that the car started at
a height of units.
b. What type of function would best model this
situation?
This answer should be consistent with the
sketch in Exercise 1. They might respond that
the graph could be line segments, so a
piecewise linear function would work, or it
could be semi-circles since the graph is based
on the car moving around a circle.

Lesson 1: Ferris Wheels—Tracking the Height of a Passenger Car Date: 8/18/14
15
© 2014 Common Core, Inc. Some rights reserved. commoncore.org This work is licensed under a Creative Commons Attribution-NonCommercial-ShareAlike 3.0 Unported License.
NYS COMMON CORE MATHEMATICS CURRICULUM M2 Lesson 1 ALGEBRA II
Discussion (8 minutes)
Have different groups present their results. Start with groups whose graphs are less precise and detailed and finish with
groups whose sketches look most like the graph of a sinusoidal function. Use the questions below to debrief the class
sketches. Let the conclusions about the shape of the graph come from the group. If no groups propose a non-linear or
non-semi-circular graph, that is OK.
In this section, guide the discussion around the sketches created in the Exploratory Challenge 1 to arrive at two
conclusions. These are the most important understandings for students to have at this point in the lesson.
The height of the car will repeat as the wheel rotates. For any given point on the Ferris wheel, the height of
the car at that point will be the same, regardless of how many times the wheel has rotated to get to that point,
and
The range of the function represented by this graph is a closed interval whose length corresponds to the
diameter of the wheel.
At this point, many students may be graphing a chevron pattern composed of straight line segments or a wave pattern
composed of semi-circles, while some may have offered a convincing argument that this relationship cannot be linear or
a collection of semi-circles. The paper plate exploration that follows will help students to make a final decision regarding
the shape of the graph. The following questions can be used to focus the discussion of the student graphs. The answers
are representative of what students might say in response, but encourage and accept all reasonable answers in this very
open-ended discussion.
How did you decide where to locate your points on this graph?
We started with the car at ground level and then graphed a point halfway around when it was at the
top of the wheel. We also graphed the points when the car was one-fourth and three-fourths of the way
around. We decided that the wheel was rotating counter-clockwise from our viewpoint.
How could you make your assumed model more precise?
We could measure the height at more points during the rotation, such as every one-eighth of a rotation.
Is a passenger car ever at the same height during its rotation? How do you know?
Yes, the heights keep repeating each time the wheel rotates. They are also the same height when the
car is going up and when it is coming down. For example, at one-fourth and three-fourths of a rotation,
the car will be the same height above the ground.
Where did you choose to start your car and why?
We started it at the bottom of the wheel because that is where you get on a Ferris wheel.
Do you think the height is changing in a linear fashion? Why or why not?
No. When we are at one-fourth of a rotation, the height is half of the wheel’s diameter. When we are
at three-eighths of a rotation, the height is NOT three-fourths of the wheel’s diameter. Therefore, there
is no proportional relationship between height and amount of rotation.
What patterns did you notice in the way the height of the passenger car was changing?
The height of the car keeps repeating each time the wheel rotates. Pick any point on the wheel, and the
car will return to that height after a rotation.
How does the range of the graph of the Ferris wheel height function relate to the physical features of the
wheel?
The range is the distance between the maximum and minimum height, and it will always be the
diameter of the wheel.
MP.2 MP.4
& MP.6
Lesson 1: Ferris Wheels—Tracking the Height of a Passenger Car Date: 8/18/14
16
© 2014 Common Core, Inc. Some rights reserved. commoncore.org This work is licensed under a Creative Commons Attribution-NonCommercial-ShareAlike 3.0 Unported License.
NYS COMMON CORE MATHEMATICS CURRICULUM M2 Lesson 1 ALGEBRA II
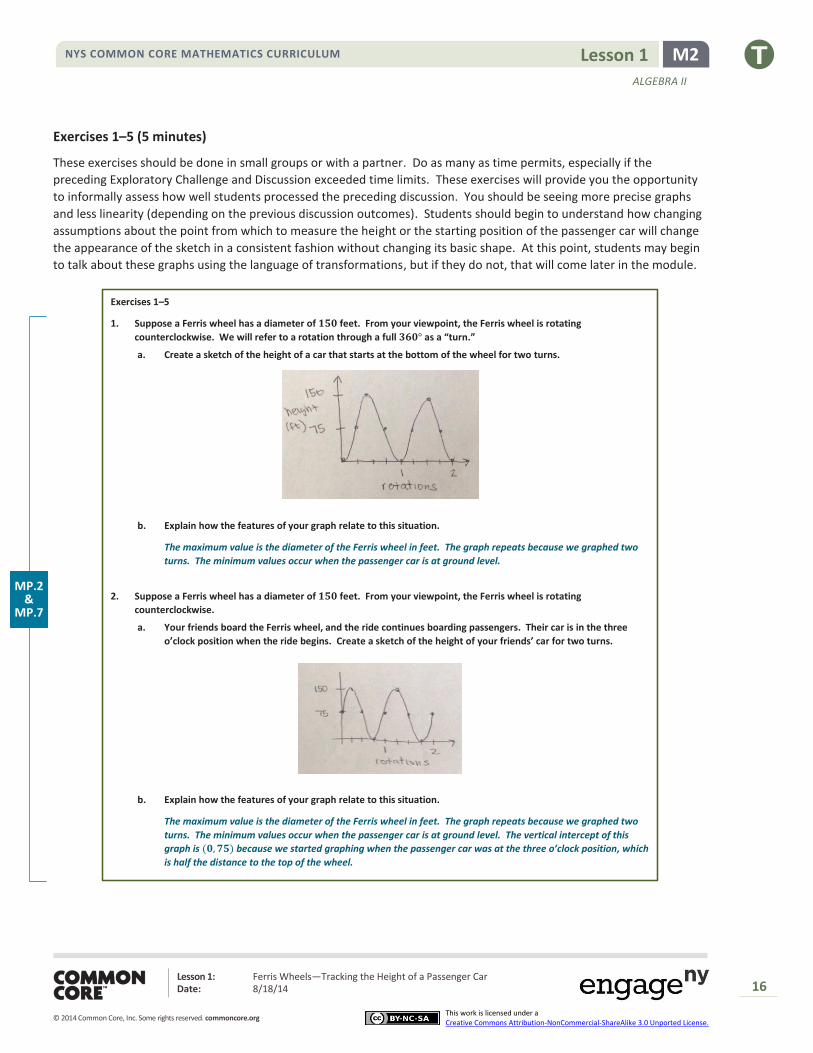
Exercises 1–5 (5 minutes)
These exercises should be done in small groups or with a partner. Do as many as time permits, especially if the
preceding Exploratory Challenge and Discussion exceeded time limits. These exercises will provide you the opportunity
to informally assess how well students processed the preceding discussion. You should be seeing more precise graphs
and less linearity (depending on the previous discussion outcomes). Students should begin to understand how changing
assumptions about the point from which to measure the height or the starting position of the passenger car will change
the appearance of the sketch in a consistent fashion without changing its basic shape. At this point, students may begin
to talk about these graphs using the language of transformations, but if they do not, that will come later in the module.
Exercises 1–5
1. Suppose a Ferris wheel has a diameter of feet. From your viewpoint, the Ferris wheel is rotating
counterclockwise. We will refer to a rotation through a full as a “turn.”
a. Create a sketch of the height of a car that starts at the bottom of the wheel for two turns.
b. Explain how the features of your graph relate to this situation.
The maximum value is the diameter of the Ferris wheel in feet. The graph repeats because we graphed two
turns. The minimum values occur when the passenger car is at ground level.
2. Suppose a Ferris wheel has a diameter of feet. From your viewpoint, the Ferris wheel is rotating
counterclockwise.
a. Your friends board the Ferris wheel, and the ride continues boarding passengers. Their car is in the three
o’clock position when the ride begins. Create a sketch of the height of your friends’ car for two turns.
b. Explain how the features of your graph relate to this situation.
The maximum value is the diameter of the Ferris wheel in feet. The graph repeats because we graphed two
turns. The minimum values occur when the passenger car is at ground level. The vertical intercept of this
graph is because we started graphing when the passenger car was at the three o’clock position, which
is half the distance to the top of the wheel.
MP.2 &
MP.7

Lesson 1: Ferris Wheels—Tracking the Height of a Passenger Car Date: 8/18/14
17
© 2014 Common Core, Inc. Some rights reserved. commoncore.org This work is licensed under a Creative Commons Attribution-NonCommercial-ShareAlike 3.0 Unported License.
NYS COMMON CORE MATHEMATICS CURRICULUM M2 Lesson 1 ALGEBRA II
3. How would your sketch change if the diameter of the wheel changed?
The maximum and minimum heights would change. The distance between the maximum and minimum heights is
the diameter of the wheel. The sketch would be a vertical stretch or a shrinking of the original sketch, depending on
whether or not the diameter was respectively larger or smaller than feet.
4. If you translated the sketch of your graph down by the radius of the wheel, what would the -axis represent in this
situation?
The -axis would represent a line through the center of the Ferris wheel that is parallel to the ground.
5. How could we create a more precise sketch?
We could measure the height at smaller and smaller amounts of rotation.
As groups are working, circulate around the room offering tips, suggestions, and gentle corrections if needed. After
students have completed these exercises, invite one or two volunteers to come to the board and share their responses
with the class. Before moving on, make sure to include a transition statement that relates to Exercise 5 and that reminds
students of the goals of this lesson. For example,
If we want to create a more accurate graph of the height of a car, then we must measure the height at
additional points around the wheel.
The height of a passenger car is changing in a predictable way as the wheel rotates. Even if we start tracking
additional positions of the car on the wheel or change the diameter of the wheel, the graph of this function
has a consistent shape and pattern.
Exploratory Challenge 2 (15 minutes): The Paper Plate Model
Introduce this section by reminding students that a physical model and
appropriate tools can help them create a more precise graph. This
section of the lesson focuses students specifically on making sense and
persevering (MP.1), using appropriate tools strategically (MP.5) and
attending to precision (MP.6).
Give each group a paper plate, a sheet of card stock or construction
paper, and a metal brad fastener. Have them affix the paper plate to the
sheet of card stock with a brad located at the center of the plate. You
can turn the paper plate counterclockwise to model the motion of the
Ferris wheel. To create a more accurate graph of the height function,
students will place marks on the edge of the plate to represent a
passenger car every around the circle. Then, they will measure the
height above the ground at every for one complete turn, starting
with the car in the o’clock position.
To be consistent with the definition of the sine function that will appear
in later lessons, we have assigned of rotation to the o’clock position
of the car. You can informally define rotations greater than for
students. Most students are familiar with extreme sports such as
skateboarding or snowboarding and are comfortable referring to one
complete turn as a “ .” You can also explain that a rotation is
Scaffolding:
You may choose to keep this exploration even more open and just give students the materials, tools, and a sheet of graph paper with the directions to create a more accurate graph of the Ferris wheel height, and then offer suggestions and support as you circulate among the groups, or you can have them work using the supports provided in the student materials.
As an alternative to using a protractor to measure the rotation on the paper plate, students can use a compass to create a circle on a piece of paper and construct arcs along its circumference. One method to create these arcs would be to section the circle into arcs and then bisect the corresponding central angles into and then angles.
Help students who struggle with measuring using a ruler and protractor by modeling a few measurements and table entries on a document camera or the board.
Lesson 1: Ferris Wheels—Tracking the Height of a Passenger Car Date: 8/18/14
18
© 2014 Common Core, Inc. Some rights reserved. commoncore.org This work is licensed under a Creative Commons Attribution-NonCommercial-ShareAlike 3.0 Unported License.
NYS COMMON CORE MATHEMATICS CURRICULUM M2 Lesson 1 ALGEBRA II
simply a rotation followed by a rotation. Similarly, any rotation between and is simply the sequence
of a rotation followed by a rotation between and . Have students record their measurements in the table
below on the student pages, and then create a graph of the ordered pairs in the table.
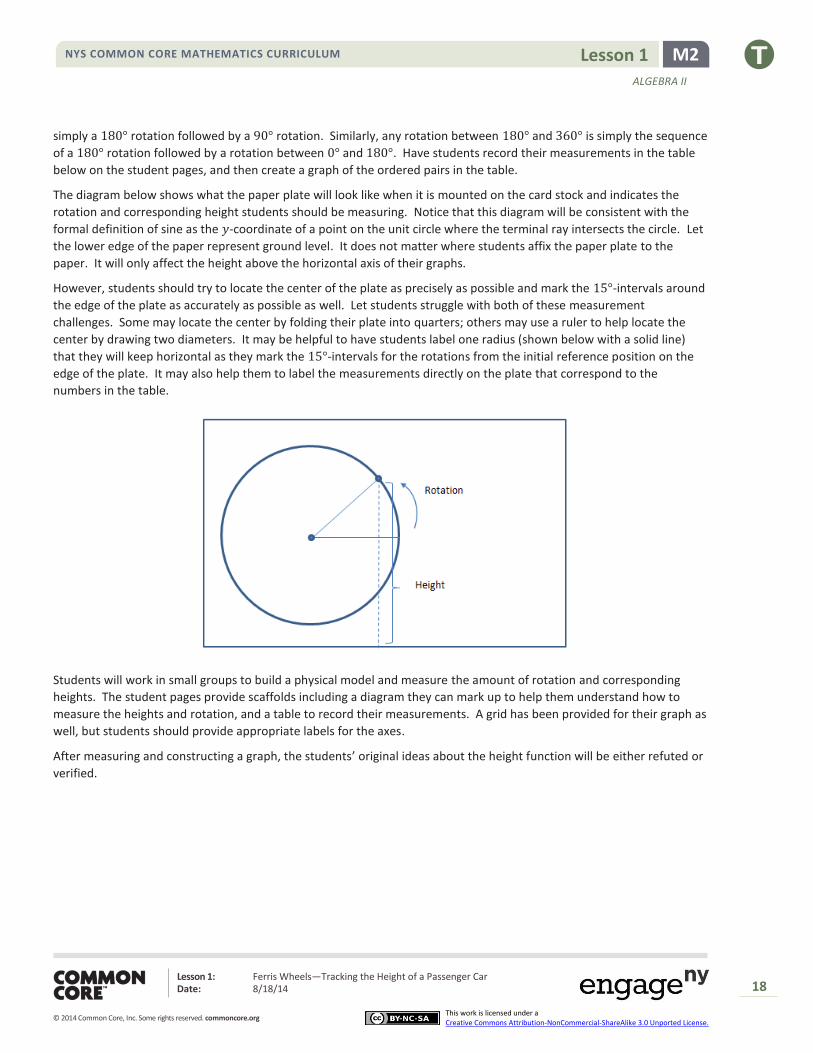
The diagram below shows what the paper plate will look like when it is mounted on the card stock and indicates the
rotation and corresponding height students should be measuring. Notice that this diagram will be consistent with the
formal definition of sine as the -coordinate of a point on the unit circle where the terminal ray intersects the circle. Let
the lower edge of the paper represent ground level. It does not matter where students affix the paper plate to the
paper. It will only affect the height above the horizontal axis of their graphs.
However, students should try to locate the center of the plate as precisely as possible and mark the -intervals around
the edge of the plate as accurately as possible as well. Let students struggle with both of these measurement
challenges. Some may locate the center by folding their plate into quarters; others may use a ruler to help locate the
center by drawing two diameters. It may be helpful to have students label one radius (shown below with a solid line)
that they will keep horizontal as they mark the -intervals for the rotations from the initial reference position on the
edge of the plate. It may also help them to label the measurements directly on the plate that correspond to the
numbers in the table.
Students will work in small groups to build a physical model and measure the amount of rotation and corresponding
heights. The student pages provide scaffolds including a diagram they can mark up to help them understand how to
measure the heights and rotation, and a table to record their measurements. A grid has been provided for their graph as
well, but students should provide appropriate labels for the axes.
After measuring and constructing a graph, the students’ original ideas about the height function will be either refuted or
verified.
Lesson 1: Ferris Wheels—Tracking the Height of a Passenger Car Date: 8/18/14
19
© 2014 Common Core, Inc. Some rights reserved. commoncore.org This work is licensed under a Creative Commons Attribution-NonCommercial-ShareAlike 3.0 Unported License.
NYS COMMON CORE MATHEMATICS CURRICULUM M2 Lesson 1 ALGEBRA II
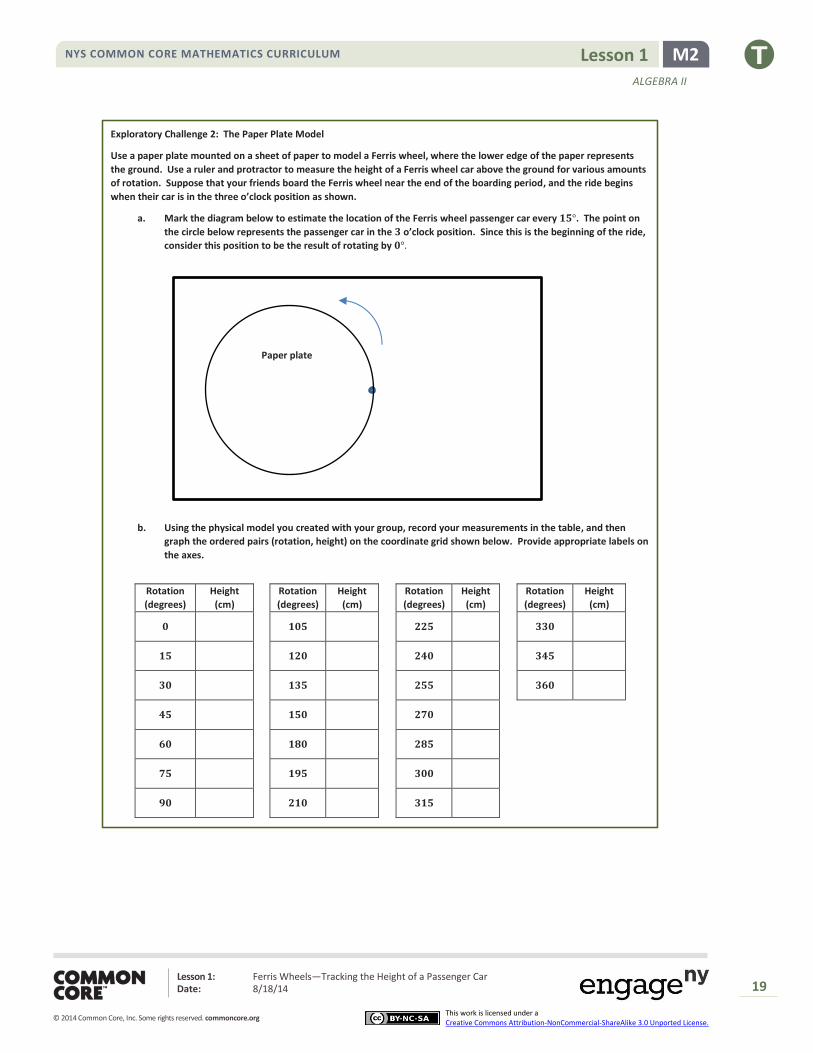
Exploratory Challenge 2: The Paper Plate Model
Use a paper plate mounted on a sheet of paper to model a Ferris wheel, where the lower edge of the paper represents
the ground. Use a ruler and protractor to measure the height of a Ferris wheel car above the ground for various amounts
of rotation. Suppose that your friends board the Ferris wheel near the end of the boarding period, and the ride begins
when their car is in the three o’clock position as shown.
a. Mark the diagram below to estimate the location of the Ferris wheel passenger car every . The point on
the circle below represents the passenger car in the o’clock position. Since this is the beginning of the ride,
consider this position to be the result of rotating by
b. Using the physical model you created with your group, record your measurements in the table, and then
graph the ordered pairs (rotation, height) on the coordinate grid shown below. Provide appropriate labels on
the axes.
Rotation
(degrees)
Height
(cm)
Rotation
(degrees)
Height
(cm)
Rotation
(degrees)
Height
(cm)
Rotation
(degrees)
Height
(cm)
Paper plate

Lesson 1: Ferris Wheels—Tracking the Height of a Passenger Car Date: 8/18/14
20
© 2014 Common Core, Inc. Some rights reserved. commoncore.org This work is licensed under a Creative Commons Attribution-NonCommercial-ShareAlike 3.0 Unported License.
NYS COMMON CORE MATHEMATICS CURRICULUM M2 Lesson 1 ALGEBRA II
c. Explain how the features of your graph relate to the paper plate model you created.
The domain values represent the rotation measured in degrees of a car on the Ferris wheel from the o’clock
position for one turn of a passenger car. The range values represent the height of the car above the ground
which we modeled using the bottom edge of the paper. The vertical distance between the maximum and
minimum values is the diameter of the paper plate measured in cm.
Display several graphs and discuss their similarities and differences. You can discuss the challenges in this lesson to use
tools strategically and attend to precision when measuring. You can also address any differences in the maximum and
minimum values of the students’ graphs. Make sure you connect these differences back to the location of the center of
the circle above the bottom edge of the paper.
Encourage quantitative reasoning by asking students to relate features of the graph back to the rotating Ferris wheel.
These questions can guide that discussion.
How can you identify the diameter of the Ferris wheel from your graph?
It is the vertical distance between the highest and lowest points on the graph.
If the paper plate model was scaled so that cm on the plate represented ft. on a real Ferris wheel, what is
the diameter of the wheel?
Answers will vary depending on plate size, but they should be times the actual diameter. So, a plate
with a cm diameter would represent a ft. diameter Ferris wheel.
How high above the ground is the lowest point on the Ferris wheel?
Answers will vary but should correspond to the second coordinate of the minimum point on the graph.
Why isn’t the diameter of the Ferris wheel the same as the maximum value on your graph? (Note that some
students might have actually placed their plate so that it touches the lower edge of the paper, in which case
this question does not apply.)
It is not the same because we positioned the bottom of our paper plate model above the edge of the
paper which represented ground level, a height of ft.
Height as a function of degrees of rotation
MP.2

Lesson 1: Ferris Wheels—Tracking the Height of a Passenger Car Date: 8/18/14
21
© 2014 Common Core, Inc. Some rights reserved. commoncore.org This work is licensed under a Creative Commons Attribution-NonCommercial-ShareAlike 3.0 Unported License.
NYS COMMON CORE MATHEMATICS CURRICULUM M2 Lesson 1 ALGEBRA II
Closing (3 minutes)
Share the definition of a periodic function to bring closure to this lesson. A formal definition appears below. You may
wish to share a more student-friendly version with your classes. Using a vocabulary organizer like a Frayer diagram will
help students make sense of this important vocabulary word and encourage students to rephrase the meaning in their
own words, provide examples and non-examples, and create a visual representation of the word. Periodicity is one of
the fundamental ideas of this module, so revisit the term ‘periodic function’ often and include it on a vocabulary word
wall.
PERIODIC FUNCTION. A function whose domain is a subset of the real numbers is said to be periodic with period
if the domain of contains whenever it contains , and if for all real numbers
in its domain. If a least positive number exists that satisfies this equation, it is called the fundamental period,
or if the context is clear, just the period of the function.
Discuss how the height of a rotating Ferris wheel can be represented by a periodic function if we extend the domain to
represent multiple turns. Ask students to identify the fundamental period of the height function of the Ferris wheel.
Remind students that for any point on the Ferris wheel, the passenger car will return to that same height after one full
turn of so if we measure rotation in degrees, the fundamental period of the height function is . If we measure
rotation as fractions of a turn, the fundamental period of the height function is .
Have students respond to the following questions in writing or with a partner.
Closing
How does a function like the one that represents the height of a passenger car on a Ferris wheel differ from
other types of functions you have studied such as linear, polynomial, and exponential functions?
What is the domain of your Ferris wheel height function? What is the range?
Provide a definition of periodic function in your own words. Why is the Ferris wheel height function an
example of a periodic function?
What other situations might be modeled by a periodic function?
Exit Ticket (4 minutes)
Lesson 1: Ferris Wheels—Tracking the Height of a Passenger Car Date: 8/18/14
22
© 2014 Common Core, Inc. Some rights reserved. commoncore.org This work is licensed under a Creative Commons Attribution-NonCommercial-ShareAlike 3.0 Unported License.
NYS COMMON CORE MATHEMATICS CURRICULUM M2 Lesson 1 ALGEBRA II
Name Date
Lesson 1: Ferris Wheels—Tracking the Height of a Passenger Car
Exit Ticket
1. Create a graph of a function that represents the height above the ground of the passenger car for a -foot
diameter Ferris wheel that completes three turns. Assume passengers board at the bottom of the wheel, which is
feet above the ground, and that the ride begins immediately afterward. Provide appropriate labels on the axes.
2. Explain how the features of your graph relate to this situation.
Lesson 1: Ferris Wheels—Tracking the Height of a Passenger Car Date: 8/18/14
23
© 2014 Common Core, Inc. Some rights reserved. commoncore.org This work is licensed under a Creative Commons Attribution-NonCommercial-ShareAlike 3.0 Unported License.
NYS COMMON CORE MATHEMATICS CURRICULUM M2 Lesson 1 ALGEBRA II
Exit Ticket Sample Solutions
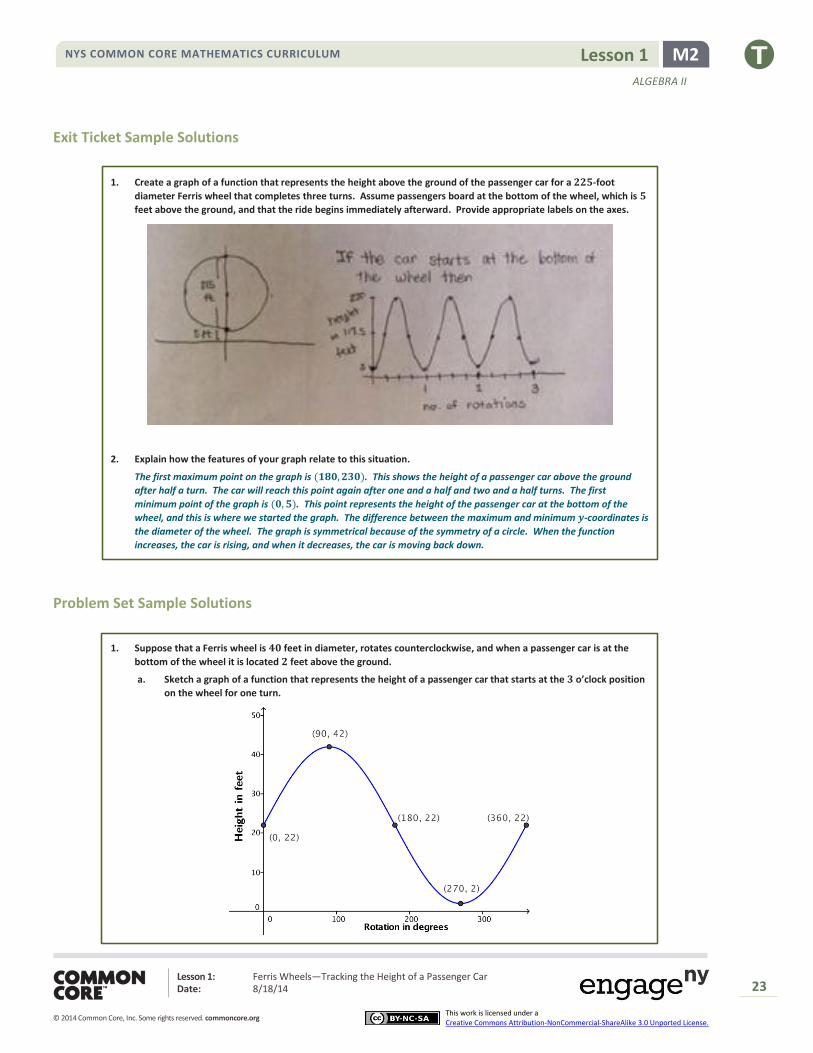
1. Create a graph of a function that represents the height above the ground of the passenger car for a -foot
diameter Ferris wheel that completes three turns. Assume passengers board at the bottom of the wheel, which is
feet above the ground, and that the ride begins immediately afterward. Provide appropriate labels on the axes.
2. Explain how the features of your graph relate to this situation.
The first maximum point on the graph is . This shows the height of a passenger car above the ground
after half a turn. The car will reach this point again after one and a half and two and a half turns. The first
minimum point of the graph is . This point represents the height of the passenger car at the bottom of the
wheel, and this is where we started the graph. The difference between the maximum and minimum -coordinates is
the diameter of the wheel. The graph is symmetrical because of the symmetry of a circle. When the function
increases, the car is rising, and when it decreases, the car is moving back down.
Problem Set Sample Solutions
1. Suppose that a Ferris wheel is feet in diameter, rotates counterclockwise, and when a passenger car is at the
bottom of the wheel it is located feet above the ground.
a. Sketch a graph of a function that represents the height of a passenger car that starts at the o’clock position
on the wheel for one turn.

Lesson 1: Ferris Wheels—Tracking the Height of a Passenger Car Date: 8/18/14
24
© 2014 Common Core, Inc. Some rights reserved. commoncore.org This work is licensed under a Creative Commons Attribution-NonCommercial-ShareAlike 3.0 Unported License.
NYS COMMON CORE MATHEMATICS CURRICULUM M2 Lesson 1 ALGEBRA II
b. Sketch a graph of a function that represents the height of a passenger car that starts at the top of the wheel
for one turn.
c. The sketch you created in part (a) represents a graph of a function. What is the domain of the function?
What is the range?
The domain is . The range is .
d. The sketch you created in part (b) represents a graph of a function. What is the domain of the function?
What is the range?
The domain is . The range is .
e. Describe how the graph of the function in part (a) would change if you sketched the graph for two turns.
The graph would repeat itself over another interval of degrees. It would appear as if we attached a
horizontal translation of the graph to the right end of the original graph.
f. Describe how the function in part (a) and its graph would change if the Ferris wheel had a diameter of
feet.
The function’s range would change to , and the graph’s maximum value would be instead of .
The domain would stay the same, and the -coordinates where the maximum and minimum values occurred
would not change.
2. A small pebble is lodged in the tread of a tire with radius cm. Sketch the height of the pebble above the ground
as the tire rotates counterclockwise through turns. Start your graph when the pebble is at the o’clock position.

Lesson 1: Ferris Wheels—Tracking the Height of a Passenger Car Date: 8/18/14
25
© 2014 Common Core, Inc. Some rights reserved. commoncore.org This work is licensed under a Creative Commons Attribution-NonCommercial-ShareAlike 3.0 Unported License.
NYS COMMON CORE MATHEMATICS CURRICULUM M2 Lesson 1 ALGEBRA II
3. The graph you created in Exercise 2 represents a function.
a. Describe how the function and its graph would change if the tire’s radius was 24 inches instead of 25 cm.
The highest -value on the graph would be inches instead of centimeters. The function’s range would
change to .
b. Describe how the function and its graph would change if the wheel was turning in the opposite direction.
The graph would increase to a height of cm after
of a turn and then decrease to a height of after
of a
turn. While the domain and range of the function would remain the same, the actual correspondence
between rotations and height would change since the direction of rotation is different.
c. Describe how the function and its graph would change if we started the graph when the pebble was at
ground level.
Assuming a counterclockwise rotation, a rotation of would be paired with a height of , then after
of a
turn, the height would be cm. The domain and range of the function would not change, but the
coordinates of the intercepts and maximum and minimum points would change.
4. Justice believes that the height of a Ferris wheel passenger car is best modeled with a piecewise linear function.
Make a convincing argument why a piecewise linear function IS NOT a good model for the height of a car on a
rotating Ferris wheel.
When we measured the height for every of rotation, the height was changing more rapidly at the far left and
right positions of the wheel and more slowly near the top and bottom of the wheel. Equal increments of rotation did
not result in a constant change in the height. If the function was piecewise linear, then equal changes in the rotation
should have corresponded to equal changes in height in places.