Embed Size (px)
Citation preview

Lesson 1: Integer Sequences—Should You Believe in Patterns? Date: 9/11/13
© 2013 Common Core, Inc. Some rights reserved. commoncore.org This work is licensed under a Creative Commons Attribution-NonCommercial-ShareAlike 3.0 Unported License.
NYS COMMON CORE MATHEMATICS CURRICULUM M3 Lesson 1 ALGEBRA I
Name ___________________________________________________ Date____________________
Lesson 1: Integer Sequences—Should You Believe in Patterns?
Exit Ticket
1. Consider the sequence given by a “plus 8” pattern: 2, 10, 18, 26, …. Shae says that the formula for the sequence is𝑓(𝑛) = 8𝑛 + 2. Marcus tells Shae that she is wrong because the formula for the sequence is 𝑓(𝑛) = 8𝑛 − 6.
a. Which formula generates the sequence by starting at 𝑛 = 1? At 𝑛 = 0?
b. Find the 100th term in the sequence.
2. Write a formula for the sequence of cube numbers: 1, 8, 27, 64, ….

Lesson 2: Recursive Formulas for Sequences Date: 9/11/13
© 2013 Common Core, Inc. Some rights reserved. commoncore.org This work is licensed under a Creative Commons Attribution-NonCommercial-ShareAlike 3.0 Unported License.
NYS COMMON CORE MATHEMATICS CURRICULUM M3 Lesson 2 ALGEBRA I
Name ___________________________________________________ Date____________________
Lesson 2: Recursive Formulas for Sequences
Exit Ticket
1. Consider the sequence following a “minus 8” pattern: 9, 1,−7,−15, ….
a. Write an explicit formula for the sequence.
b. Write a recursive formula for the sequence.
c. Find the 38th term of the sequence.
2. Consider the sequence given by the formula 𝑎(𝑛 + 1) = 5𝑎(𝑛) and 𝑎(1) = 2 for 𝑛 ≥ 1.
a. Explain what the formula means.
b. List the first 5 terms of the sequence.

Lesson 3: Arithmetic and Geometric Sequences Date: 9/11/13
© 2013 Common Core, Inc. Some rights reserved. commoncore.org This work is licensed under a Creative Commons Attribution-NonCommercial-ShareAlike 3.0 Unported License.
NYS COMMON CORE MATHEMATICS CURRICULUM M3 Lesson 3 ALGEBRA I
Name ___________________________________________________ Date____________________
Lesson 3: Arithmetic and Geometric Sequences
Exit Ticket
1. Write the first 3 terms in the following sequences. Identify them as arithmetic or geometric.
a. 𝐴(𝑛 + 1) = 𝐴(𝑛) − 5 for 𝑛 ≥ 1 and 𝐴(1) = 9.
b. 𝐴(𝑛 + 1) = 12𝐴(𝑛) for 𝑛 ≥ 1 and 𝐴(1) = 4.
c. 𝐴(𝑛 + 1) = 𝐴(𝑛) ÷ 10 for 𝑛 ≥ 1 and 𝐴(1) = 10.
2. Identify each sequence as arithmetic or geometric. Explain your answer, and write an explicit formula for thesequence.
a. 14, 11, 8, 5, …
b. 2, 10, 50, 250, …
c. −12
,−32
,−52
,−72, …

Lesson 4: Why do Banks Pay YOU to Provide Their Services? Date: 9/11/13
© 2013 Common Core, Inc. Some rights reserved. commoncore.org This work is licensed under a Creative Commons Attribution-NonCommercial-ShareAlike 3.0 Unported License.
NYS COMMON CORE MATHEMATICS CURRICULUM M3 Lesson 4 ALGEBRA I
Name ___________________________________________________ Date____________________
Lesson 4: Why do Banks Pay YOU to Provide Their Services?
Exit Ticket
A youth group has a yard sale to raise money for a charity. The group earns $800 but decided to put its money in the bank for a while. Calculate the amount of money the group will have if:
a. Cool Bank pays simple interest at a rate of 4% and the youth group leaves the money in for 3 years.
b. Hot Bank pays compound interest at a rate of 3% and the youth group leaves the money in for 5 years.
c. If the youth group needs the money quickly, which is the better choice? Why?

Lesson 5: The Power of Exponential Growth Date: 9/11/13
© 2013 Common Core, Inc. Some rights reserved. commoncore.org This work is licensed under a Creative Commons Attribution-NonCommercial-ShareAlike 3.0 Unported License.
NYS COMMON CORE MATHEMATICS CURRICULUM M3 Lesson 5 ALGEBRA I
Name ___________________________________________________ Date____________________
Lesson 5: The Power of Exponential Growth
Exit Ticket
Chain emails are emails with a message suggesting you will have good luck if you forward the email on to others. Suppose a student started a chain email by sending the message to 3 friends and asking those friends to each send the same email to 3 more friends exactly 1 day after they received it.
a. Write an explicit formula for the sequence that models the number of people who will receive the email on the𝑛𝑛𝑡ℎ day. (Let the first day be the day the original email was sent.) Assume everyone who receives the emailfollows the directions.
b. Which day will be the first day that the number of people receiving the email exceeds 100?

Lesson 6: Exponential Growth—U.S. Population and World Population Date: 9/11/13
© 2013 Common Core, Inc. Some rights reserved. commoncore.org This work is licensed under a Creative Commons Attribution-NonCommercial-ShareAlike 3.0 Unported License.
NYS COMMON CORE MATHEMATICS CURRICULUM M3 Lesson 6 ALGEBRA I
Name ___________________________________________________ Date____________________
Lesson 6: Exponential Growth—U.S. Population and World
Population
Exit Ticket
Do the examples below require a linear or exponential growth model? State whether each example is linear or exponential, and write an explicit formula for the sequence that models the growth for each case. Include a description of the variables you use.
1. A savings account accumulates no interest but receives a deposit of $825 per month.
2. The value of a house increases by 1.5% per year.
3. Every year, the alligator population is 97
of the previous year’s population.
4. The temperature increases by 2° every 30 minutes from 8: 00 a.m. to 3: 30 p.m. each day for the month of July.
5. Every 240 minutes, 13
of the rodent population dies.

Lesson 7: Exponential Decay Date: 9/11/13
© 2013 Common Core, Inc. Some rights reserved. commoncore.org This work is licensed under a Creative Commons Attribution-NonCommercial-ShareAlike 3.0 Unported License.
NYS COMMON CORE MATHEMATICS CURRICULUM M3 Lesson 7 ALGEBRA I
Name ___________________________________________________ Date____________________
Lesson 7: Exponential Decay
Exit Ticket
A huge ping-pong tournament is held in Beijing, with 65,536 participants at the start of the tournament. Each round of the tournament eliminates half the participants.
a. If 𝑝(𝑟) represents the number of participants remaining after 𝑟 rounds of play, write a formula to model thenumber of participants remaining.
b. Use your model to determine how many participants remain after 10 rounds of play.
c. How many rounds of play will it take to determine the champion ping-pong player?

Lesson 8: Why Stay With Whole Numbers? Date: 9/11/13
© 2013 Common Core, Inc. Some rights reserved. commoncore.org This work is licensed under a Creative Commons Attribution-NonCommercial-ShareAlike 3.0 Unported License.
NYS COMMON CORE MATHEMATICS CURRICULUM M3 Lesson 8 ALGEBRA I
Name ___________________________________________________ Date____________________
Lesson 8: Why Stay With Whole Numbers?
Exit Ticket
Recall that an odd number is a number that is one more than or one less than twice an integer. Consider the sequence formed by the odd numbers {1,3,5,7, … }.
1. Find a formula for 0(𝑛), the 𝑛th odd number starting with 𝑛 = 1?
2. Write a convincing argument that 121 is an odd number.
3. What is the meaning of 0(17)?

Lesson 9: Representing, Naming, and Evaluating Functions Date: 9/11/13
© 2013 Common Core, Inc. Some rights reserved. commoncore.org This work is licensed under a Creative Commons Attribution-NonCommercial-ShareAlike 3.0 Unported License.
NYS COMMON CORE MATHEMATICS CURRICULUM M3 Lesson 9 ALGEBRA I
Name ___________________________________________________ Date____________________
Lesson 9: Representing, Naming, and Evaluating Functions
Exit Ticket
1. Given 𝑓 as described below.𝑓: {𝑤ℎ𝑜𝑙𝑒 𝑛𝑢𝑚𝑏𝑒𝑟𝑠} → {𝑤ℎ𝑜𝑙𝑒 𝑛𝑢𝑚𝑏𝑒𝑟𝑠}
𝐴𝑠𝑠𝑖𝑔𝑛 𝑒𝑎𝑐ℎ 𝑤ℎ𝑜𝑙𝑒 𝑛𝑢𝑚𝑏𝑒𝑟 𝑡𝑜 𝑖𝑡𝑠 𝑙𝑎𝑟𝑔𝑒𝑠𝑡 𝑝𝑙𝑎𝑐𝑒 𝑣𝑎𝑙𝑢𝑒 𝑑𝑖𝑔𝑖𝑡.
For example, 𝑓(4) = 4, 𝑓(14) = 4, and 𝑓(194) = 9.
a. What is the domain and range of 𝑓?
b. What is 𝑓(257)?
c. What is 𝑓(0)?
d. What is 𝑓(999)?
e. Find a value of 𝑥 that makes the equation 𝑓(𝑥) = 7 a true statement.
2. Is the correspondence described below a function? Explain your reasoning.𝑀: {𝑤𝑜𝑚𝑒𝑛} → {𝑝𝑒𝑜𝑝𝑙𝑒}
𝐴𝑠𝑠𝑖𝑔𝑛 𝑒𝑎𝑐ℎ 𝑤𝑜𝑚𝑎𝑛 𝑡ℎ𝑒𝑖𝑟 𝑐ℎ𝑖𝑙𝑑.

Lesson 10: Representing, Naming, and Evaluating Functions Date: 9/11/13
© 2013 Common Core, Inc. Some rights reserved. commoncore.org This work is licensed under a Creative Commons Attribution-NonCommercial-ShareAlike 3.0 Unported License.
NYS COMMON CORE MATHEMATICS CURRICULUM M3 Lesson 10 ALGEBRA I
Name ___________________________________________________ Date____________________
Lesson 10: Representing, Naming, and Evaluating Functions
Exit Ticket
1. Let 𝑓𝑓(𝑥) = 4(3)𝑥. Complete the table shown below.
𝑥 −1 0 1 2 3
𝑓𝑓(𝑥)
2. Jenna knits scarves and then sells them on Etsy, an online marketplace. Let 𝐶(𝑥) = 4𝑥 + 20 represent the cost 𝐶 indollars to produce from 0 to 6 scarves.
a. Create a table to show the relationship between the number of scarves 𝑥 and the cost 𝐶.
b. What are the domain and range of 𝐶?
c. What is the meaning of 𝐶(3)?
d. What is the meaning of the solution to the equation 𝐶(𝑥) = 40?

Lesson 11: The Graph of a Function Date: 9/11/13
© 2013 Common Core, Inc. Some rights reserved. commoncore.org This work is licensed under a Creative Commons Attribution-NonCommercial-ShareAlike 3.0 Unported License.
NYS COMMON CORE MATHEMATICS CURRICULUM M3 Lesson 11 ALGEBRA I
Name ___________________________________________________ Date____________________
Lesson 11: The Graph of a Function
Exit Ticket
1. Perform the instructions for the following programming code as if you were a computer and your paper was thecomputer screen.
Declare 𝒙𝒙 integer Let 𝒇(𝒙𝒙) = 𝟐𝒙𝒙 + 𝟏 Initialize 𝑮 as {} For all 𝒙𝒙 from −3 to 2
Append (𝒙𝒙,𝒇(𝒙𝒙) ) to 𝑮 Next 𝒙𝒙 Plot 𝑮
2. Write three or four sentences describing in words how the thought code works.

Lesson 12: The Graph of the Equation 𝑦 = 𝑓(𝑥) Date: 9/11/13
© 2013 Common Core, Inc. Some rights reserved. commoncore.org This work is licensed under a Creative Commons Attribution-NonCommercial-ShareAlike 3.0 Unported License.
NYS COMMON CORE MATHEMATICS CURRICULUM M3 Lesson 12 ALGEBRA I
Name ___________________________________________________ Date____________________
Lesson 12: The Graph of the Equation 𝒚 = 𝒇(𝒙)
Exit Ticket
1. Perform the instructions in the following programming code as if you were a computer and your paper was thecomputer screen:
Declare 𝒙 integer For all 𝒙 from 2 to 7
If 𝒙 + 𝟐 = 𝟕 then Print True
else Print False
Endif Next 𝒙
2. Let 𝑓(𝑥) = − 12 𝑥 + 2 for 𝑥 in the domain 0 ≤ 𝑥 ≤ 2.
a. Write out in words the meaning of the set notation:{(𝑥,𝑦) | 0 ≤ 𝑥 ≤ 2 and 𝑦 = 𝑓(𝑥)}.
b. Sketch the graph of 𝑦 = 𝑓(𝑥).

Lesson 13: Interpreting Graphs of Functions Date: 9/11/13
© 2013 Common Core, Inc. Some rights reserved. commoncore.org This work is licensed under a Creative Commons Attribution-NonCommercial-ShareAlike 3.0 Unported License.
NYS COMMON CORE MATHEMATICS CURRICULUM M3 Lesson 13 ALGEBRA I
Name ___________________________________________________ Date____________________
Lesson 13: Interpreting Graphs of Functions
Exit Ticket
1. Estimate the time intervals when mean energy use is decreasing on an average summer day. Why would powerusage be decreasing during those time intervals?
Power Usage on a Typical Summer Day in Ontario, Canada
Source: National Resource Council Canada, 2011
2. The hot summer day energy use changes from decreasing to increasing and from increasing to decreasing morefrequently than it does on an average summer day. Why do you think this occurs?
Lesson 14: Linear and Exponential Models—Comparing Growth Rates Date: 9/11/13
© 2013 Common Core, Inc. Some rights reserved. commoncore.org This work is licensed under a Creative Commons Attribution-NonCommercial-ShareAlike 3.0 Unported License.
NYS COMMON CORE MATHEMATICS CURRICULUM M3 Lesson 14 ALGEBRA I
Name ___________________________________________________ Date____________________
Lesson 14: Linear and Exponential Models—Comparing Growth
Rates
Exit Ticket
A big company settles its new headquarters in a small city. The city council plans road construction based on traffic increasing at a linear rate, but based on the company’s massive expansion, traffic is really increasing exponentially.
What will be the repercussions of the city council’s current plans? Include what you know about linear and exponential growth in your discussion.

M3 Mid-Module Assessment Task NYS COMMON CORE MATHEMATICS CURRICULUM
ALGEBRA I
Name Date
1. The diagram below shows how tables and chairs are arranged in the school cafeteria. One table can seat 4people, and tables can be pushed together. When two tables are pushed together, 6 people can sitaround the table.
1 Table 2 Tables 3 Tables
a. Complete this table to show the relationship between the number of tables, 𝑛, and the number ofstudents, 𝑆, that can be seated around the table.
𝑛 (tables)
𝑆 (students )
b. If we made a sequence where the first term of the sequence was the number of students that can fitat 1 table, the 2nd term where the number that could fit at 2 tables, etc, would the sequence bearithmetic, geometric, or neither? Explain your reasoning.
c. Create an explicit formula for a sequence that models this situation. Use 𝑛 = 1 as the first term,representing how many students can sit at 1 table. How do the constants in your formula relate tothe situation?
d. Using this seating arrangement, how many students could fit around 15 tables pushed together in arow?
Module 3: Linear and Exponential Functions Date: 9/11/13
© 2013 Common Core, Inc. Some rights reserved. commoncore.org This work is licensed under a Creative Commons Attribution-NonCommercial-ShareAlike 3.0 Unported License.

M3 Mid-Module Assessment Task NYS COMMON CORE MATHEMATICS CURRICULUM
ALGEBRA I
The cafeteria needs to provide seating for 189 students. They can fit up to 15 rows of tables in the cafeteria. Each row can contain at most 9 tables but could contain less than that. The tables on each row must be pushed together. Students will still be seated around the tables as described earlier.
e. If they use exactly 9 tables pushed together to make each row, how many rows will they need toseat 189 students, and how many tables will they have used to make those rows?
f. Is it possible to seat the 189 students with fewer total tables? If so, what is the fewest number oftables needed? How many tables would be used in each row? (Remember that the tables on eachrow must be pushed together.) Explain your thinking.
Module 3: Linear and Exponential Functions Date: 9/11/13
© 2013 Common Core, Inc. Some rights reserved. commoncore.org This work is licensed under a Creative Commons Attribution-NonCommercial-ShareAlike 3.0 Unported License.

M3 Mid-Module Assessment Task NYS COMMON CORE MATHEMATICS CURRICULUM
ALGEBRA I
2. Sydney was studying the following functions:
𝑓(𝑥) = 2𝑥 + 4 and 𝑔(𝑥) = 2(2𝑥) + 4
She said that linear functions and exponential functions are basically the same. She made her statement based on plotting points at 𝑥 = 0 and 𝑥 = 1 and graphing the functions.
Help Sydney understand the difference between linear functions and exponential functions by comparing and constrasting 𝑓 and 𝑔. Support your answer with a written explanation that includes use of the average rate of change and supporting tables and/or graphs of these functions.
Module 3: Linear and Exponential Functions Date: 9/11/13
© 2013 Common Core, Inc. Some rights reserved. commoncore.org This work is licensed under a Creative Commons Attribution-NonCommercial-ShareAlike 3.0 Unported License.

M3 Mid-Module Assessment Task NYS COMMON CORE MATHEMATICS CURRICULUM
ALGEBRA I
3. Dots can be arranged in rectangular shapes like the one shown below.
a. Assuming the trend continues, draw the next three shapes in this particular sequence of rectangles.How many dots are in each of the shapes you drew?
The numbers that represent the number of dots in this sequence of rectangular shapes are called rectangular numbers. For example, 2 is the first rectangular number and 6 is the 2nd rectangular number.
b. What is the 50th rectangular number? Explain how you arrived at your answer.
c. Write a recursive formula for the rectangular numbers.
Module 3: Linear and Exponential Functions Date: 9/11/13
© 2013 Common Core, Inc. Some rights reserved. commoncore.org This work is licensed under a Creative Commons Attribution-NonCommercial-ShareAlike 3.0 Unported License.

M3 Mid-Module Assessment Task NYS COMMON CORE MATHEMATICS CURRICULUM
ALGEBRA I
d. Write an explicit formula for the rectangular numbers.
e. Could an explicit formula for the 𝑛th rectangular number be considered a function? Explain why orwhy not. If yes, what would be the domain and range of the function?
4. Stephen is assigning parts for the school musical.
a. Suppose there are 20 students participating, and he has 20 roles available. If each of the 20 studentswill be assigned to exactly one role in the play, and each role will be played by only one student, isthe assignment of the roles to the students in this way certain to be an example of a function?Explain why or why not. If yes, state the domain and range of the function.
The school musical also has a pit orchestra.
b. Suppose there are 10 instrumental parts but only 7 musicians in the orchestra. The conductorassigns an instrumental part to each musician. Some musicians will have to cover two instrumentalparts, but no two musicians will have the same instrumental part. If the instrumental parts are thedomain and the musicians are the range, is the assignment of instrumental parts to musicians asdescribed sure to be an example of a function? Explain why or why not. If so, what would be themeaning of 𝐴(𝑃𝑖𝑎𝑛𝑜) = 𝑆𝑐𝑜𝑡𝑡?
Module 3: Linear and Exponential Functions Date: 9/11/13
© 2013 Common Core, Inc. Some rights reserved. commoncore.org This work is licensed under a Creative Commons Attribution-NonCommercial-ShareAlike 3.0 Unported License.

M3 Mid-Module Assessment Task NYS COMMON CORE MATHEMATICS CURRICULUM
ALGEBRA I
c. Suppose there are 10 instrumental parts but 13 musicians in the orchestra. The conductor assignsan instrumental part to each musician. Some instrumental parts will have two musicians assigned sothat all the musicians have instrumental parts. When two musicians are assigned to one part, theyalternate who plays at each performance of the play. If the instrumental parts are the domain, andthe musicians are the range, is the assignment of instrumental parts to musicians as described sureto be an example of a function? Explain why or why not. If so, what would be the meaning of𝐴(𝑃𝑖𝑎𝑛𝑜) = 𝑆𝑐𝑜𝑡𝑡?
5. The population of a remote island has been experiencing a decline since the year 1950. Scientists usedcensus data from 1950 and 1970 to model the declining population. In 1950 the population was 2350. In1962 the population was 1270. They chose an exponential decay model and arrived at the function:𝑝(𝑥) = 2350(0.95)𝑥 ,𝑥 ≥ 0, where 𝑥 is the number of years since 1950. The graph of this function isgiven below.
Module 3: Linear and Exponential Functions Date: 9/11/13
© 2013 Common Core, Inc. Some rights reserved. commoncore.org This work is licensed under a Creative Commons Attribution-NonCommercial-ShareAlike 3.0 Unported License.

M3 Mid-Module Assessment Task NYS COMMON CORE MATHEMATICS CURRICULUM
ALGEBRA I
a. What is the 𝑦-intercept of the graph? Interpret its meaning in the context of the problem.
b. Over what intervals is the function increasing? What does your answer mean within the context ofthe problem?
c. Over what intervals is the function decreasing? What does your answer mean within the context ofthe problem?
Another group of scientists argues that the decline in population would be better modeled by a linear function. They use the same two data points to arrive at a linear function.
d. Write the linear function that this second group of scientists would have used.
Module 3: Linear and Exponential Functions Date: 9/11/13
© 2013 Common Core, Inc. Some rights reserved. commoncore.org This work is licensed under a Creative Commons Attribution-NonCommercial-ShareAlike 3.0 Unported License.

M3 Mid-Module Assessment Task NYS COMMON CORE MATHEMATICS CURRICULUM
ALGEBRA I
e. What is an appropriate domain for the function? Explain your choice within the context of theproblem.
f. Graph the function on the coordinate plane.
g. What is the 𝑥-intercept of the function? Interpret its meaning in the context of the problem.
Module 3: Linear and Exponential Functions Date: 9/11/13
© 2013 Common Core, Inc. Some rights reserved. commoncore.org This work is licensed under a Creative Commons Attribution-NonCommercial-ShareAlike 3.0 Unported License.

Lesson 15: Piecewise Functions Date: 9/12/13
© 2013 Common Core, Inc. Some rights reserved. commoncore.org This work is licensed under a Creative Commons Attribution-NonCommercial-ShareAlike 3.0 Unported License.
NYS COMMON CORE MATHEMATICS CURRICULUM M3 Lesson 15 ALGEBRA I
Name ___________________________________________________ Date____________________
Lesson 15: Piecewise Functions
Exit Ticket
Each graph shown below represents the solution set to a two-variable equation.
Graph A Graph B Graph C
1. Which of these graphs could be represented by a function? Explain your reasoning.
2. For each one that can be represented by a function, define a piecewise function whose graph would be identical tothe solution set shown.

Lesson 16: Graphs Can Solve Equations Too Date: 9/12/13
© 2013 Common Core, Inc. Some rights reserved. commoncore.org
NYS COMMON CORE MATHEMATICS CURRICULUM
This work is licensed under a Creative Commons Attribution-NonCommercial-ShareAlike 3.0 Unported License.
M3 Lesson 16 ALGEBRA I
Name ___________________________________________________ Date____________________
Lesson 16: Graphs Can Solve Equations Too
Exit Ticket
1. How do intersection points of the graphs of two functions 𝑓 and 𝑔 relate of the solution to an equation in the form𝑓(𝑥) = 𝑔(𝑥)?
2. What are some benefits of solving equations graphically? What are some limitations?

Lesson 17: Four Interesting Transformations of Functions Date: 9/12/13
© 2013 Common Core, Inc. Some rights reserved. commoncore.org
NYS COMMON CORE MATHEMATICS CURRICULUM
This work is licensed under a Creative Commons Attribution-NonCommercial-ShareAlike 3.0 Unported License.
M3 Lesson 17 ALGEBRA I
Name ___________________________________________________ Date____________________
Lesson 17: Four Interesting Transformations of Functions
Exit Ticket
Let 𝑝(𝑥) = |𝑥| for every real number 𝑥. The graph of 𝑦 = 𝑝(𝑥) is shown below.
1. Let 𝑞(𝑥) = − 12 |𝑥| for every real number 𝑥. Describe how to obtain the graph of 𝑦 = 𝑞(𝑥) from the graph of
𝑦 = 𝑝(𝑥). Sketch the graph of 𝑦 = 𝑞(𝑥) on the same set of axes as the graph of 𝑦 = 𝑝(𝑥).
2. Let 𝑟(𝑥) = |𝑥| − 1 for every real number 𝑥. Describe how to obtain the graph of 𝑦 = 𝑟(𝑥) from the graph of𝑦 = 𝑝(𝑥). Sketch the graph of 𝑦 = 𝑟(𝑥) on the same set of axes as the graphs of 𝑦 = 𝑝(𝑥) and 𝑦 = 𝑞(𝑥).
𝒚𝒚 = 𝒑(𝒙𝒙)

Lesson 18: Four Interesting Transformations of Functions Date: 9/12/13
© 2013 Common Core, Inc. Some rights reserved. commoncore.org
NYS COMMON CORE MATHEMATICS CURRICULUM
This work is licensed under a Creative Commons Attribution-NonCommercial-ShareAlike 3.0 Unported License.
M3 Lesson 18 ALGEBRA I
Name ___________________________________________________ Date____________________
Lesson 18: Four Interesting Transformations of Functions
Exit Ticket
Write the formula for the functions depicted by the graphs below:
a. 𝑓(𝑥) = ________________________________
b. 𝑔(𝑥) = ________________________________
c. ℎ(𝑥) = ________________________________
𝒚𝒚 = 𝒇𝒇(𝒙𝒙)
𝒚𝒚 = 𝒈𝒈(𝒙𝒙) 𝒚𝒚 = 𝒉𝒉(𝒙𝒙)

Lesson 19: Four Interesting Transformations of Functions Date: 9/12/13
© 2013 Common Core, Inc. Some rights reserved. commoncore.org
NYS COMMON CORE MATHEMATICS CURRICULUM
This work is licensed under a Creative Commons Attribution-NonCommercial-ShareAlike 3.0 Unported License.
M3 Lesson 19 ALGEBRA I
Name ___________________________________________________ Date____________________
Lesson 19: Four Interesting Transformations of Functions
Exit Ticket
Let 𝑓(𝑥) = 𝑥2,𝑔(𝑥) = (3𝑥)2, and ℎ(𝑥) = �13 𝑥�
2, where 𝑥 can be any real number. The graphs above are of 𝑦 = 𝑓(𝑥),
𝑦 = 𝑔(𝑥), and 𝑦 = ℎ(𝑥).
1. Label each graph with the appropriate equation.
2. Describe the transformation that takes the graph of 𝑦 = 𝑓(𝑥) to the graph of 𝑦 = 𝑔(𝑥). Use coordinates of each toillustrate an example of the correspondence.

Lesson 19: Four Interesting Transformations of Functions Date: 9/12/13
© 2013 Common Core, Inc. Some rights reserved. commoncore.org
NYS COMMON CORE MATHEMATICS CURRICULUM
This work is licensed under a Creative Commons Attribution-NonCommercial-ShareAlike 3.0 Unported License.
M3 Lesson 19 ALGEBRA I
3. Describe the transformation that takes the graph of 𝑦 = 𝑓(𝑥) to the graph of 𝑦 = ℎ(𝑥). Use coordinates toillustrate an example of the correspondence.

Lesson 20: Four Interesting Transformations of Functions Date: 9/12/13
© 2013 Common Core, Inc. Some rights reserved. commoncore.org
NYS COMMON CORE MATHEMATICS CURRICULUM
This work is licensed under a Creative Commons Attribution-NonCommercial-ShareAlike 3.0 Unported License.
M3 Lesson 20 ALGEBRA I
Name ___________________________________________________ Date____________________
Lesson 20: Four Interesting Transformations of Functions
Exit Ticket
The graph of a piecewise function 𝑓 is shown below.
Let 𝑝(𝑥) = 𝑓(𝑥 − 2), 𝑞(𝑥) = 12𝑓(𝑥 − 2), and 𝑟(𝑥) = 1
2𝑓(𝑥 − 2) + 3.
Graph 𝑦 = 𝑝(𝑥), 𝑦 = 𝑞(𝑥), and 𝑦 = 𝑟(𝑥) on the same set of axes as the graph of 𝑦 = 𝑓(𝑥).
𝒚𝒚 = 𝒇𝒇(𝒙𝒙)

Lesson 21: Comparing Linear and Exponential Functions Again Date: 9/12/13
© 2013 Common Core, Inc. Some rights reserved. commoncore.org
NYS COMMON CORE MATHEMATICS CURRICULUM
This work is licensed under a Creative Commons Attribution-NonCommercial-ShareAlike 3.0 Unported License.
M3 Lesson 21 ALGEBRA I
Name ___________________________________________________ Date____________________
Lesson 21: Comparing Linear and Exponential Functions Again
Exit Ticket
Here is a classic riddle: Mr. Smith has an apple orchard. He hires his daughter, Lucy, to pick apples and offers her two payment options.
Option A: $1.50 per bushel of apples picked.
Option B: 1 𝑐𝑒𝑛𝑡 for picking one bushel, 3 𝑐𝑒𝑛𝑡𝑠 for picking two bushels, 9 𝑐𝑒𝑛𝑡𝑠 for picking three bushels, and so on, with the amount of money tripling for each additional bushel picked.
a. Write a function to model each option.
b. If Lucy picks 𝑠𝑖𝑥 bushels of apples, which option should she choose?
c. If Lucy picks 12 bushels of apples, which option should she choose?
d. How many bushels of apples does Lucy need to pick to make option B better for her than option A?
Lesson 22: Modeling an Invasive Species Population Date: 9/12/13
© 2013 Common Core, Inc. Some rights reserved. commoncore.org
NYS COMMON CORE MATHEMATICS CURRICULUM
This work is licensed under a Creative Commons Attribution-NonCommercial-ShareAlike 3.0 Unported License.
M3 Lesson 22 ALGEBRA I
Name ___________________________________________________ Date____________________
Lesson 22: Modeling an Invasive Species Population
Exit Ticket
1. For the equation found in Exercise 8, explain the parameters of the equation within the context of the problem.
2. Given each of the following, describe what features in the data or graph make it apparent that an exponential modelwould be more suitable than a linear model?
a. The table of data.
b. The scatterplot.
c. The average rates of change found in question 6.
3. Use your equation from Exercise 8 to predict the number of lionfish sightings by year 2020. Is this predictionaccurate? Explain.

Lesson 23: Newton’s Law of Cooling Date: 9/12/13
© 2013 Common Core, Inc. Some rights reserved. commoncore.org
NYS COMMON CORE MATHEMATICS CURRICULUM
This work is licensed under a Creative Commons Attribution-NonCommercial-ShareAlike 3.0 Unported License.
M3 Lesson 23 ALGEBRA I
Name ___________________________________________________ Date____________________
Lesson 23: Newton’s Law of Cooling
Exit Ticket
Shown below is the graph of cup 1 from the exercise completed in class. For each scenario, sketch a graph of cup 2 on the same coordinate plane.
1. Cup 2 is poured 10 minutes after cup 1 (the pot of coffee is maintained at 180˚F over the 10 minutes).
2. Cup 2 is immediately taken outside where the temperature is 90°F.
Lesson 24: Piecewise and Step Functions in Context Date: 9/12/13
© 2013 Common Core, Inc. Some rights reserved. commoncore.org
NYS COMMON CORE MATHEMATICS CURRICULUM
This work is licensed under a Creative Commons Attribution-NonCommercial-ShareAlike 3.0 Unported License.
M3 Lesson 24 ALGEBRA I
Name ___________________________________________________ Date____________________
Lesson 24: Piecewise and Step Functions in Context
Exit Ticket
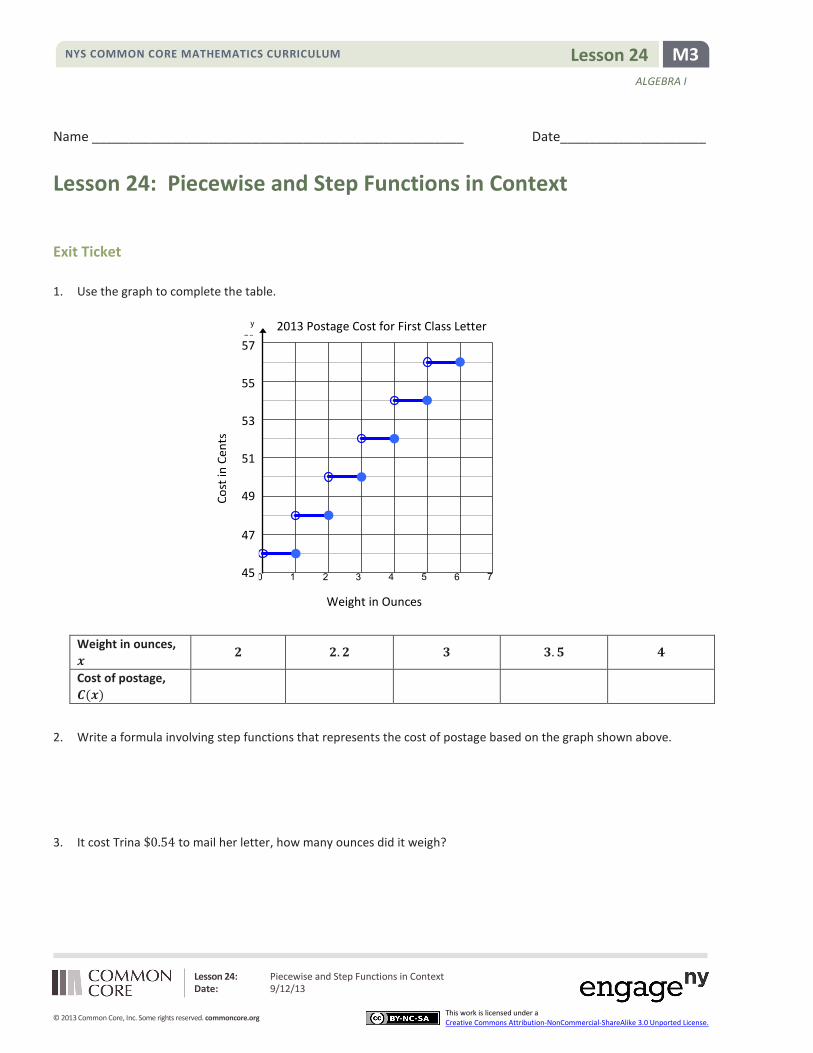
1. Use the graph to complete the table.
Weight in ounces, 𝒙
𝟐 𝟐.𝟐 𝟑 𝟑.𝟓 𝟒
Cost of postage, 𝑪(𝒙)
2. Write a formula involving step functions that represents the cost of postage based on the graph shown above.
3. It cost Trina $0.54 to mail her letter, how many ounces did it weigh?
1 2 3 4 5 6 7038
40
42
44
46
48
50y
57
55
53
51
49
47
45
Cost
in C
ents
Weight in Ounces
2013 Postage Cost for First Class Letter

M3 End-of-Module Assessment Task NYS COMMON CORE MATHEMATICS CURRICULUM
ALGEBRA I
Name Date
1. Given ℎ(𝑥) = |𝑥 + 2| − 3 and 𝑔(𝑥) = −|𝑥| + 4.
a. Describe how to obtain the graph of 𝑔 from the graph of 𝑎(𝑥) = |𝑥| using transformations.
b. Describe how to obtain the graph of ℎ from the graph of 𝑎(𝑥) = |𝑥| using transformations.
c. Sketch the graphs of ℎ(𝑥) and 𝑔(𝑥) on the same coordinate plane.
d. Use your graphs to estimate the solutions to the equation:|𝑥 + 2| − 3 = −|𝑥| + 4
Explain how you got your answer.
e. Were your estimations you made in part (d) correct? If yes, explain how you know. If not explainwhy not.
Module 3: Linear and Exponential Functions Date: 9/12/13
© 2013 Common Core, Inc. Some rights reserved. commoncore.org This work is licensed under a Creative Commons Attribution-NonCommercial-ShareAlike 3.0 Unported License.

M3 End-of-Module Assessment Task NYS COMMON CORE MATHEMATICS CURRICULUM
ALGEBRA I
2. Let 𝑓 and 𝑔 be the functions given by 𝑓(𝑥) = 𝑥2 and 𝑔(𝑥) = 𝑥|𝑥|.
a. Find 𝑓 �13�, 𝑔(4), and 𝑔�−√3�.
b. What is the domain of 𝑓?
c. What is the range of 𝑔?
d. Evaluate 𝑓(−67) + 𝑔(−67).
e. Compare and contrast 𝑓 and 𝑔. How are they alike? How are they different?
f. Is there a value of 𝑥, such that 𝑓(𝑥) + 𝑔(𝑥) = −100 ? If so, find 𝑥. If not, explain why no suchvalue exists.
g. Is there a value of x such that (𝑥) + 𝑔(𝑥) = 50 ? If so, find 𝑥. If not, explain why no such valueexists.
Module 3: Linear and Exponential Functions Date: 9/12/13
© 2013 Common Core, Inc. Some rights reserved. commoncore.org This work is licensed under a Creative Commons Attribution-NonCommercial-ShareAlike 3.0 Unported License.

M3 End-of-Module Assessment Task NYS COMMON CORE MATHEMATICS CURRICULUM
ALGEBRA I
3. A boy bought 6 guppies at the beginning of the month. One month later the number of guppies in histank had doubled. His guppy population continued to grow in this same manner. His sister bought sometetras at the same time. The table below shows the number of tetras, 𝑡, after 𝑛 months have passedsince they bought the fish.
a. Create a function g to model the growth of the boy’s guppy population, where 𝑔(𝑛) is the number ofguppies at the beginning of each month, and n is the number of months that have passed since hebought the 6 guppies. What is a reasonable domain for g in this situation?
b. How many guppies will there be one year after he bought the 6 guppies?
c. Create an equation that could be solved to determine how many months after he bought theguppies there will be 100 guppies.
d. Use graphs or tables to approximate a solution to the equation from part (c). Explain how youarrived at your estimate.
𝑛, months 0 1 2 3 𝑡, tetras 8 16 24 32
Module 3: Linear and Exponential Functions Date: 9/12/13
© 2013 Common Core, Inc. Some rights reserved. commoncore.org This work is licensed under a Creative Commons Attribution-NonCommercial-ShareAlike 3.0 Unported License.
M3 End-of-Module Assessment Task NYS COMMON CORE MATHEMATICS CURRICULUM
ALGEBRA I
e. Create a function, 𝑡, to model the growth of the sister’s tetra population, where 𝑡(𝑛) is the numberof tetras after 𝑛 months have passed since she bought the tetras.
f. Compare the growth of the sister’s tetra population to the growth of the guppy population. Includea comparison of the average rate of change for the functions that model each population’s growthover time.
g. Use graphs to estimate the number of months that will have passed when the population of guppiesand tetras will be the same.
Module 3: Linear and Exponential Functions Date: 9/12/13
© 2013 Common Core, Inc. Some rights reserved. commoncore.org This work is licensed under a Creative Commons Attribution-NonCommercial-ShareAlike 3.0 Unported License.

M3 End-of-Module Assessment Task NYS COMMON CORE MATHEMATICS CURRICULUM
ALGEBRA I
h. Use graphs or tables to explain why the guppy population will eventually exceed the tetra populationeven though there were more tetras to start with.
i. Write the function 𝑔(𝑛) in such a way that the percent increase in the number of fish per month canbe identified. Circle or underline the expression representing percent increase in number of fish permonth.
Module 3: Linear and Exponential Functions Date: 9/12/13
© 2013 Common Core, Inc. Some rights reserved. commoncore.org This work is licensed under a Creative Commons Attribution-NonCommercial-ShareAlike 3.0 Unported License.

M3 End-of-Module Assessment Task NYS COMMON CORE MATHEMATICS CURRICULUM
ALGEBRA I
4. Regard the solid dark equilateral triangle as figure 0. Then, the first figure in this sequence is the onecomposed of three dark triangles, the second figure is the one composed of nine dark triangles, and soon.
a. How many dark triangles are in each figure? Make a table to show this data.
𝑛 (Figure Number)
𝑇 (# of dark triangles)
b. Describe in words how, given the number of dark triangles in a figure, to determine the number ofdark triangles in the next figure.
c. Create a function that models this sequence. What is the domain of this function?
d. Suppose the area of the solid dark triangle in Figure 0 is 1 square meter. The areas of one darktriangle in each figure form a sequence. Create an explicit formula that gives the area of just one ofthe dark triangles in the 𝑛𝑡ℎ figure in the sequence?
Figure 0 Figure 1 Figure 2 Figure 3 Figure 4
Module 3: Linear and Exponential Functions Date: 9/12/13
© 2013 Common Core, Inc. Some rights reserved. commoncore.org This work is licensed under a Creative Commons Attribution-NonCommercial-ShareAlike 3.0 Unported License.

M3 End-of-Module Assessment Task NYS COMMON CORE MATHEMATICS CURRICULUM
ALGEBRA I
e. The sum of the areas of all the dark triangles in Figure 0 is 1 m2; there is only one triangle in this
case. The sum of the areas of all the dark triangles in Figure 1 is 34
m2. What is the sum of the areas
of all the dark triangles in the 𝑛𝑡ℎ figure in the sequence? Is this total area increasing or decreasingas 𝑛 increases?
f. Let 𝑃(𝑛) be the sum of the perimeters of the all dark triangles in the 𝑛𝑡ℎ figure in the sequence offigures. There is a real number 𝑘 so that:
𝑃(𝑛 + 1) = 𝑘𝑃(𝑛)
is true for each positive whole number 𝑛. What is the value of 𝑘?
Module 3: Linear and Exponential Functions Date: 9/12/13
© 2013 Common Core, Inc. Some rights reserved. commoncore.org This work is licensed under a Creative Commons Attribution-NonCommercial-ShareAlike 3.0 Unported License.

M3 End-of-Module Assessment Task NYS COMMON CORE MATHEMATICS CURRICULUM
ALGEBRA I
5. The graph of a piecewise function f is shown to the right. The domain of 𝑓 is −3 ≤ 𝑥 ≤ 3.
a. Create an algebraic representation for 𝑓. Assume that the graph of 𝑓 is composed of straight linesegments.
b. Sketch the graph of 𝑦 = 2𝑓(𝑥) and state the domain and range.
Module 3: Linear and Exponential Functions Date: 9/12/13
© 2013 Common Core, Inc. Some rights reserved. commoncore.org This work is licensed under a Creative Commons Attribution-NonCommercial-ShareAlike 3.0 Unported License.

M3 End-of-Module Assessment Task NYS COMMON CORE MATHEMATICS CURRICULUM
ALGEBRA I
c. Sketch the graph of 𝑦 = 𝑓(2𝑥) and state the domain and range.
d. How does the range of 𝑦 = 𝑓(𝑥) compare to the range of 𝑦 = 𝑘𝑓(𝑥), where 𝑘 > 1?
e. How does the domain of 𝑦 = 𝑓(𝑥) compare to the domain of 𝑦 = 𝑓(𝑘𝑥), where 𝑘 > 1?
Module 3: Linear and Exponential Functions Date: 9/12/13
© 2013 Common Core, Inc. Some rights reserved. commoncore.org This work is licensed under a Creative Commons Attribution-NonCommercial-ShareAlike 3.0 Unported License.