Embed Size (px)
Citation preview
Accompanying text for the
slides in this lesson can be
found on pages 59 through
80 in the textbook:
Lesson 12:
Doppler Principles
This lesson contains 51 slides
plus 26 multiple-choice
questions.
DOPPLER
PRINCIPLES
DOPPLER
DOPPLER
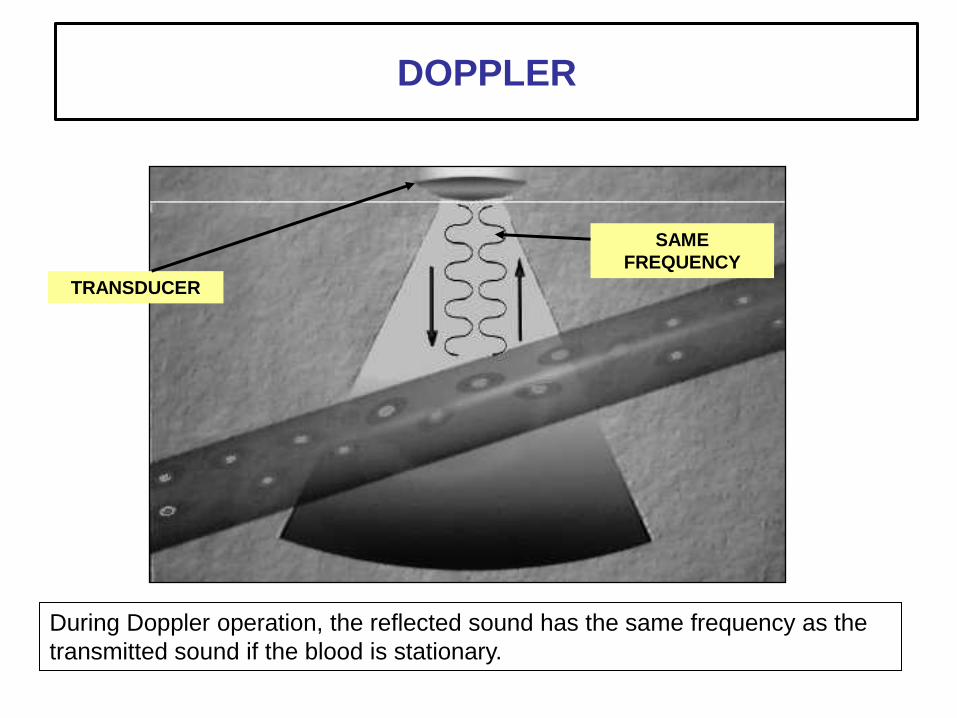
During Doppler operation, the reflected sound has the same frequency as the
transmitted sound if the blood is stationary.
SAME
FREQUENCY
TRANSDUCER
DOPPLER
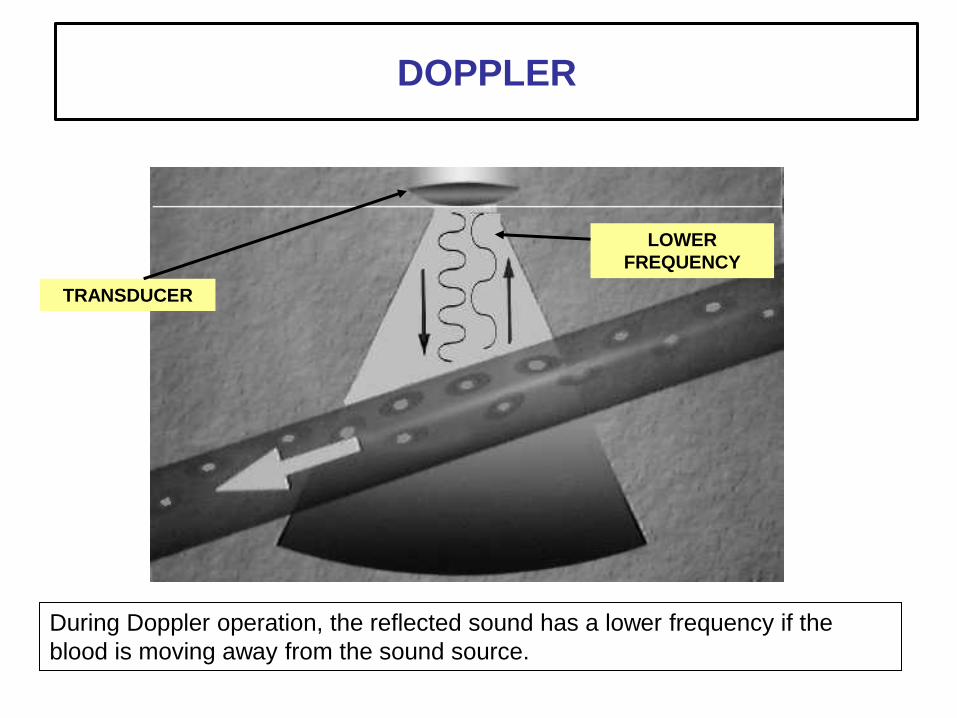
During Doppler operation, the reflected sound has a lower frequency if the
blood is moving away from the sound source.
LOWER
FREQUENCY
TRANSDUCER
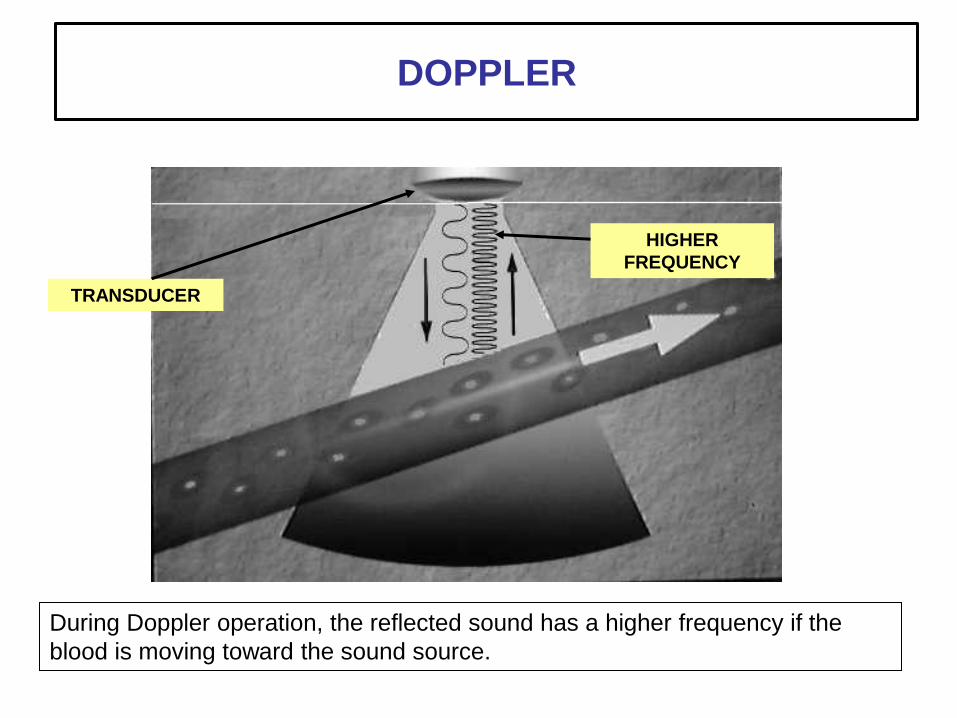
DOPPLER
During Doppler operation, the reflected sound has a higher frequency if the
blood is moving toward the sound source.
HIGHER
FREQUENCY
TRANSDUCER
f
DOPPLER SHIFT
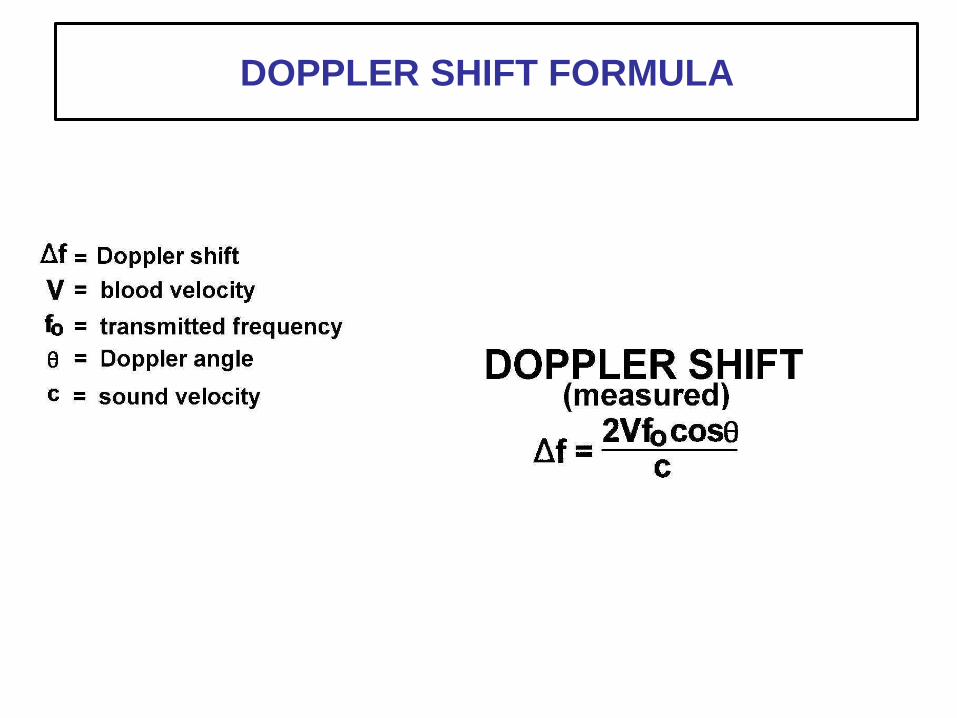
DOPPLER SHIFT FORMULA
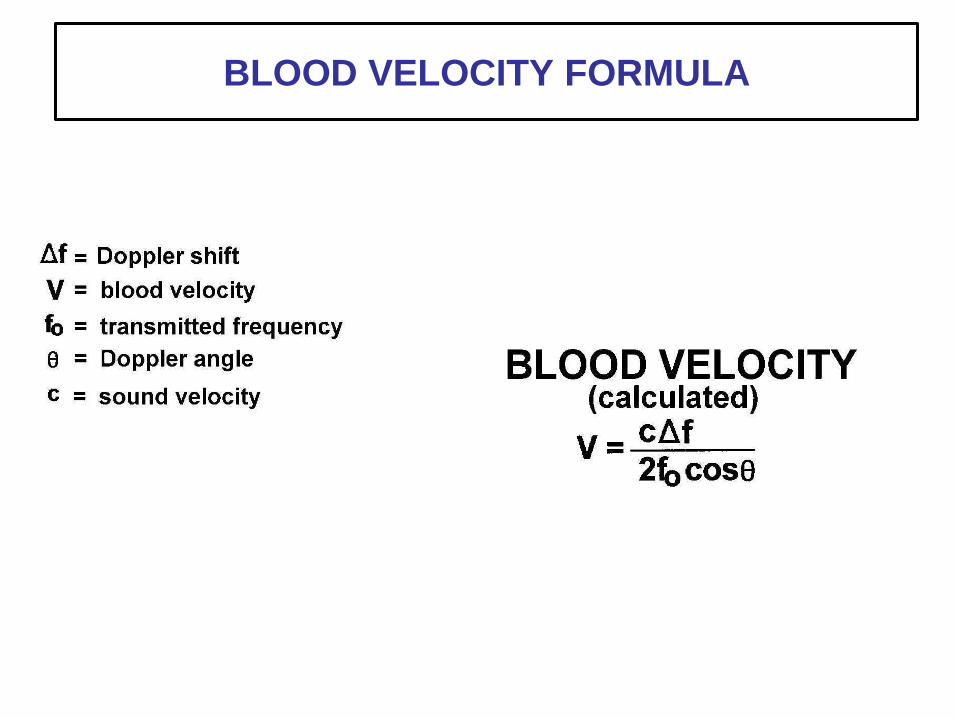
BLOOD VELOCITY FORMULA
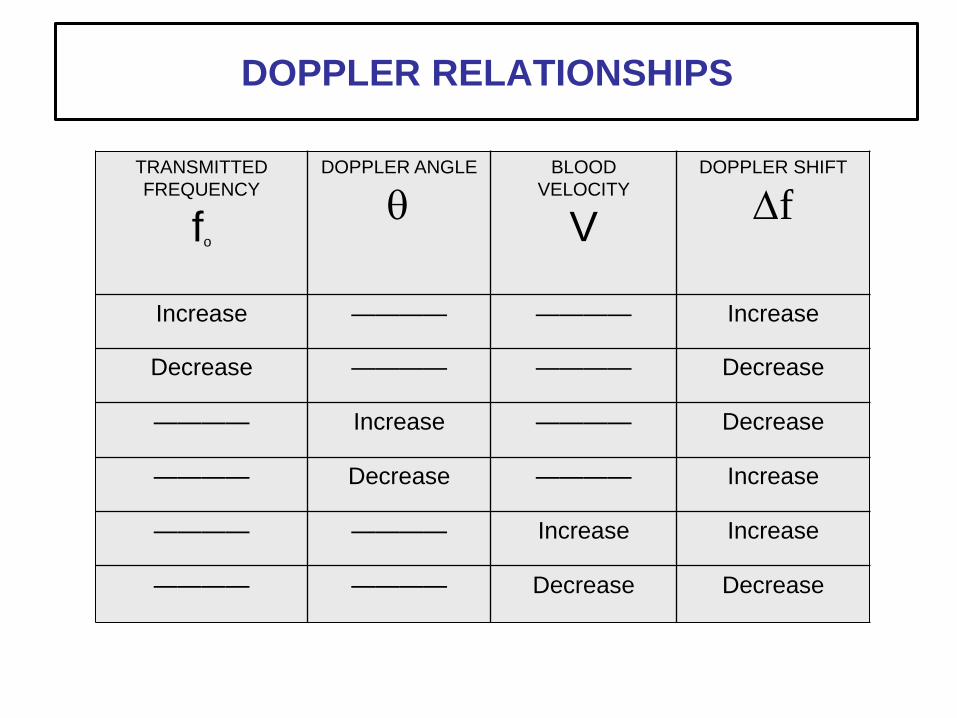
DOPPLER RELATIONSHIPS
TRANSMITTED
FREQUENCY
fo
DOPPLER ANGLE
q BLOOD
VELOCITY
V
DOPPLER SHIFT
f
Increase ———— ———— Increase
Decrease ———— ———— Decrease
———— Increase ———— Decrease
———— Decrease ———— Increase
———— ———— Increase Increase
———— ———— Decrease Decrease
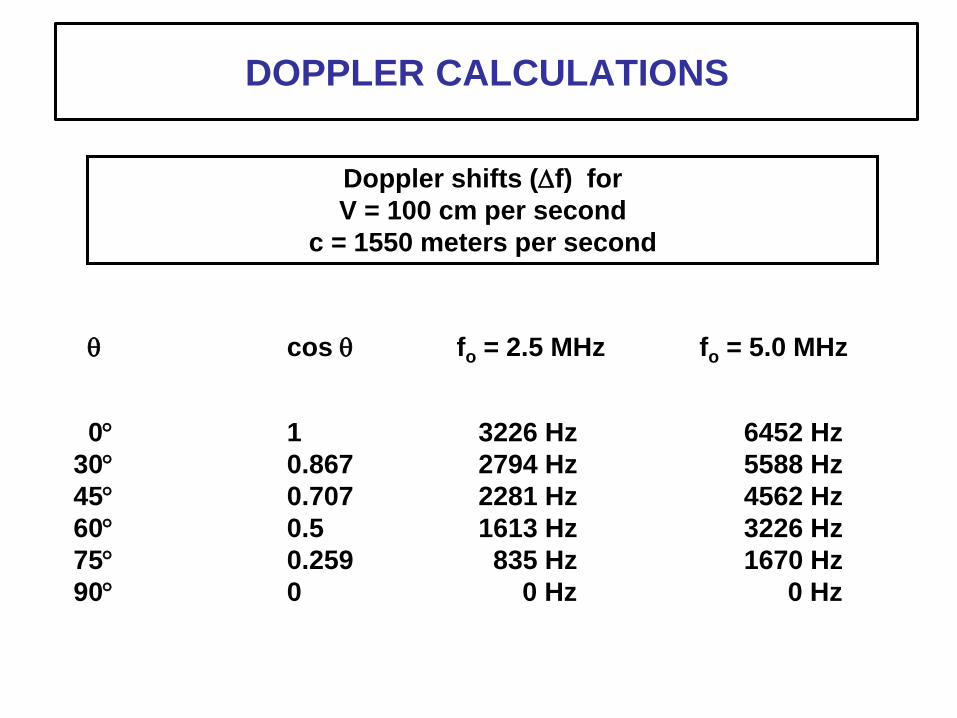
q cos q fo = 2.5 MHz fo = 5.0 MHz
0 1 3226 Hz 6452 Hz
30 0.867 2794 Hz 5588 Hz
45 0.707 2281 Hz 4562 Hz
60 0.5 1613 Hz 3226 Hz
75 0.259 835 Hz 1670 Hz
90 0 0 Hz 0 Hz
Doppler shifts (f) for
V = 100 cm per second
c = 1550 meters per second
DOPPLER CALCULATIONS
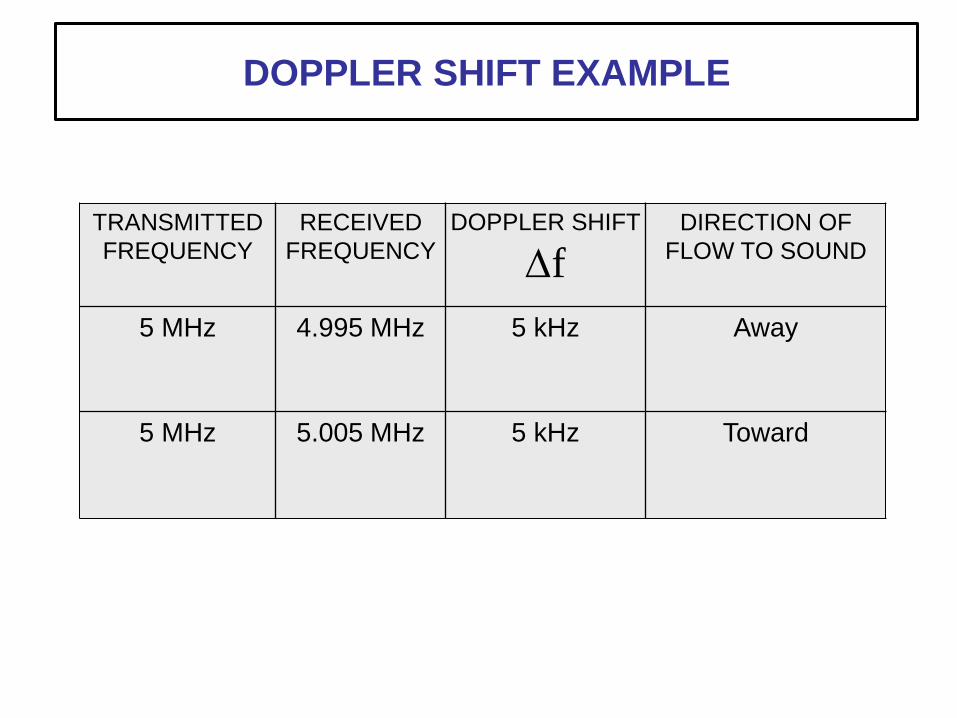
DOPPLER SHIFT EXAMPLE
TRANSMITTED
FREQUENCY
RECEIVED
FREQUENCY
DOPPLER SHIFT
f DIRECTION OF
FLOW TO SOUND
5 MHz 4.995 MHz 5 kHz Away
5 MHz 5.005 MHz 5 kHz Toward
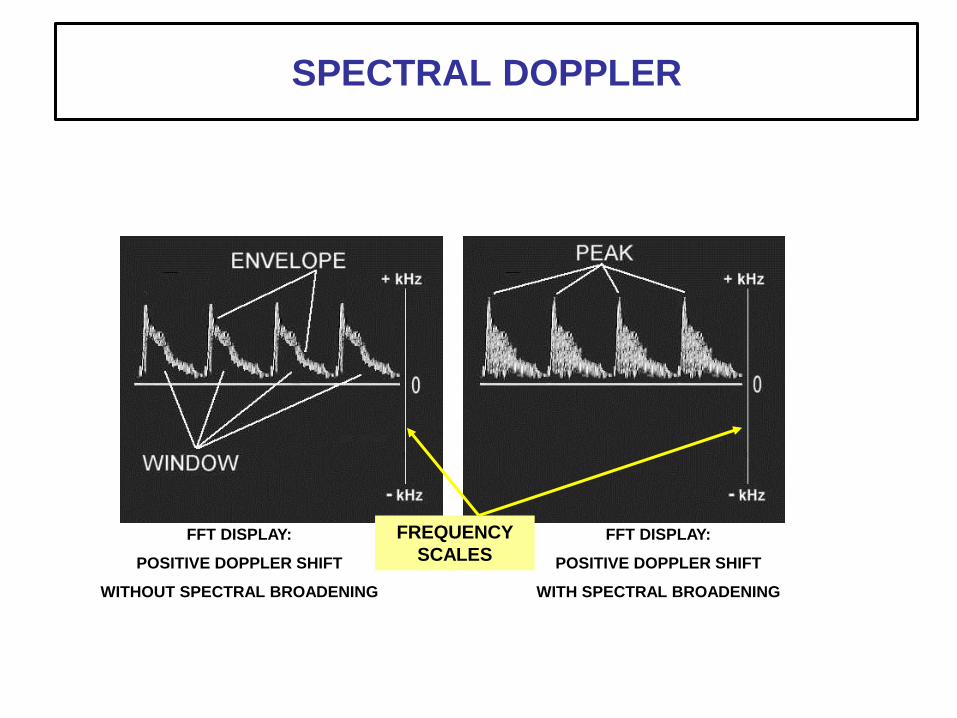
SPECTRAL DOPPLER
FFT DISPLAY:
POSITIVE DOPPLER SHIFT
WITHOUT SPECTRAL BROADENING
FFT DISPLAY:
POSITIVE DOPPLER SHIFT
WITH SPECTRAL BROADENING
FREQUENCY
SCALES
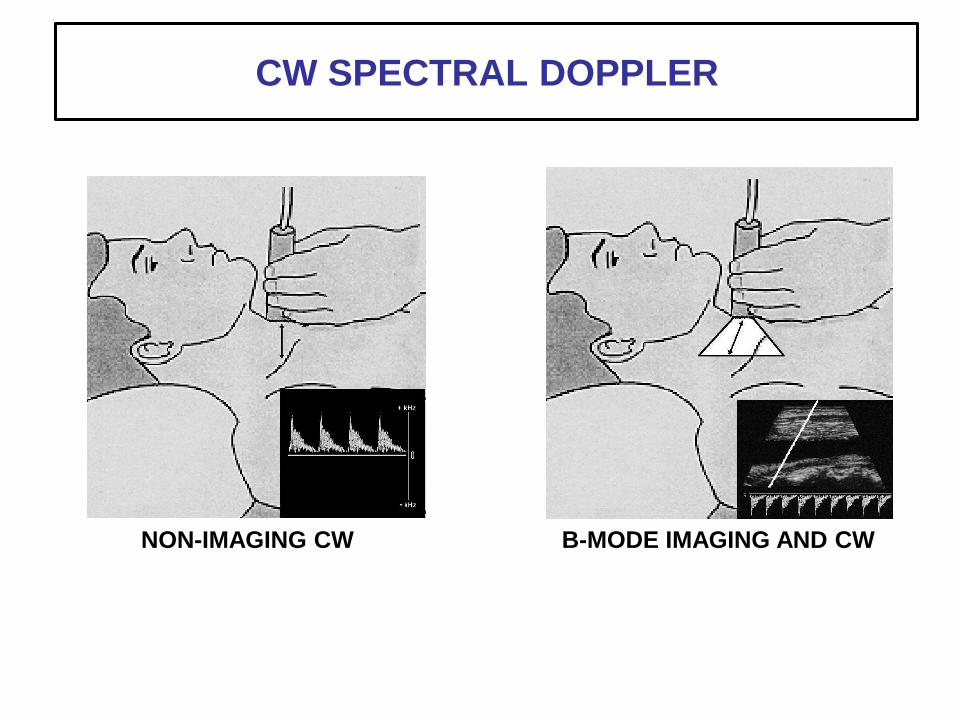
NON-IMAGING CW B-MODE IMAGING AND CW
CW SPECTRAL DOPPLER
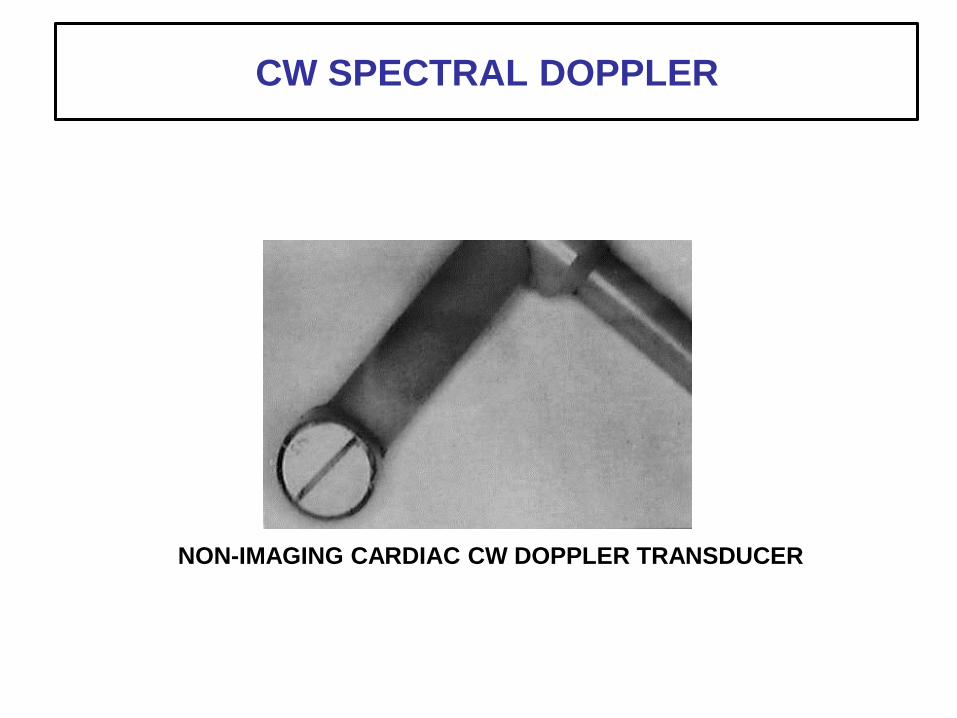
NON-IMAGING CARDIAC CW DOPPLER TRANSDUCER
CW SPECTRAL DOPPLER
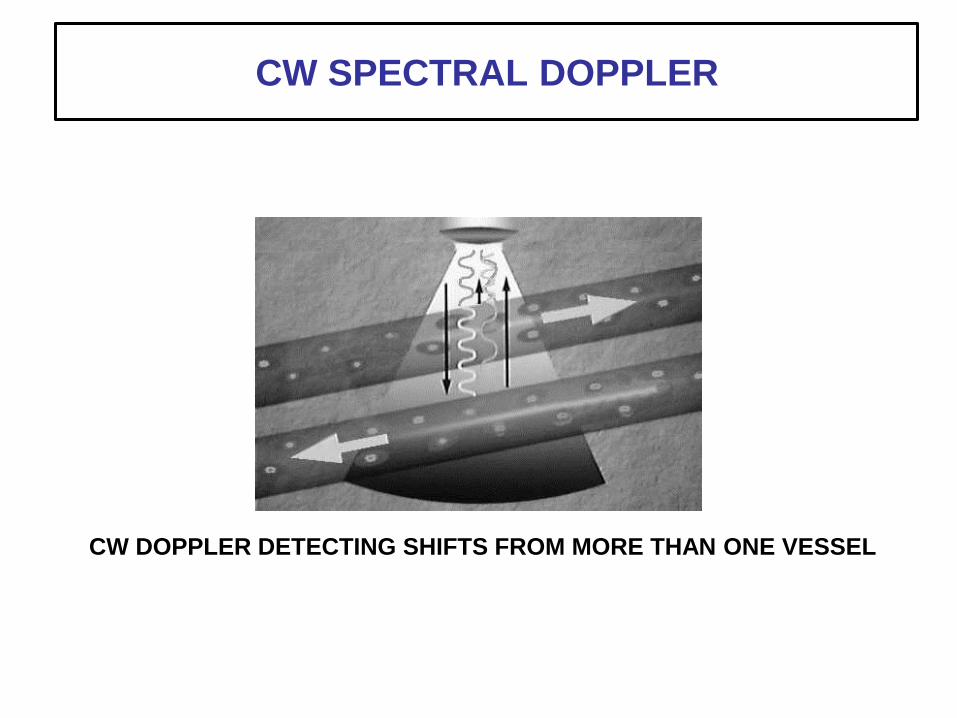
CW DOPPLER DETECTING SHIFTS FROM MORE THAN ONE VESSEL
CW SPECTRAL DOPPLER
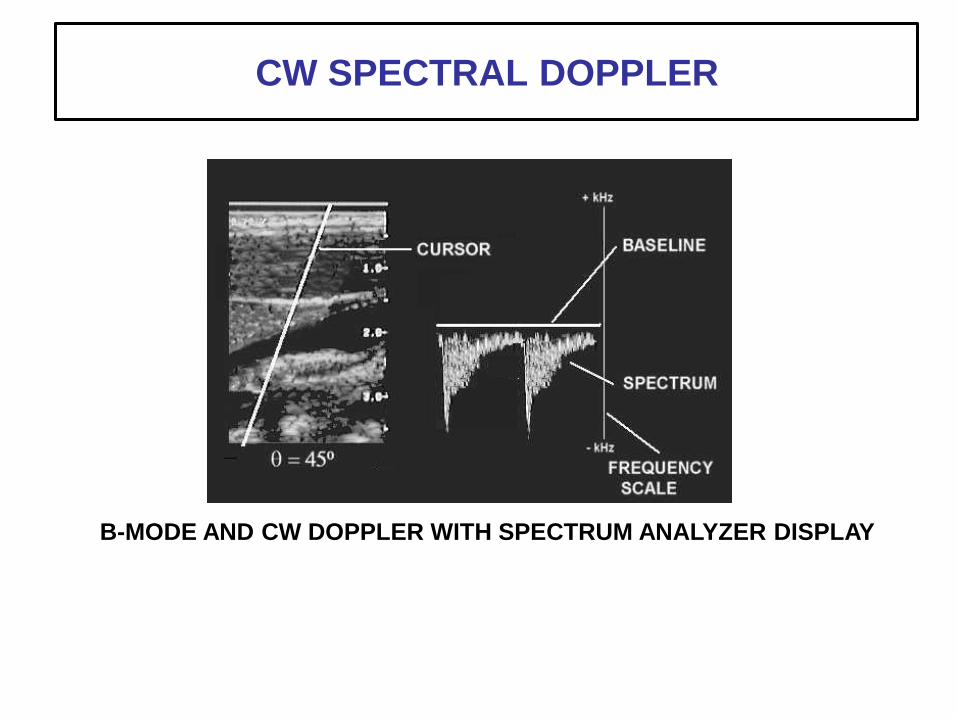
B-MODE AND CW DOPPLER WITH SPECTRUM ANALYZER DISPLAY
CW SPECTRAL DOPPLER
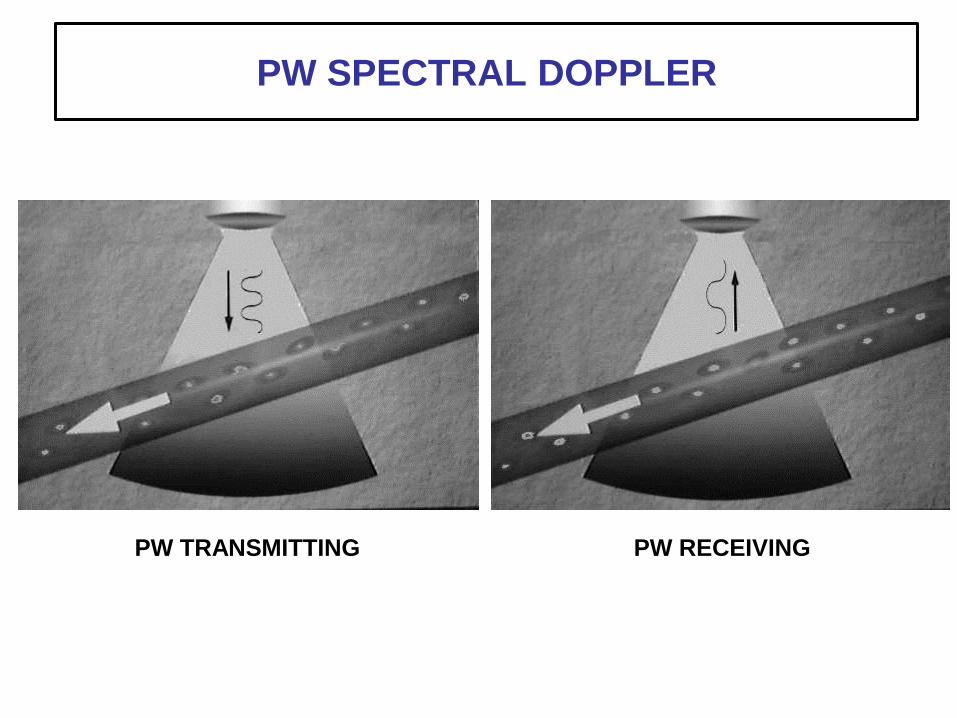
PW TRANSMITTING PW RECEIVING
PW SPECTRAL DOPPLER
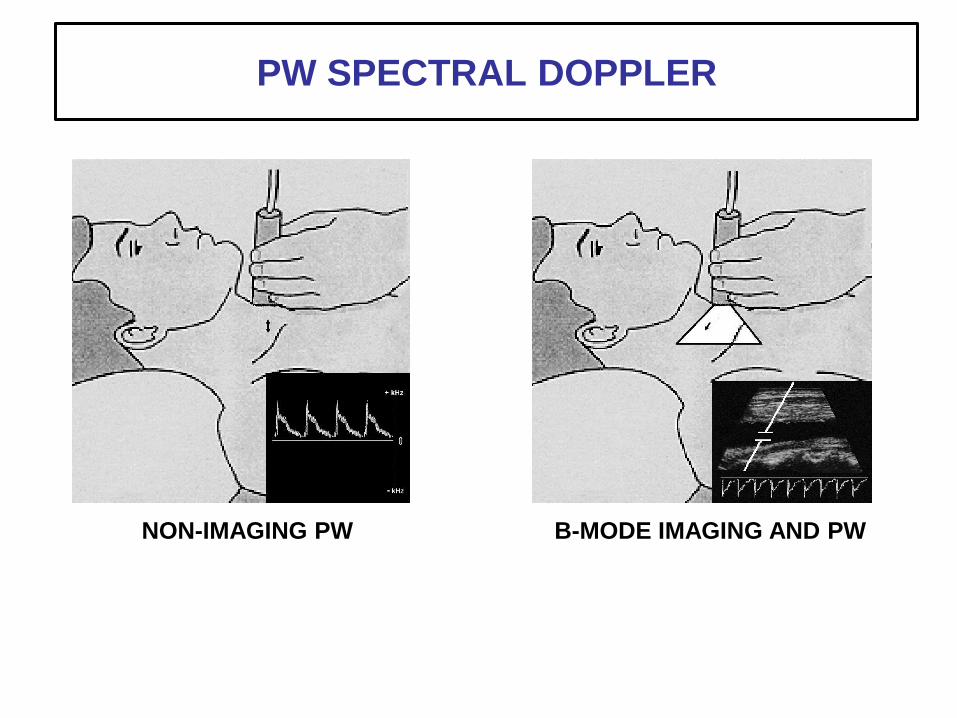
NON-IMAGING PW B-MODE IMAGING AND PW
PW SPECTRAL DOPPLER
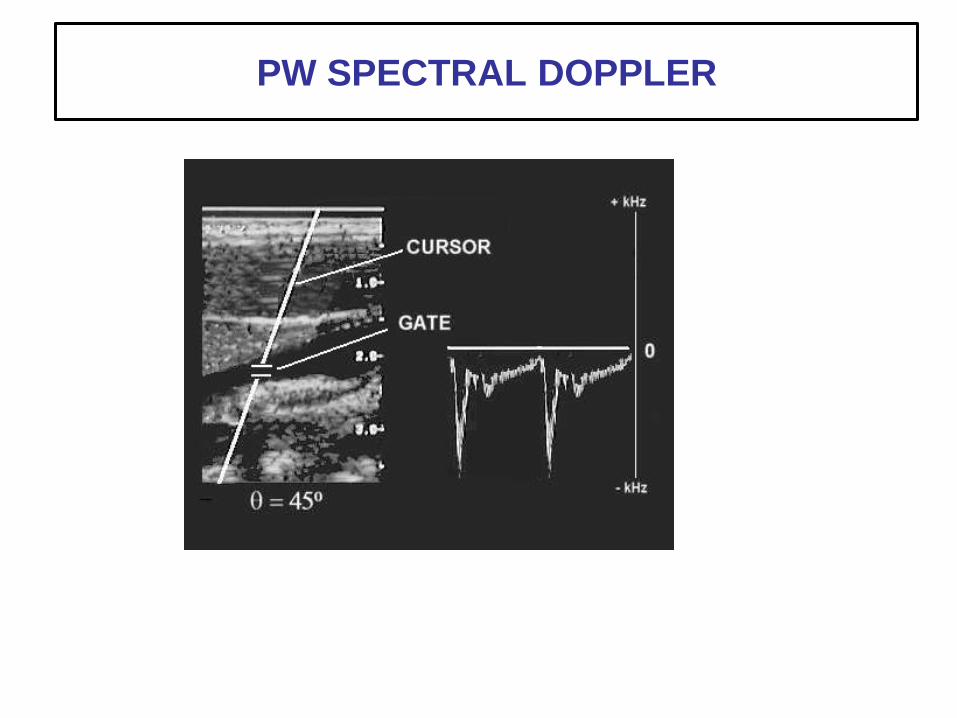
PW SPECTRAL DOPPLER
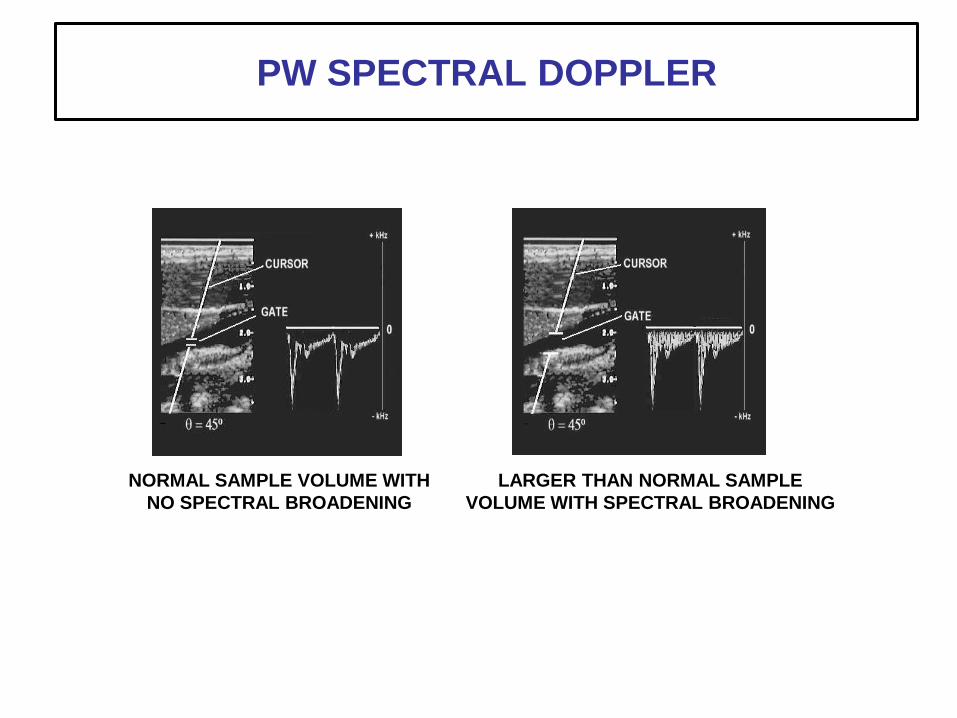
NORMAL SAMPLE VOLUME WITH
NO SPECTRAL BROADENING
LARGER THAN NORMAL SAMPLE
VOLUME WITH SPECTRAL BROADENING
PW SPECTRAL DOPPLER
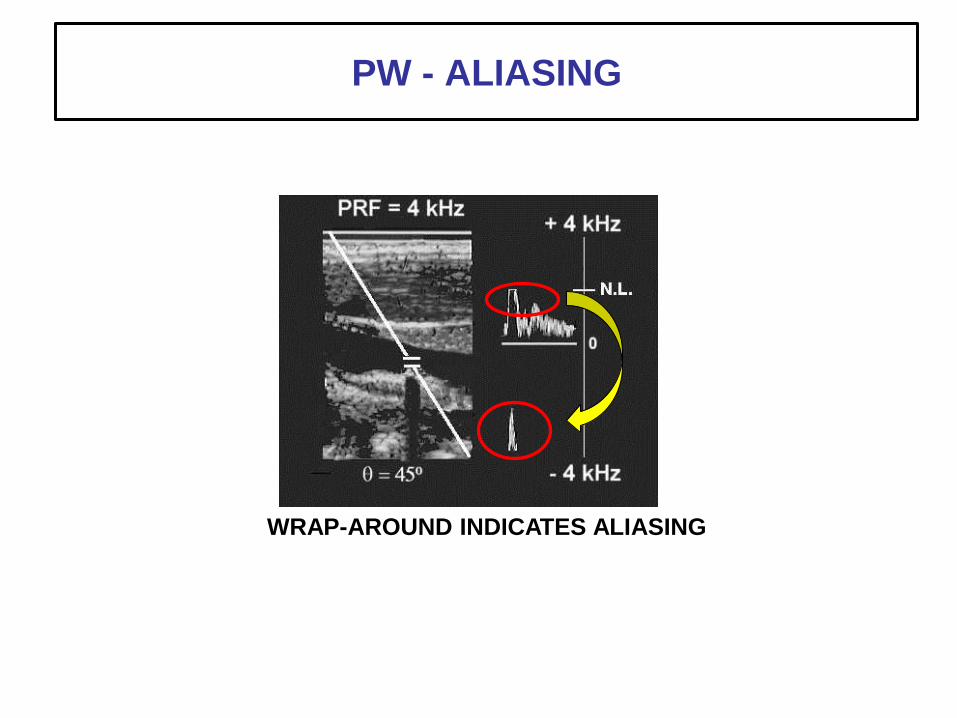
WRAP-AROUND INDICATES ALIASING
PW - ALIASING
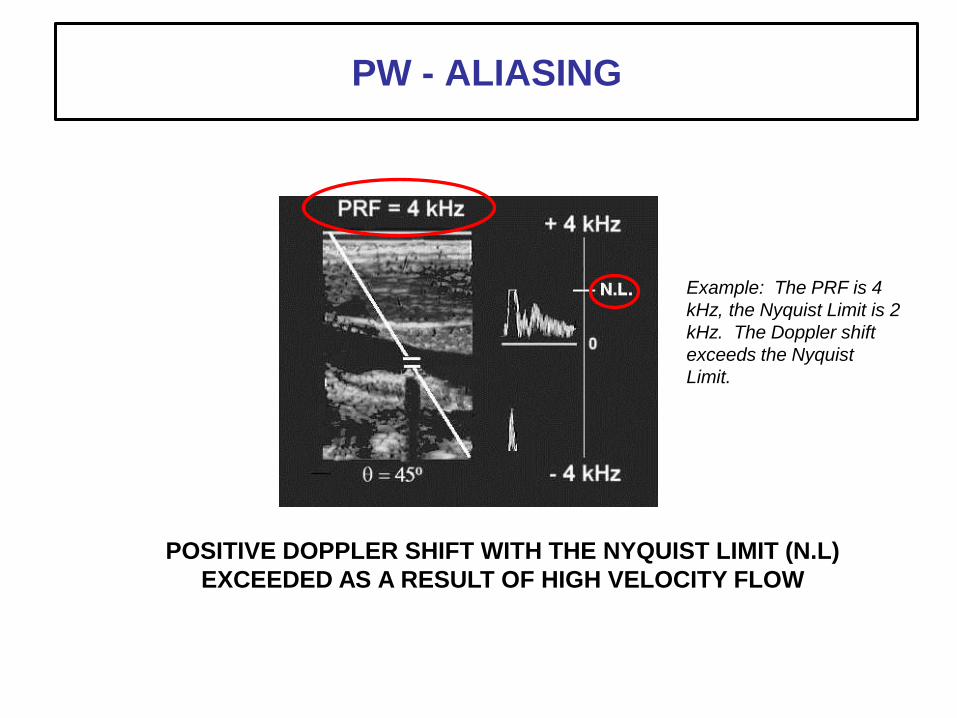
POSITIVE DOPPLER SHIFT WITH THE NYQUIST LIMIT (N.L)
EXCEEDED AS A RESULT OF HIGH VELOCITY FLOW
Example: The PRF is 4
kHz, the Nyquist Limit is 2
kHz. The Doppler shift
exceeds the Nyquist
Limit.
PW - ALIASING
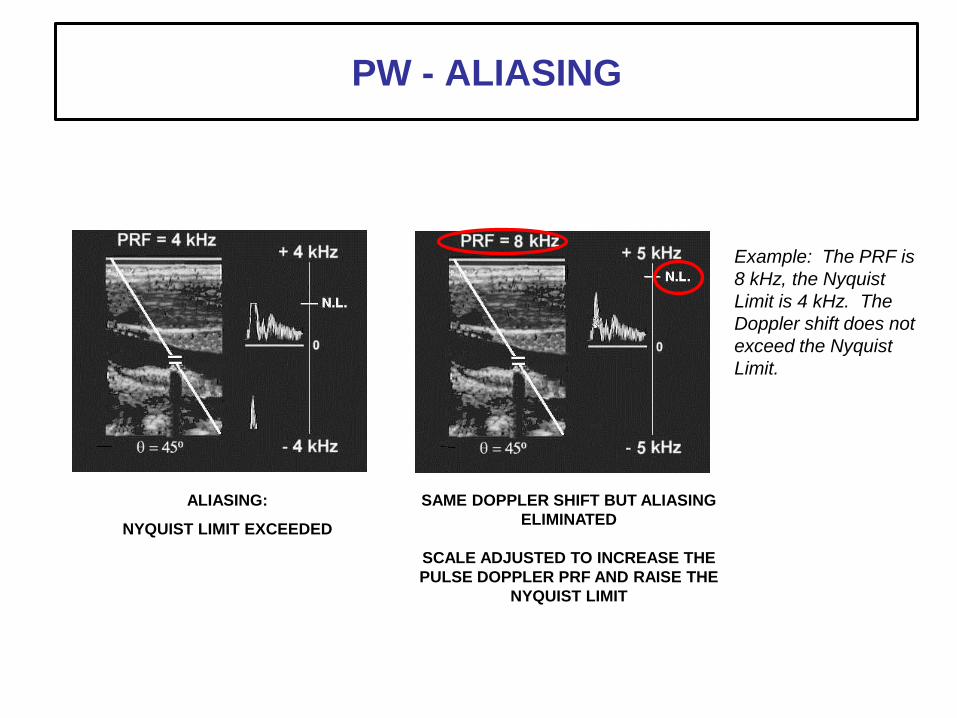
ALIASING:
NYQUIST LIMIT EXCEEDED
SAME DOPPLER SHIFT BUT ALIASING
ELIMINATED
SCALE ADJUSTED TO INCREASE THE
PULSE DOPPLER PRF AND RAISE THE
NYQUIST LIMIT
Example: The PRF is
8 kHz, the Nyquist
Limit is 4 kHz. The
Doppler shift does not
exceed the Nyquist
Limit.
PW - ALIASING
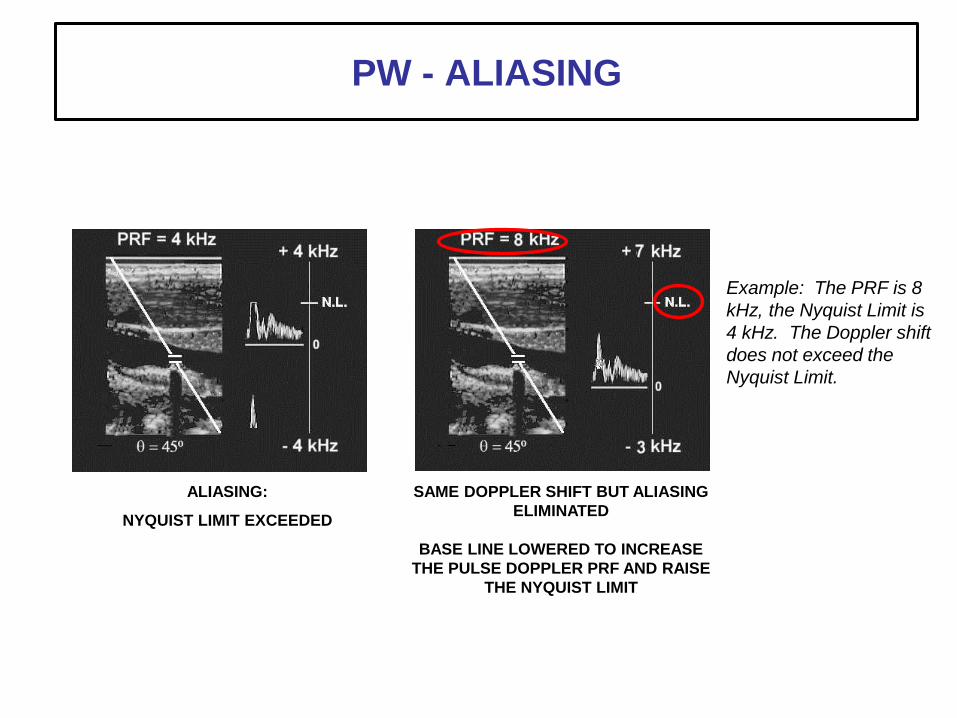
SAME DOPPLER SHIFT BUT ALIASING
ELIMINATED
BASE LINE LOWERED TO INCREASE
THE PULSE DOPPLER PRF AND RAISE
THE NYQUIST LIMIT
ALIASING:
NYQUIST LIMIT EXCEEDED
Example: The PRF is 8
kHz, the Nyquist Limit is
4 kHz. The Doppler shift
does not exceed the
Nyquist Limit.
PW - ALIASING
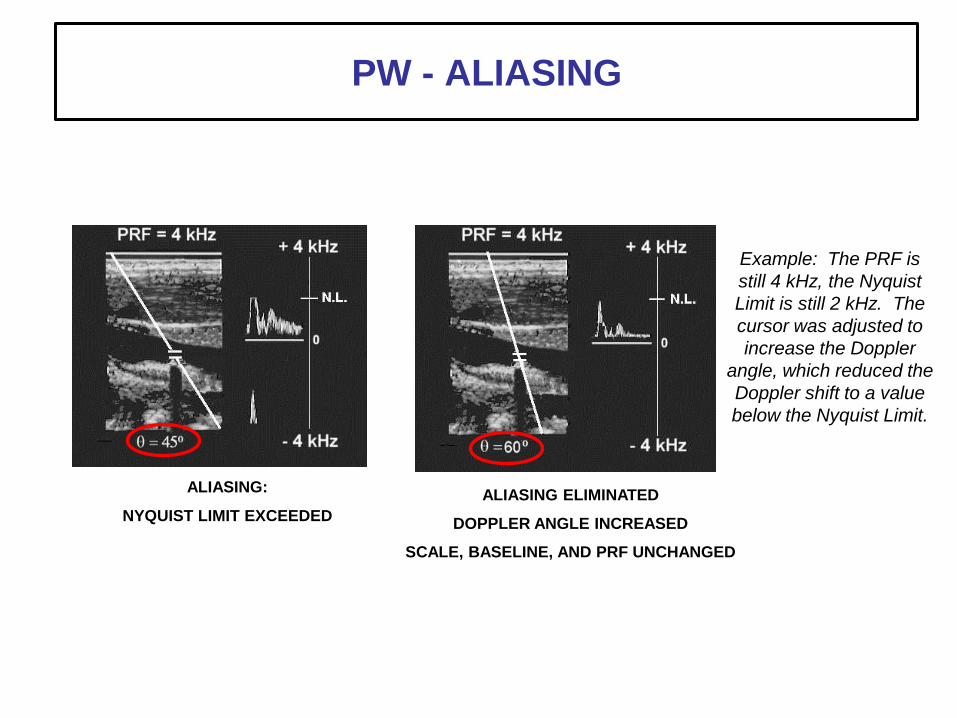
ALIASING ELIMINATED
DOPPLER ANGLE INCREASED
SCALE, BASELINE, AND PRF UNCHANGED
ALIASING:
NYQUIST LIMIT EXCEEDED
Example: The PRF is
still 4 kHz, the Nyquist
Limit is still 2 kHz. The
cursor was adjusted to
increase the Doppler
angle, which reduced the
Doppler shift to a value
below the Nyquist Limit.
PW - ALIASING
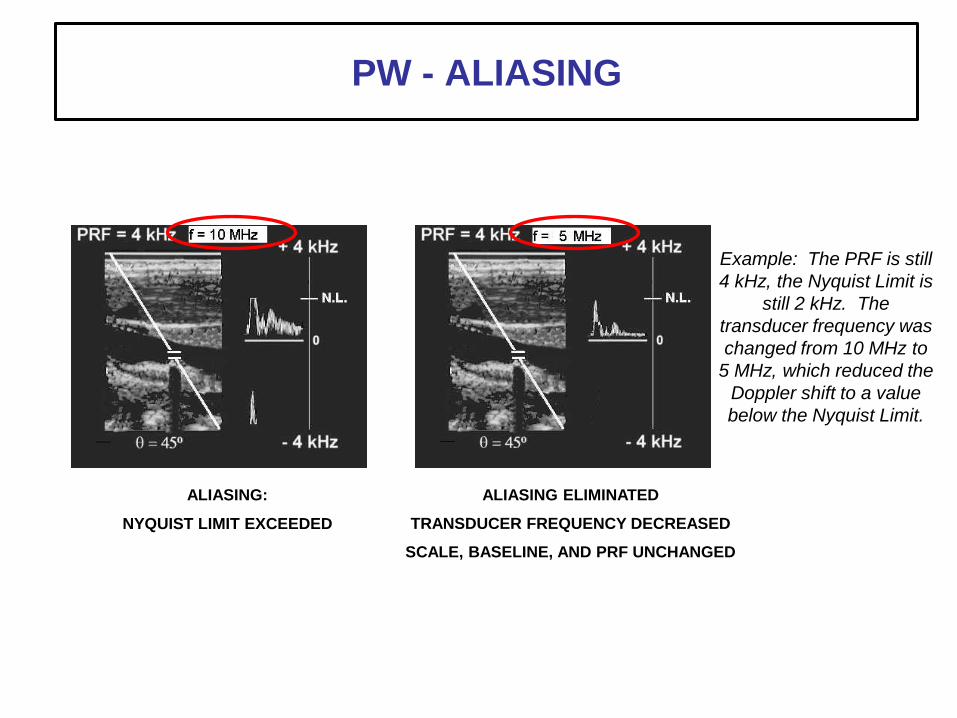
ALIASING:
NYQUIST LIMIT EXCEEDED
PW - ALIASING
Example: The PRF is still
4 kHz, the Nyquist Limit is
still 2 kHz. The
transducer frequency was
changed from 10 MHz to
5 MHz, which reduced the
Doppler shift to a value
below the Nyquist Limit.
ALIASING ELIMINATED
TRANSDUCER FREQUENCY DECREASED
SCALE, BASELINE, AND PRF UNCHANGED
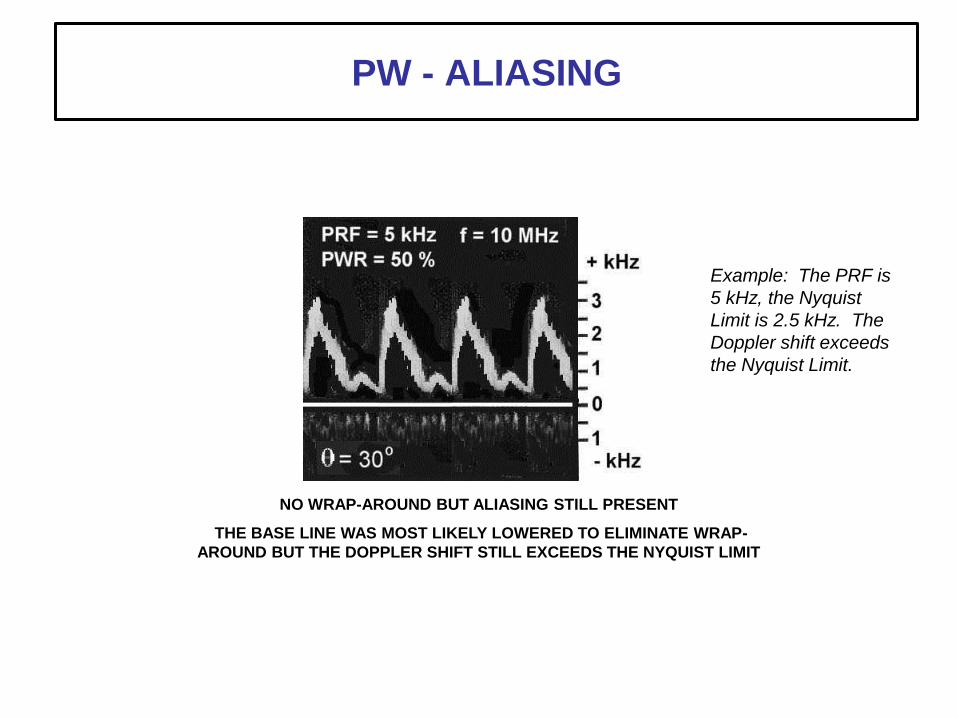
NO WRAP-AROUND BUT ALIASING STILL PRESENT
THE BASE LINE WAS MOST LIKELY LOWERED TO ELIMINATE WRAP-
AROUND BUT THE DOPPLER SHIFT STILL EXCEEDS THE NYQUIST LIMIT
Example: The PRF is
5 kHz, the Nyquist
Limit is 2.5 kHz. The
Doppler shift exceeds
the Nyquist Limit.
PW - ALIASING
THE NYQUIST LIMIT
IS EQUAL TO
THE DOPPLER PRF
DIVIDED BY
2
NYQUIST LIMIT
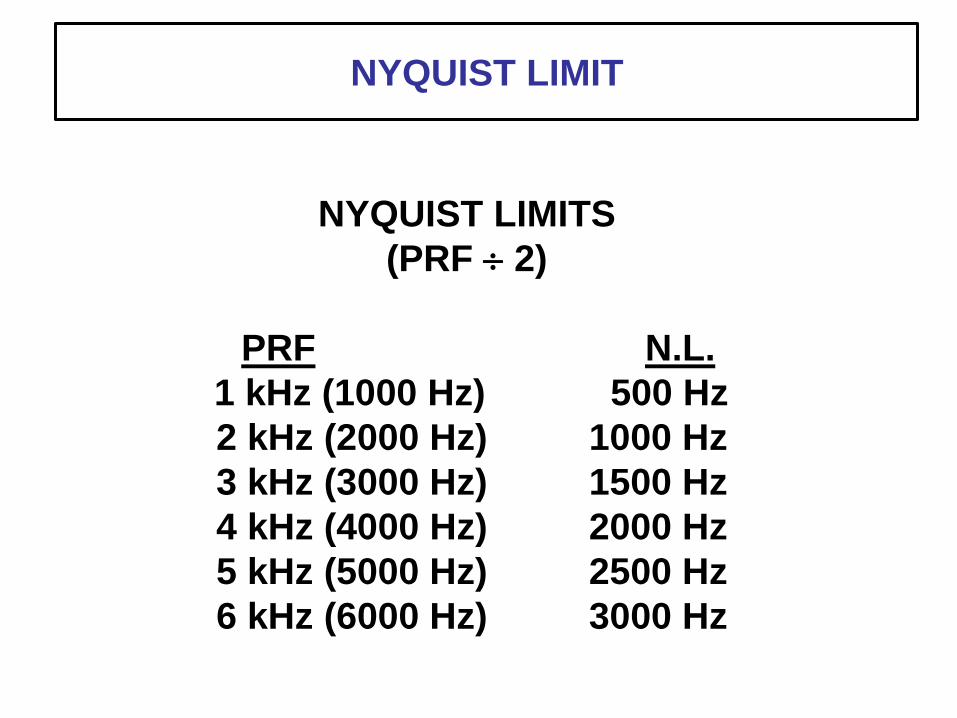
NYQUIST LIMITS
(PRF 2)
PRF N.L.
1 kHz (1000 Hz) 500 Hz
2 kHz (2000 Hz) 1000 Hz
3 kHz (3000 Hz) 1500 Hz
4 kHz (4000 Hz) 2000 Hz
5 kHz (5000 Hz) 2500 Hz
6 kHz (6000 Hz) 3000 Hz
NYQUIST LIMIT
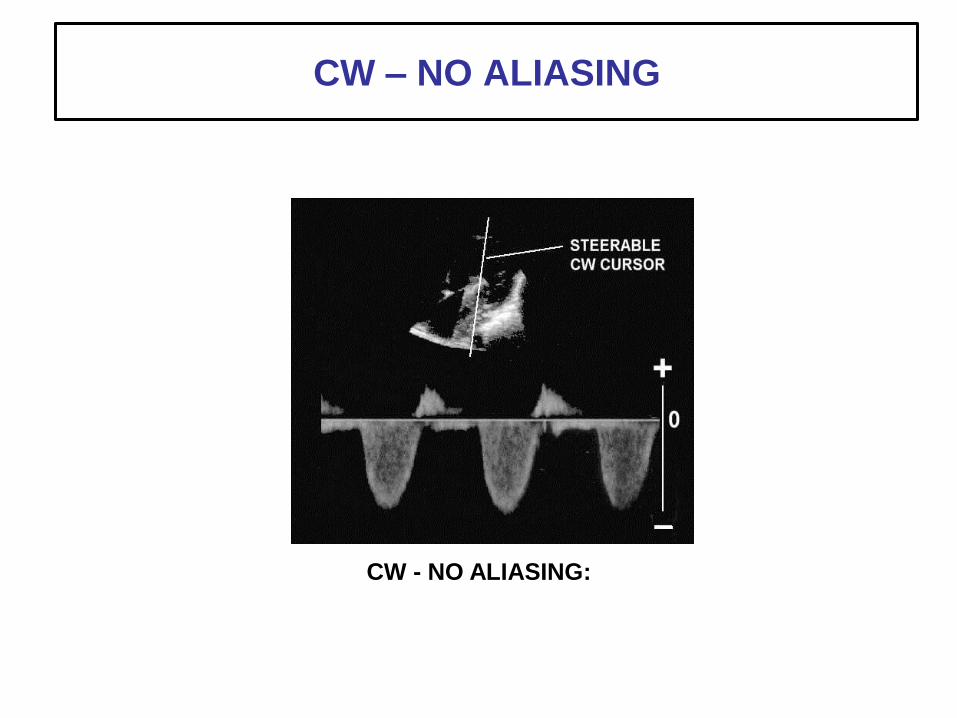
CW - NO ALIASING:
CW – NO ALIASING
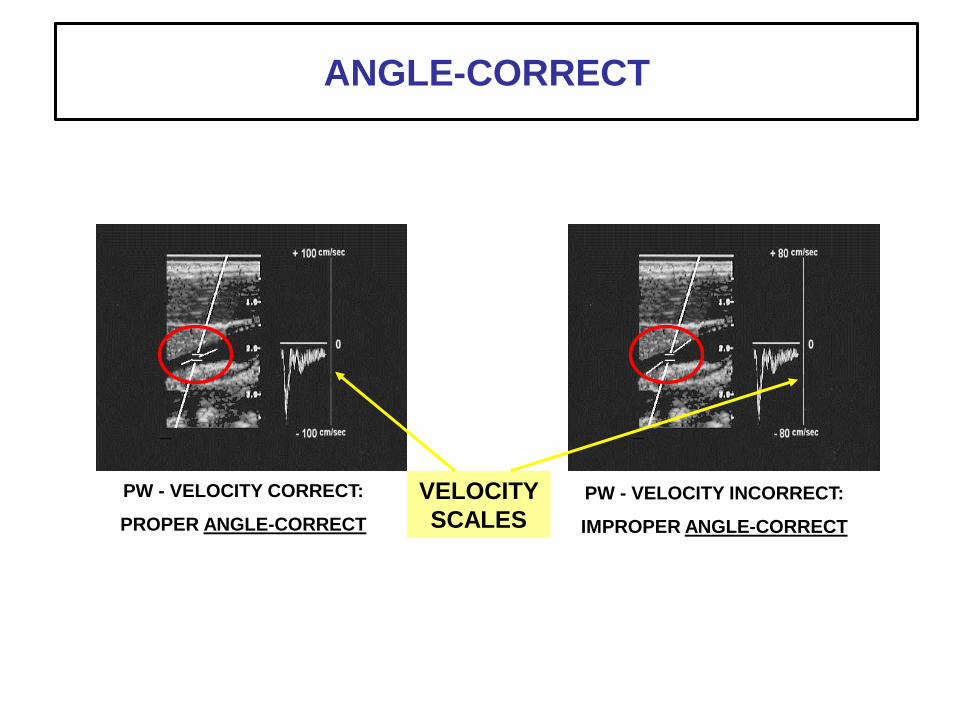
PW - VELOCITY CORRECT:
PROPER ANGLE-CORRECT
PW - VELOCITY INCORRECT:
IMPROPER ANGLE-CORRECT
VELOCITY
SCALES
ANGLE-CORRECT
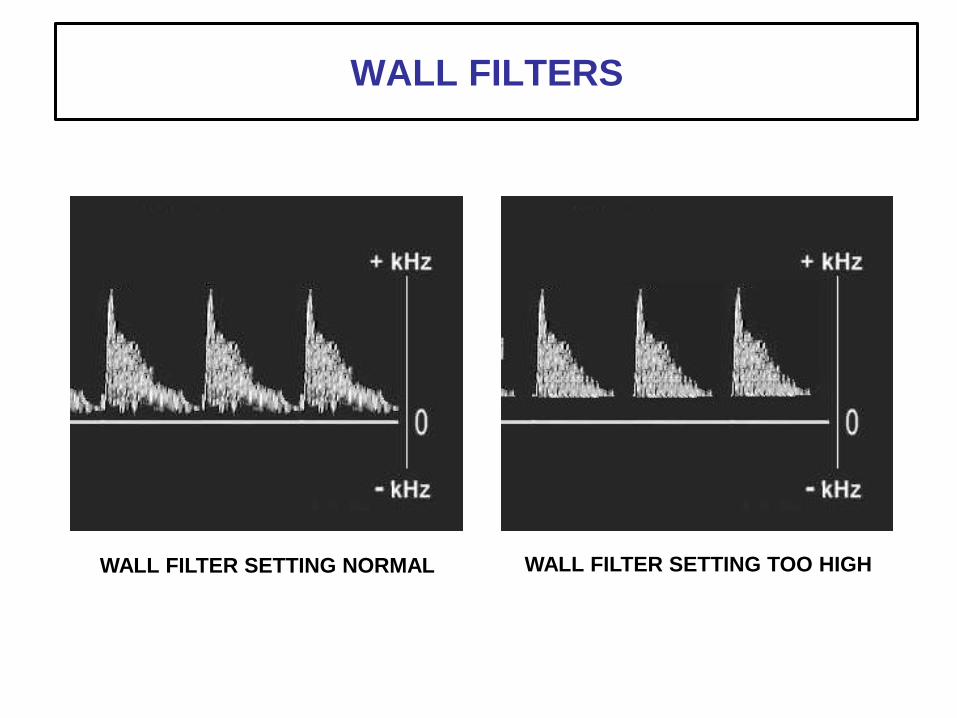
WALL FILTER SETTING NORMAL WALL FILTER SETTING TOO HIGH
WALL FILTERS
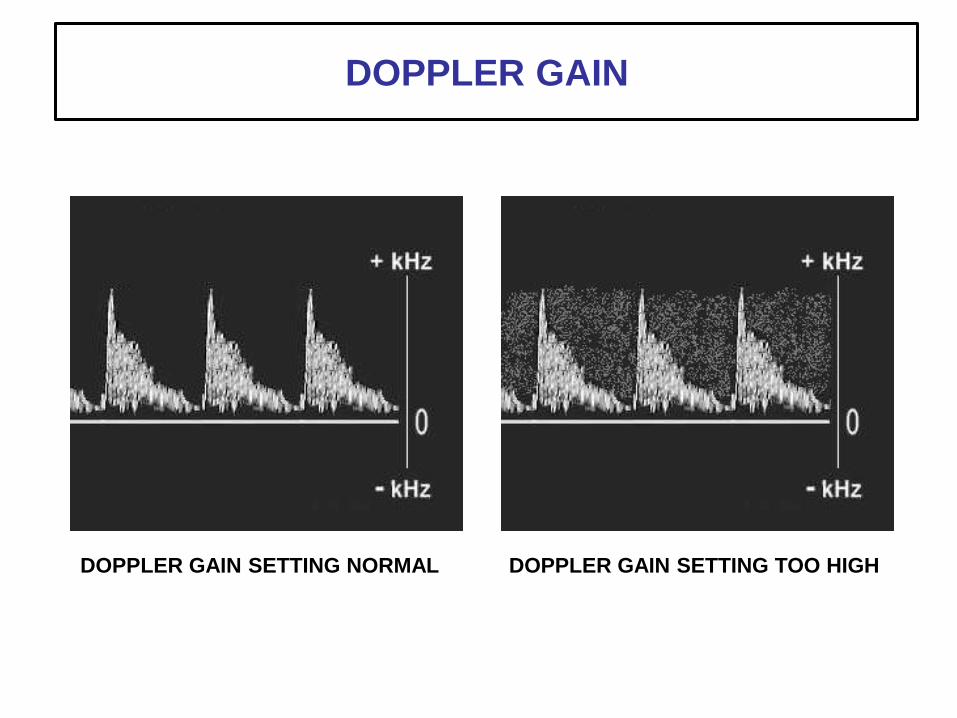
DOPPLER GAIN SETTING NORMAL DOPPLER GAIN SETTING TOO HIGH
DOPPLER GAIN
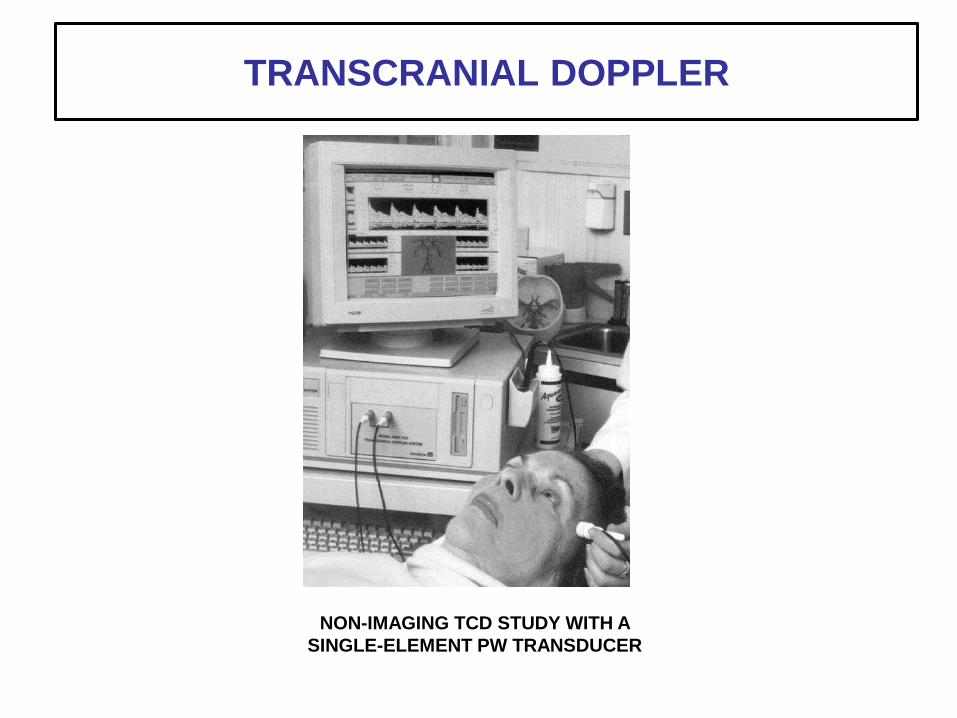
TRANSCRANIAL DOPPLER
NON-IMAGING TCD STUDY WITH A
SINGLE-ELEMENT PW TRANSDUCER
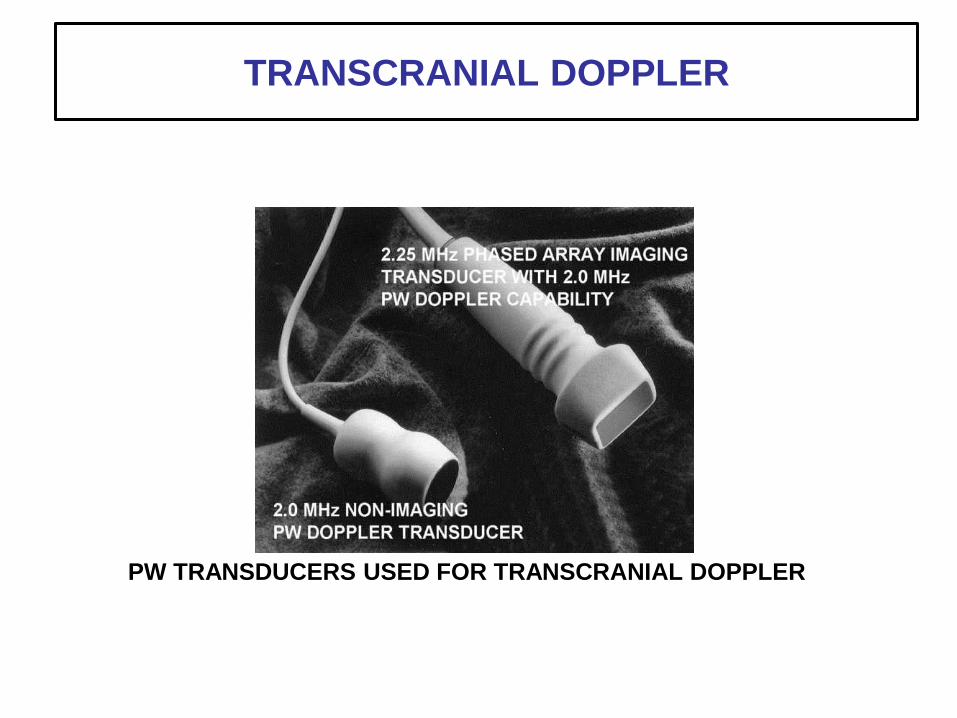
PW TRANSDUCERS USED FOR TRANSCRANIAL DOPPLER
TRANSCRANIAL DOPPLER
Non-spectral
ANALOG DOPPLER
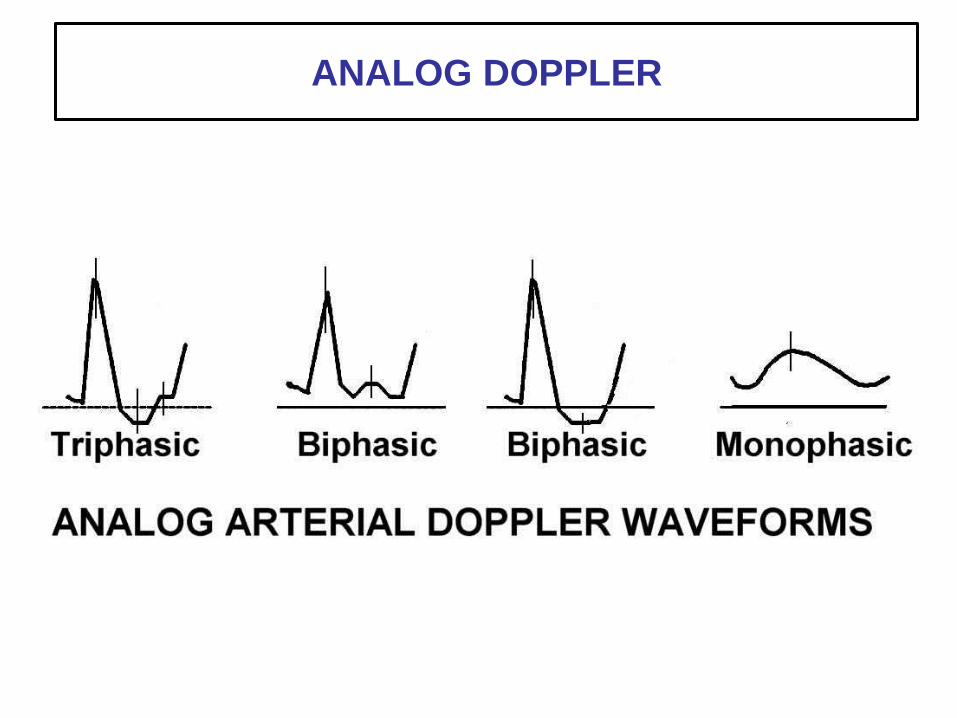
ANALOG DOPPLER
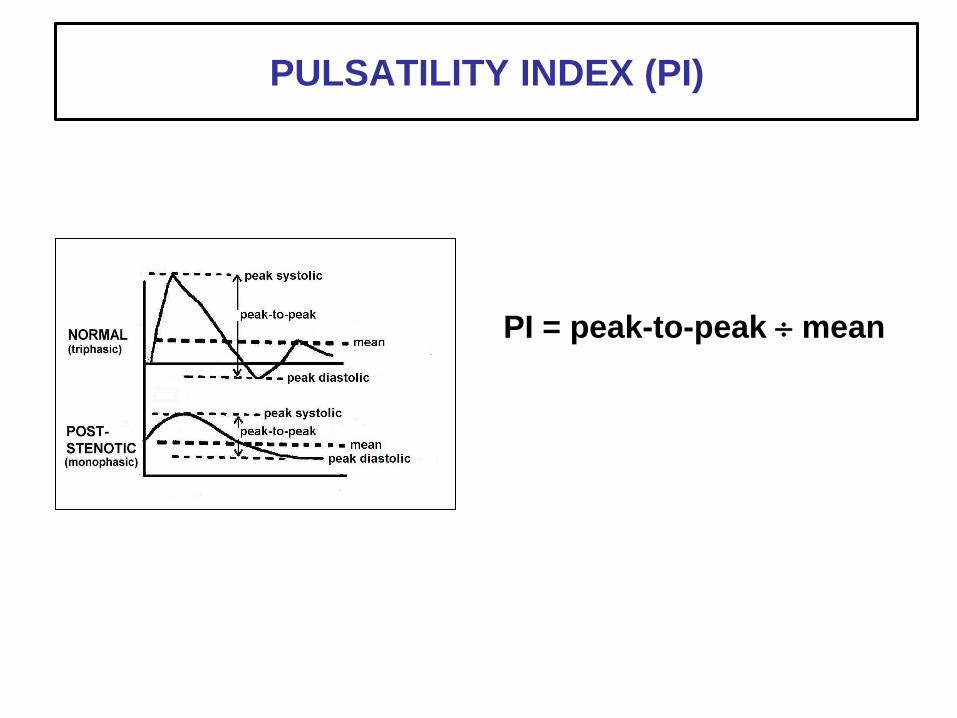
PI = peak-to-peak mean
PULSATILITY INDEX (PI)
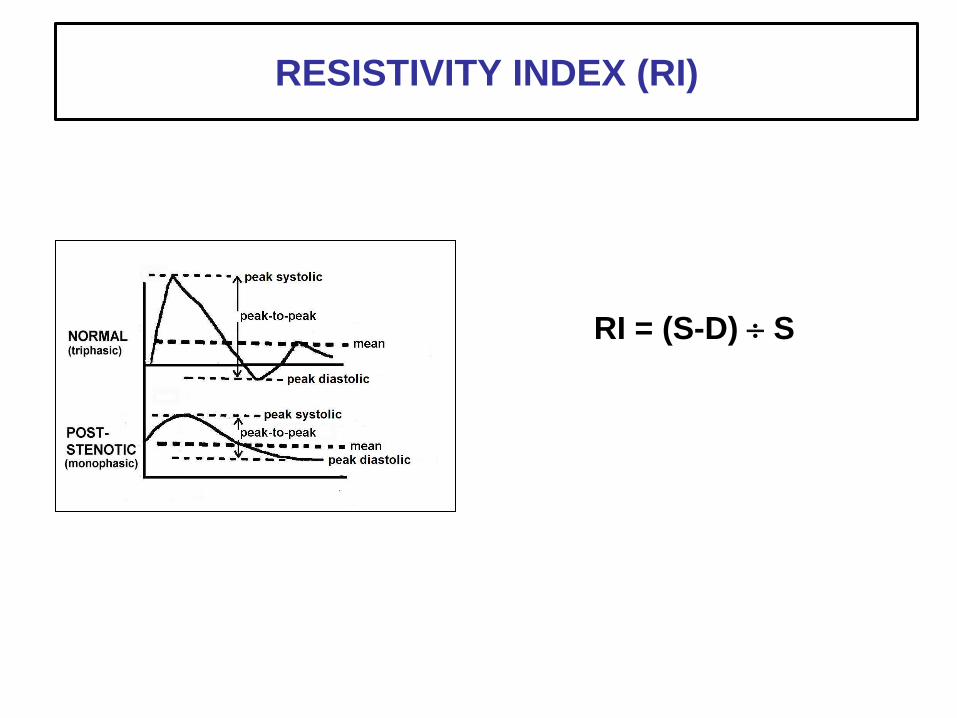
RI = (S-D) S
RESISTIVITY INDEX (RI)
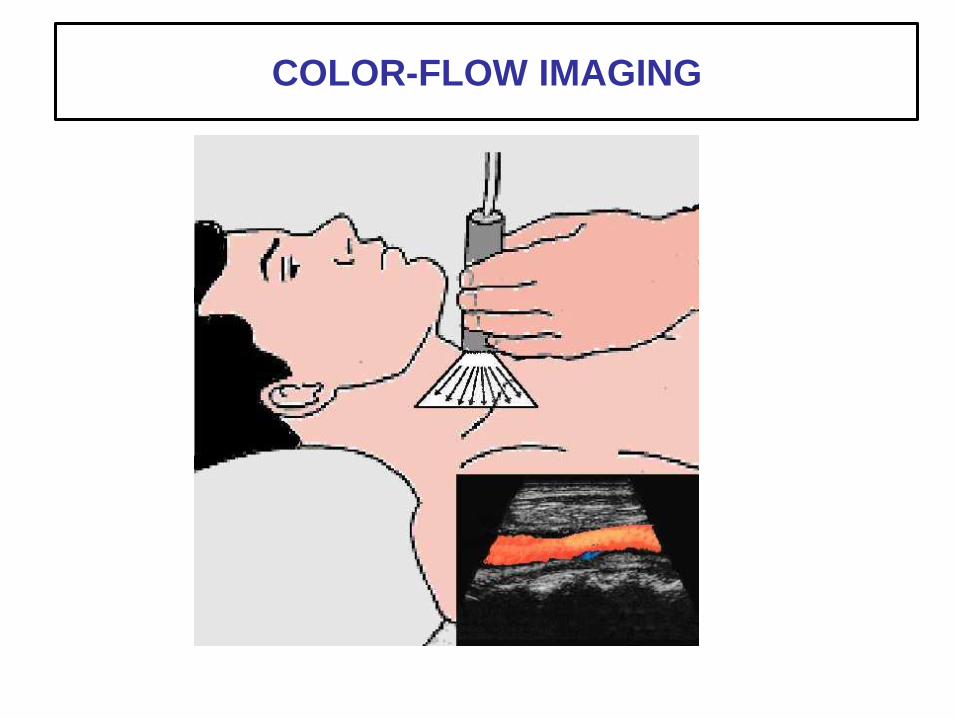
COLOR-FLOW IMAGING
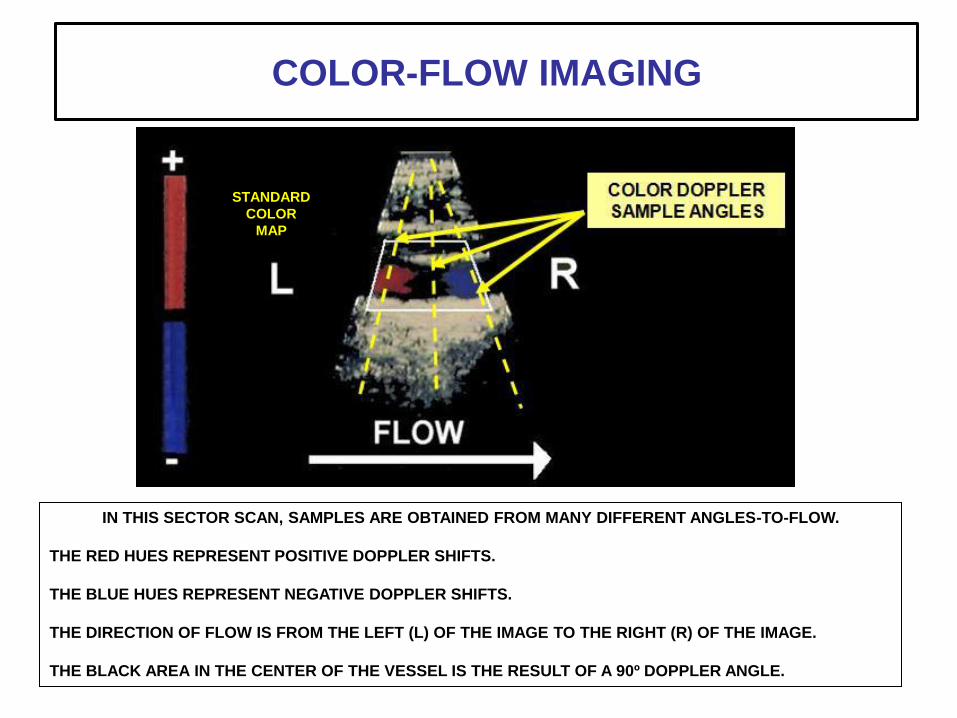
IN THIS SECTOR SCAN, SAMPLES ARE OBTAINED FROM MANY DIFFERENT ANGLES-TO-FLOW.
THE RED HUES REPRESENT POSITIVE DOPPLER SHIFTS.
THE BLUE HUES REPRESENT NEGATIVE DOPPLER SHIFTS.
THE DIRECTION OF FLOW IS FROM THE LEFT (L) OF THE IMAGE TO THE RIGHT (R) OF THE IMAGE.
THE BLACK AREA IN THE CENTER OF THE VESSEL IS THE RESULT OF A 90º DOPPLER ANGLE.
COLOR-FLOW IMAGING
STANDARD
COLOR
MAP
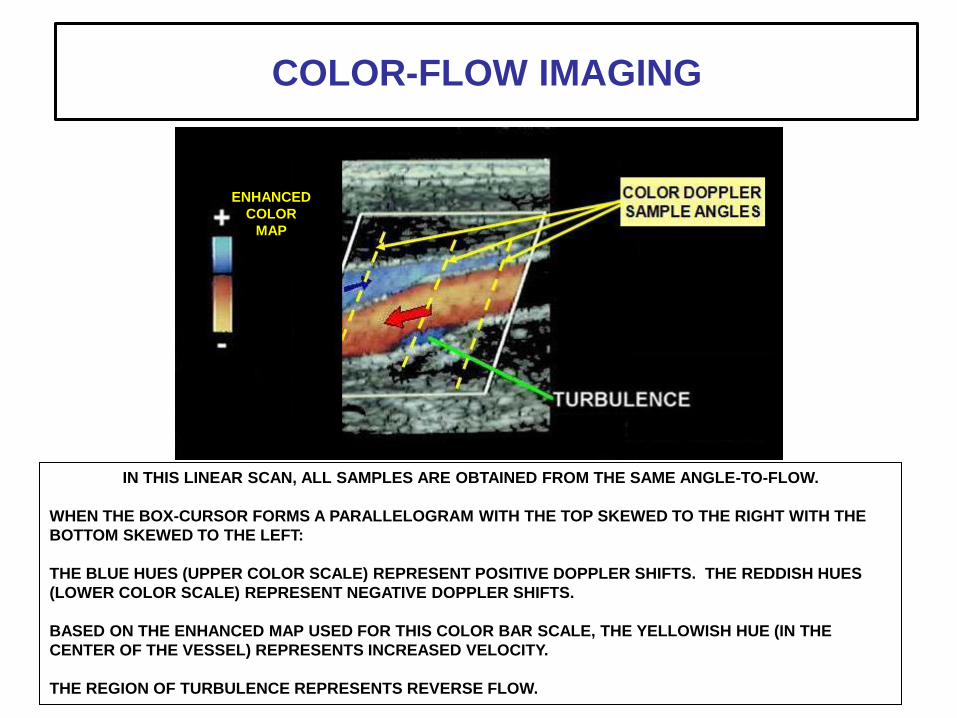
IN THIS LINEAR SCAN, ALL SAMPLES ARE OBTAINED FROM THE SAME ANGLE-TO-FLOW.
WHEN THE BOX-CURSOR FORMS A PARALLELOGRAM WITH THE TOP SKEWED TO THE RIGHT WITH THE
BOTTOM SKEWED TO THE LEFT:
THE BLUE HUES (UPPER COLOR SCALE) REPRESENT POSITIVE DOPPLER SHIFTS. THE REDDISH HUES
(LOWER COLOR SCALE) REPRESENT NEGATIVE DOPPLER SHIFTS.
BASED ON THE ENHANCED MAP USED FOR THIS COLOR BAR SCALE, THE YELLOWISH HUE (IN THE
CENTER OF THE VESSEL) REPRESENTS INCREASED VELOCITY.
THE REGION OF TURBULENCE REPRESENTS REVERSE FLOW.
COLOR-FLOW IMAGING
ENHANCED
COLOR
MAP
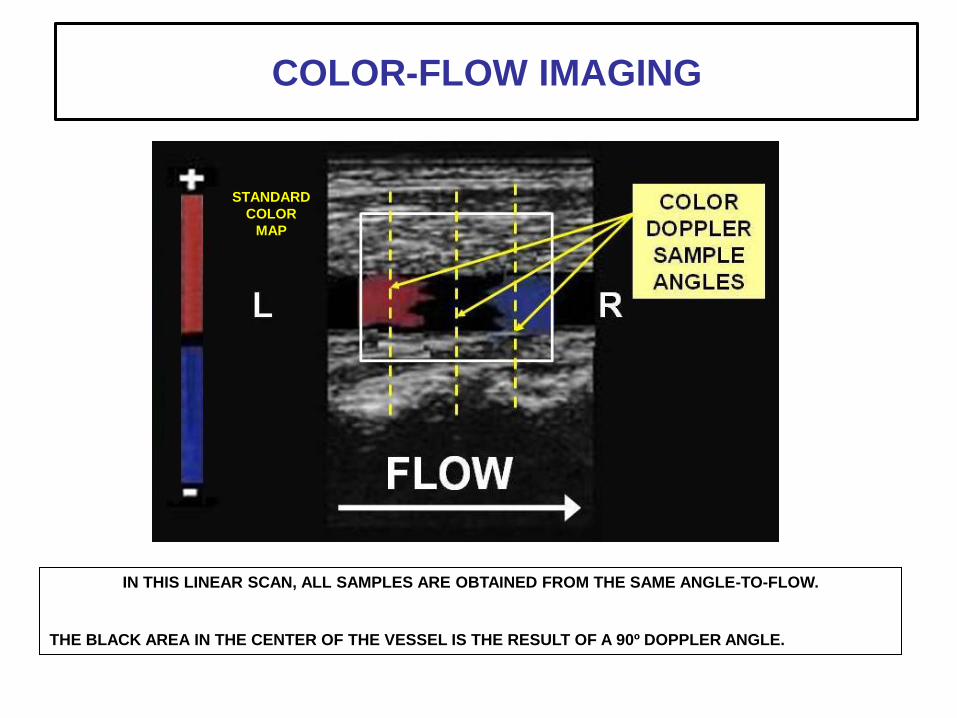
IN THIS LINEAR SCAN, ALL SAMPLES ARE OBTAINED FROM THE SAME ANGLE-TO-FLOW.
THE BLACK AREA IN THE CENTER OF THE VESSEL IS THE RESULT OF A 90º DOPPLER ANGLE.
COLOR-FLOW IMAGING
STANDARD
COLOR
MAP
COLOR-FLOW IMAGING
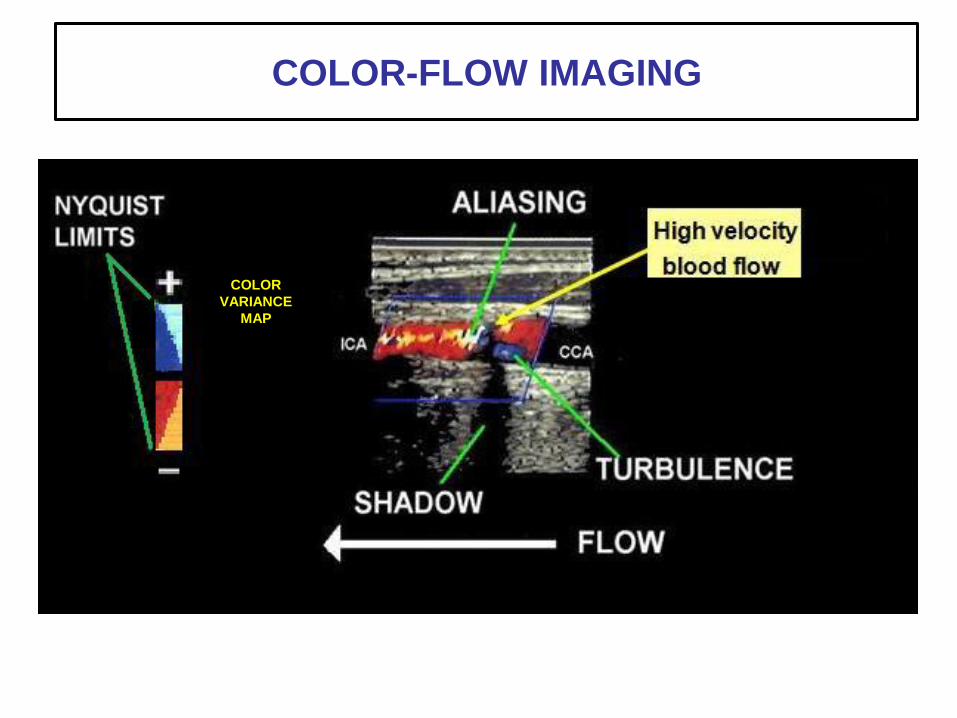
COLOR
VARIANCE
MAP
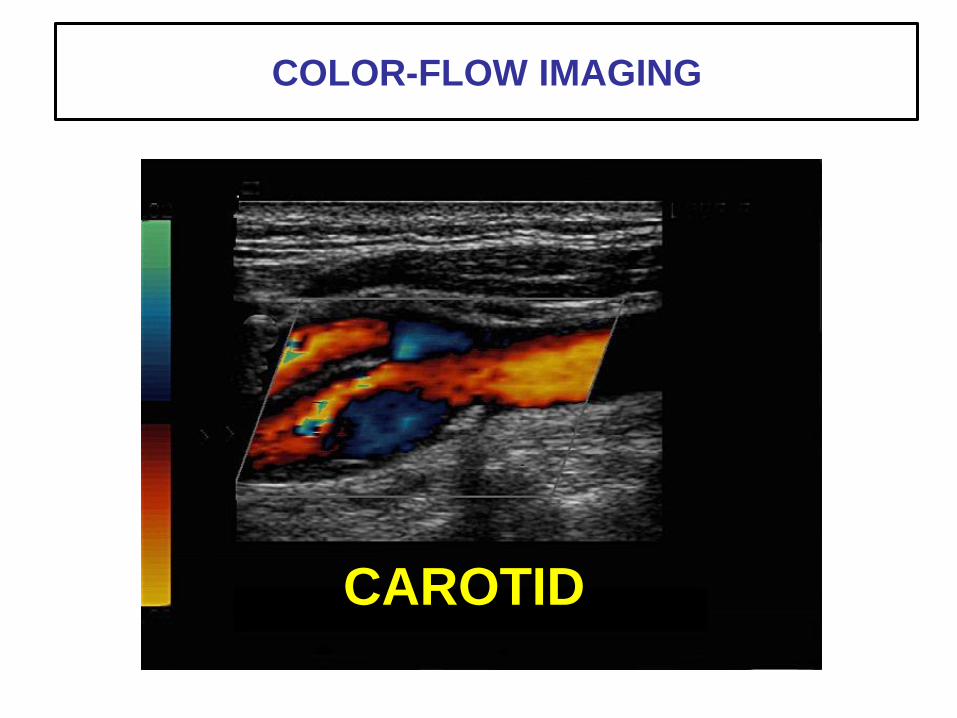
CAROTID
COLOR-FLOW IMAGING
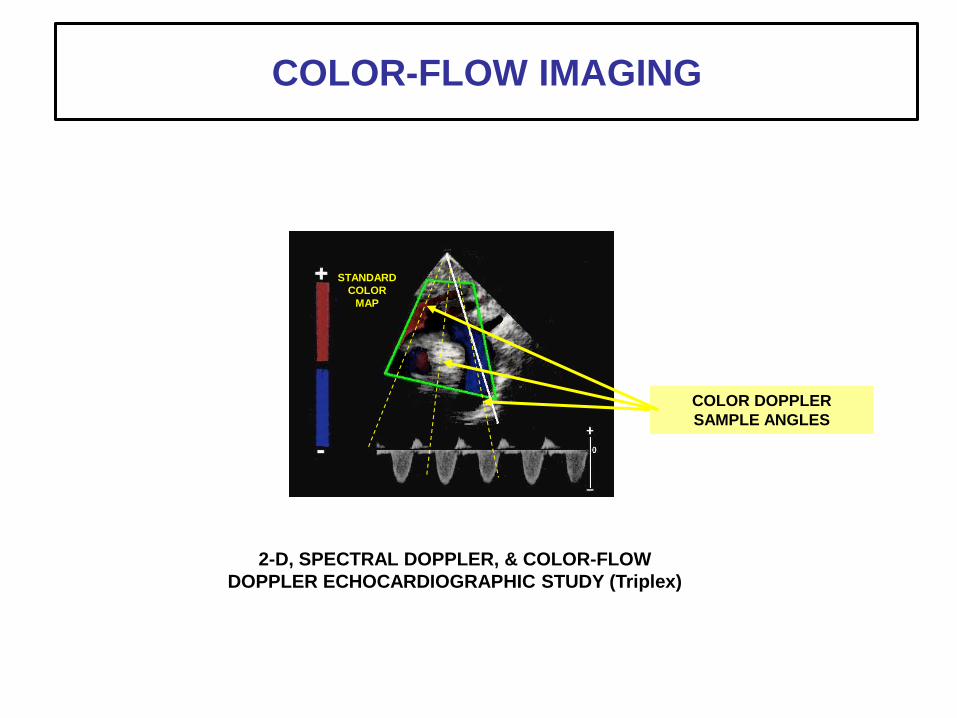
2-D, SPECTRAL DOPPLER, & COLOR-FLOW
DOPPLER ECHOCARDIOGRAPHIC STUDY (Triplex)
COLOR DOPPLER
SAMPLE ANGLES
COLOR-FLOW IMAGING
STANDARD
COLOR
MAP
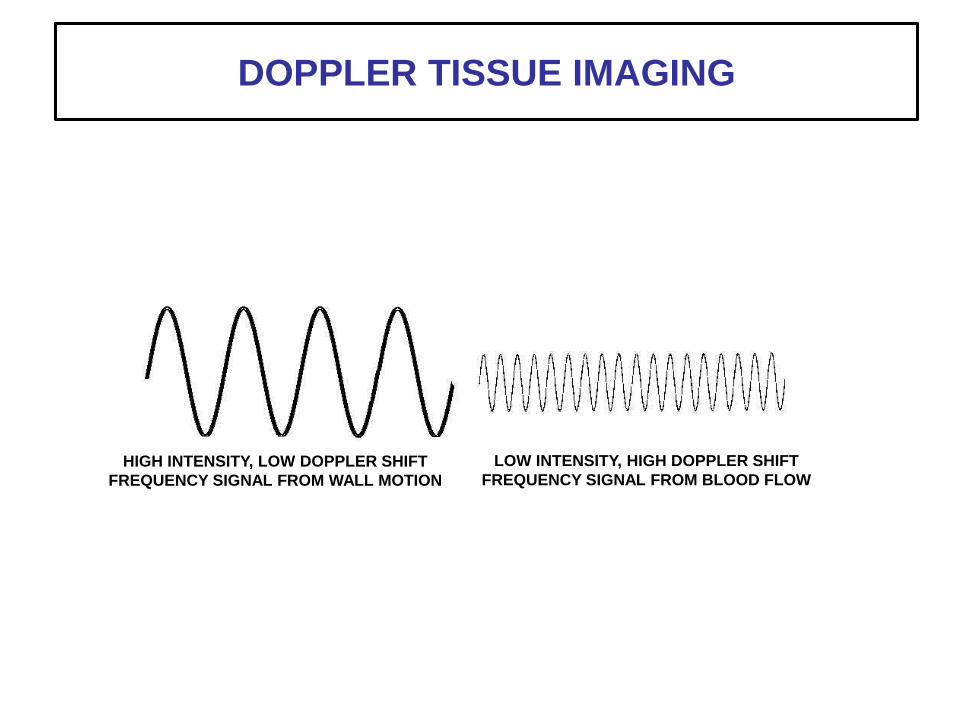
HIGH INTENSITY, LOW DOPPLER SHIFT
FREQUENCY SIGNAL FROM WALL MOTION
LOW INTENSITY, HIGH DOPPLER SHIFT
FREQUENCY SIGNAL FROM BLOOD FLOW
DOPPLER TISSUE IMAGING
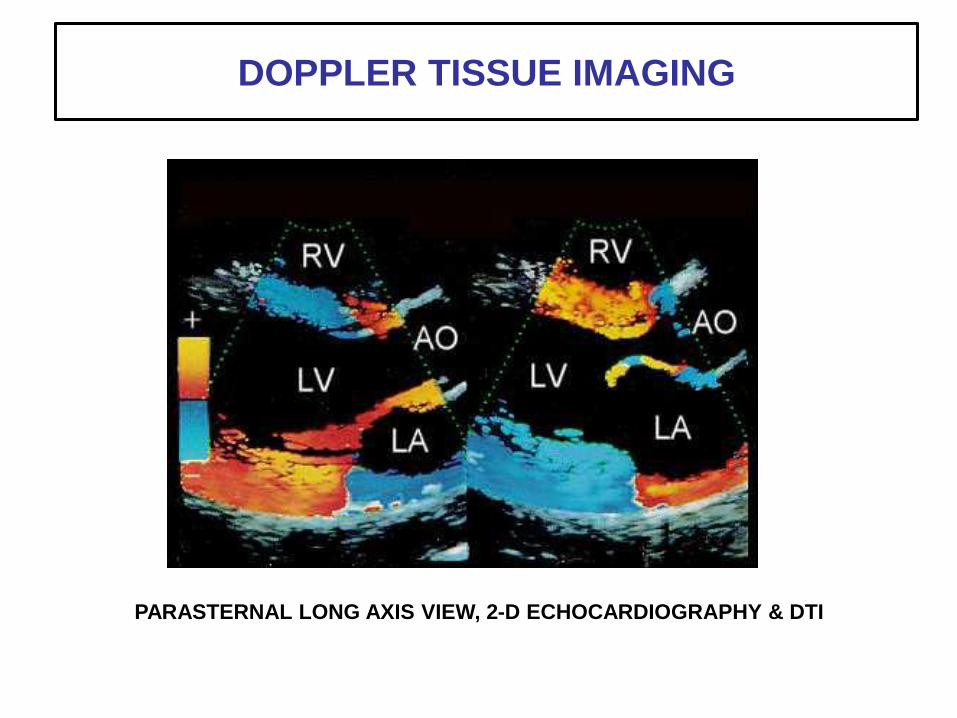
PARASTERNAL LONG AXIS VIEW, 2-D ECHOCARDIOGRAPHY & DTI
DOPPLER TISSUE IMAGING
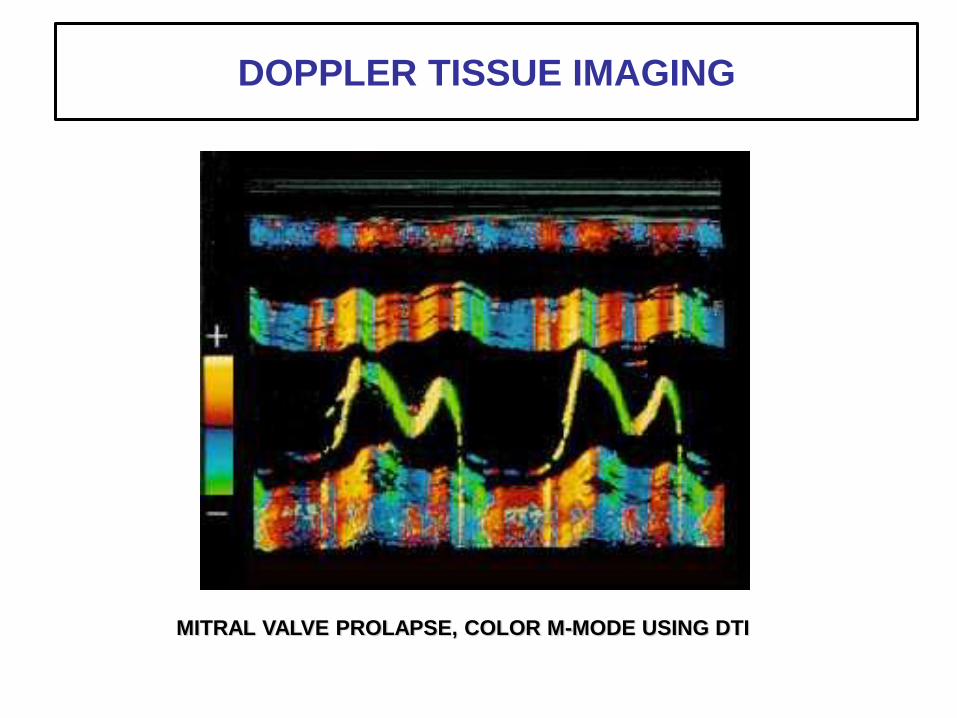
MITRAL VALVE PROLAPSE, COLOR M-MODE USING DTI
DOPPLER TISSUE IMAGING
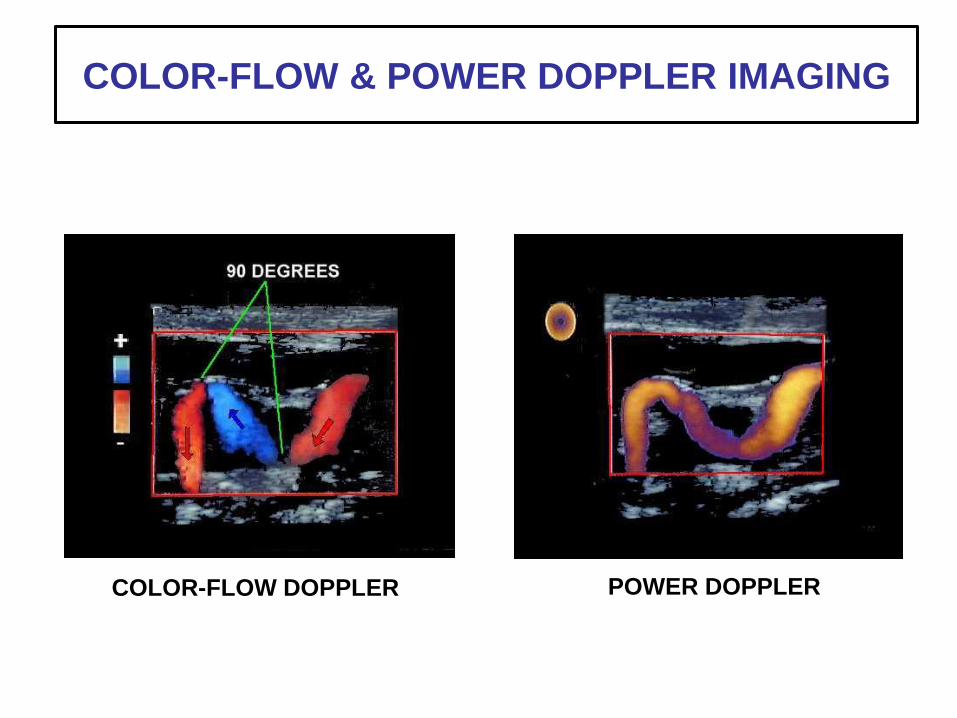
COLOR-FLOW DOPPLER POWER DOPPLER
COLOR-FLOW & POWER DOPPLER IMAGING
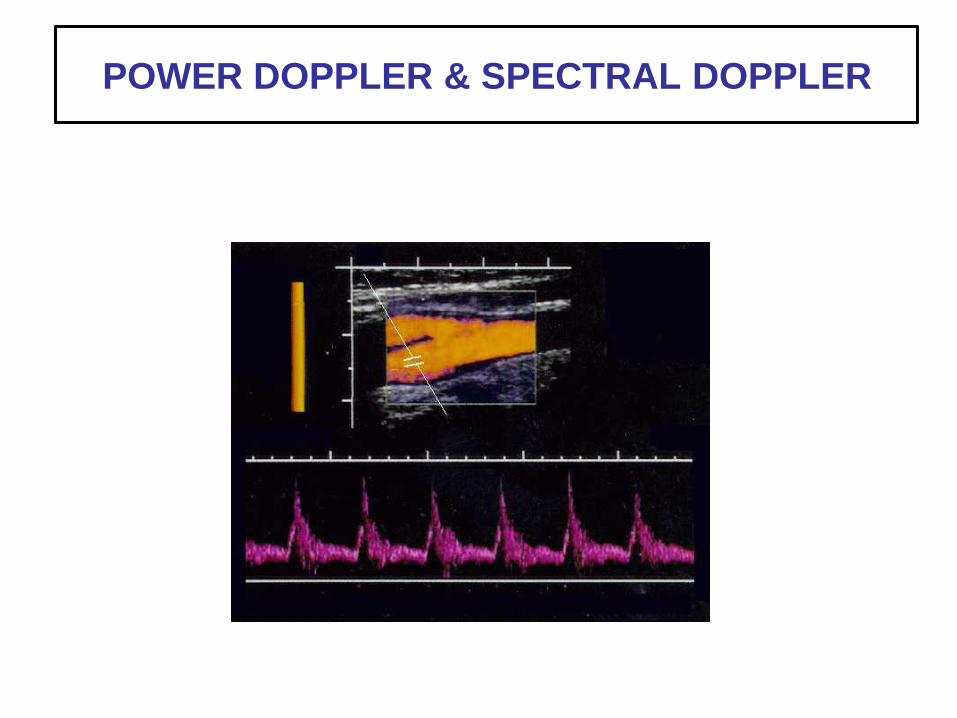
POWER DOPPLER & SPECTRAL DOPPLER
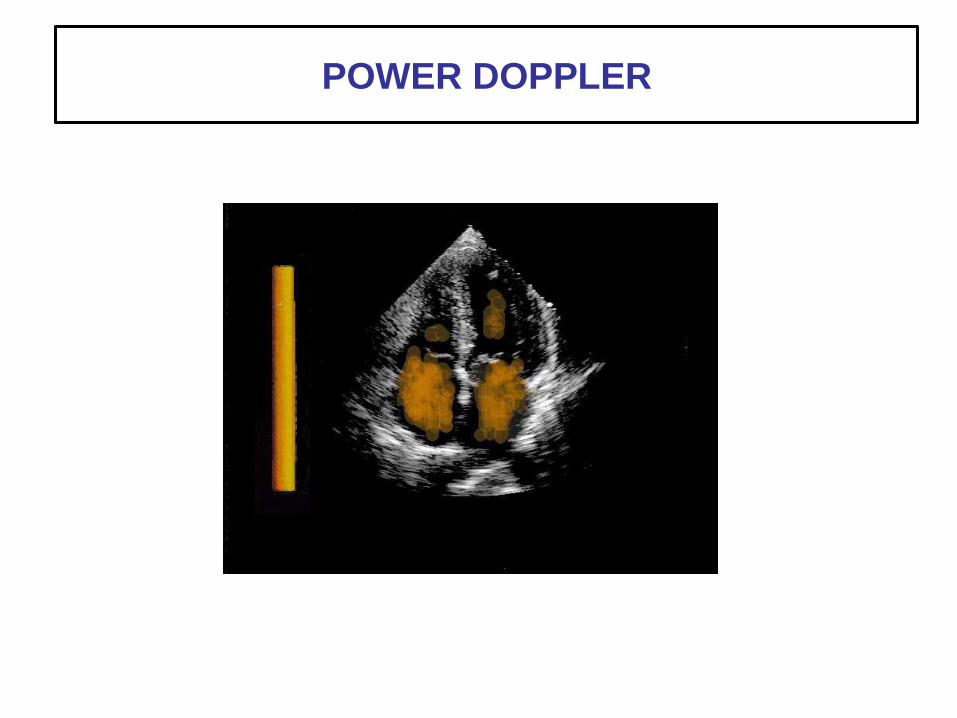
POWER DOPPLER
Answers to the following
TWENTY SIX practice
questions were derived
from material in the
textbook:
Question 1
The Doppler shift from moving reflectors is
lowest when the Doppler angle is close to zero
the sum of the transmitted and received frequencies
high if the Doppler angle is 90 degrees
the difference between the transmitted and received
frequencies
Page 59
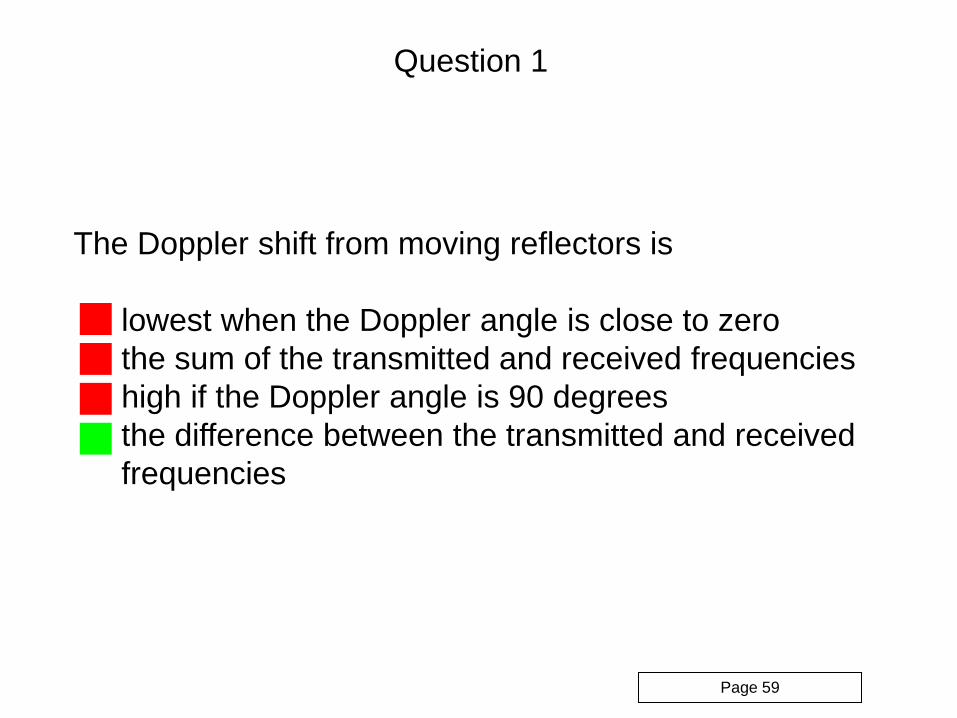
Question 1
The Doppler shift from moving reflectors is
lowest when the Doppler angle is close to zero
the sum of the transmitted and received frequencies
high if the Doppler angle is 90 degrees
the difference between the transmitted and received
frequencies
Page 59
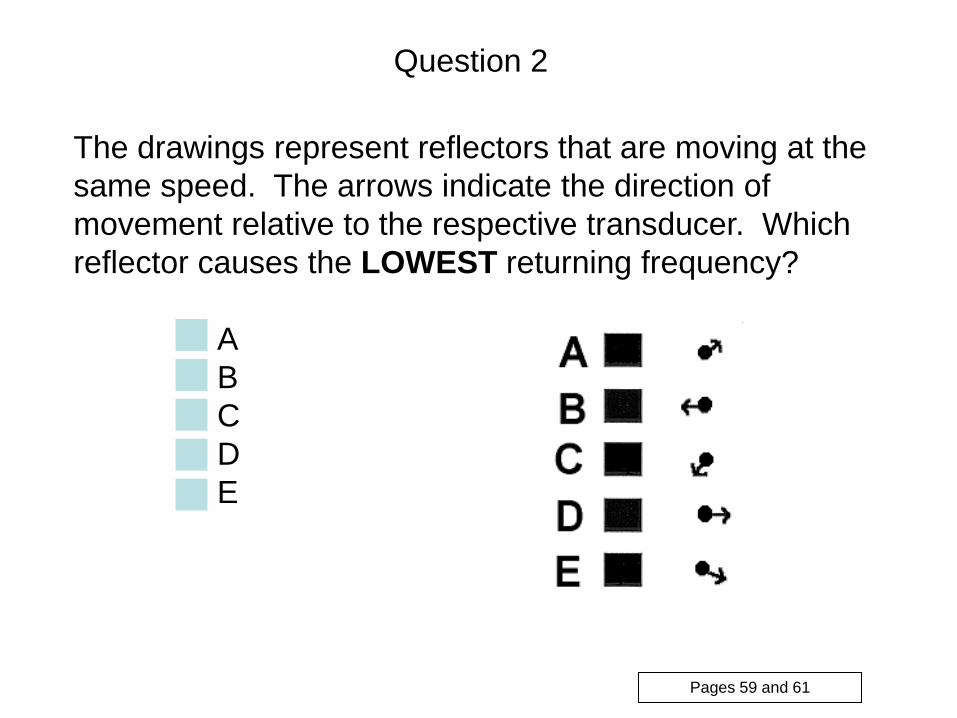
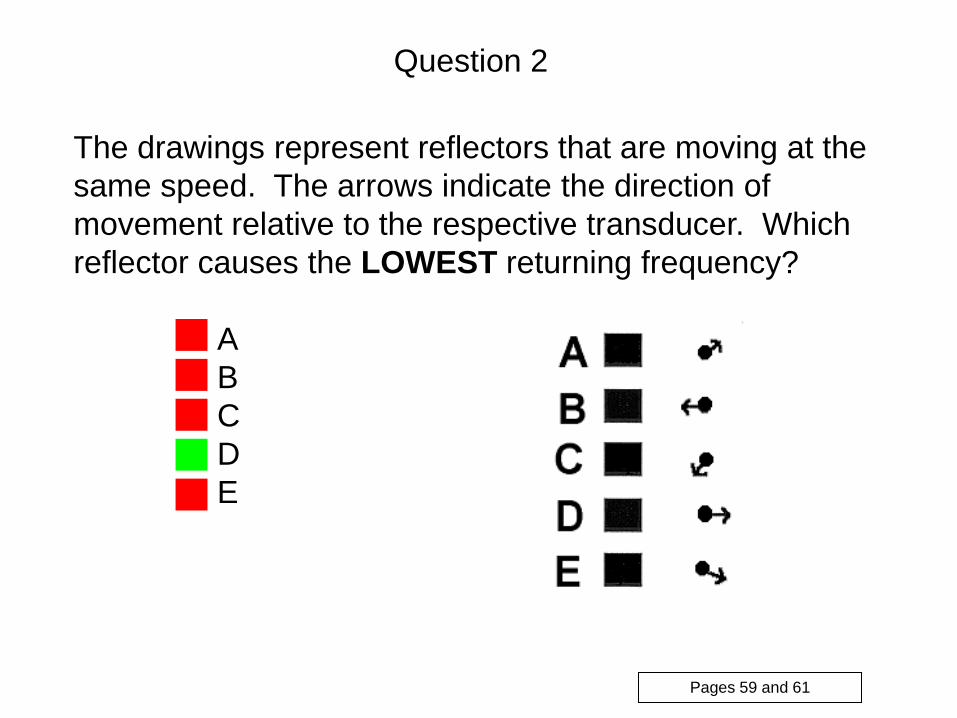
The drawings represent reflectors that are moving at the
same speed. The arrows indicate the direction of
movement relative to the respective transducer. Which
reflector causes the LOWEST returning frequency?
A
B
C
D
E
Question 2
Pages 59 and 61
The drawings represent reflectors that are moving at the
same speed. The arrows indicate the direction of
movement relative to the respective transducer. Which
reflector causes the LOWEST returning frequency?
A
B
C
D
E
Question 2
Pages 59 and 61
A Doppler system measures
frequency shift and calculates blood velocity
frequency shift and calculates sound velocity
frequency shift and calculates attenuation
blood velocity and calculates frequency shift
frequency shift and measures blood velocity
Question 3
Page 60
A Doppler system measures
frequency shift and calculates blood velocity
frequency shift and calculates sound velocity
frequency shift and calculates attenuation
blood velocity and calculates frequency shift
frequency shift and measures blood velocity
Question 3
Page 60
Which one of the following factors does NOT affect the
frequency of the Doppler shift?
size of the Doppler probe
angle at which the probe is pointed at the vessel
velocity of blood in the vessel
speed of ultrasound in tissue
transmitted frequency
Question 4
Page 60
Which one of the following factors does NOT affect the
frequency of the Doppler shift?
size of the Doppler probe
angle at which the probe is pointed at the vessel
velocity of blood in the vessel
speed of ultrasound in tissue
transmitted frequency
Question 4
Page 60
An advantage of continuous wave Doppler over pulsed
Doppler is
a lower Nyquist limit
spectral analysis is not required
a wider range of shift frequencies without aliasing
depth selectivity is possible
a lower Doppler PRF may be used
Question 5
Page 63
An advantage of continuous wave Doppler over pulsed
Doppler is
a lower Nyquist limit
spectral analysis is not required
a wider range of shift frequencies without aliasing
depth selectivity is possible
a lower Doppler PRF may be used
Question 5
Page 63
Aliasing will NOT occur if the Doppler shift
does not exceed the Nyquist limit
exceeds one-half the PRF
exceeds the Nyquist limit
exceeds the PRF
Question 6
Pages 66 through 68
Aliasing will NOT occur if the Doppler shift
does not exceed the Nyquist limit
exceeds one-half the PRF
exceeds the Nyquist limit
exceeds the PRF
Question 6
Pages 66 through 68
A low PRF, when using pulsed Doppler
will not result in aliasing if the Doppler shift is higher
than the PRF
increases the chances for range ambiguity
may result in aliasing when high velocity blood flow
is present
permits detection of a wider range of shift
frequencies than with CW Doppler
will not result in aliasing when high velocity blood
flow is present
Question 7
Pages 66 through 68
What causes the problem in this PW spectral display?
depth ambiguity
transducer frequency too low
aliasing
spectral broadening
excessive output power
Question 8
Pages 66 through 68
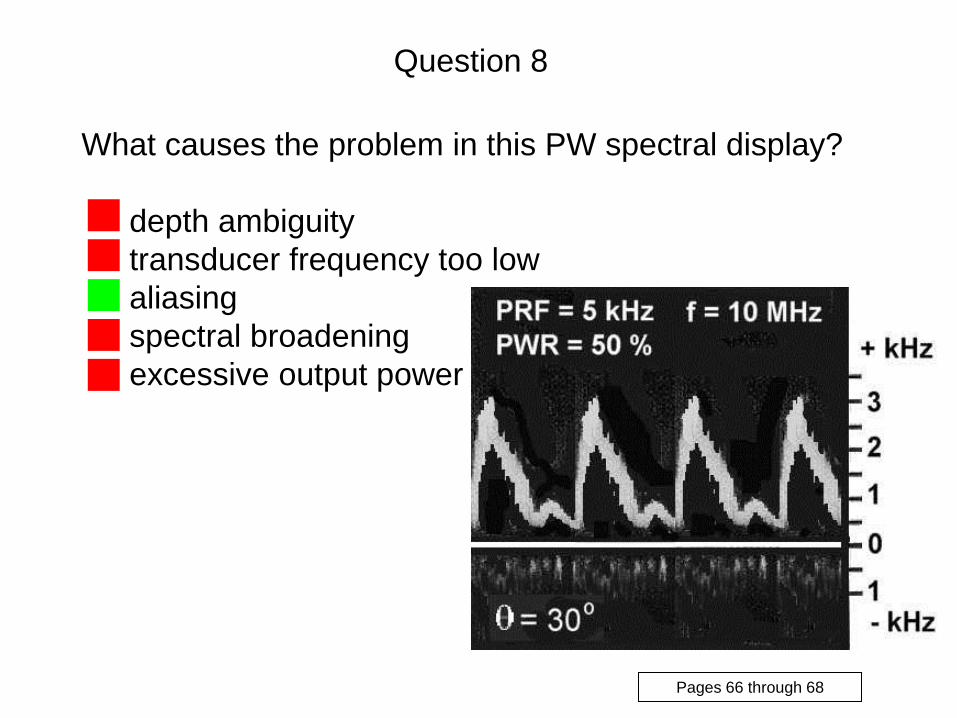
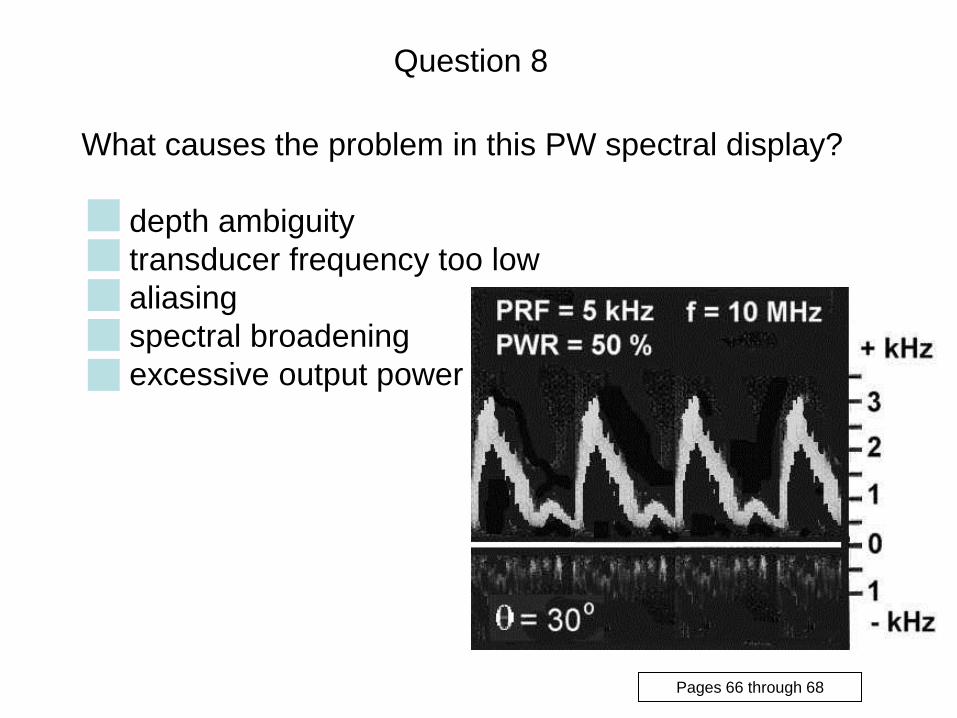
What causes the problem in this PW spectral display?
depth ambiguity
transducer frequency too low
aliasing
spectral broadening
excessive output power
Question 8
Pages 66 through 68
What can be done to correct the problem in the spectral
display?
use a higher frequency transducer
decrease the output power
use pulsed Doppler
increase the Doppler angle
decrease the PRF
Question 9
Pages 66 through 68
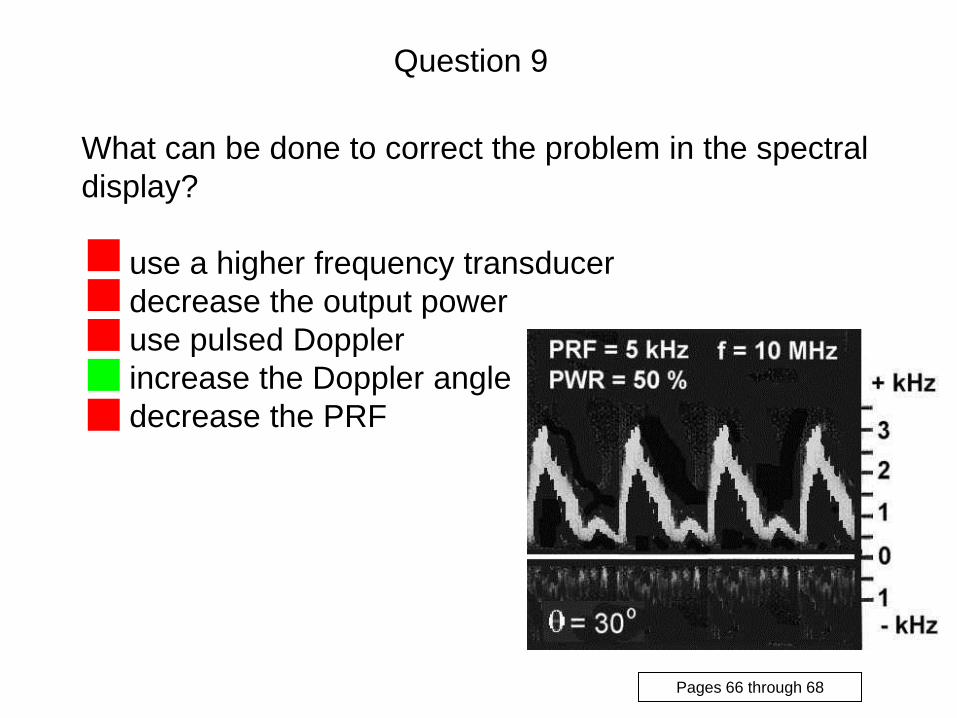
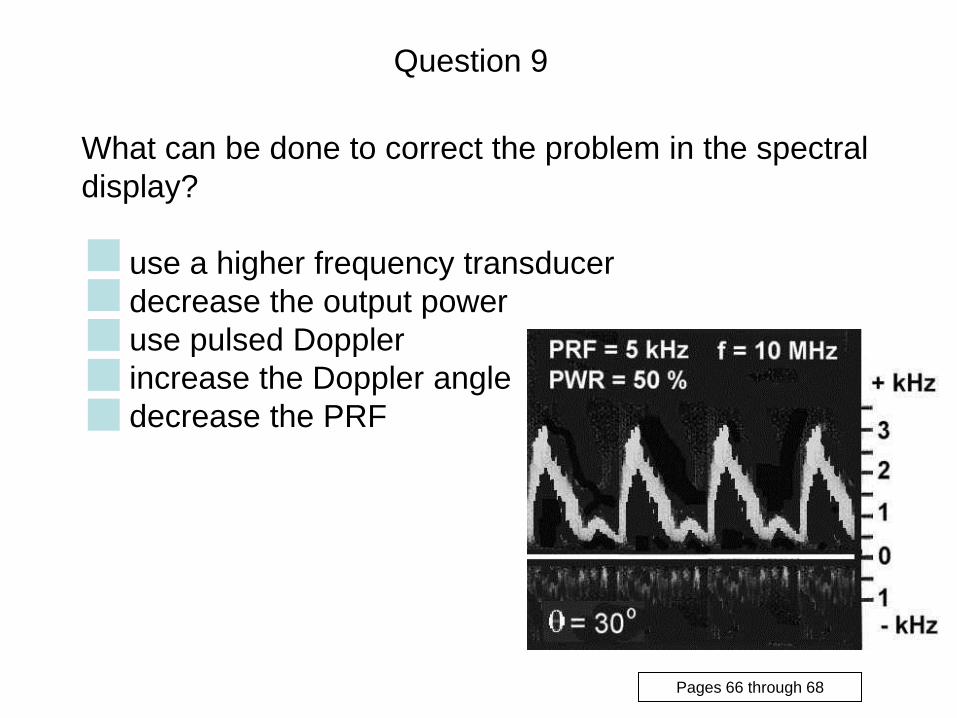
What can be done to correct the problem in the spectral
display?
use a higher frequency transducer
decrease the output power
use pulsed Doppler
increase the Doppler angle
decrease the PRF
Question 9
Pages 66 through 68
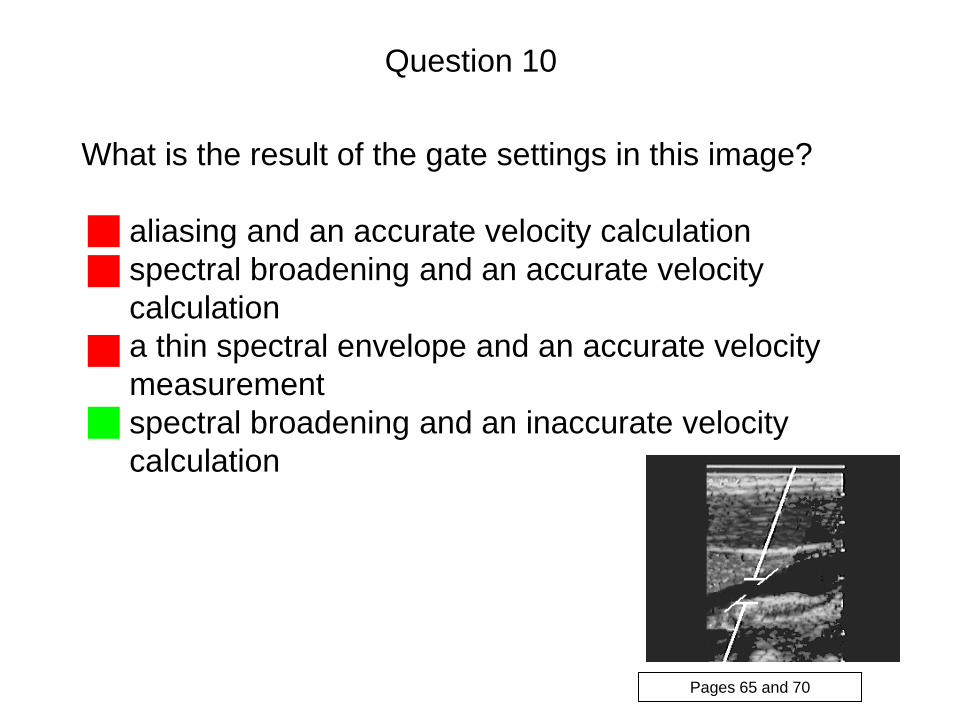
What is the result of the gate settings in this image?
aliasing and an accurate velocity calculation
spectral broadening and an accurate velocity
calculation
a thin spectral envelope and an accurate velocity
measurement
spectral broadening and an inaccurate velocity
calculation
Question 10
Pages 65 and 70
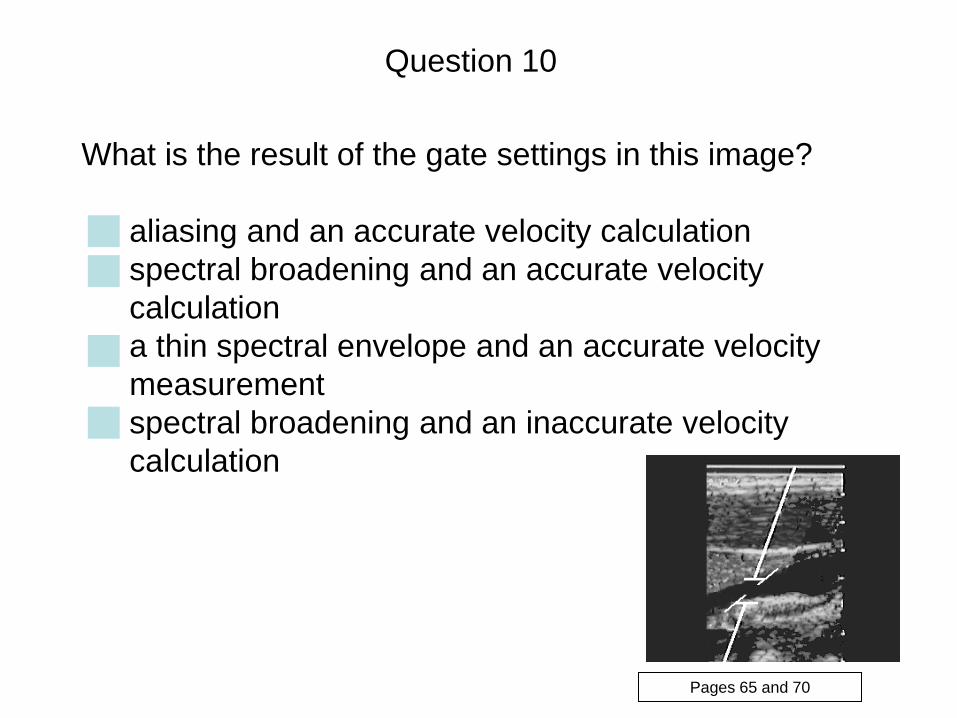
An ultrasound scanner that uses a single probe to
display a real time image along with spectral information
is
a duplex system
non existent
an annular array
not susceptible to aliasing
used only with CW Doppler
Question 11
Page 65
An ultrasound scanner that uses a single probe to
display a real time image along with spectral information
is
a duplex system
non existent
an annular array
not susceptible to aliasing
used only with CW Doppler
Question 11
Page 65
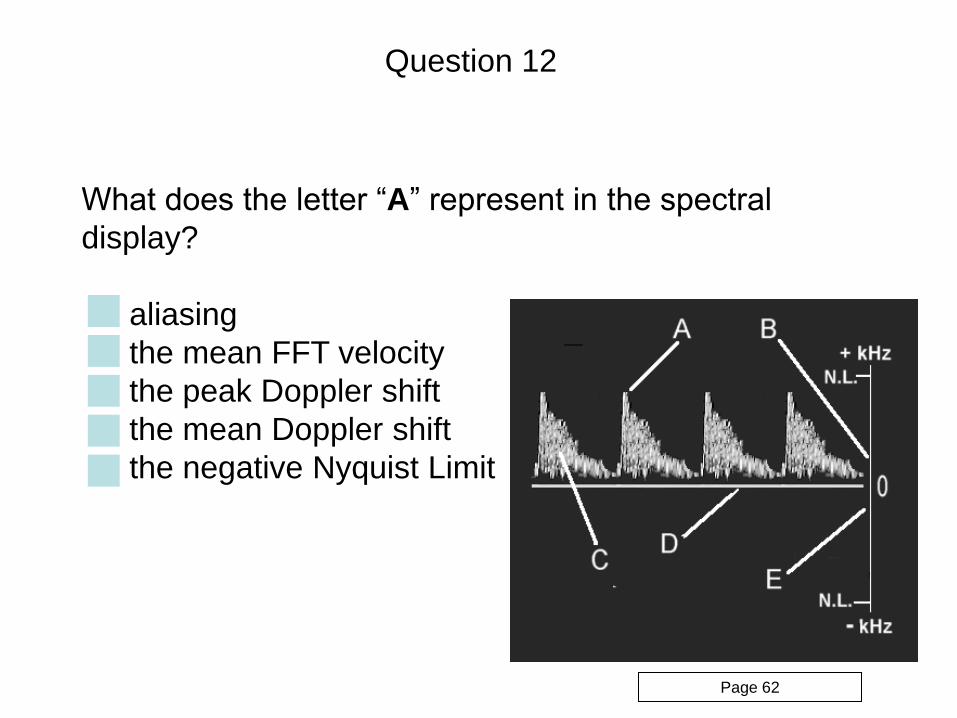
What does the letter “A” represent in the spectral
display?
aliasing
the mean FFT velocity
the peak Doppler shift
the mean Doppler shift
the negative Nyquist Limit
Question 12
Page 62
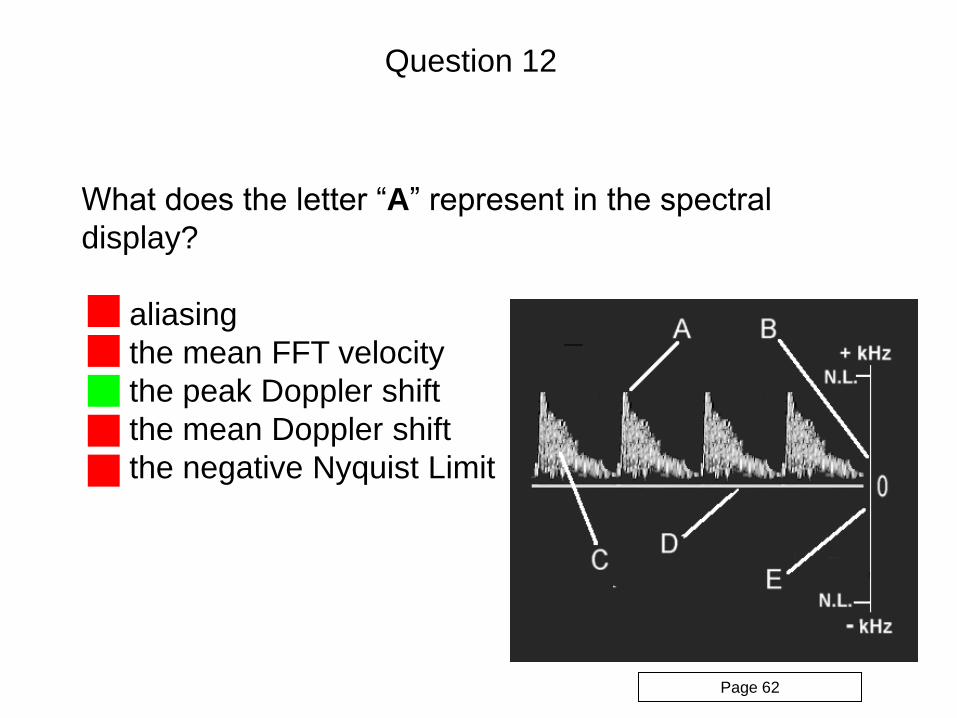
What does the letter “A” represent in the spectral
display?
aliasing
the mean FFT velocity
the peak Doppler shift
the mean Doppler shift
the negative Nyquist Limit
Question 12
Page 62
What does the letter “B” represent in the spectral
display?
the zero baseline
the positive velocity scale
the peak Doppler shift
the positive frequency
shift scale
the negative frequency
shift scale
Question 13
Page 62
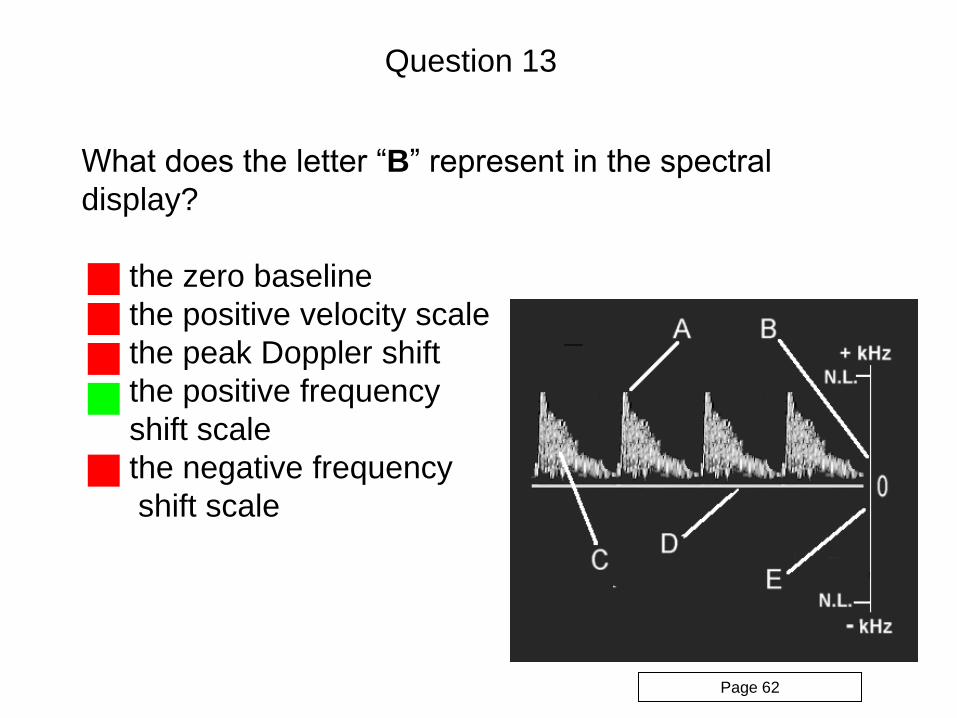
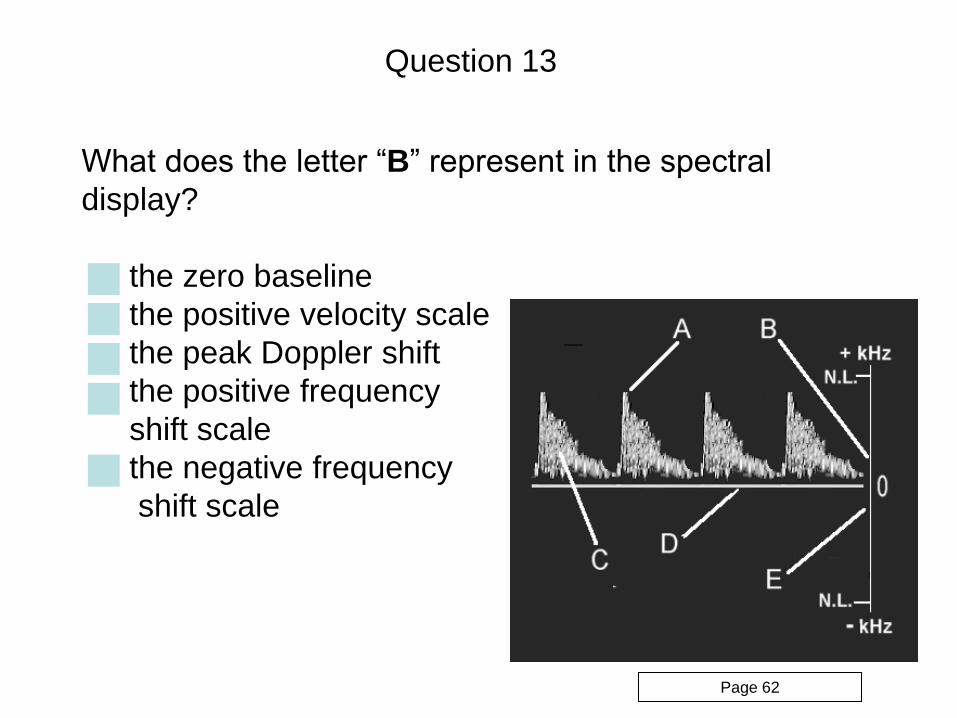
What does the letter “B” represent in the spectral
display?
the zero baseline
the positive velocity scale
the peak Doppler shift
the positive frequency
shift scale
the negative frequency
shift scale
Question 13
Page 62
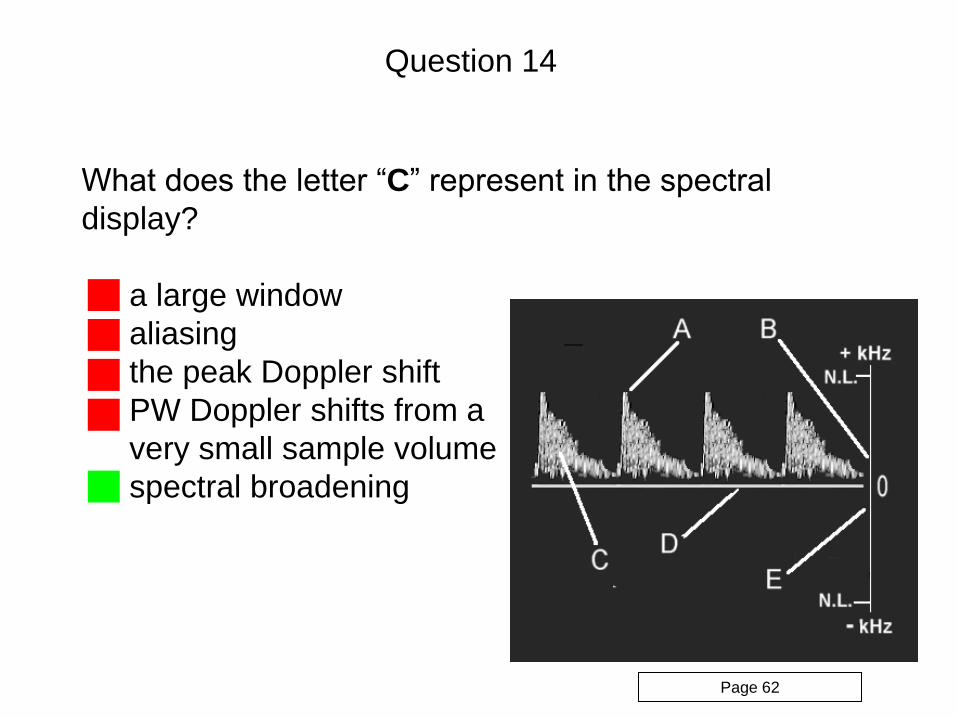
What does the letter “C” represent in the spectral
display?
a large window
aliasing
the peak Doppler shift
PW Doppler shifts from a
very small sample volume
spectral broadening
Question 14
Page 62
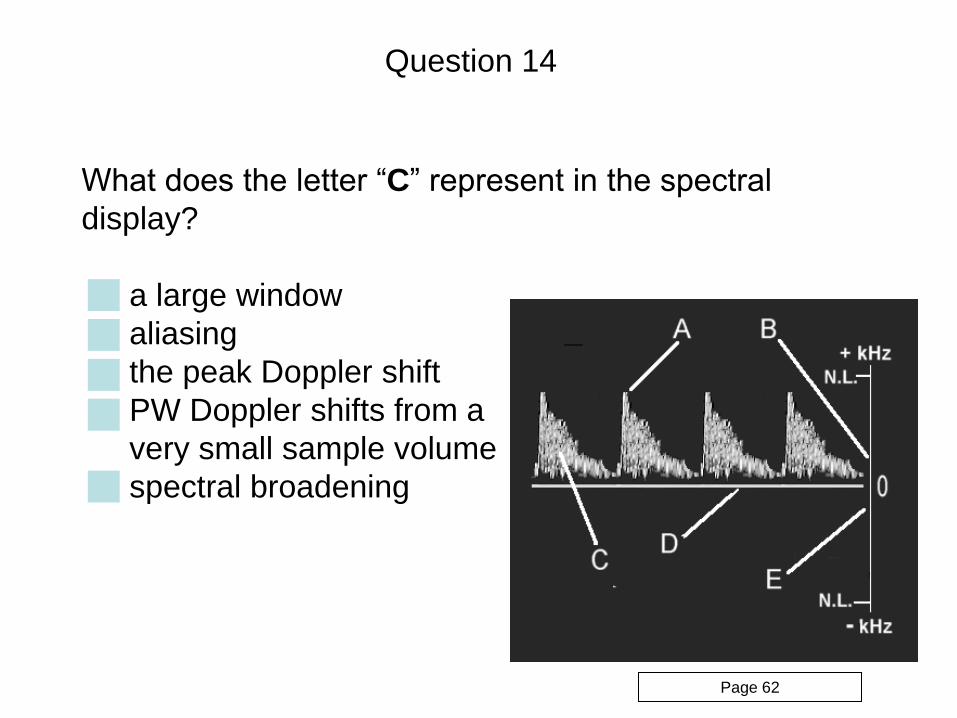
What does the letter “C” represent in the spectral
display?
a large window
aliasing
the peak Doppler shift
PW Doppler shifts from a
very small sample volume
spectral broadening
Question 14
Page 62
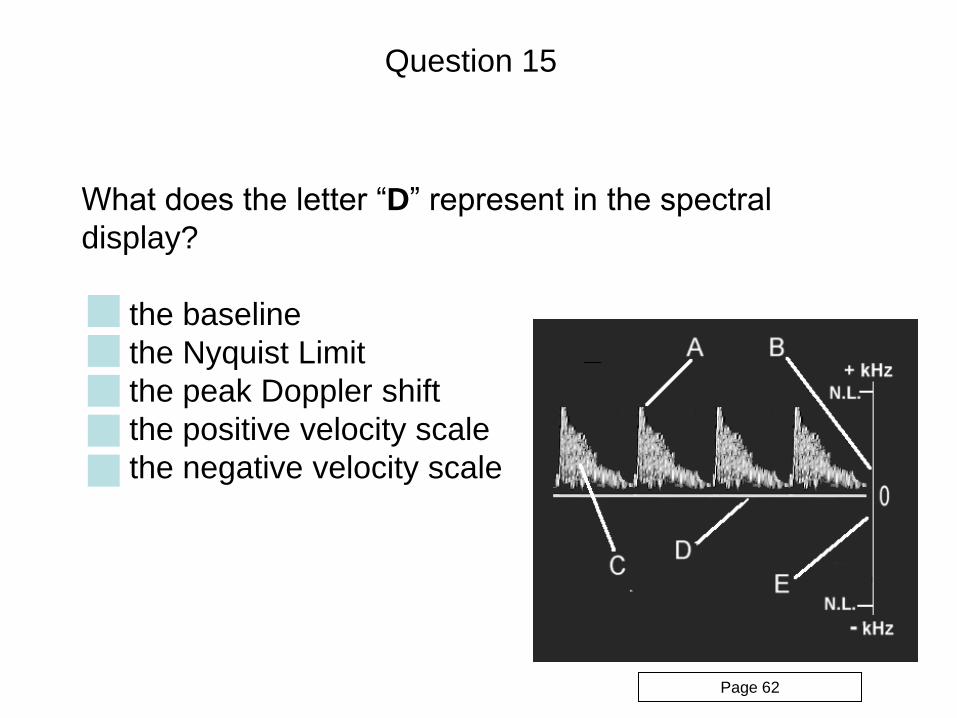
What does the letter “D” represent in the spectral
display?
the baseline
the Nyquist Limit
the peak Doppler shift
the positive velocity scale
the negative velocity scale
Question 15
Page 62
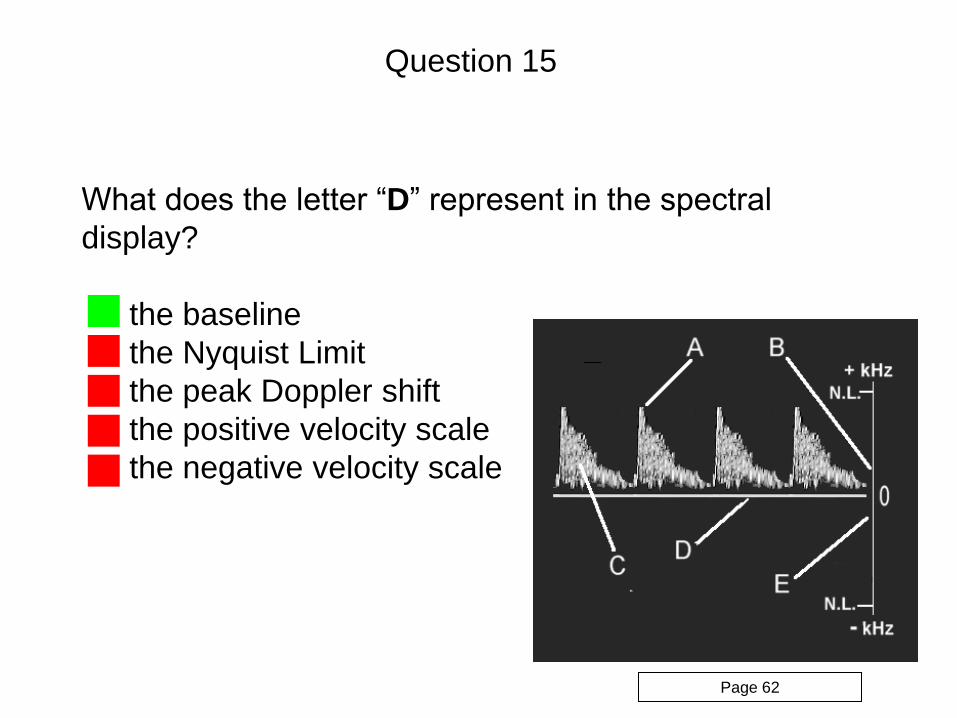
What does the letter “D” represent in the spectral
display?
the baseline
the Nyquist Limit
the peak Doppler shift
the positive velocity scale
the negative velocity scale
Question 15
Page 62
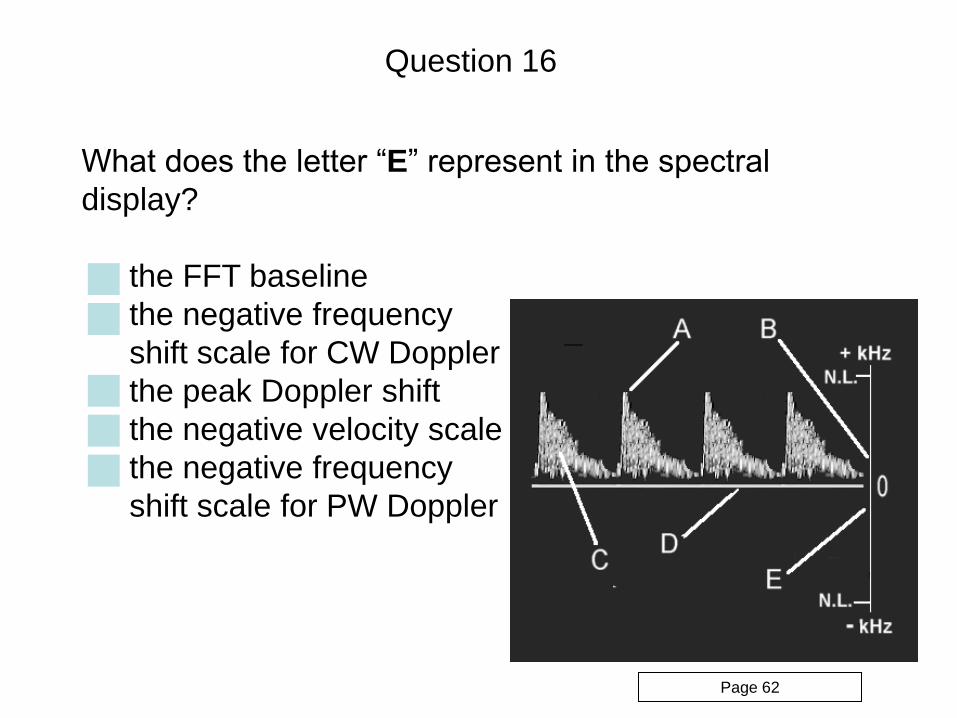
What does the letter “E” represent in the spectral
display?
the FFT baseline
the negative frequency
shift scale for CW Doppler
the peak Doppler shift
the negative velocity scale
the negative frequency
shift scale for PW Doppler
Question 16
Page 62
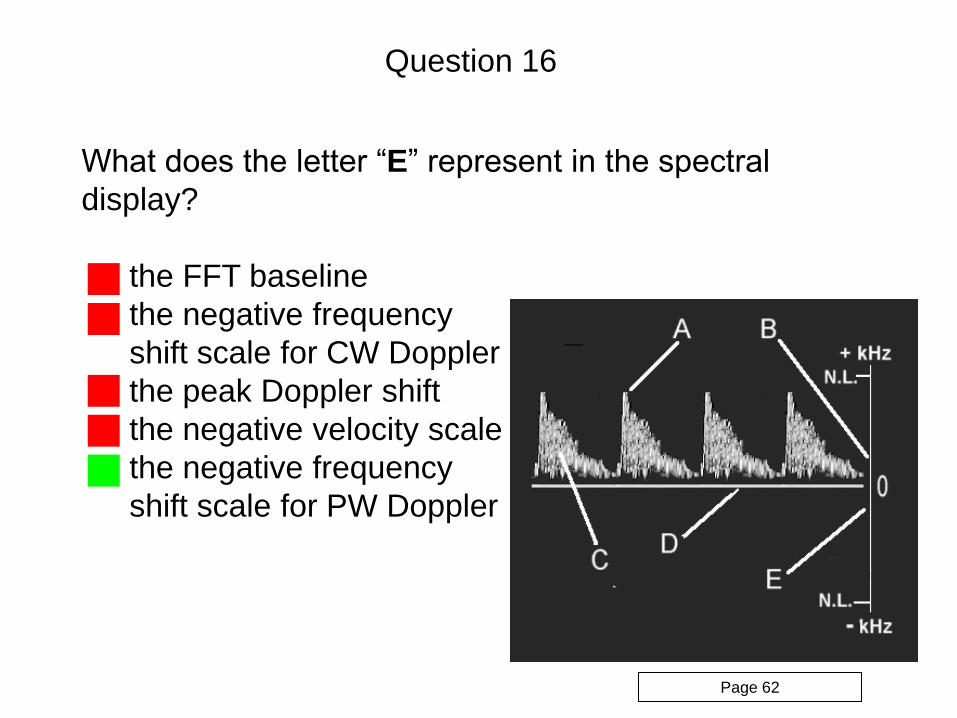
What does the letter “E” represent in the spectral
display?
the FFT baseline
the negative frequency
shift scale for CW Doppler
the peak Doppler shift
the negative velocity scale
the negative frequency
shift scale for PW Doppler
Question 16
Page 62
Which of the following is a limitation of CW Doppler?
frequent aliasing
depth selectivity is not possible
FFT analysis is not possible
inability to detect peak velocities
a low Nyquist Limit
Question 17
Page 63
Which of the following is a limitation of CW Doppler?
frequent aliasing
depth selectivity is not possible
FFT analysis is not possible
inability to detect peak velocities
a low Nyquist Limit
Question 17
Page 63
Angle-correction is used to obtain accurate frequency
shift values for
Doppler angles less than 10 degrees
Doppler angles greater than 45 degrees
color-flow Doppler
Doppler Tissue Imaging in the 2-D mode
none of the above
Question 18
Page 70
Angle-correction is used to obtain accurate frequency
shift values for
Doppler angles less than 10 degrees
Doppler angles greater than 45 degrees
color-flow Doppler
Doppler Tissue Imaging in the 2-D mode
none of the above
Question 18
Page 70
When a 5 MHz Doppler system with a PW PRF of 15
kHz is used, aliasing will begin to occur when the
Doppler shift exceeds
3 kHz
5 kHz
7.5 kHz
15 kHz
30 kHz
Question 19
Pages 66 through 68
When a 5 MHz Doppler system with a PW PRF of 15
kHz is used, aliasing will begin to occur when the
Doppler shift exceeds
3 kHz
5 kHz
7.5 kHz
15 kHz
30 kHz
Question 19
Pages 66 through 68
Which Doppler waveform produces the highest
pulsatility index?
biphasic
monophasic
triphasic
post-stenotic
Question 20
Page 73
Which Doppler waveform produces the highest
pulsatility index?
biphasic
monophasic
triphasic
post-stenotic
Question 20
Page 73
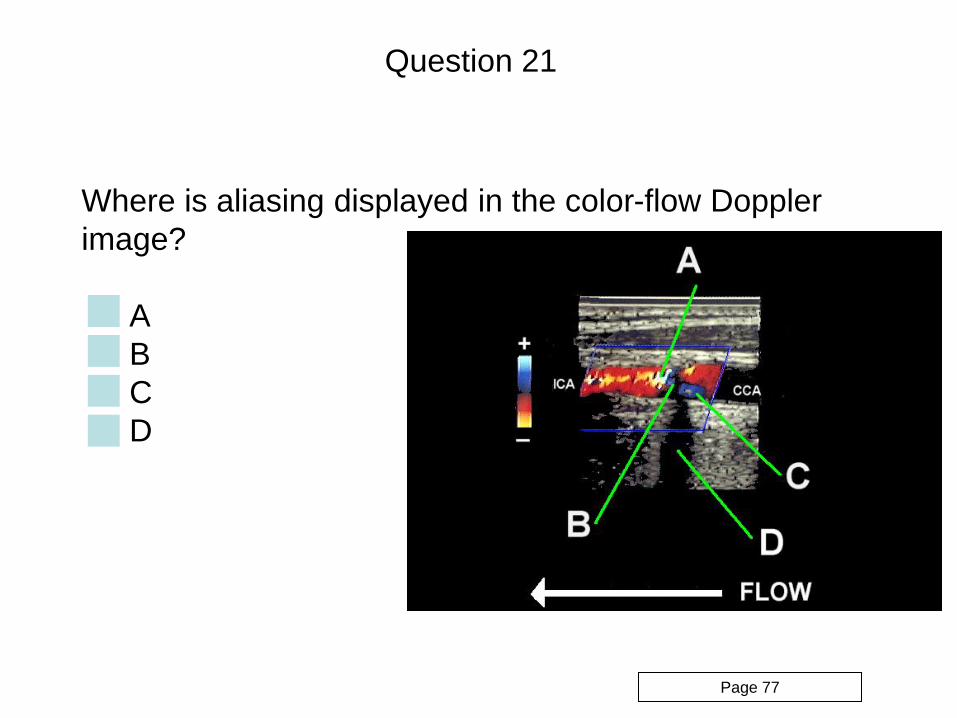
Where is aliasing displayed in the color-flow Doppler
image?
A
B
C
D
Question 21
Page 77
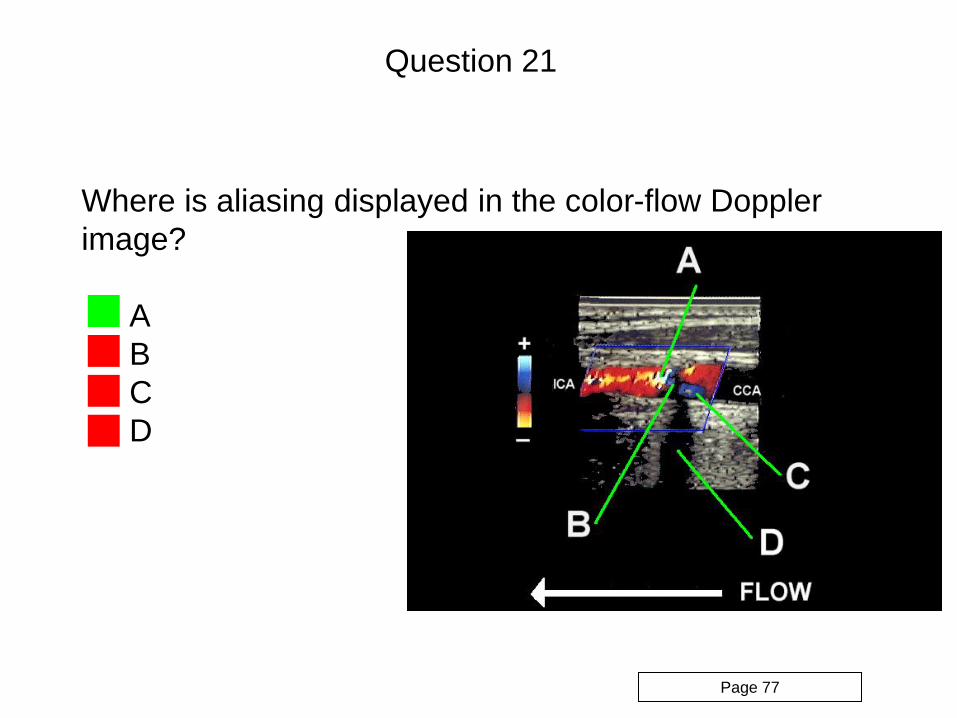
Where is aliasing displayed in the color-flow Doppler
image?
A
B
C
D
Question 21
Page 77
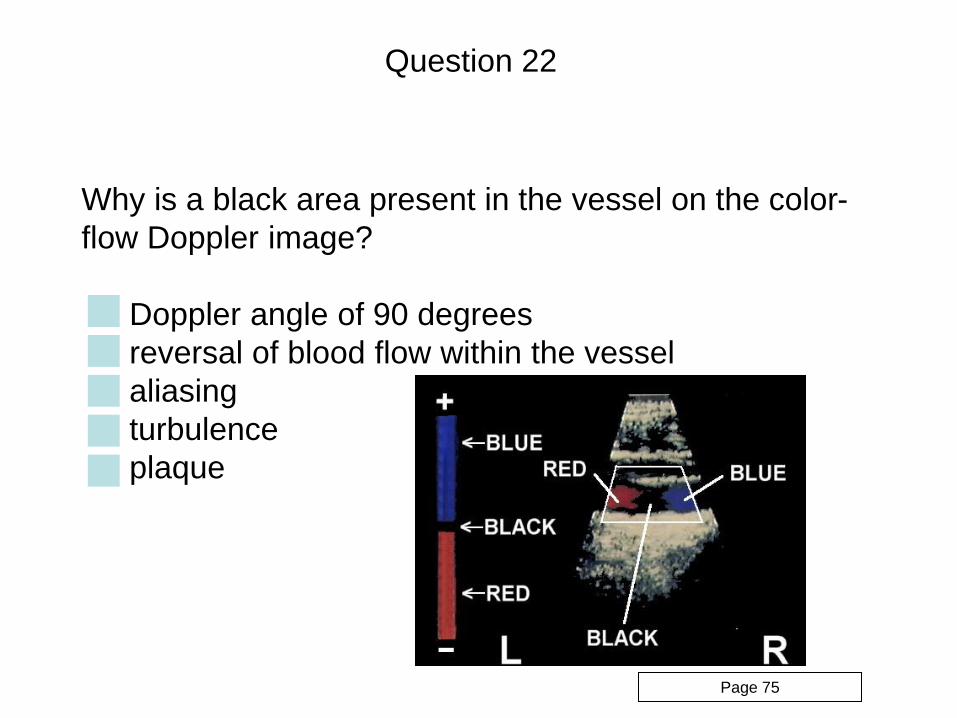
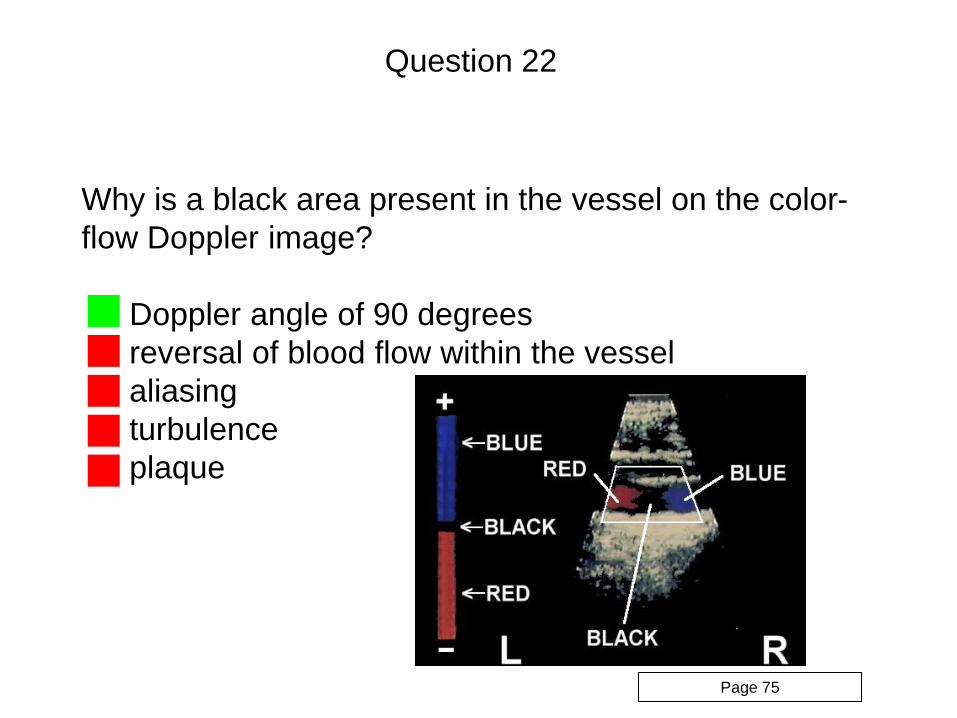
Why is a black area present in the vessel on the color-
flow Doppler image?
Doppler angle of 90 degrees
reversal of blood flow within the vessel
aliasing
turbulence
plaque
Question 22
Page 75
Why is a black area present in the vessel on the color-
flow Doppler image?
Doppler angle of 90 degrees
reversal of blood flow within the vessel
aliasing
turbulence
plaque
Question 22
Page 75
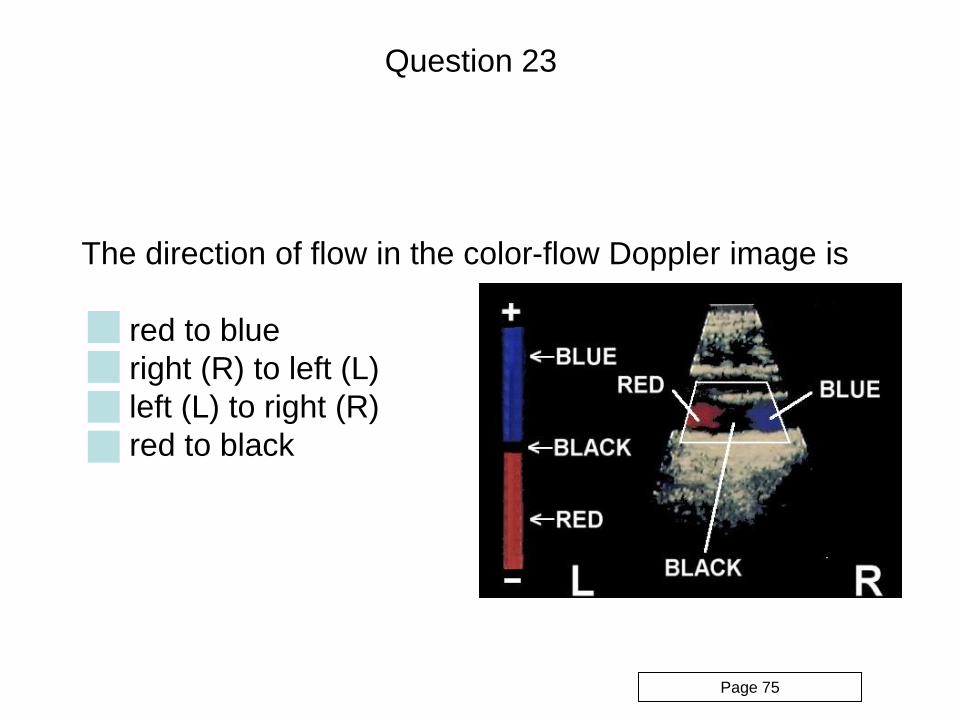
The direction of flow in the color-flow Doppler image is
red to blue
right (R) to left (L)
left (L) to right (R)
red to black
Question 23
Page 75
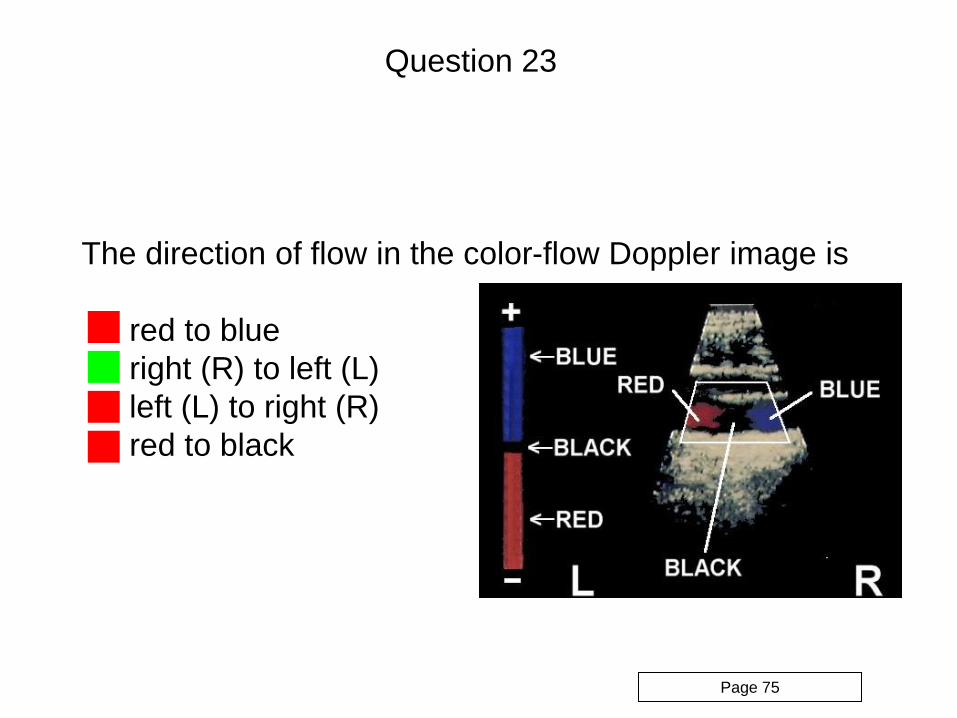
The direction of flow in the color-flow Doppler image is
red to blue
right (R) to left (L)
left (L) to right (R)
red to black
Question 23
Page 75
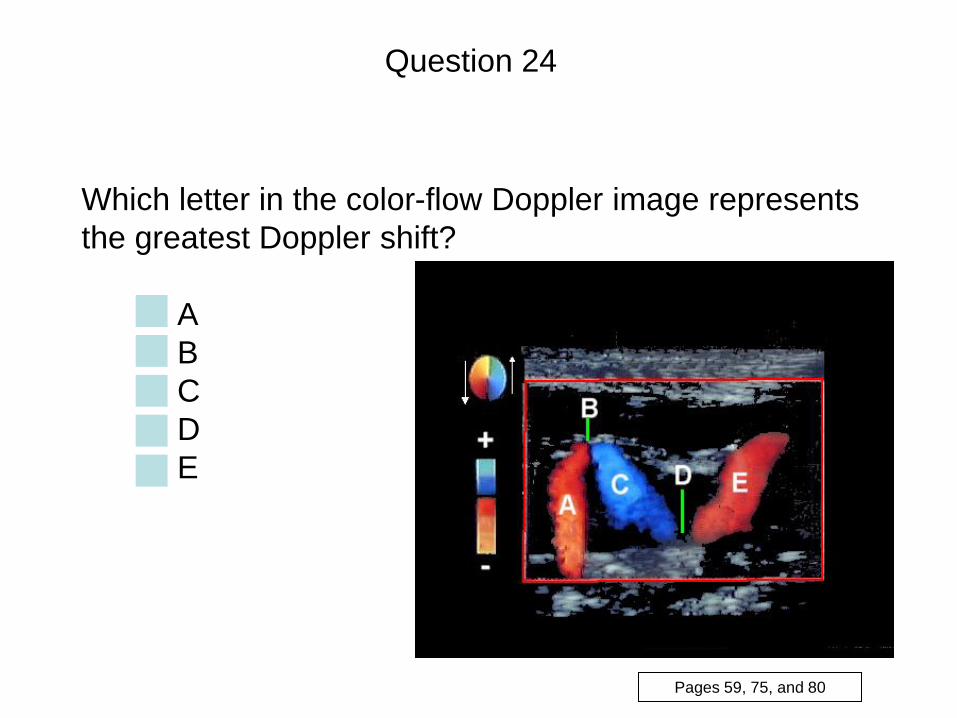
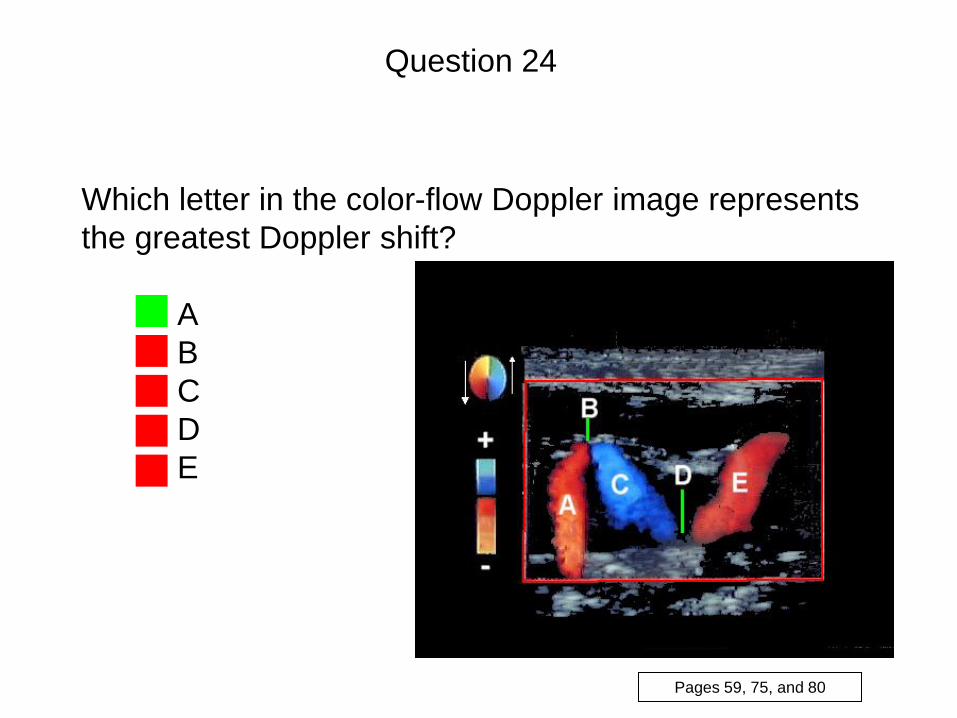
Which letter in the color-flow Doppler image represents
the greatest Doppler shift?
A
B
C
D
E
Question 24
Pages 59, 75, and 80
Which letter in the color-flow Doppler image represents
the greatest Doppler shift?
A
B
C
D
E
Question 24
Pages 59, 75, and 80
What is the process used for color-flow Doppler to
automatically assess the data from multiple sampling
sites to produce a display representing mean Doppler
shift frequencies?
autocorrelation
quadrature phase detection
FFT analysis
zero crossing detection
single sideband detection
Question 25
Page 77
Which one of the following uses a method other than just
measuring frequency shift to detect movement?
CW Doppler
Power Doppler
PW Doppler
color-flow Doppler
Doppler Tissue Imaging
Question 26
Page 80
Which one of the following uses a method other than just
measuring frequency shift to detect movement?
CW Doppler
Power Doppler
PW Doppler
color-flow Doppler
Doppler Tissue Imaging
Question 26
Page 80

END OF LESSON 12
For information on the accompanying textbook, visit the Website:
www.Sonicorinc.com