Embed Size (px)
Citation preview
Lesson 3 - 5
The Five-Number Summary
and Boxplots
Objectives• Compute the five-number summary
• Draw and interpret boxplots
Vocabulary• Five-number Summary – the minimum data value,
Q1, median, Q3 and the maximum data value
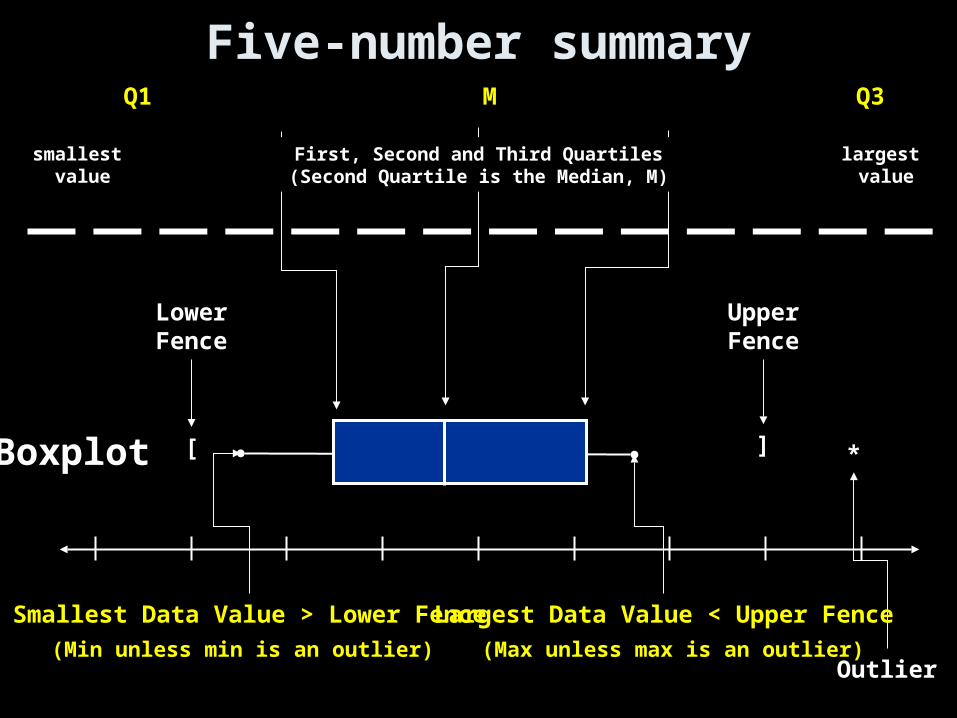
Min Q1 M Q3 Max
smallest value
largest value
Boxplot
First, Second and Third Quartiles(Second Quartile is the Median, M)
[ ] *
Outlier
LowerFence
UpperFence
Smallest Data Value > Lower Fence Largest Data Value < Upper Fence
(Min unless min is an outlier) (Max unless max is an outlier)
Five-number summary
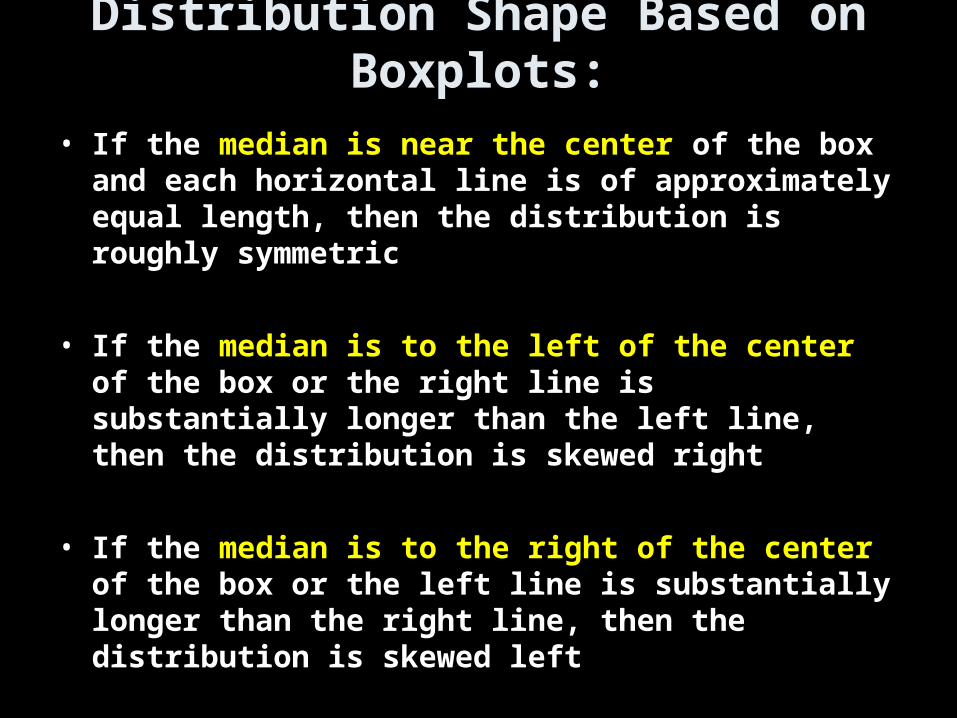
Distribution Shape Based on Boxplots:
• If the median is near the center of the box and each horizontal line is of approximately equal length, then the distribution is roughly symmetric
• If the median is to the left of the center of the box or the right line is substantially longer than the left line, then the distribution is skewed right
• If the median is to the right of the center of the box or the left line is substantially longer than the right line, then the distribution is skewed left
Why Use a Boxplot?
• A boxplot provides an alternative to a histogram, a dotplot, and a stem-and-leaf plot. Among the advantages of a boxplot over a histogram are ease of construction and convenient handling of outliers. In addition, the construction of a boxplot does not involve subjective judgements, as does a histogram. That is, two individuals will construct the same boxplot for a given set of data - which is not necessarily true of a histogram, because the number of classes and the class endpoints must be chosen. On the other hand, the boxplot lacks the details the histogram provides.
• Dotplots and stemplots retain the identity of the individual observations; a boxplot does not. Many sets of data are more suitable for display as boxplots than as a stemplot. A boxplot as well as a stemplot are useful for making side-by-side comparisons.
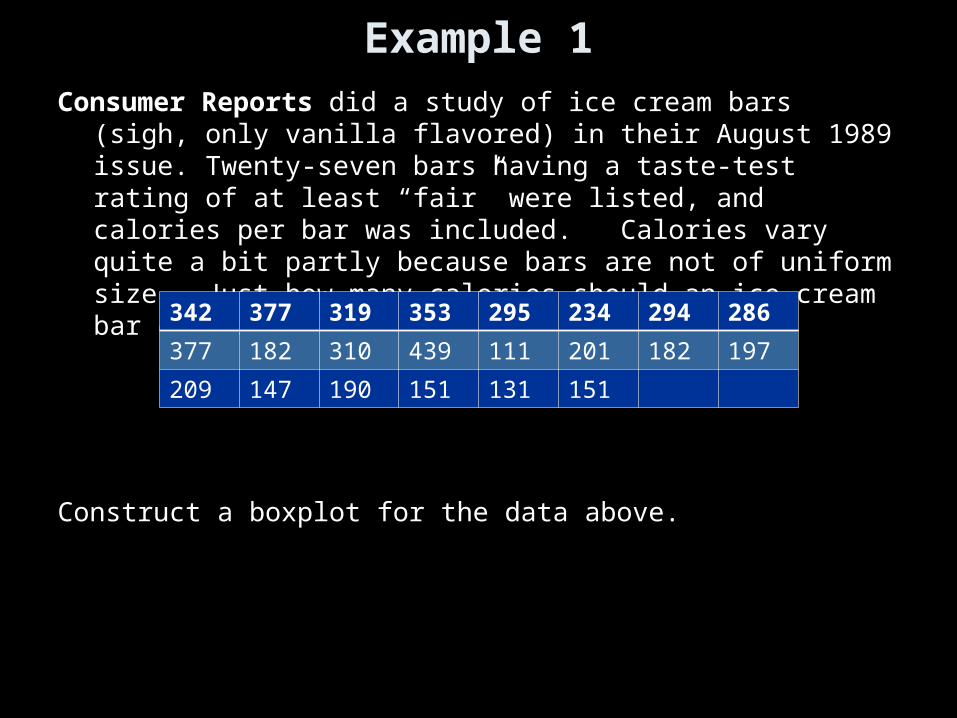
Example 1Consumer Reports did a study of ice cream bars (sigh, only vanilla
flavored) in their August 1989 issue. Twenty-seven bars having a taste-test rating of at least “fair” were listed, and calories per bar was included. Calories vary quite a bit partly because bars are not of uniform size. Just how many calories should an ice cream bar contain?
Construct a boxplot for the data above.
342 377 319 353 295 234 294 286
377 182 310 439 111 201 182 197
209 147 190 151 131 151
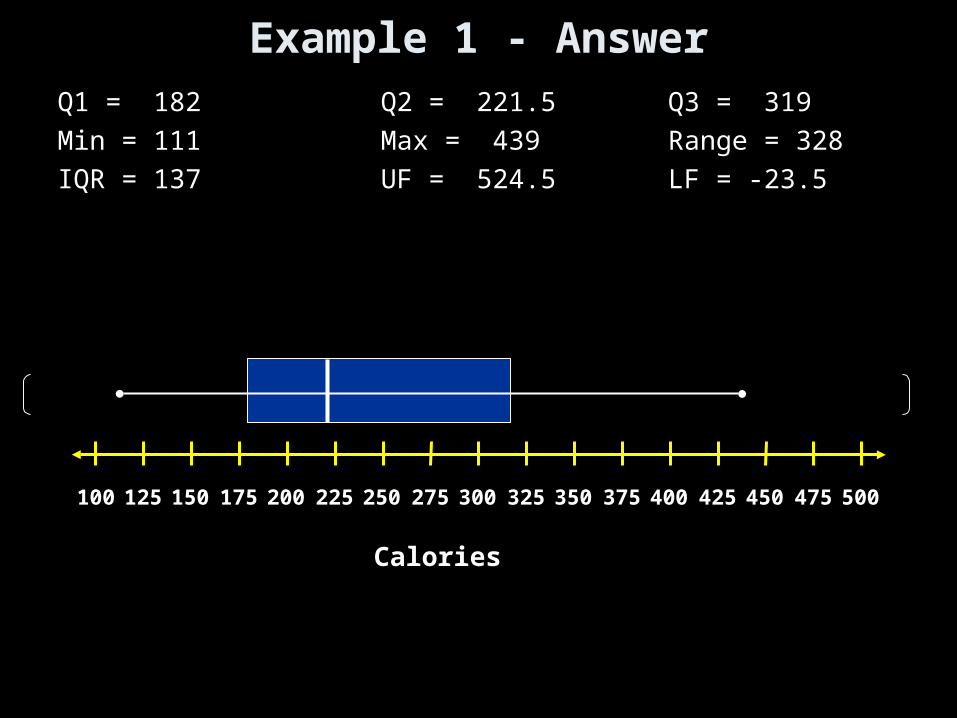
Example 1 - AnswerQ1 = 182 Q2 = 221.5 Q3 = 319
Min = 111 Max = 439 Range = 328
IQR = 137 UF = 524.5 LF = -23.5
Calories
100 125 150 175 200 225 250 275 300 325 350 375 400 425 450 475 500
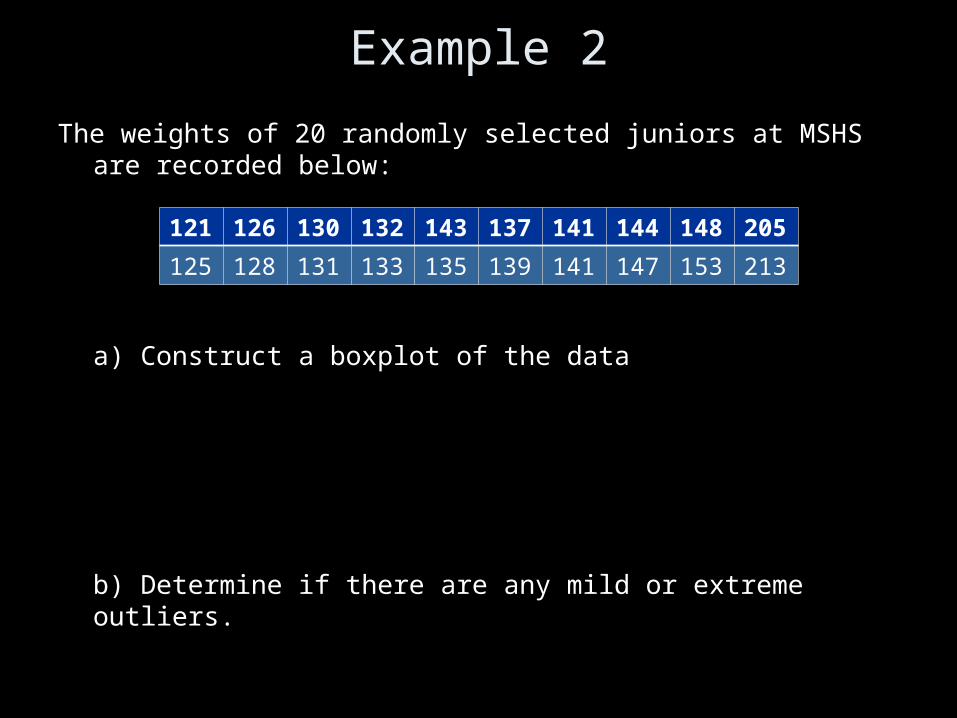
Example 2
The weights of 20 randomly selected juniors at MSHS are recorded below:
a) Construct a boxplot of the data
b) Determine if there are any mild or extreme outliers.
121 126 130 132 143 137 141 144 148 205
125 128 131 133 135 139 141 147 153 213

Example 2 - AnswerQ1 = 130.5 Q2 = 138 Q3 = 145.5
Min = 121 Max = 213 Range = 92
IQR = 15 UF = 168 LF = 108
Weight
100 110 120 130 140 150 160 170 180 190 200 210 220 230 240 250 260
**
Extreme Outliers( > 3 IQR from Q3)
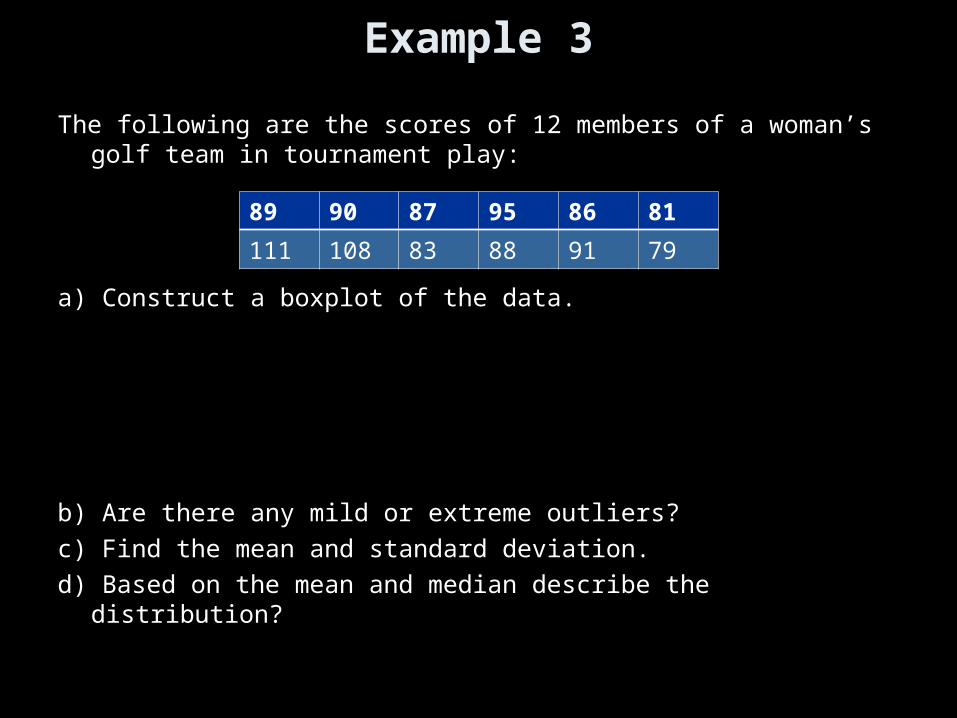
Example 3
The following are the scores of 12 members of a woman’s golf team in tournament play:
a) Construct a boxplot of the data.
b) Are there any mild or extreme outliers?
c) Find the mean and standard deviation.
d) Based on the mean and median describe the distribution?
89 90 87 95 86 81
111 108 83 88 91 79
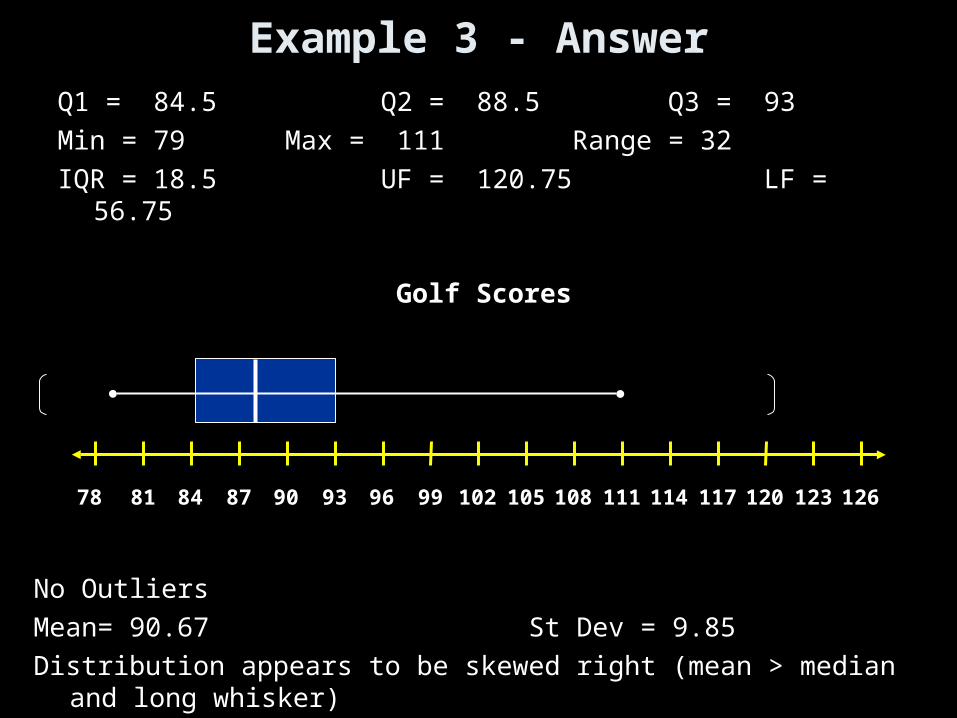
Example 3 - AnswerQ1 = 84.5 Q2 = 88.5 Q3 = 93
Min = 79 Max = 111 Range = 32
IQR = 18.5 UF = 120.75 LF = 56.75
78 81 84 87 90 93 96 99 102 105 108 111 114 117 120 123 126
Golf Scores
No Outliers
Mean= 90.67 St Dev = 9.85
Distribution appears to be skewed right (mean > median and long whisker)
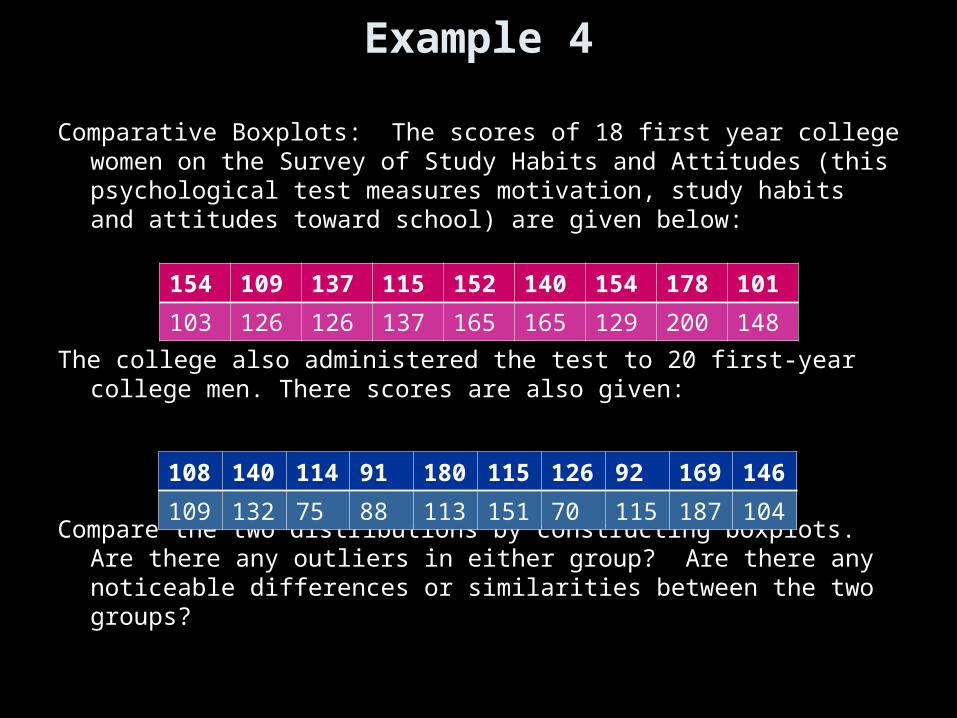
Example 4
Comparative Boxplots: The scores of 18 first year college women on the Survey of Study Habits and Attitudes (this psychological test measures motivation, study habits and attitudes toward school) are given below:
The college also administered the test to 20 first-year college men. There scores are also given:
Compare the two distributions by constructing boxplots. Are there any outliers in either group? Are there any noticeable differences or similarities between the two groups?
154 109 137 115 152 140 154 178 101
103 126 126 137 165 165 129 200 148
108 140 114 91 180 115 126 92 169 146
109 132 75 88 113 151 70 115 187 104
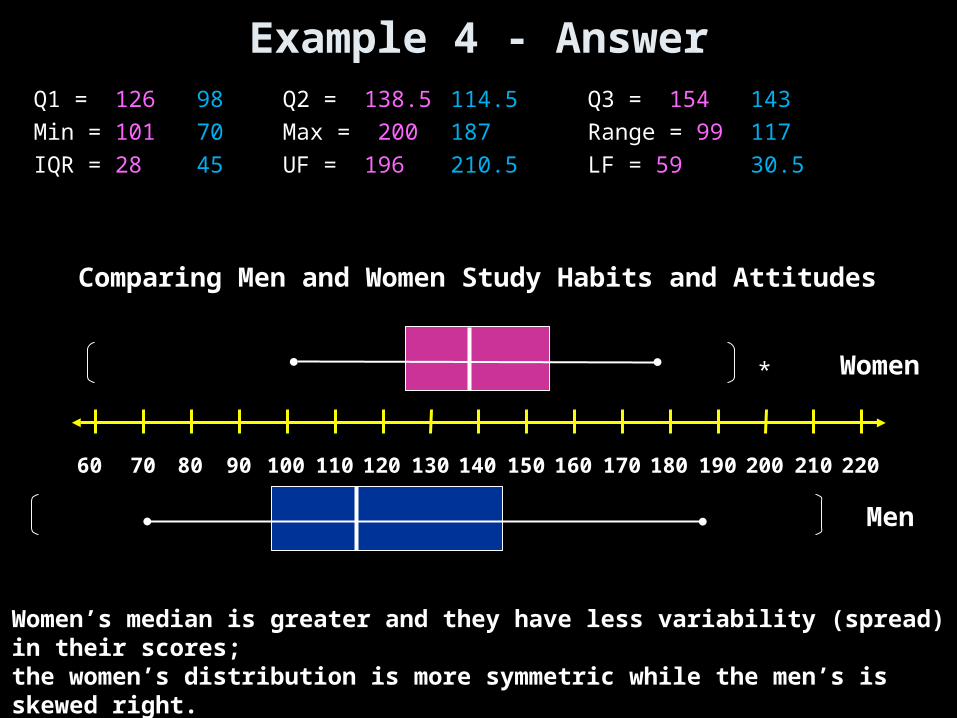
Example 4 - AnswerQ1 = 126 98 Q2 = 138.5 114.5 Q3 = 154 143
Min = 101 70 Max = 200 187 Range = 99 117
IQR = 28 45 UF = 196 210.5 LF = 5930.5
60 70 80 90 100 110 120 130 140 150 160 170 180 190 200 210 220
Comparing Men and Women Study Habits and Attitudes
Women
Men
*
Women’s median is greater and they have less variability (spread) in their scores;the women’s distribution is more symmetric while the men’s is skewed right.Women have an outlier; while the men do not.
Summary and Homework
• Summary– Boxplots are used for checking for outliers– Use comparative boxplots for two datasets– Constructing a boxplot is not subjective – Identifying a distribution from boxplots or
histograms is subjective!
• Homework:pg 181-183: 5-7, 15