Embed Size (px)
Citation preview

Lesson 4.2 Describing PopulationsLesson 4.2 Describing Populations
• 1900 to 2000- NY white-tailed deer population grew from 20,000 to over 1 million• Metropolitan areas have densities of
over 100 deer per sq mi
• 1900 to 2000- NY white-tailed deer population grew from 20,000 to over 1 million• Metropolitan areas have densities of
over 100 deer per sq mi

Population SizePopulation SizeLesson 4.2 Describing Populations
• Number of individuals in a population at a given time
• Sudden, dramatic decrease in population size can indicate an unhealthy population headed toward extinction
• Ecologists use sampling techniques to estimate
population size
Did You Know? The passenger pigeon was once North America’s most abundant bird. Hunting drove them to extinction in less than 100 years.
Did You Know? The passenger pigeon was once North America’s most abundant bird. Hunting drove them to extinction in less than 100 years.
Counting Laysan Albatross Nests

Population DensityPopulation Density
Lesson 4.2 Describing Populations
• How crowded a population is
• Larger organisms; lower population densities
• Low population density: More space, resources; finding mates can be difficult
• High population density: Finding mates is easier; more competition; more infectious disease; more vulnerability to predators
Northern pintail ducks
Population DistributionPopulation Distribution
Lesson 4.2 Describing Populations
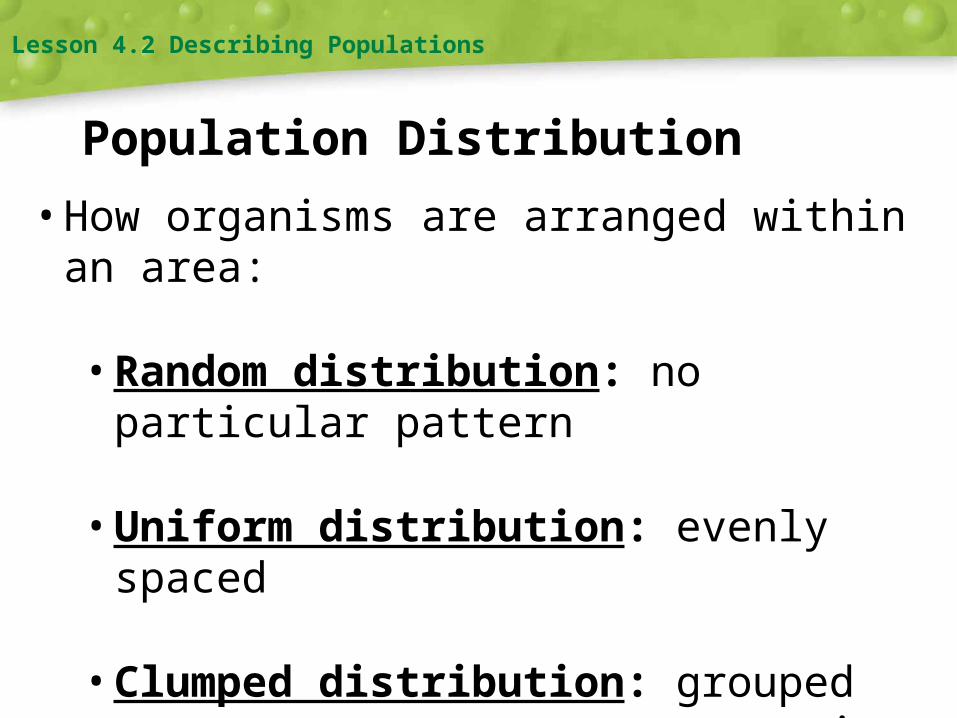
• How organisms are arranged within an area:
• Random distribution: no particular pattern
• Uniform distribution: evenly spaced
• Clumped distribution: grouped near resources; most common in nature

Age StructureAge Structure
Lesson 4.2 Describing Populations
• Number of organisms of each age group
• Used to predict future population growth

Sex RatiosSex Ratios
Lesson 4.2 Describing Populations
• Proportion of males to females
• Age structure diagrams
• For a monogamous species, the ideal sex ratio is 50:50.