Embed Size (px)
DESCRIPTION
In this lesson you will learn about simple indicators that are available in any MetaTrader terminal and TradingView. Here I will not recommend using additional indicators, as the screen full of arrows and lines that repaint won't do any good for you.
Citation preview

pdfcrowd.comopen in browser PRO version Are you a developer? Try out the HTML to PDF API
INDICATORS AND STRATEGIES
In this lesson you will learn about simple indicators that are available in any MetaTrader terminal andTradingView. Here I will not recommend using additional indicators, as the screen full of arrows and linesthat repaint won't do any good for you.
Indicators should be used to complement a strategy. Therefore you shouldn't completely rely on them,because indicators reflect data based on past price behavior, but we look at present.
Include in your strategy tools that you understand and which produce good results for you. As mentionedabove success in binary options trading is largely dependent on psychology, so the strategy that worksperfectly for one, may not work for another.
What is best to use to build your strategy?
Choose the right timeframe for yourself
Setups: Pinocchio and Inside Bar patterns, significant levels
Indicators : Stochastic, EMA, Bollinger Bands , Fibonacci levels
INDICATOR - MOVING AVERAGE
Moving average - one of the most popular and commonly used indicators. Moving average - is the averageprice of an asset for a certain period of time that is expressed in the number of candles. Displayed as a line.
Lesson 8 - Binary options indicators

pdfcrowd.comopen in browser PRO version Are you a developer? Try out the HTML to PDF API
Moving averages are plotted on price chart and smooth out the price action of an asset on which it isplotted by simply taking average price of certain number of periods (bars) back.
Moving averages are used better representation of long terms direction and filter out market noise (slightfluctuations in price). In addition moving average can be used to identify positional support and resistancelevels.
There are different setups of moving averages. Moving average periods, which traders often use : 5 , 8, 20, 21, 150, 200, 365. Period is the number of candles that are taken to build the line. For example, themoving average with a period of 21, displays the average price for the last 21 candle.
pdfcrowd.comopen in browser PRO version Are you a developer? Try out the HTML to PDF API
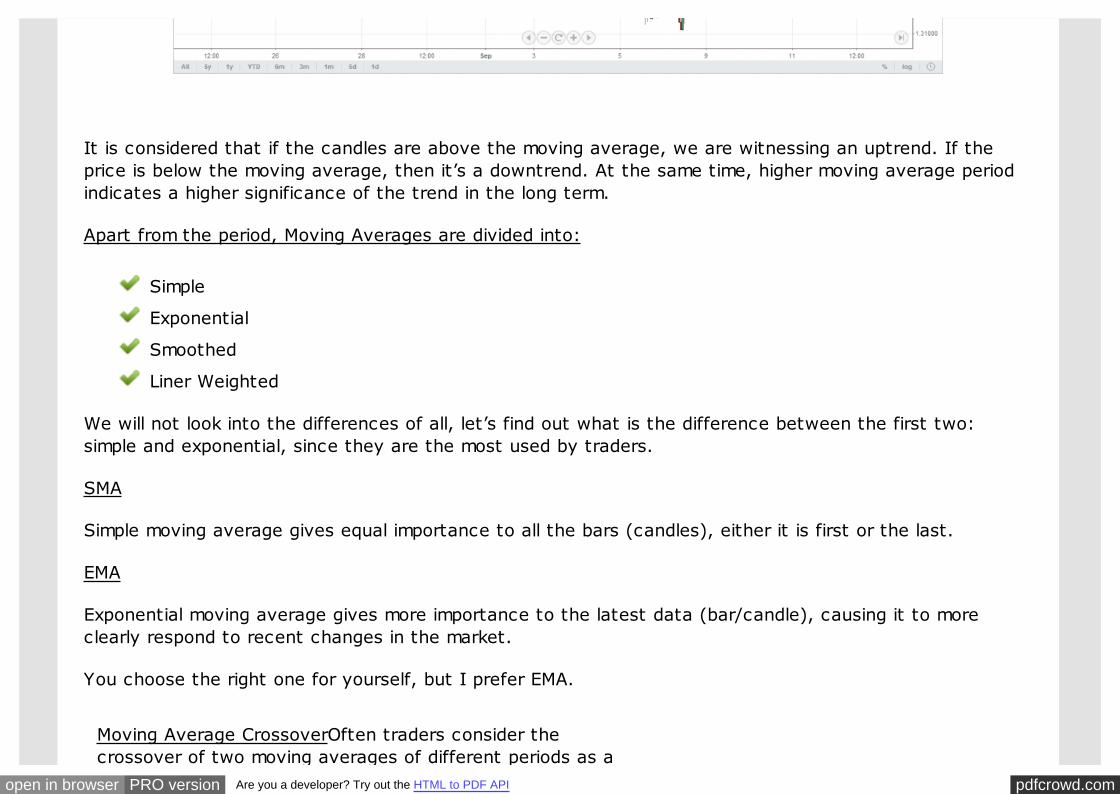
It is considered that if the candles are above the moving average, we are witnessing an uptrend. If theprice is below the moving average, then it’s a downtrend. At the same time, higher moving average periodindicates a higher significance of the trend in the long term.
Apart from the period, Moving Averages are divided into:
Simple
Exponential
Smoothed
Liner Weighted
We will not look into the differences of all, let’s find out what is the difference between the first two:simple and exponential, since they are the most used by traders.
SMA
Simple moving average gives equal importance to all the bars (candles), either it is first or the last.
EMA
Exponential moving average gives more importance to the latest data (bar/candle), causing it to moreclearly respond to recent changes in the market.
You choose the right one for yourself, but I prefer EMA.
Moving Average CrossoverOften traders consider thecrossover of two moving averages of different periods as a
pdfcrowd.comopen in browser PRO version Are you a developer? Try out the HTML to PDF API
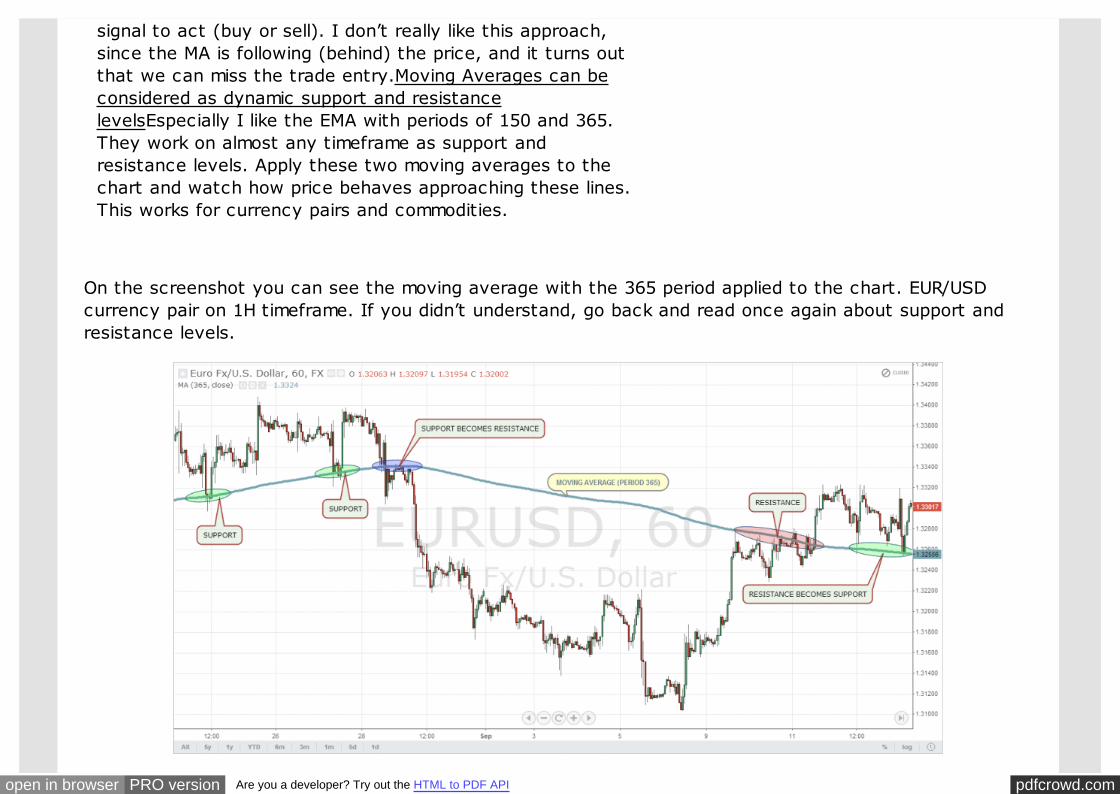
signal to act (buy or sell). I don’t really like this approach,since the MA is following (behind) the price, and it turns outthat we can miss the trade entry.Moving Averages can beconsidered as dynamic support and resistancelevelsEspecially I like the EMA with periods of 150 and 365.They work on almost any timeframe as support andresistance levels. Apply these two moving averages to thechart and watch how price behaves approaching these lines.This works for currency pairs and commodities.
On the screenshot you can see the moving average with the 365 period applied to the chart. EUR/USDcurrency pair on 1H timeframe. If you didn’t understand, go back and read once again about support andresistance levels.
pdfcrowd.comopen in browser PRO version Are you a developer? Try out the HTML to PDF API
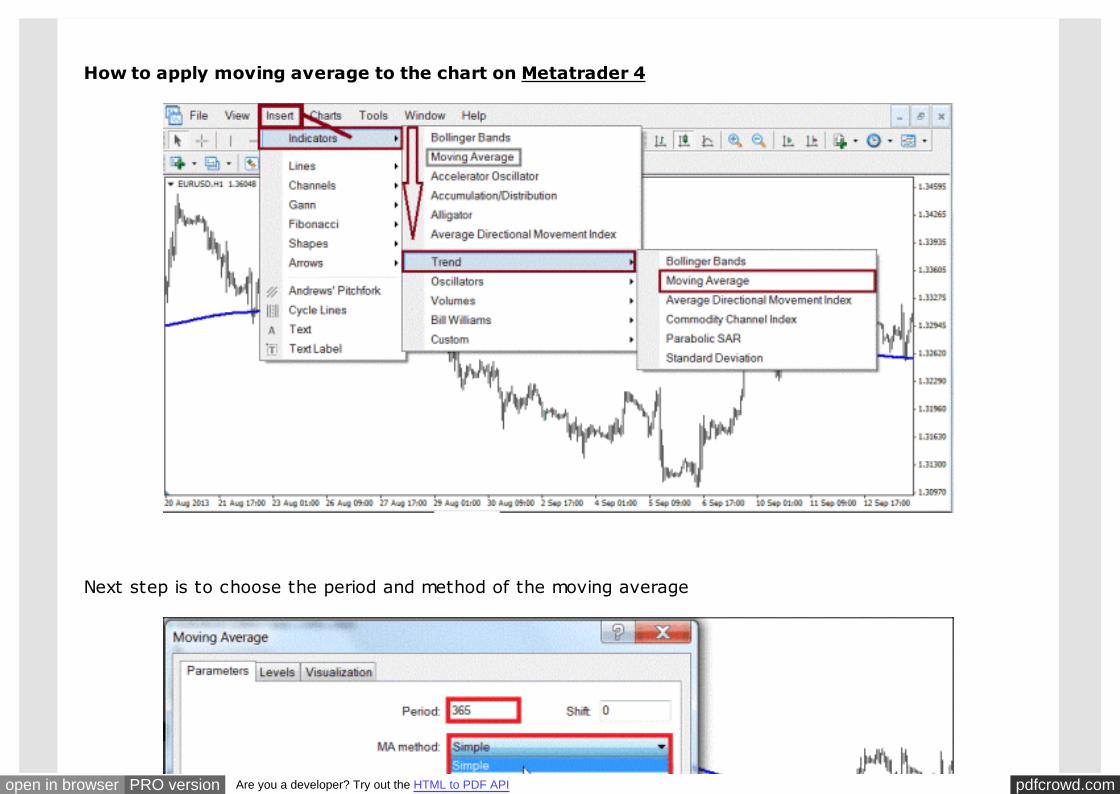
How to apply moving average to the chart on Metatrader 4
Next step is to choose the period and method of the moving average

pdfcrowd.comopen in browser PRO version Are you a developer? Try out the HTML to PDF API
Period: Type in the period of your moving average
Method: Choose the time of the moving average
Apply to: Leave “Close” by default
Style: Choose any color. If you have several moving averages it would be easier to distinguishthem
How to apply moving average to the chart on TradingView
pdfcrowd.comopen in browser PRO version Are you a developer? Try out the HTML to PDF API
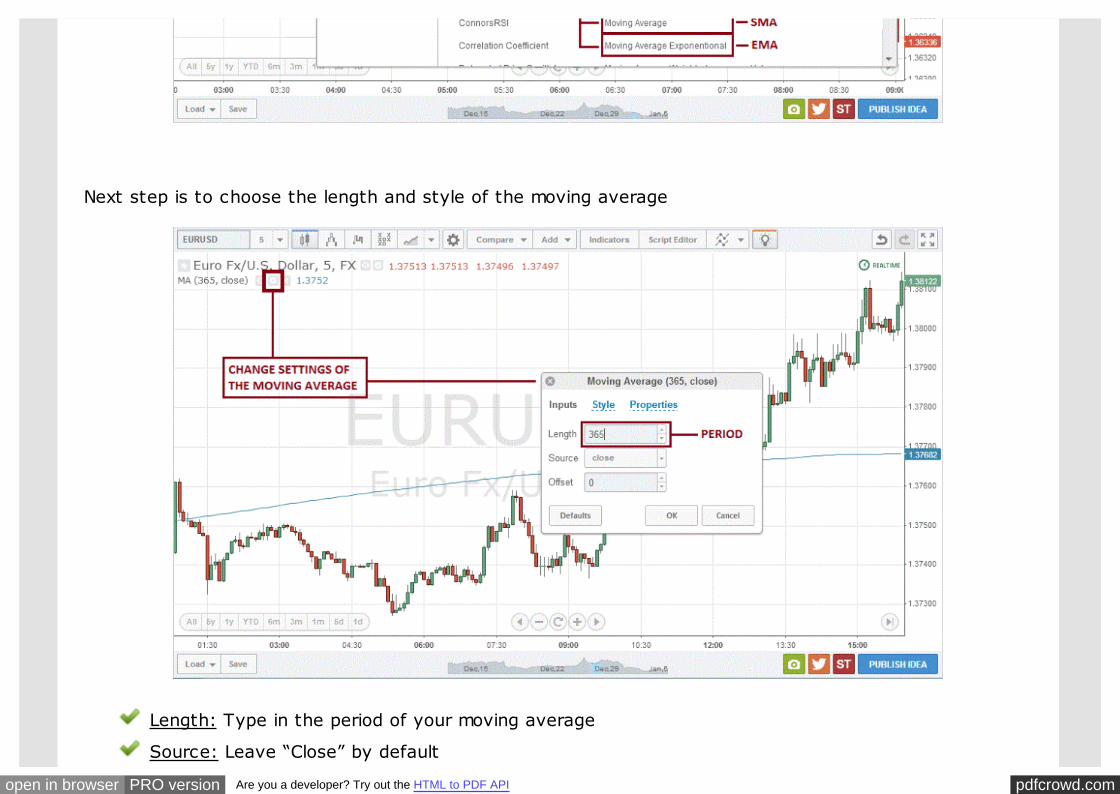
Next step is to choose the length and style of the moving average
Length: Type in the period of your moving average
Source: Leave “Close” by default
pdfcrowd.comopen in browser PRO version Are you a developer? Try out the HTML to PDF API
Style: Choose any color
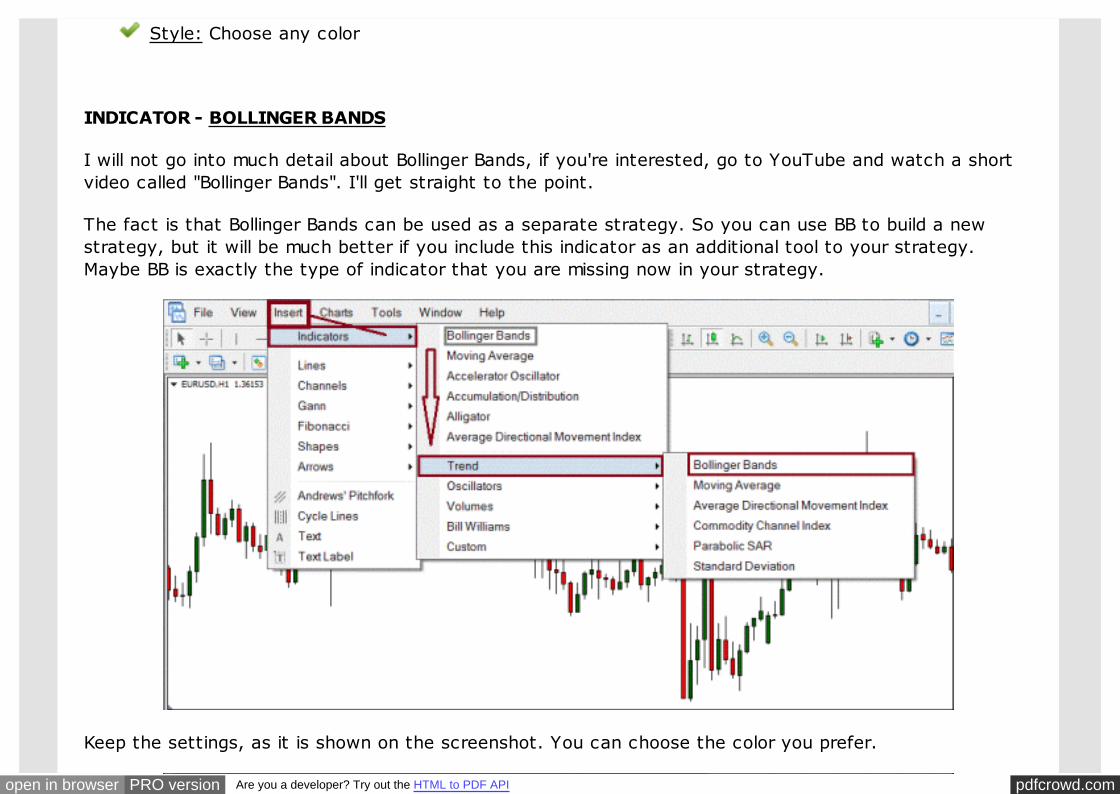
INDICATOR - BOLLINGER BANDS
I will not go into much detail about Bollinger Bands, if you're interested, go to YouTube and watch a shortvideo called "Bollinger Bands". I'll get straight to the point.
The fact is that Bollinger Bands can be used as a separate strategy. So you can use BB to build a newstrategy, but it will be much better if you include this indicator as an additional tool to your strategy.Maybe BB is exactly the type of indicator that you are missing now in your strategy.
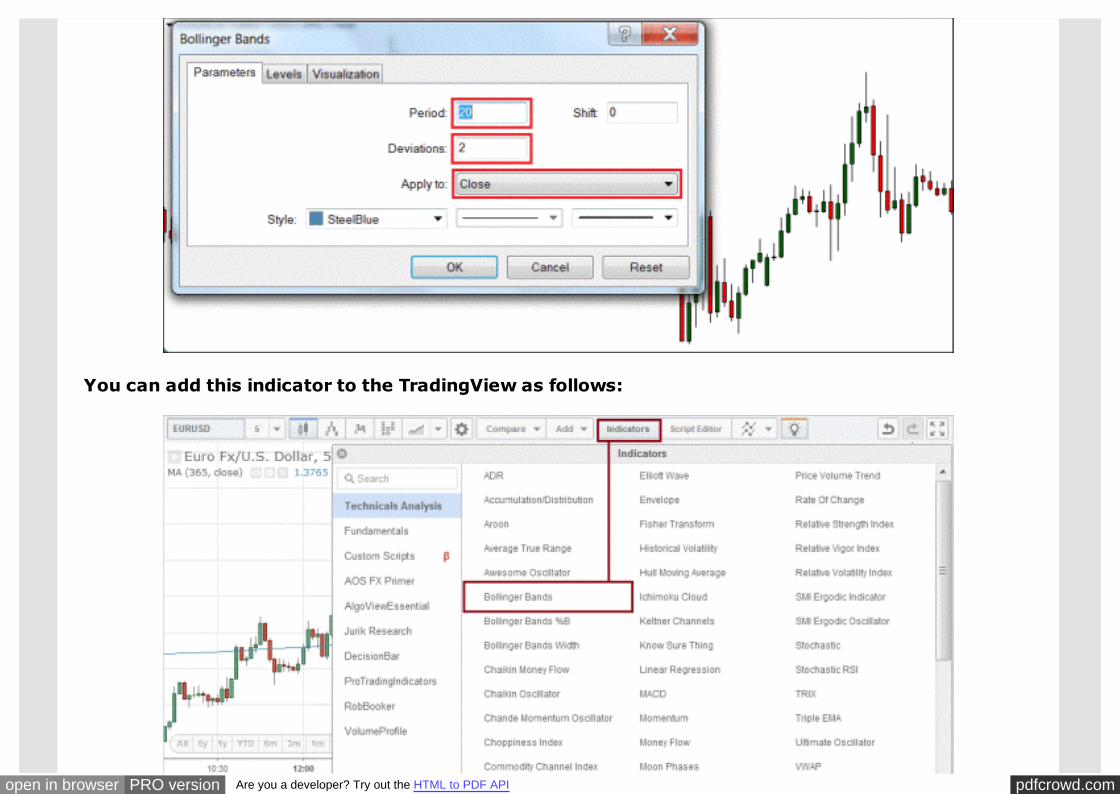
Keep the settings, as it is shown on the screenshot. You can choose the color you prefer.
pdfcrowd.comopen in browser PRO version Are you a developer? Try out the HTML to PDF API
You can add this indicator to the TradingView as follows:
pdfcrowd.comopen in browser PRO version Are you a developer? Try out the HTML to PDF API
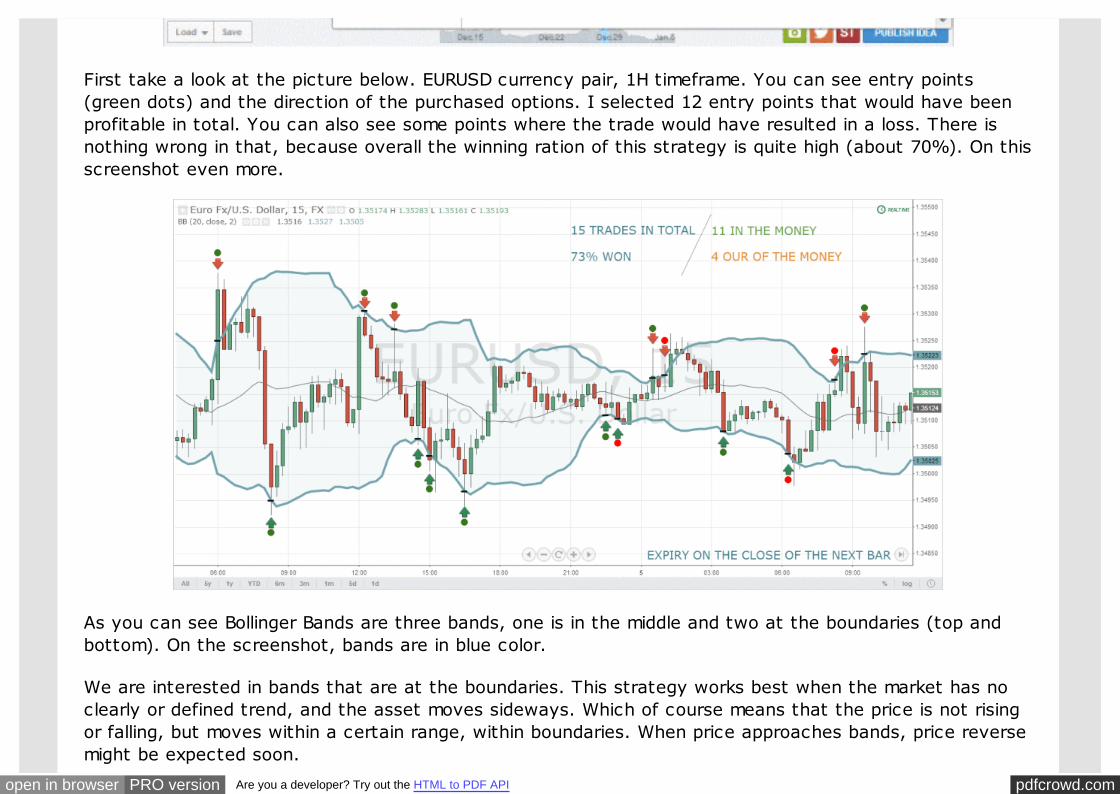
First take a look at the picture below. EURUSD currency pair, 1H timeframe. You can see entry points(green dots) and the direction of the purchased options. I selected 12 entry points that would have beenprofitable in total. You can also see some points where the trade would have resulted in a loss. There isnothing wrong in that, because overall the winning ration of this strategy is quite high (about 70%). On thisscreenshot even more.
As you can see Bollinger Bands are three bands, one is in the middle and two at the boundaries (top andbottom). On the screenshot, bands are in blue color.
We are interested in bands that are at the boundaries. This strategy works best when the market has noclearly or defined trend, and the asset moves sideways. Which of course means that the price is not risingor falling, but moves within a certain range, within boundaries. When price approaches bands, price reversemight be expected soon.

pdfcrowd.comopen in browser PRO version Are you a developer? Try out the HTML to PDF API
In this strategy, we are not looking for patterns (such as Pinocchio, Doji) or sizes of candles. We are justfollow the price once it comes very close or touches upper or lower bands. When that happens we buy anoption with an expiry time at the close of next candle. This expiration time is good for currency pairs, butfor other assets like gold it might require more time for the price to reverse. If the price approaches theupper band - we buy a PUT option, if lower band - it’s a CALL option.
To clarify the time for buying an option: for example you are working on the chart with a 30min timeframe.At 11:20 the price crossed the upper Bollinger band. You need to buy a PUT option with expiration time12:00 . I hope it’s clear.
INDICATOR – STOCHASTIC OSCILLATOR
The following indicator that deserves attention is the so-called stochastic or stochastic oscillator. We don'tuse this indicator on its own for trading binary options, but surely we can use it as an additional filter.
I won't go explain who invented it and what is the algorithm behind it. Anyone interested can easily findthis information online. I will tell you what to look for when using this indicator.
Stochastic tells us about oversold or overbought market condition. If the market is overbought - price willfall, if the market is oversold - price will rise. This indicator parameters vary from 0 to 100. To see how itworks, first, apply this indicator to the chart. In the Metatrader 4 trading terminal it can be done asfollows:
pdfcrowd.comopen in browser PRO version Are you a developer? Try out the HTML to PDF API
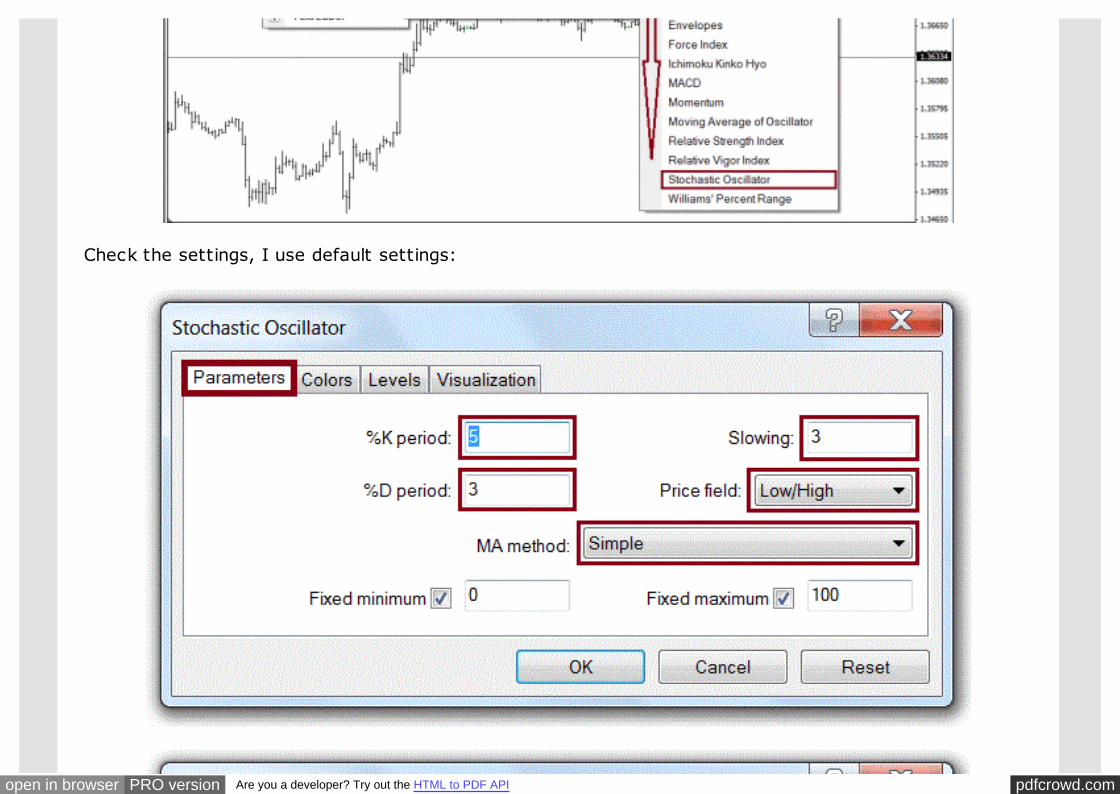
Check the settings, I use default settings:
pdfcrowd.comopen in browser PRO version Are you a developer? Try out the HTML to PDF API
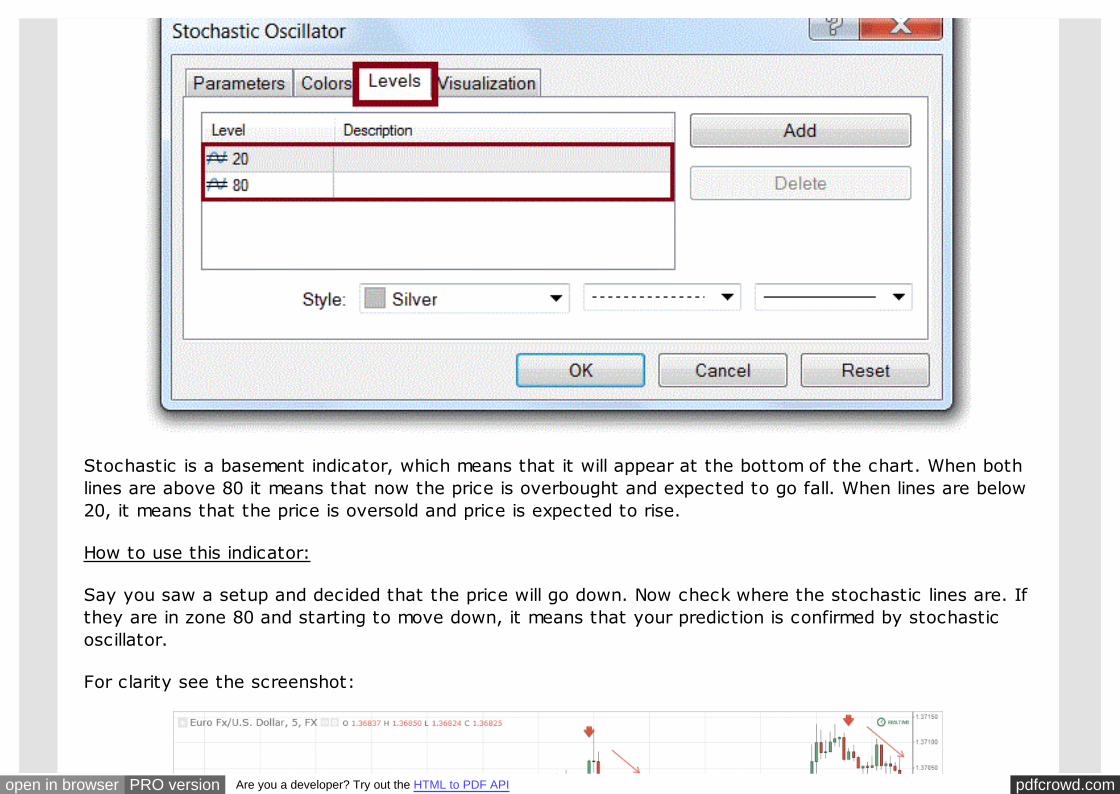
Stochastic is a basement indicator, which means that it will appear at the bottom of the chart. When bothlines are above 80 it means that now the price is overbought and expected to go fall. When lines are below20, it means that the price is oversold and price is expected to rise.
How to use this indicator:
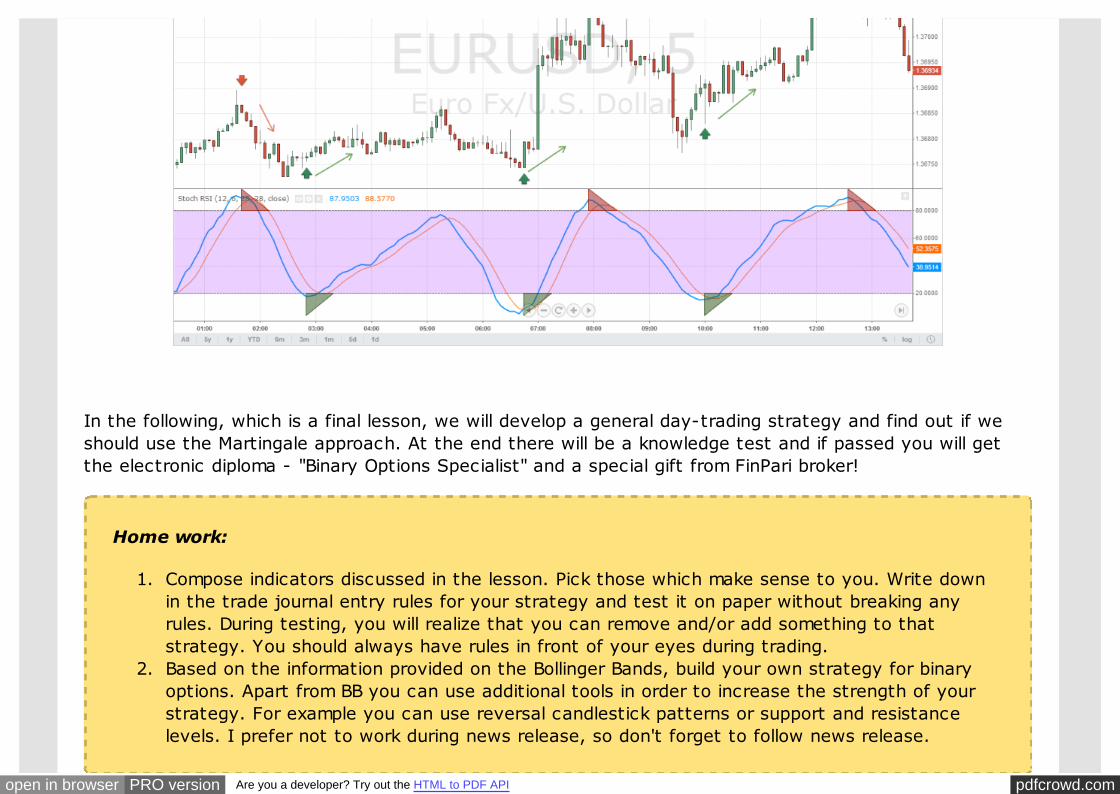
Say you saw a setup and decided that the price will go down. Now check where the stochastic lines are. Ifthey are in zone 80 and starting to move down, it means that your prediction is confirmed by stochasticoscillator.
For clarity see the screenshot:
pdfcrowd.comopen in browser PRO version Are you a developer? Try out the HTML to PDF API
In the following, which is a final lesson, we will develop a general day-trading strategy and find out if weshould use the Martingale approach. At the end there will be a knowledge test and if passed you will getthe electronic diploma - "Binary Options Specialist" and a special gift from FinPari broker!
Home work:
1. Compose indicators discussed in the lesson. Pick those which make sense to you. Write downin the trade journal entry rules for your strategy and test it on paper without breaking anyrules. During testing, you will realize that you can remove and/or add something to thatstrategy. You should always have rules in front of your eyes during trading.
2. Based on the information provided on the Bollinger Bands, build your own strategy for binaryoptions. Apart from BB you can use additional tools in order to increase the strength of yourstrategy. For example you can use reversal candlestick patterns or support and resistancelevels. I prefer not to work during news release, so don't forget to follow news release.
pdfcrowd.comopen in browser PRO version Are you a developer? Try out the HTML to PDF API
Want to know more? Subscribe to my YouTube channel, where I publish useful videoexamples, how to trade binary options.
Sincerely,
Abe CofnasProfessional trader